aiea eval 13-14 - hawaii doeaiea-moanalua-radford complex area evaluation 2013-14 creating change,...
TRANSCRIPT
C r e a t i n g C h a n g e , I n c .
Aiea-‐Moanalua-‐Radford Complex Evaluation 2013-‐14
Fall
08 Fall

Aiea-Moanalua-Radford Complex Area Evaluation 2013-14
Creating Change, Inc.
In 2012-13, the Aiea-Moanalua-Radford Complex Area school district was awarded one of sixteen 21st CCLC grants in Hawaii to serve the students in two of their schools: Aiea Elementary School and Scott Elementary School.
This report summarizes the data provided in OSTLMS for the 2013-2014 program year. This summary
describes the characteristics of the Aiea-Moanalua-Radford Complex Area programs in alignment with the federal and State of BIE priorities of the program which include:
• Academic Enrichment • Enhancement • Family Programming
Findings:
1. Student Participation:
a. The Aiea-Moanalua-Radford Complex Area program served 297 students. b. 32.66 % of the students who attended the program became regular program
participants.
2. Academic Progress:
a. The majority of regular program participants who maintained or improved their classroom academic and behavior performance greatly out performed those who did not.
b. The majority of the established objectives were either met or within a marginal percentage of completion.

Aiea-Moanalua-Radford Complex Area Evaluation 2013-14
Creating Change, Inc.
The Aiea-Moanalua-Radford Complex Area’s 21st Century Community Learning Centers (21st CCLC) program is funded by the U.S. Department of Education (USDE) under Title IV, Part B, of the No Child Left Behind Act (NCLB), Public Law 107-110. The purpose of the 21st CCLC is to offer students and their families opportunities for academic and cultural enrichment and to assist students in meeting state academic standards in
core subjects.
Federal legislation requires a comprehensive evaluation of the effectiveness of the state’s 21st CCLC. The Aiea-Moanalua-Radford Complex Area contracted with Creating Change, Inc. to fulfill this legislative requirement. This report reviews data from Creating Change’s Out-of-School Time Leadership Management System (OSTLMS) and achievement data provided from Aiea-Moanalua-Radford Complex Area 21st CCLC grantees and centers, identifies their progress on the Department of Education’s performance objectives, and proposes recommendations for the next steps in the program’s continued improvement. This evaluation summarizes information on populations served, services provided, and program outputs to establish whether the Aiea-Moanalua-Radford Complex Area is meeting the performance measures set by Aiea-Moanalua-Radford Complex Area grant, the state and the USDE.
The report is divided into seven sections:
§ Section I, Introduction, providing a general overview § Section II, Background, describes the legislation, funding structure, grant competition,
monitoring strategies, program designs and technical assistance of the Aiea-Moanalua-Radford Complex Area’s 21st Century Community Learning Centers Program.
§ Section III, Student Characteristics, provides an extensive review of the students that were targeted and involved in the 21st CCLC program.
§ Section III, Program Characteristics, provides a description of the grantees’ general characteristics and activities.
§ Section IV, Student Performance, describes various performance measures reviewed in relation with the Aiea-Moanalua-Radford Complex Area 21st CCLC program.
§ Section V, Findings, presents the data on Aiea-Moanalua-Radford Complex Area 21st CCLC centers’ progress on the Aiea-Moanalua-Radford Complex Area’s performance objectives.
§ Section VI, Recommendations, suggests the next steps for the Aiea-Moanalua-Radford Complex Area 21st CCLC in terms of future goals and continuous improvement.

Aiea-Moanalua-Radford Complex Area Evaluation 2013-14
Creating Change, Inc.
Legislation
The original purpose of the 21st Century Community Learning Centers (21st CCLC), first authorized as a national program in 1996, was to provide grants to schools or local education agencies for the establishment of community centers to keep children safe during after-school hours. The program was
reauthorized under the No Child Left Behind Act of 2001 with important modifications. First, the Act increases the emphasis on academics and “whenever possible, the use of activities that are based on rigorous scientific research.” Second, the Act transfers the program administration from

Aiea-Moanalua-Radford Complex Area Evaluation 2013-14
Creating Change, Inc.
the Federal to State level, expands program eligibility to community-based organizations, and underscores the role of program evaluation and accountability.
Funding
The primary funding source for the 21st Century Community Learning Centers Programs is the Federal government, U.S. Department of Education, through a grant of more than $5,643,199 to the State of Hawaii. Some schools received supplementary support from other sources. Most often, the school that the 21st CCLC served provided some additional support in the form of transportation and/or other funding or in-kind services. Many programs received funding for snacks through a grant from the U.S. Department of Agriculture. Some schools use other title funds to help support their afterschool programs.
Department of Education Performance Measures
The program goal established by the US Department of Education is: To establish community learning centers that help students in high-poverty, low-performing schools meet academic achievement standards; to offer a broad array of additional services designed to complement the regular academic program; and to offer families of students’ opportunities for educational development. Objective 1 of 3 is: Participants in 21st Century Community Learning Center will demonstrate educational and social benefits and exhibit positive behavioral changes. Objective 2 of 3 is: 21st Century Community Learning Centers will offer high-quality enrichment opportunities that positively affect student outcomes such as school attendance and academic performance, and result in decreased disciplinary actions or other adverse behaviors. Objective 3 of 3 is: Improve the operational efficiency of the program. This evaluation is concerned with objectives one and two.
Program Description
A. Origin of the program
Where was the program implemented? What sort of community? How many people did it affect?
At the beginning of School Year 2013-14, Aiea-Moanalua-Radford Complex Area Complex Area continued a 21st Century Community Learning Centers Grant application. The application entitled “Child and Family Enrichment (CAFÉ) Project” sought to offer comprehensive after-school support in five schools. In the Fall of 2011, Aiea-Moanalua-Radford Complex Area Complex Area was awarded the grant.
Continuance of the grant began in summer of 2013 in two schools: Aiea Elementary and Scott Elementary. Both are Title I schools. Approximately 287 students in total participated in these programs. A school in the original proposal, Aiea High School, opted to not implement the program.
Aiea-Moanalua-Radford Complex Area Evaluation 2013-14
Creating Change, Inc.
Project CAFÉ provides intensive academic support, engaging enrichment activities, and family involvement activities in a safe and supervised after-school environment dedicated to boosting student success in school. The cornerstone of the project is the LitART Learn Curriculum that combines award winning children’s literature with innovative reading, writing, math, drama, and art response activities aligned with the Common Core State Standards. In addition to LitART, homework support is provided along with recreation and other enrichment activities.
B. Goals of the program:
What was the program designed to accomplish?
The program was designed to deliver after-school, intersession, and summer support to students at two Title I schools.
What goals or objectives were set? What was their order of priority, if any?
Three performance goals were established to measure progress as follows:
(1) For students who attend the program for 30 or more days, maintain or increase the percentage who show increases in reading and math as measured by the report card grades.
(2) For students who attend the program for 30 or more days, maintain or increase the percentage who receive passing marks in reading and English as measured by the Hawaii State Assessment.
(3) For students who attend the program for 30 or more days, maintain or increase the percentage who are rated as improving on the APR performance measures as measured by the 21st CCLC Annual Performance Report (APR) Teacher Survey.
C. Clients involved in the program:
What are the characteristics of the intended clients of the program (e.g., age, socioeconomic status, experience, special needs, and ability level)?
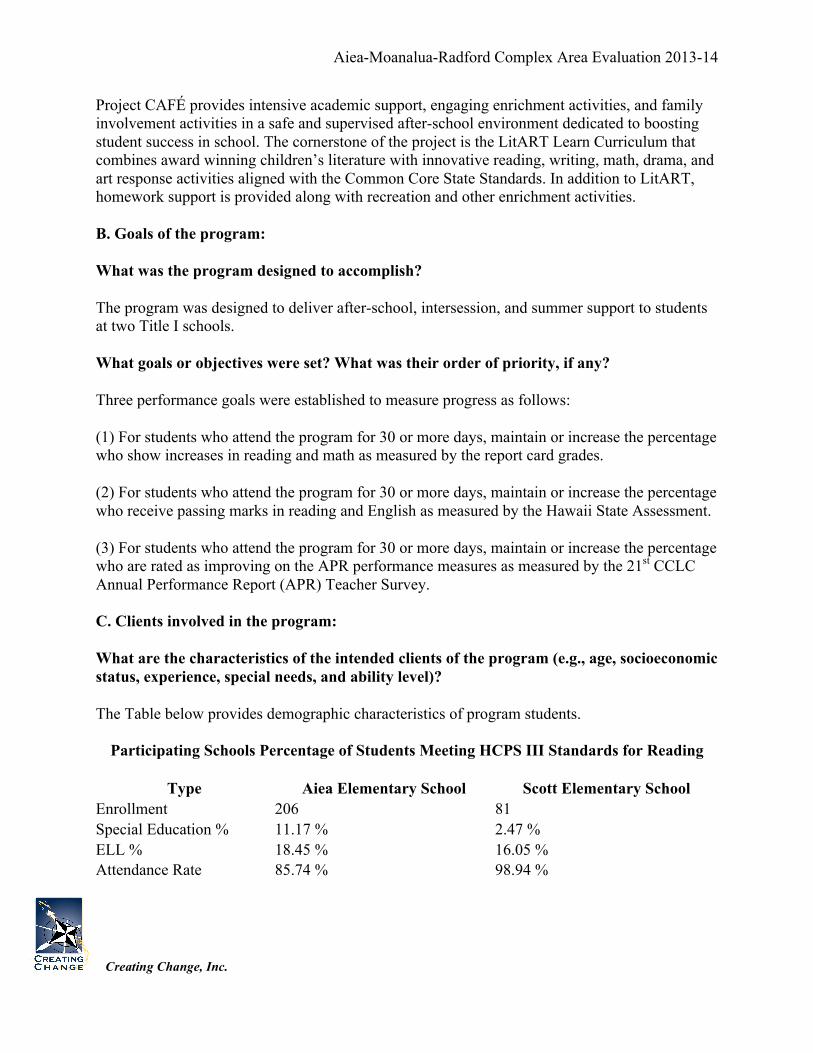
The Table below provides demographic characteristics of program students.
Participating Schools Percentage of Students Meeting HCPS III Standards for Reading
Type Aiea Elementary School Scott Elementary School Enrollment 206 81 Special Education % 11.17 % 2.47 % ELL % 18.45 % 16.05 % Attendance Rate 85.74 % 98.94 %
Aiea-Moanalua-Radford Complex Area Evaluation 2013-14
Creating Change, Inc.
D. Characteristics of the program materials and resources:
How was the program administered?
A Project Director from the Aiea-Moanalua-Radford Complex Area Complex Area office served as the administrator for the program. She was assisted by a Project Coordinator from the same office. The Complex Area Business Manager and Office Assistant II supported the Project Director in fiscal matters (e.g., payroll, contracts, purchasing).
E. Staff and others involved in the program:
How many specific personnel such as administrators, consultants, teachers, specialists, volunteers or others were active in the program? What roles did they assume?
Program staff included 11 personnel at the Complex Area level and school sites as follows:
Title School Year Paid
School Year Volunteer
Summer Program Paid
Summer Program Volunteer
School-day teachers (whether in host school or other school; include former and substitute teachers)
4 0 7 10
College students 3 0 2 0 High school students 0 0 0 0 Parents 0 0 0 0 Center Administrators/Coordinators
2 0 2 0
Other �on-school-day staff with some or no college
2 0 3 0
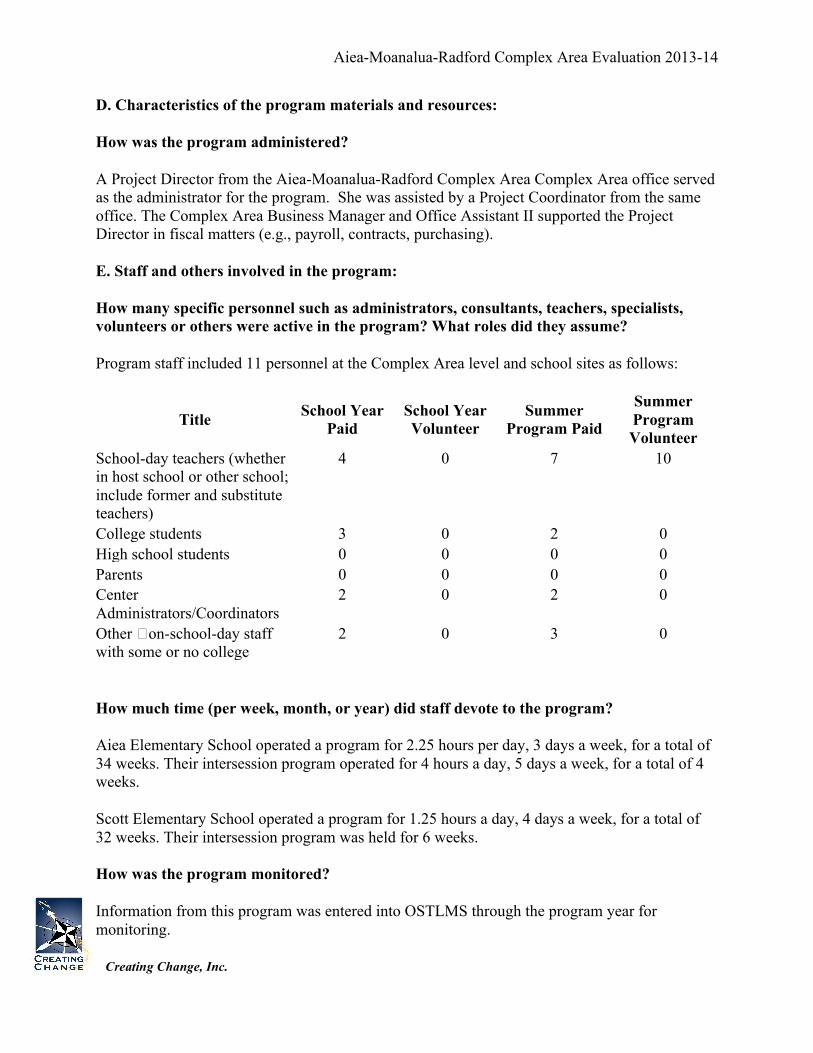
How much time (per week, month, or year) did staff devote to the program?
Aiea Elementary School operated a program for 2.25 hours per day, 3 days a week, for a total of 34 weeks. Their intersession program operated for 4 hours a day, 5 days a week, for a total of 4 weeks.
Scott Elementary School operated a program for 1.25 hours a day, 4 days a week, for a total of 32 weeks. Their intersession program was held for 6 weeks.
How was the program monitored?
Information from this program was entered into OSTLMS through the program year for monitoring.

Aiea-Moanalua-Radford Complex Area Evaluation 2013-14
Creating Change, Inc.
Which individuals and organizations did you develop partnerships with for 21st CCLC activities? What were the purpose and nature of these partnerships?
Each school provided in-kind contributions in terms of classroom facilities and other resources. The Complex Area office personnel provided much support and technical assistance at no cost. School Food Services partnered with Aiea Elementary to provide snack services to students.
Program Goals
· Participating students will exceed or attain proficiency in reading and mathematics.
· All students will graduate from high school.
Student & Program Characteristics
Aiea-Moanalua-Radford Complex Area 21st CCLC Centers served 287 program participants during the 2013-14 program year, with 97 regular program participants or 37%. The schools that served these students included two elementary schools, representing students from kindergarten through eighth grade. The demographic breakdown of the student population served is included in the graphs below.

Aiea-Moanalua-Radford Complex Area Evaluation 2013-14
Creating Change, Inc.
Students mostly represented Asian/Pacific Islander ethnicity, with a scattering of other ethnicities represented in each of the two schools.
Seventy-six (more than one fourth) of the students targeted by Aiea-Moanalua-Radford Complex Area 21st CCLC Centers represented LEP and Special Needs students within the schools represented. Given the focus of the 21st CCLC program to represent students in need, this statistic demonstrates Aiea-Moanalua-Radford Complex Area’s effort toward that end.
When the socio-economic data of program participants are reviewed, it shows a clear focus on students in risk categories at the schools in the Aiea-Moanalua-Radford Complex Area. This demonstrates the program’s dedicated service of those increased risk students in program schools, one of the federal priorities of the 21st CCLC program.

Aiea-Moanalua-Radford Complex Area Evaluation 2013-14
Creating Change, Inc.
One of the most important statistics found within 21st
CCLC programs is the number of regular program participants. The federal definition of regular program participant is 30 days, representing the full extent of the definition. This definition applies regardless of how long a student attends in a given day. This data shows the frequency of exposure that the student has to the quality program being offered.
Another measure of frequency is the percentage attended of program time offered. This is measured as students who attend more than 50% of the provided program time, in part demonstrating the desire of students to attend. The next section of data will review the programming offered during the program day, and the relative attendance rates in each program. This data demonstrates far more clearly the programming most desired by students and relative desire of students to regularly attend the program at their school.

Aiea-Moanalua-Radford Complex Area Evaluation 2013-14
Creating Change, Inc.
The table below shows the number of students who enrolled in the programming offered at each location. This not only demonstrates programming popularity, but also demonstrates the variety of programming offered. A review of the data shows that a high percentage of students attended a majority of the programming offered.
Center Name Course Name No. of Students enrolled Aiea Elementary School Summer Computer K-3 82 Aiea Elementary School Summer Computer 4-7 63 Aiea Elementary School Summer STEM 145 Aiea Elementary School Summer LitART MWF 145 Aiea Elementary School Summer LitART T K-3 82 Aiea Elementary School Summer LitART T 4-7 63 Aiea Elementary School Summer LitART Th K-3 82 Aiea Elementary School Summer LitART Th 4-7 63 Aiea Elementary School MTh Homework 68 Aiea Elementary School MTh LitART 68 Aiea Elementary School F LitART 68 Aiea Elementary School F Enrichment 68 Aiea Elementary School WinterLitART 70 Scott Elementary School Summer LitART 42 Scott Elementary School Summer Nutrition 42 Scott Elementary School Summer PE 42 Scott Elementary School Summer Science/Social Studies 42 Scott Elementary School Summer Computer 42 Scott Elementary School Summer Art 42 Scott Elementary School Computer 55 Scott Elementary School LitART 55 Scott Elementary School Physical Fitness 55 Scott Elementary School Art/Homework 55 Scott Elementary School Fall Computer 29

Aiea-Moanalua-Radford Complex Area Evaluation 2013-14
Creating Change, Inc.
Center Name Course Name No. of Students enrolled Scott Elementary School Fall Physical Fitness 29 Scott Elementary School Fall Health/Nutrition 29 Scott Elementary School Fall Science 29 Scott Elementary School Fall LitART 29 Scott Elementary School Individual Fitness/ FFIRE 10
Scott Elementary School Spring Intersession Math Application 10
Scott Elementary School Spring Intersession Nutrition 10 Scott Elementary School Spring Intersession PE 10
Scott Elementary School Spring Intersession Imagine Learning 10
Scott Elementary School Spring Intersession Art 10 Scott Elementary School Read Aloud Celebration 0
The table below shows the average number of days attended by students in each course offered. A review of this data shows that certain courses were responsible for creating regular program participants while others were short term supplemental programs.
Center Name Course Name Average number of days attended by Students
Scott Elementary School Summer LitART 19.38 Scott Elementary School Summer Nutrition 19.38 Scott Elementary School Summer PE 19.43 Scott Elementary School Summer Science/Social Studies 19.38 Scott Elementary School Summer Computer 18.38 Scott Elementary School Summer Art 19.55 Aiea Elementary School Summer Computer K-3 3.56 Aiea Elementary School Summer Computer 4-7 2.79 Aiea Elementary School Summer STEM 10.57 Aiea Elementary School Summer LitART MWF 10.59 Aiea Elementary School Summer LitART T K-3 3.56 Aiea Elementary School Summer LitART T 4-7 3.73 Aiea Elementary School Summer LitART Th K-3 2.77 Aiea Elementary School Summer LitART Th 4-7 2.79 Aiea Elementary School MTh Homework 25.71 Aiea Elementary School MTh LitART 25.72 Aiea Elementary School F LitART 11.28 Aiea Elementary School F Enrichment 11.26 Scott Elementary School Computer 81.89 Scott Elementary School LitART 57.98 Scott Elementary School Physical Fitness 57.91

Aiea-Moanalua-Radford Complex Area Evaluation 2013-14
Creating Change, Inc.
Center Name Course Name Average number of days attended by Students
Scott Elementary School Art/Homework 20.45 Scott Elementary School Fall Computer 3.76 Scott Elementary School Fall Physical Fitness 3.76 Scott Elementary School Fall Health/Nutrition 3.76 Scott Elementary School Fall Science 3.76 Scott Elementary School Fall LitART 3.76 Aiea Elementary School WinterLitART 5.76 Scott Elementary School Individual Fitness/ FFIRE 4
Scott Elementary School Spring Intersession Math Application 3.7
Scott Elementary School Spring Intersession Nutrition 3.7 Scott Elementary School Spring Intersession PE 3.7
Scott Elementary School Spring Intersession Imagine Learning 3.7
Scott Elementary School Spring Intersession Art 3.7 Scott Elementary School Read Aloud Celebration N/A
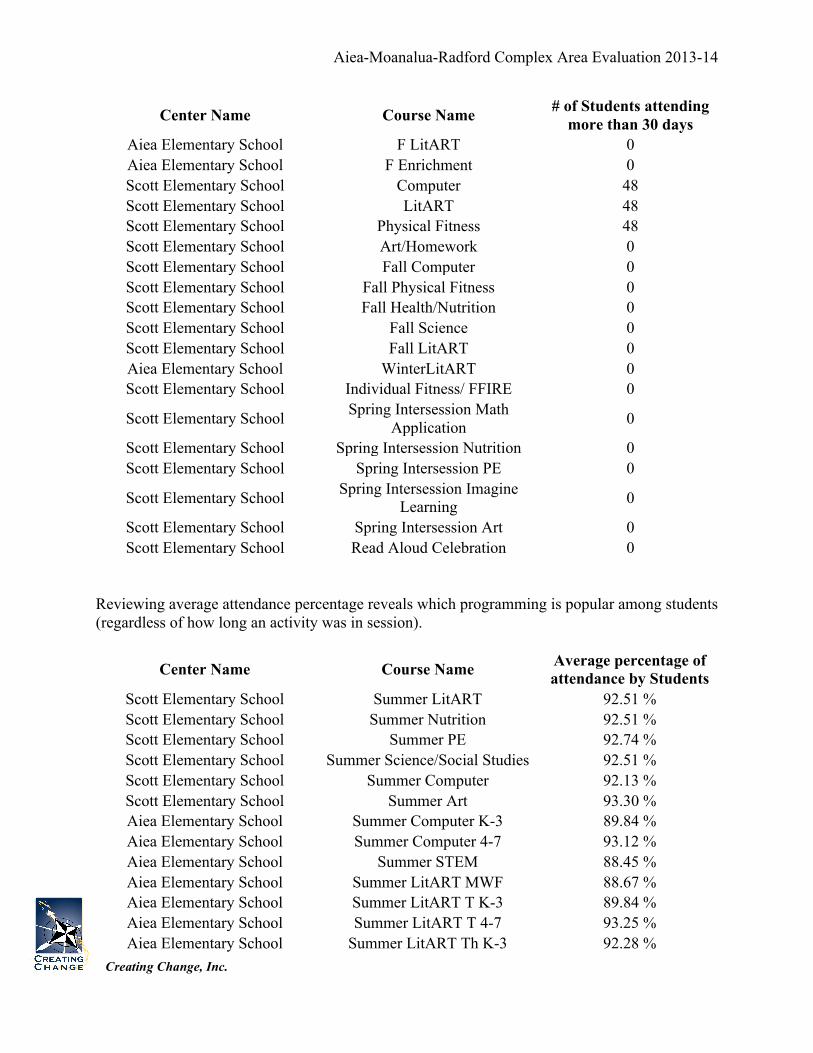
The next table demonstrates the number of students who attended programs, who attended more than 30 days. A review of this data shows which programs were most heavily attended with the greatest rate of frequency. It must be noted that some of these programs ran for fewer than 30 days.
Center Name Course Name # of Students attending more than 30 days
Scott Elementary School Summer LitART 0 Scott Elementary School Summer Nutrition 0 Scott Elementary School Summer PE 0 Scott Elementary School Summer Science/Social Studies 0 Scott Elementary School Summer Computer 0 Scott Elementary School Summer Art 0 Aiea Elementary School Summer Computer K-3 0 Aiea Elementary School Summer Computer 4-7 0 Aiea Elementary School Summer STEM 0 Aiea Elementary School Summer LitART MWF 0 Aiea Elementary School Summer LitART T K-3 0 Aiea Elementary School Summer LitART T 4-7 0 Aiea Elementary School Summer LitART Th K-3 0 Aiea Elementary School Summer LitART Th 4-7 0 Aiea Elementary School MTh Homework 36 Aiea Elementary School MTh LitART 36
Aiea-Moanalua-Radford Complex Area Evaluation 2013-14
Creating Change, Inc.
Center Name Course Name # of Students attending more than 30 days
Aiea Elementary School F LitART 0 Aiea Elementary School F Enrichment 0 Scott Elementary School Computer 48 Scott Elementary School LitART 48 Scott Elementary School Physical Fitness 48 Scott Elementary School Art/Homework 0 Scott Elementary School Fall Computer 0 Scott Elementary School Fall Physical Fitness 0 Scott Elementary School Fall Health/Nutrition 0 Scott Elementary School Fall Science 0 Scott Elementary School Fall LitART 0 Aiea Elementary School WinterLitART 0 Scott Elementary School Individual Fitness/ FFIRE 0
Scott Elementary School Spring Intersession Math Application 0
Scott Elementary School Spring Intersession Nutrition 0 Scott Elementary School Spring Intersession PE 0
Scott Elementary School Spring Intersession Imagine Learning 0
Scott Elementary School Spring Intersession Art 0 Scott Elementary School Read Aloud Celebration 0
Reviewing average attendance percentage reveals which programming is popular among students (regardless of how long an activity was in session).
Center Name Course Name Average percentage of attendance by Students
Scott Elementary School Summer LitART 92.51 % Scott Elementary School Summer Nutrition 92.51 % Scott Elementary School Summer PE 92.74 % Scott Elementary School Summer Science/Social Studies 92.51 % Scott Elementary School Summer Computer 92.13 % Scott Elementary School Summer Art 93.30 % Aiea Elementary School Summer Computer K-3 89.84 % Aiea Elementary School Summer Computer 4-7 93.12 % Aiea Elementary School Summer STEM 88.45 % Aiea Elementary School Summer LitART MWF 88.67 % Aiea Elementary School Summer LitART T K-3 89.84 % Aiea Elementary School Summer LitART T 4-7 93.25 % Aiea Elementary School Summer LitART Th K-3 92.28 %

Aiea-Moanalua-Radford Complex Area Evaluation 2013-14
Creating Change, Inc.
Center Name Course Name Average percentage of attendance by Students
Aiea Elementary School Summer LitART Th 4-7 93.12 % Aiea Elementary School MTh Homework 81.29 % Aiea Elementary School MTh LitART 81.59 % Aiea Elementary School F LitART 75.84 % Aiea Elementary School F Enrichment 75.76 % Scott Elementary School Computer 100.00 % Scott Elementary School LitART 94.33 % Scott Elementary School Physical Fitness 94.24 % Scott Elementary School Art/Homework 94.70 % Scott Elementary School Fall Computer 93.97 % Scott Elementary School Fall Physical Fitness 93.97 % Scott Elementary School Fall Health/Nutrition 93.97 % Scott Elementary School Fall Science 93.97 % Scott Elementary School Fall LitART 93.97 % Aiea Elementary School WinterLitART 73.95 % Scott Elementary School Individual Fitness/ FFIRE 100.00 %
Scott Elementary School Spring Intersession Math Application 92.50 %
Scott Elementary School Spring Intersession Nutrition 92.50 % Scott Elementary School Spring Intersession PE 92.50 %
Scott Elementary School Spring Intersession Imagine Learning 92.50 %
Scott Elementary School Spring Intersession Art 92.50 % Scott Elementary School Read Aloud Celebration N/A
The number of activities, whose attended reached 50% or more, further reveals the popularity of the programs offered.
Center Name Course Name # of Students attending more than 50%
Scott Elementary School Summer LitART 42 Scott Elementary School Summer Nutrition 42 Scott Elementary School Summer PE 42 Scott Elementary School Summer Science/Social Studies 42 Scott Elementary School Summer Computer 42 Scott Elementary School Summer Art 42 Aiea Elementary School Summer Computer K-3 78 Aiea Elementary School Summer Computer 4-7 62

Aiea-Moanalua-Radford Complex Area Evaluation 2013-14
Creating Change, Inc.
Center Name Course Name # of Students attending more than 50%
Aiea Elementary School Summer STEM 140 Aiea Elementary School Summer LitART MWF 140 Aiea Elementary School Summer LitART T K-3 78 Aiea Elementary School Summer LitART T 4-7 59 Aiea Elementary School Summer LitART Th K-3 81 Aiea Elementary School Summer LitART Th 4-7 62 Aiea Elementary School MTh Homework 63 Aiea Elementary School MTh LitART 63 Aiea Elementary School F LitART 61 Aiea Elementary School F Enrichment 61 Scott Elementary School Computer 55 Scott Elementary School LitART 55 Scott Elementary School Physical Fitness 55 Scott Elementary School Art/Homework 55 Scott Elementary School Fall Computer 27 Scott Elementary School Fall Physical Fitness 27 Scott Elementary School Fall Health/Nutrition 27 Scott Elementary School Fall Science 27 Scott Elementary School Fall LitART 27 Aiea Elementary School WinterLitART 54 Scott Elementary School Individual Fitness/ FFIRE 10
Scott Elementary School Spring Intersession Math Application 9
Scott Elementary School Spring Intersession Nutrition 9 Scott Elementary School Spring Intersession PE 9
Scott Elementary School Spring Intersession Imagine Learning 9
Scott Elementary School Spring Intersession Art 9 Scott Elementary School Read Aloud Celebration 0
This chart demonstrates categories, activity types, and subjects offered.
Center Name Course Name Category Activity Subjects
Scott Elementary School Summer LitART Academic
Academic Enrichment
Learning Programs
Reading / Literacy

Aiea-Moanalua-Radford Complex Area Evaluation 2013-14
Creating Change, Inc.
Center Name Course Name Category Activity Subjects
Scott Elementary School Summer Nutrition Enrichment Recreational
Activities Health / Nutrition
Scott Elementary School Summer PE Enrichment Recreational
Activities Health / Nutrition
Scott Elementary School
Summer Science/Social Studies Academic
Academic Enrichment
Learning Programs
Scott Elementary School Summer Computer Academic
Academic Enrichment
Learning Programs
Scott Elementary School Summer Art Enrichment Recreational
Activities Arts and Music
Aiea Elementary School
Summer Computer K-3 Enrichment
Academic Enrichment
Learning Programs
Aiea Elementary School Summer Computer 4-7 Enrichment
Academic Enrichment
Learning Programs
Aiea Elementary School Summer STEM Enrichment
Academic Enrichment
Learning Programs
Science
Aiea Elementary School
Summer LitART MWF Academic
Academic Enrichment
Learning Programs
Reading / Literacy
Aiea Elementary School
Summer LitART T K-3 Academic
Academic Enrichment
Learning Programs
Reading / Literacy
Aiea Elementary School Summer LitART T 4-7 Academic
Academic Enrichment
Learning Programs
Reading / Literacy
Aiea Elementary School
Summer LitART Th K-3 Academic
Academic Enrichment
Learning Programs
Reading / Literacy
Aiea Elementary Summer LitART Th 4- Academic Academic Reading /

Aiea-Moanalua-Radford Complex Area Evaluation 2013-14
Creating Change, Inc.
Center Name Course Name Category Activity Subjects
School 7 Enrichment Learning Programs
Literacy
Aiea Elementary School MTh Homework Academic Homework Help
Aiea Elementary School MTh LitART Academic
Academic Enrichment
Learning Programs
Reading / Literacy
Aiea Elementary School F LitART Academic
Academic Enrichment
Learning Programs
Reading / Literacy
Aiea Elementary School F Enrichment Enrichment Recreational
Activities
Scott Elementary School Computer Academic
Academic Enrichment
Learning Programs
Scott Elementary School LitART Academic
Academic Enrichment
Learning Programs
Reading / Literacy
Scott Elementary School Physical Fitness Enrichment Recreational
Activities Health / Nutrition
Scott Elementary School Art/Homework Academic Homework Help
Scott Elementary School Fall Computer Academic
Academic Enrichment
Learning Programs
Scott Elementary School Fall Physical Fitness Enrichment Recreational
Activities Health / Nutrition
Scott Elementary School Fall Health/Nutrition Enrichment Recreational
Activities Health / Nutrition
Scott Elementary School Fall Science Academic
Academic Enrichment
Learning Programs
Science
Scott Elementary School Fall LitART Academic
Academic Enrichment
Learning Programs
Reading / Literacy

Aiea-Moanalua-Radford Complex Area Evaluation 2013-14
Creating Change, Inc.
Center Name Course Name Category Activity Subjects
Aiea Elementary School WinterLitART Academic
Academic Enrichment
Learning Programs
Reading / Literacy
Scott Elementary School
Individual Fitness/ FFIRE Academic
Academic Enrichment
Learning Programs
Reading / Literacy
Scott Elementary School
Spring Intersession Math Application Academic
Academic Enrichment
Learning Programs
Mathematics
Scott Elementary School
Spring Intersession Nutrition Enrichment Recreational
Activities Health / Nutrition
Scott Elementary School Spring Intersession PE Enrichment Recreational
Activities Health / Nutrition
Scott Elementary School
Spring Intersession Imagine Learning Academic
Academic Enrichment
Learning Programs
Reading / Literacy
Scott Elementary School Spring Intersession Art Enrichment
Academic Enrichment
Learning Programs
Arts and Music
Scott Elementary School
Read Aloud Celebration
This last chart specifies the duration of the courses provided: per day, per week, and per year.
Center Name
Course Name Hrs-Mins/Day Days of Week Weeks Met
Scott Elementary School Summer LitART 1 hour M Tu W Th 5
Scott Elementary School Summer Nutrition 30 minutes M Tu W Th 5
Scott Elementary School Summer PE 30 minutes M Tu W Th 5
Scott Elementary School
Summer Science/Social Studies 1 hour M Tu W Th 5
Scott Elementary Summer Computer 30 minutes M Tu W Th 5

Aiea-Moanalua-Radford Complex Area Evaluation 2013-14
Creating Change, Inc.
Center Name
Course Name Hrs-Mins/Day Days of Week Weeks Met
School Scott Elementary
School Summer Art 30 minutes M Tu W Th 5
Aiea Elementary School Summer Computer K-3 1 hour Tu 4
Aiea Elementary School Summer Computer 4-7 1 hour Th 3
Aiea Elementary School Summer STEM 45 minutes M W F 4
Aiea Elementary School Summer LitART MWF 2 hours 45
minutes M W F 4
Aiea Elementary School Summer LitART T K-3 2 hours 30
minutes Tu 4
Aiea Elementary School Summer LitART T 4-7 3 hours 30
minutes Tu 4
Aiea Elementary School Summer LitART Th K-3 3 hours 30
minutes Th 3
Aiea Elementary School Summer LitART Th 4-7 2 hours 30
minutes Th 3
Aiea Elementary School MTh Homework 30 minutes M Th 21
Aiea Elementary School MTh LitART 1 hour 30 minutes M Th 20
Aiea Elementary School F LitART 1 hour F 19
Aiea Elementary School F Enrichment 1 hour F 19
Scott Elementary School Computer 30 minutes M Tu W Th 26
Scott Elementary School LitART 30 minutes M Tu Th 26
Scott Elementary School Physical Fitness 30 minutes M Tu Th 26
Scott Elementary School Art/Homework 30 minutes W 28
Scott Elementary School Fall Computer 45 minutes M Tu W Th 1
Scott Elementary School Fall Physical Fitness 30 minutes M Tu W Th 1
Scott Elementary School Fall Health/Nutrition 30 minutes M Tu W Th 1

Aiea-Moanalua-Radford Complex Area Evaluation 2013-14
Creating Change, Inc.
Center Name
Course Name Hrs-Mins/Day Days of Week Weeks Met
Scott Elementary School Fall Science 30 minutes M Tu W Th 1
Scott Elementary School Fall LitART 1 hour M Tu W Th 1
Aiea Elementary School WinterLitART 3 hours 30
minutes M Tu Th F 2
Scott Elementary School
Individual Fitness/ FFIRE 1 hour M Tu W Th 1
Scott Elementary School
Spring Intersession Math Application 30 minutes M Tu W Th 1
Scott Elementary School
Spring Intersession Nutrition 30 minutes M Tu W Th 1
Scott Elementary School Spring Intersession PE 30 minutes M Tu W Th 1
Scott Elementary School
Spring Intersession Imagine Learning 30 minutes M Tu W Th 1
Scott Elementary School Spring Intersession Art 1 hour M Tu W Th 1
Scott Elementary School Read Aloud Celebration 2 hours F 1

Aiea-Moanalua-Radford Complex Area Evaluation 2013-14
Creating Change, Inc.
The final element of review is the student performance data available for those students who attended 30 days or more of 21st CCLC programming.
Aiea Elementary School
(47 teacher surveys distributed, 47 returned)
Percent of students maintaining or improving school behaviors
(as observed by teachers) (increases in bold)
2012-13 2013-14 Turning in homework on time 95% 95.7% Completing homework to teacher’s satisfaction 97% 93.6% Participating in class 100% 97.9% Volunteering in class 100% 95.7% Attending class regularly 98% 97.9% Attentiveness in class 100% 89.4% Classroom behavior 100% 91.3% Academic performance 98% 100% Coming to school motivated to learn 100% 89.4% Getting along well with others 100% 91.5%
Scott Elementary School
(49 teacher surveys distributed, 40 returned)
Percent of students maintaining or improving school behaviors
(as observed by teachers) (increases in bold)
2012-13 2013-14 Turning in homework on time 87% 80% Completing homework to teacher’s satisfaction 84% 90% Participating in class 94% 92.5% Volunteering in class 95% 100% Attending class regularly 93% 95% Attentiveness in class 84% 92.5% Classroom behavior 90% 90% Academic performance 83% 92.5% Coming to school motivated to learn 91% 95% Getting along well with others 97% 97.5%

Aiea-Moanalua-Radford Complex Area Evaluation 2013-14
Creating Change, Inc.
Program Objectives Data and Notes
Increase the number of students meeting state reading and math standards at each of the participating schools Not Met, but progressed toward
• Aiea Elementary and Scott Elementary reading: decrease in number of students meeting state standards
• Aiea Elementary math: decrease in number of students meeting state standards
• Scott Elementary math: increase in number of students meeting state standards
Maintain or increase the percentage of regular program attendees who achieve proficiency in reading and math as measured by Hawaii State Assessment (HSA) proficiency scores.
Not Met
• Aiea Elementary reading (13 students participating; records for 9): decrease from 2012-13 (81.5% to 22.2%)
• Aiea Elementary math:(14 students participating; records for 9): decrease from 2012-13 (44.4% to 11.1%)
• Scott Elementary reading: (36 students participating; records for 33): decrease from 2012-13 (77.8% to 69.7%)
• Scott Elementary math (36 students participating; records for 33): decrease from 2012-13 (77.1% to 69.7%
Increase the number of students who receive 30 or more days of after-school academic learning support. Not Met
• Aiea Elementary: decrease from 2012-13 (62 to 52 students)
• Scott Elementary: decrease from 2012-13 (83 to 49 students)
For students who attend the program for 30 or more days, maintain or increase the percentage who show increases in reading and math as measured by report card grades
Not Met, but progressed toward
• Aiea Elementary, reading: increase from 2012-13 (89% to 91.5% of students who maintained or improved reading grades)
• Aiea Elementary, math: decrease from 2012-13 (90% to 91.5% of students who maintained or improved math grades)
• Scott Elementary, reading: decrease from 2012-13 (83% to 81.7% of students who maintained or improved reading grades)

Aiea-Moanalua-Radford Complex Area Evaluation 2013-14
Creating Change, Inc.
Supporting data…
ADD-EDIT OBJECTIVES
Year 3 2013-2014
Increase the number of students meeting state reading and math standards at each of the participating schools
Aiea Elementary, reading 33% Aiea Elementary, math 27% Alvah Scott Elementary, reading 71% Alvah Scott Elementary, math 61%
Maintain or increase the percentage of regular program attendees who achieve proficiency in reading and math as measured by Hawaii State Assessment (HSA) proficiency scores.
Aiea Elementary, reading 22.2% 13 students in grade 3, 9 with data Aiea Elementary, math 11.1% 14 students in grade 3, 9 with data Alvah Scott Elementary, reading 69.7% 36 students in grades 3-6, 33 with data Alvah Scott Elementary, math 69.7% 36 students in grades 3-6, 33 with data
• Scott Elementary, math: increase from 2012-13 (82% to 85.7% of students who maintained or improved math grades)
For students who attend the program for 30 or more days, maintain or increase the percentage who receive passing marks in reading/English (as indicated by a MP (meets proficiency) or ME (meets with excellence) year-end summary mark)
Not Met
• Aiea Elementary: decrease (63% to 57.8%)
• Scott Elementary: decrease (45% to 31.1%)
Aiea-Moanalua-Radford Complex Area Evaluation 2013-14
Creating Change, Inc.
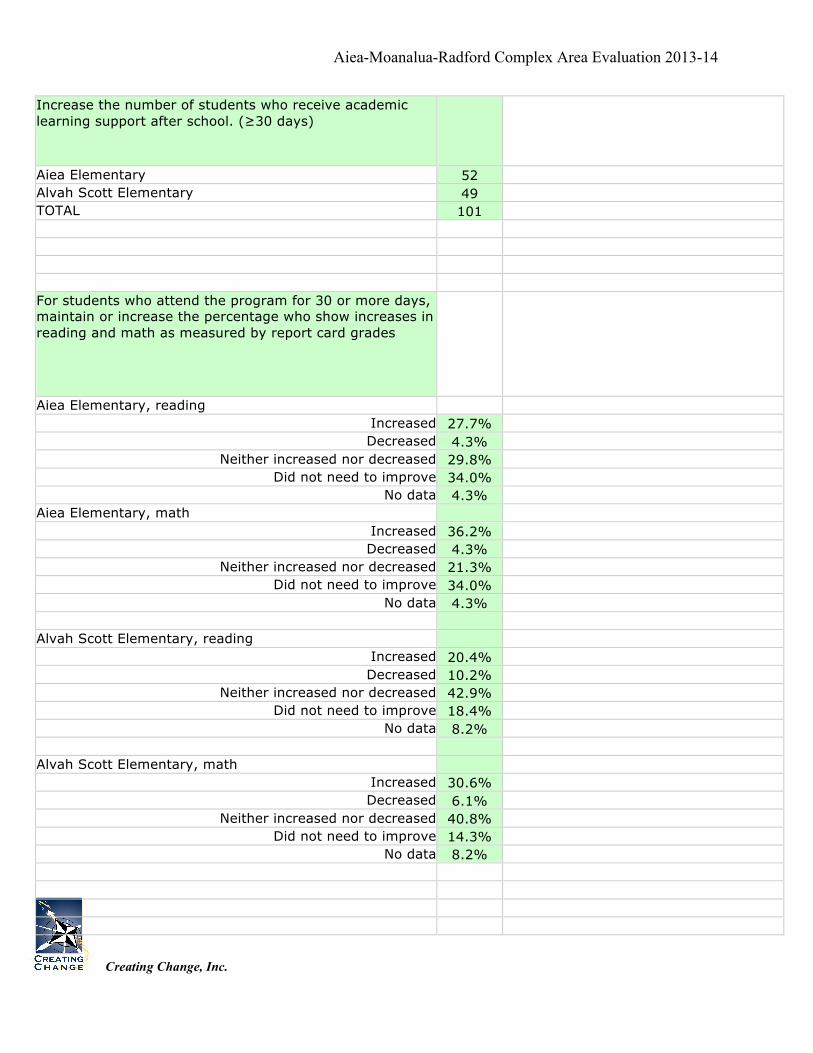
Increase the number of students who receive academic learning support after school. (≥30 days)
Aiea Elementary 52 Alvah Scott Elementary 49 TOTAL 101
For students who attend the program for 30 or more days, maintain or increase the percentage who show increases in reading and math as measured by report card grades
Aiea Elementary, reading
Increased 27.7% Decreased 4.3%
Neither increased nor decreased 29.8% Did not need to improve 34.0%
No data 4.3% Aiea Elementary, math
Increased 36.2% Decreased 4.3%
Neither increased nor decreased 21.3% Did not need to improve 34.0%
No data 4.3%
Alvah Scott Elementary, reading
Increased 20.4%
Decreased 10.2% Neither increased nor decreased 42.9%
Did not need to improve 18.4% No data 8.2%
Alvah Scott Elementary, math
Increased 30.6% Decreased 6.1%
Neither increased nor decreased 40.8% Did not need to improve 14.3%
No data 8.2%

Aiea-Moanalua-Radford Complex Area Evaluation 2013-14
Creating Change, Inc.
For students who attend the program for 30 or more days, maintain or increase the percentage who receive passing marks in reading/English • Year end summary mark as MP (meets proficiency) or ME (meets with excellence)
Aiea Elementary 57.8% Alvah Scott Elementary 31.1%
For students who attend the program for 30 or more days, maintain or increase the percentage who are rated as improving on the APR performance measures *Maintained or improved = Did not need to improve, significant, moderate, slight improvement, or no change
Aiea Elementary 47 surveys distributed, 47 returned
Turning in his/her homework on time. 95.7% Completing homework to your satisfaction 93.6% Participating in class 97.9% Volunteering 95.7% Attending class regularly 97.9% Being attentive in class 89.4% Behaving well in class 91.3% Academic performance 100.0% Coming to school motivated to learn 89.4% Getting along well with other students 91.5%
Alvah Scott Elementary 49 surveys distributed, 40 returned
Turning in his/her homework on time. 80.0% Completing homework to your satisfaction 90.0% Participating in class 92.5% Volunteering 100.0% Attending class regularly 95.0% Being attentive in class 92.5%

Aiea-Moanalua-Radford Complex Area Evaluation 2013-14
Creating Change, Inc.
Behaving well in class 90.0% Academic performance 92.5% Coming to school motivated to learn 95.0% Getting along well with other students 97.5%
Curriculum measure - Reading Comprehension
Aiea Elementary - 47 students, 45 with data
AIMSweb/Lexiles, met instrument-identified benchmark targets, grades 1-3
31.1%
Alvah Scott - 49 students, 35 with data
Scantron Performance Series for grade 1, Grade Level Estimates - reading on grade level (4 students with data)
25.0%
Scantron Performance Series, Fall-to-Spring Growth Targets for grades 2-6 - met instrument-identified growth target (31 students with data)
48.4%
AES Teacher Surveys Did not need to improve
Significant improvement
Moderate improve
ment
Slight improvement
No chang
e
Slight Declin
e
Moderate
Decline
Significant Declin
e
*Maintained
or improv
ed
Turning in his/her homework on time. 14 9 7 8 7 1 1 0 47
29.8% 19.1% 14.9% 17.0% 14.9% 2.1% 2.1% 0.0% 95.7%
Completing homework to your satisfaction 9 6 11 13 5 1 2 0 47
19.1% 12.8% 23.4% 27.7% 10.6% 2.1% 4.3% 0.0% 93.6%
Participating in class 5 5 9 13 14 1 0 0 47
10.6% 10.6% 19.1% 27.7% 29.8% 2.1% 0.0% 0.0% 97.9%
Volunteering 25 3 6 4 7 1 1 0 47
53.2% 6.4% 12.8% 8.5% 14.9% 2.1% 2.1% 0.0% 95.7%
Attending class regularly 27 8 3 3 5 1 0 0 47
57.4% 17.0% 6.4% 6.4% 10.6% 2.1% 0.0% 0.0% 97.9%
Being attentive in class 7 4 5 16 10 3 1 1 47

Aiea-Moanalua-Radford Complex Area Evaluation 2013-14
Creating Change, Inc.
14.9% 8.5% 10.6% 34.0% 21.3% 6.4% 2.1% 2.1% 89.4%
Behaving well in class 12 5 3 16 6 3 1 0 46
26.1% 10.9% 6.5% 34.8% 13.0% 6.5% 2.2% 0.0% 91.3%
Academic performance 7 4 8 23 5 0 0 0 47
14.9% 8.5% 17.0% 48.9% 10.6% 0.0% 0.0% 0.0%
100.0%
Coming to school motivated to learn 12 7 6 8 9 4 1 0 47
25.5% 14.9% 12.8% 17.0% 19.1% 8.5% 2.1% 0.0% 89.4%
Getting along well with other students 17 5 3 11 7 3 1 0 47
36.2% 10.6% 6.4% 23.4% 14.9% 6.4% 2.1% 0.0% 91.5%
*Maintained or improved = Did not need to improve, significant, moderate, slight improvement, or no change
Scott
Did not need to improve
Significant improvement
Moderate improvement
Slight improvement
No change
Slight Decline
Moderate Decline
Significant Decline
*Maintained or improved
Turning in his/her homework on time. 14 0 5 8 5 7 0 1 40
35.0% 0.0% 12.5% 20.0% 12.5%
17.5% 0.0% 2.5% 80.0%
Completing homework to your satisfaction 11 1 3 10 11 3 0 1 40
27.5% 2.5% 7.5% 25.0% 27.5% 7.5% 0.0% 2.5% 90.0%
Participating in class 14 1 6 12 4 2 0 1 40
35.0% 2.5% 15.0% 30.0% 10.0% 5.0% 0.0% 2.5% 92.5%
Volunteering 13 0 1 7 18 0 0 0 39
33.3% 0.0% 2.6% 17.9% 46.2% 0.0% 0.0% 0.0%
100.0%
Attending class regularly 25 0 1 4 8 0 2 0 40
62.5% 0.0% 2.5% 10.0% 20.0% 0.0% 5.0% 0.0% 95.0%
Being attentive in class 13 1 5 7 11 1 2 0 40
32.5% 2.5% 12.5% 17.5% 27.5% 2.5% 5.0% 0.0% 92.5%
Behaving well in class 19 0 3 5 9 2 2 0 40
47.5% 0.0% 7.5% 12.5% 22.5% 5.0% 5.0% 0.0% 90.0%

Aiea-Moanalua-Radford Complex Area Evaluation 2013-14
Creating Change, Inc.
Academic performance 7 2 6 16 6 2 0 1 40
17.5% 5.0% 15.0% 40.0% 15.0% 5.0% 0.0% 2.5% 92.5%
Coming to school motivated to learn 14 0 7 7 10 1 1 0 40
35.0% 0.0% 17.5% 17.5% 25.0% 2.5% 2.5% 0.0% 95.0%
Getting along well with other students 22 1 2 5 9 1 0 0 40
55.0% 2.5% 5.0% 12.5% 22.5% 2.5% 0.0% 0.0% 97.5%
*Maintained or improved = Did not need to improve, significant, moderate, slight improvement, or no change
Findings
As a whole, the program at Aiea-Moanalua-Radford Complex Areast CCLC Centers provided a great opportunity for students to participate in academically enriching programming. The data shows that the targeted number of students receiving academic learning support decreased from 2012-13 to 2013-14.
Aiea-Moanalua-Radford Complex Area offered a wide variety of activities that was intended to attract and retain students however the data do not support that this occurred. Given the increased number of students attending the program and the rate and frequency of student attendance demonstrated in the graphs above, the program did not appear to provide programming that would attract and retain students.
• The data demonstrates that frequency of attendance was moderate and rate of attendance was better, albeit both insufficient to affect academic gain. • 297 students attended the program • 97 or 32.66 % were regular program participants • 278 or 93.60 % attended 50% or more of the programs offered
• The data shows there was a wide range of activities across multiple categories that attracted and retained students to the program with no account as to why attendance rates for 2013-14 were down from the previous year.
• Summer programming included 8 Academic activities and 6 Enrichment activities • School year program included 13 Academic activities and 7 Enrichment activities

Aiea-Moanalua-Radford Complex Area Evaluation 2013-14
Creating Change, Inc.
• The data shows that the targeted number of students receiving academic learning support decreased indicating that perhaps programs were not designed to attract and retain.
• 297 students attended the program, compared to 354 program participants during the 2012-2013 program year
• The number of program participants decreased 17.26 % at Aiea-Moanalua-Radford Complex Area, affecting -57 additional students from 2012-2013 to 2013-2014
• The programs maintained a positive demographic mixture of identified students while providing programming for a high number of LEP and special needs students.
• 76 or 25.59 % of students who attended were LEP • 228 or 76.77 % of students attending were subsidized for lunch • 69 or 23.23 % of students attending were non-subsidized for lunch • 132 females and 155 males attended • The largest attendees grade level wise were students in the 1st and 2nd grades,
representing 25.59 % of students

Aiea-Moanalua-Radford Complex Area Evaluation 2013-14
Creating Change, Inc.
Next Steps
The Aiea-Moanalua-Radford Complex Area Complex Area 21st CCLC programs have determined that the objectives of the grant have not been met due nor has the program been implemented as designed and have discontinued.