aid for trade: matching demand with supply wto experts meeting this presentation is based on elisa...
TRANSCRIPT

Aid for Trade: Aid for Trade: Matching Demand with SupplyMatching Demand with Supply
WTO Experts MeetingWTO Experts Meeting
This presentation is based on Elisa Gamberoni and Richard Newfarmer “Aid for Trade: Matching Potential Demand with Supply” World Bank, Sept 15, 2008
Richard Newfarmer World Bank
Geneva, Sept 15 2008
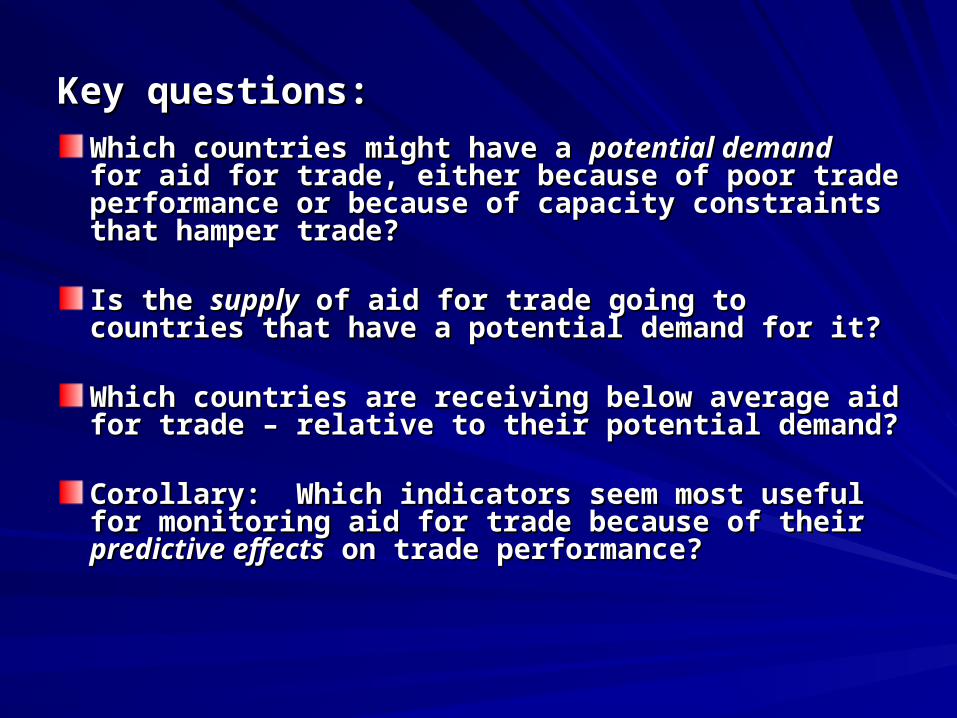
Key questions:Key questions:
Which countries might have a Which countries might have a potential demandpotential demand for aid for trade, for aid for trade, either because of poor trade performance or because of either because of poor trade performance or because of capacity constraints that hamper trade?capacity constraints that hamper trade?
Is the Is the supplysupply of aid for trade going to countries that have a of aid for trade going to countries that have a potential demand for it? potential demand for it?
Which countries are receiving below average aid for trade – Which countries are receiving below average aid for trade – relative to their potential demand? relative to their potential demand?
Corollary: Which indicators seem most useful for monitoring Corollary: Which indicators seem most useful for monitoring aid for trade because of their aid for trade because of their predictive effectspredictive effects on trade on trade performance?performance?

Which countries have greatest need…potential demand?Which countries have greatest need…potential demand?
Trade performanceTrade performance Capacity : Infrastructure, Institutions, incentives
Which indicators Which indicators predictpredict trade level? trade level?
Measuring potential demand -- rankings by quintile
Indicator 1 2 3 4 5 6 7 8 9 10 TotalCountry (highest) 1 1 1 1 1 1 1 1 1 1 = 10
Country (lowest) 5 5 5 5 5 5 5 5 5 5 = 50
Aid for Trade / GDP Income p.c., aid effectiveness demand
5 Indicators5 Indicators
5 Indicators5 Indicators
:
Does supply of aid go to countries with the higest demand?
Which countries have less aid for trade than they might demand?
Google map to our logic….

Caveats…Caveats…
Paper does not analyze Paper does not analyze whywhy a country might receive less aid for a country might receive less aid for tradetrade– It might not need itIt might not need it– It might have higher prioritiesIt might have higher priorities– It might not use it wellIt might not use it well
The effort here is The effort here is notnot to provide answers for individual countries to provide answers for individual countries -- but to provide the big picture and to -- but to provide the big picture and to provoke questionsprovoke questions at the at the national level on competitiveness and aid for trade stategynational level on competitiveness and aid for trade stategy
Trade performanceTrade performance – Several ways to measure.. – Several ways to measure..1. 1. Growth rate of exports of goods and servicesGrowth rate of exports of goods and services
Potential demand arises from poor trade performance and Potential demand arises from poor trade performance and weak trade capacity …weak trade capacity …

-15 -10 -5 0 5 10 15
MalawiGuyanaGuinea
Yemen, Rep.Senegal
ZimbabweBeninEritrea
DjiboutiC. African.Republic
Kyrgyz RepublicSamoa
St. LuciaNigeriaKenya
UzbekistanHonduras
MadagascarCameroon
NigerSierra LeoneGambia, The
Congo, Rep.TajikistanSri Lanka
Côte d'IvoireTanzaniaPakistan
NepalBolivia
Burkina FasoMoldova
GhanaMauritania
Congo, DR.AngolaUganda
NicaraguaHaiti
GeorgiaMali
BangladeshBhutan
IndiaLesothoArmeniaEthiopiaGrenada
AzerbaijanBurundi
MyanmarCape Verde
Guinea-BissauLao PDR
CambodiaMozambique
VietnamRwandaZambiaBosnia
Trade performance varies…but 29 low income countries figure in the bottom two quintiles
Source: Authors calculation. World Bank,WTI Note: Quintile scale are from the entire sample of low and middle income countries
3rd quintile
4th quintile
5th quintile
2nd quintile
1st quintile

Potential demand arises from poor trade performance and Potential demand arises from poor trade performance and weak trade capacity …weak trade capacity …
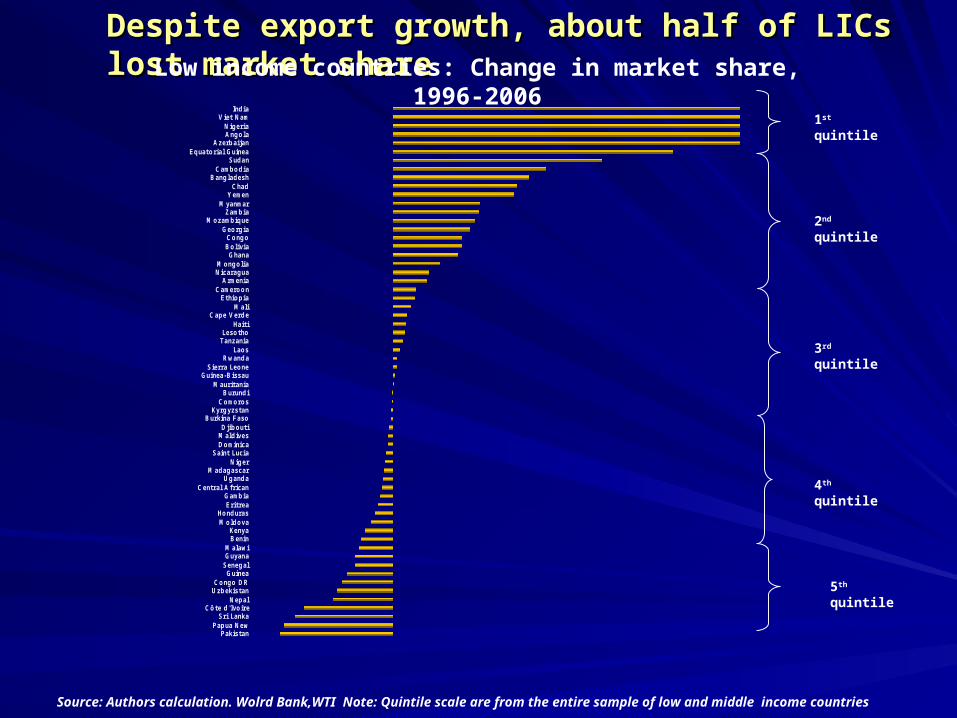
Trade performanceTrade performance – Several ways to measure.. – Several ways to measure..1.1. Growth rate of exports of goods and services Growth rate of exports of goods and services2.2. Change in global market share Change in global market share
PakistanPapua New
Sri LankaCôte d'Ivoire
NepalUzbekistanCongo DR
GuineaSenegalGuyanaMalawi
BeninKenya
MoldovaHonduras
EritreaGambia
Central AfricanUganda
MadagascarNiger
Saint LuciaDominicaMaldivesDjibouti
Burkina FasoKyrgyzstan
ComorosBurundi
MauritaniaGuinea-Bissau
Sierra LeoneRwanda
LaosTanzaniaLesotho
HaitiCape Verde
MaliEthiopia
CameroonArmenia
NicaraguaMongolia
GhanaBoliviaCongo
GeorgiaMozambique
ZambiaMyanmar
YemenChad
BangladeshCambodia
SudanEquatorial Guinea
AzerbaijanAngolaNigeria
Viet NamIndia
Source: Authors calculation. Wolrd Bank,WTI Note: Quintile scale are from the entire sample of low and middle income countries
1st quintile
2nd quintile
3rd quintile
4th quintile
5th quintile
Despite export growth, about half of LICs lost market shareDespite export growth, about half of LICs lost market shareLow income countries: Change in market share, 1996-2006

Trade performanceTrade performance – Several ways to measure.. – Several ways to measure..1.1. Growth rate of exports of goods and services Growth rate of exports of goods and services2.2. Change in global market share Change in global market share3.3. Change in competitiveness in existing markets Change in competitiveness in existing markets 4.4. Growth rates of export markets – product and geographic Growth rates of export markets – product and geographic
marketsmarkets
Potential demand arises from poor trade performance and Potential demand arises from poor trade performance and weak trade capacity …weak trade capacity …

Sources of export growth: competitiveness or demand Sources of export growth: competitiveness or demand growth?growth?
--Burundi, Cameroon,Central Afr. Rep., Côte d'Ivoire, Congo D. R., Dominica Eritrea, Ethiopia, Gambia, Grenada, Guinea, Guinea-Bissau, Guyana, Honduras, Liberia, Madagascar, Malawi, Maldives, Moldova, Nepal, Nicaragua, Pakistan, Papua New Guinea, Saint Lucia, Saint Vincent, Sao Tome and P., Senegal, Somalia, Sudan, Tanzania, Tonga, Uganda, Zambia, Zimbabwe.
Competitiveness effectCompetitiveness effect
Source: Authors calculations based on International Trade Center, Trade Performance indicator
Gaining competitiveness in slow growing markets
Gaining competitiveness in fast growing markets
Losing competitiveness in fast growing markets
Losing competitiveness in slow growing markets
+-Kyrgyzstan, Mongolia,Niger, Nigeria, Yemen.
+ -Azerbaijan, Bangladesh, Benin, Bhutan, Bolivia, Bosnia and Herzegovina, Burkina Faso, Cambodia, Chad, Comoros, Djibouti, Ghana, Haiti, India, Kenya, Kiribati, Laos, Mali, Mauritania, Mozambique, Rwanda, Samoa, Sierra Leone, Solomon Is, Sri Lanka, Tajikistan, Togo, Uzbekistan, Vanuatu, Viet Nam.
++Angola, Armenia,Cape Verde, Congo, Equatorial Guinea, Georgia, Myanmar.
DemandDemand

Trade performanceTrade performance – Several ways to measure.. – Several ways to measure..1.1. Growth rate of exports of goods and services Growth rate of exports of goods and services2.2. Change in global market share Change in global market share3.3. Change in competitiveness in existing markets Change in competitiveness in existing markets 4.4. Growth rates of export markets – product and geographic Growth rates of export markets – product and geographic
marketsmarkets5.5. Degree of concentration Degree of concentration
Potential demand arises from poor trade performance and Potential demand arises from poor trade performance and weak trade capacity …weak trade capacity …
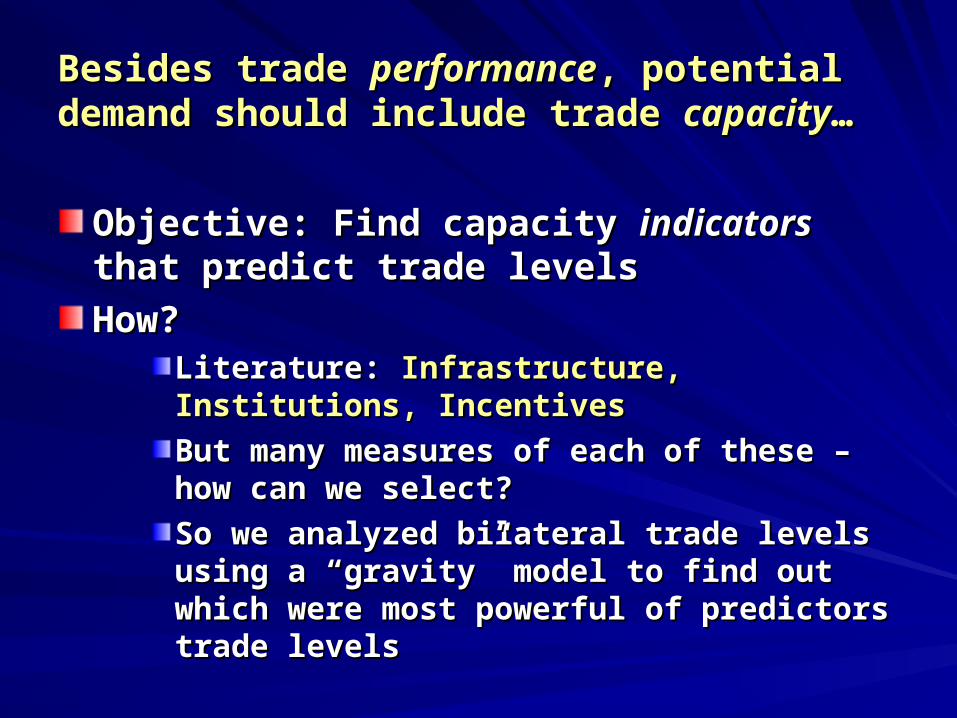
Besides trade Besides trade performanceperformance, potential demand should , potential demand should include trade include trade capacitycapacity……
Objective: Find capacity Objective: Find capacity indicatorsindicators that predict trade that predict trade levels levels
How?How?Literature: Literature: Infrastructure, Institutions, IncentivesInfrastructure, Institutions, Incentives
But many measures of each of these – how can we But many measures of each of these – how can we select? select?
So we analyzed bilateral trade levels using a “gravity” So we analyzed bilateral trade levels using a “gravity” model to find out which were most powerful of predictors model to find out which were most powerful of predictors trade levelstrade levels

Besides trade Besides trade performanceperformance, potential demand should , potential demand should include trade include trade capacitycapacity……
Objective: Find Objective: Find indicatorsindicators that predict trade levels that predict trade levels – InfrastructureInfrastructure
1. 1. Quality of infrastructure and information technology –Quality of infrastructure and information technology –LPI (2)LPI (2)
– InstitutionsInstitutions2. 2. Quality of customs – LPI (3) Quality of customs – LPI (3)3. 3. Time to export – Time to export – Doing BusinessDoing Business
– IncentivesIncentives4. 4. Peak tariffs (# of lines 3x average tariff level) Peak tariffs (# of lines 3x average tariff level) 5. 5. Tariff overall restrictiveness index - OTRI Tariff overall restrictiveness index - OTRI
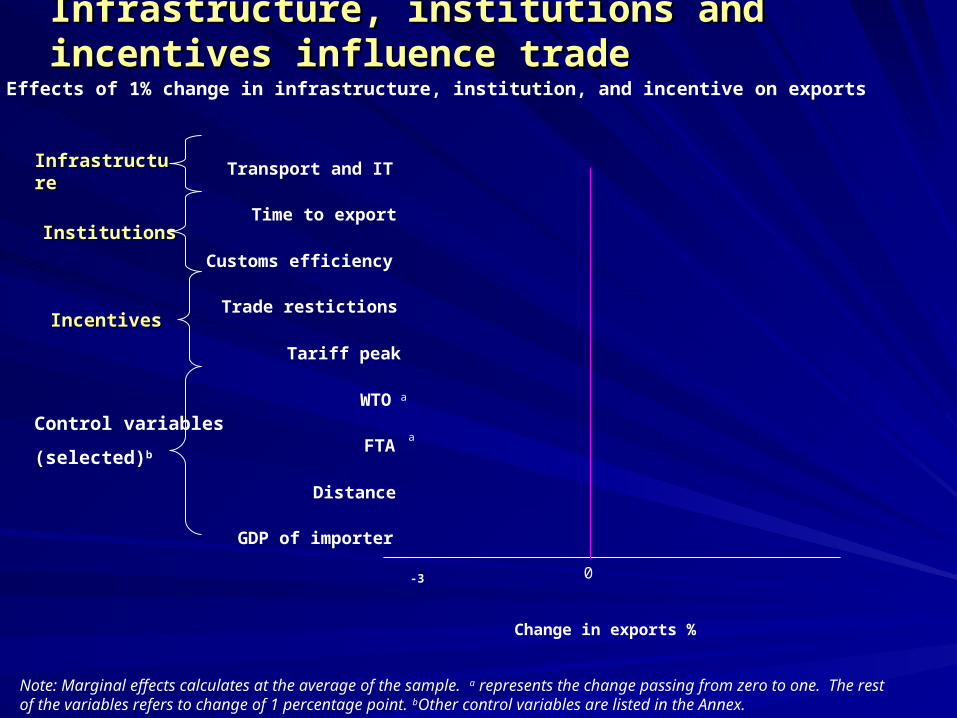
Infrastructure, institutions and incentives influence trade Infrastructure, institutions and incentives influence trade
Change in exports %
Effects of 1% change in infrastructure, institution, and incentive on exports
Note: Marginal effects calculates at the average of the sample. a represents the change passing from zero to one. The rest of the variables refers to change of 1 percentage point. bOther control variables are listed in the Annex.
0
InstitutionsInstitutions
IncentivesIncentives
Control variables
(selected)b
InfrastructureInfrastructure
a
a
-3
GDP of importer
Distance
FTA
WTO
Tariff peak
Trade restictions
Customs efficiency
Time to export
Transport and IT
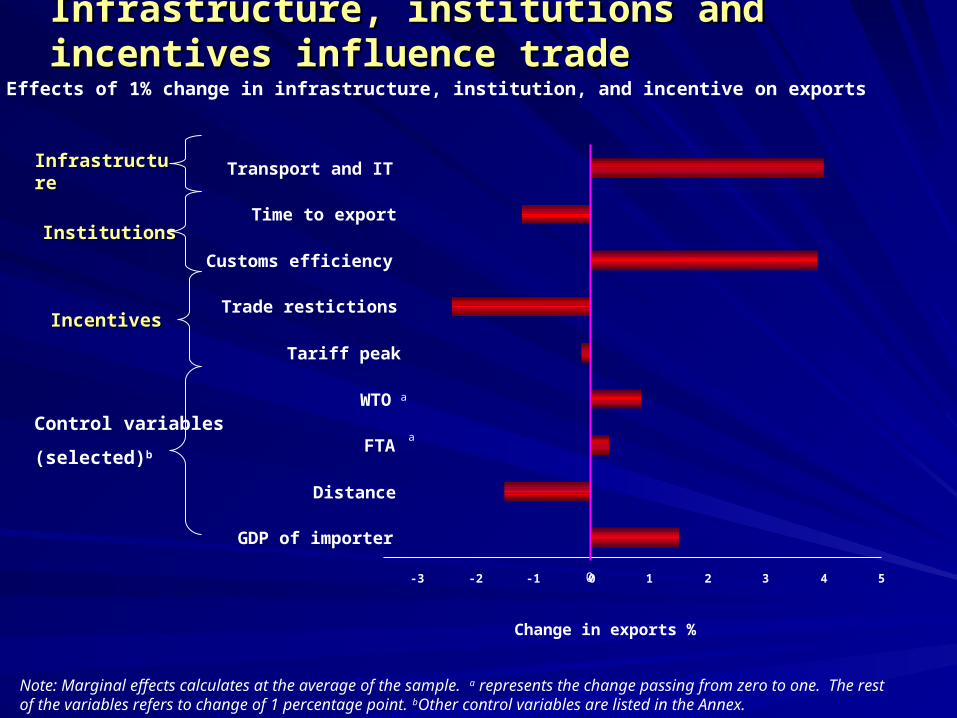
Infrastructure, institutions and incentives influence trade Infrastructure, institutions and incentives influence trade
Change in exports %
Effects of 1% change in infrastructure, institution, and incentive on exports
Note: Marginal effects calculates at the average of the sample. a represents the change passing from zero to one. The rest of the variables refers to change of 1 percentage point. bOther control variables are listed in the Annex.
0
InstitutionsInstitutions
IncentivesIncentives
Control variables
(selected)b
InfrastructureInfrastructure
a
a
-3 -2 -1 0 1 2 3 4 5
GDP of importer
Distance
FTA
WTO
Tariff peak
Trade restictions
Customs efficiency
Time to export
Transport and IT

0%
20%
40%
60%
80%
100%
LDC Other low income Middle Income
About 60% of LDCs figure in the bottom two quintiles of infrastructure rankings for all developing countries
Source: Authors calculation based on World Bank, LPI Indicators
Passing from the fourth Passing from the fourth quintile to the third quintile quintile to the third quintile
raise trade by raise trade by 35%35%

Quantifying “potential demand”… adding it up Quantifying “potential demand”… adding it up
Score every country on 10 Score every country on 10 dimensionsdimensions
1 for highest quintile…to 5 for 1 for highest quintile…to 5 for lowest quintilelowest quintile
Least demand (best score) = 10…. Least demand (best score) = 10…. to highest need for aid for trade = to highest need for aid for trade = 50 50
Trade performanceTrade performance1 Growth of exports1 Growth of exports2 Change in market share2 Change in market share3 Competitiveness in existing markets3 Competitiveness in existing markets4 Demand structure4 Demand structure5 Concentration- diversification5 Concentration- diversification
CapacityCapacity66 InfrastructureInfrastructure77 CustomsCustoms8 Time to export8 Time to export99 Tariff peaksTariff peaks1010 Overall tariff restrictivenessOverall tariff restrictiveness

Potential demand for aid for tradePotential demand for aid for trade
GuyanaSierra Leone
Central AfricanEast Timor
MalawiSamoa
SomaliaBenin
Congo DRJ amaica
UzbekistanNamibia
TajikistanEritreaNepal
FijiM icronesia
MadagascarNiger
Papua New GuineaRwanda
ComorosSyrian Arab Republic
YemenSolomon Is
Burkina FasoEthiopia
GuineaMali
ParaguayBurundi
Sao Tome and PrincipeSaint Vincent and the
KyrgyzstanMauritius
SudanUgandaZambiaGambia
HaitiLaos
VanuatuColombia
GabonMoldovaTanzaniaLesothoCongo
Source: Authors calculation based on data from ITC and World Bank.
Countries in the bottom two quintiles
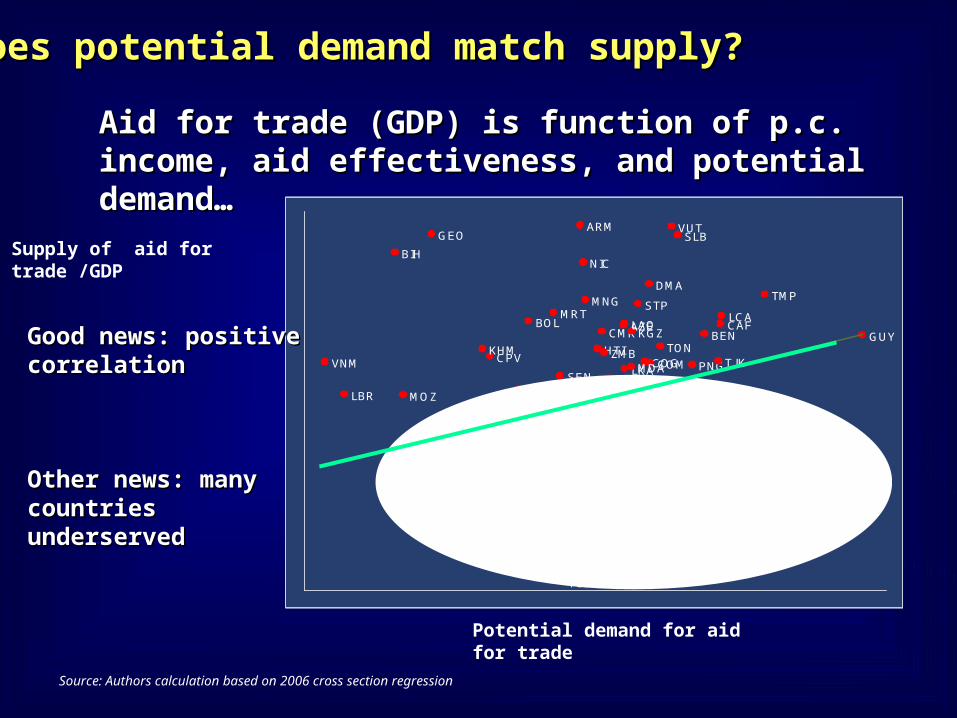
Does potential demand match supply?Does potential demand match supply?
Aid for trade (GDP) is function of p.c. income, aid effectiveness, Aid for trade (GDP) is function of p.c. income, aid effectiveness, and potential demand… and potential demand…
Source: Authors calculation based on 2006 cross section regression
Potential demand for aid for trade
Supply of aid for trade /GDP
AGO
ARM
AZE
BDI
BEN
BFA
BGD
BIH
BOL
BTN
CAF
CIV
CMR
COGCOMCPV
DJI
DMA
ERI
ETH
GEO
GHA
GIN
GMB
GNB
GNQ
GRD
GUY
HND
HTI
IND
KEN
KGZ
KHM
KIR
LAO
LBR
LCA
LKA
LSO
MDA
MDG
MDV
MLI
MNG
MOZ
MRT
MWI
NERNGA
NIC
NPL
PAK
PNG
RWA
SDN
SEN
SLB
SLE
STP
TCDTGO
TJK
TMP
TON
TZA
UGA
UZB
VNM
VUT
YEM
ZAR
ZMBGood news: positive Good news: positive correlationcorrelation
Other news: many Other news: many countries underservedcountries underserved

Conclusions… Aid for trade potential demand outstrips Conclusions… Aid for trade potential demand outstrips current supplycurrent supply
While trade performance of developing countries as a group has While trade performance of developing countries as a group has been strong, many countries are performing below average and been strong, many countries are performing below average and many countries are vulnerable to a slowing global economymany countries are vulnerable to a slowing global economy
Particular at risk are those with poor trade performance – slow Particular at risk are those with poor trade performance – slow growth, declining market shares, and concentrated exports –growth, declining market shares, and concentrated exports –
… …and those with poor infrastructure, institutions and export and those with poor infrastructure, institutions and export incentivesincentives
While aid for trade supply is broadly correlated with potential While aid for trade supply is broadly correlated with potential demand, still, several countries that have the highest potential demand, still, several countries that have the highest potential demand are receiving less- than- average levels of aid for trade. demand are receiving less- than- average levels of aid for trade.
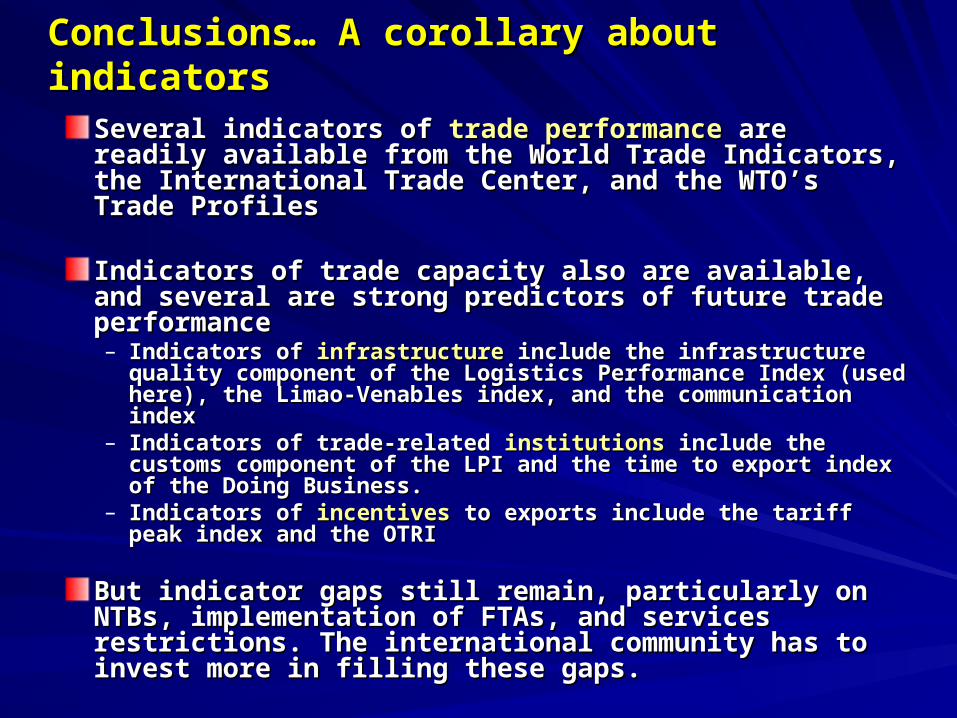
Conclusions… A corollary about indicatorsConclusions… A corollary about indicators
Several indicators of Several indicators of trade performancetrade performance are readily available are readily available from the World Trade Indicators, the International Trade Center, from the World Trade Indicators, the International Trade Center, and the WTO’s Trade Profilesand the WTO’s Trade Profiles
Indicators of trade capacity also are available, and several are Indicators of trade capacity also are available, and several are strong predictors of future trade performancestrong predictors of future trade performance– Indicators of Indicators of infrastructureinfrastructure include the infrastructure quality component include the infrastructure quality component
of the Logistics Performance Index (used here), the Limao-Venables of the Logistics Performance Index (used here), the Limao-Venables index, and the communication indexindex, and the communication index
– Indicators of trade-related Indicators of trade-related institutionsinstitutions include the customs component of include the customs component of the LPI and the time to export index of the Doing Business.the LPI and the time to export index of the Doing Business.
– Indicators of Indicators of incentives incentives to exports include the tariff peak index and the to exports include the tariff peak index and the OTRIOTRI
But indicator gaps still remain, particularly on NTBs, But indicator gaps still remain, particularly on NTBs, implementation of FTAs, and services restrictions. The implementation of FTAs, and services restrictions. The international community has to invest more in filling these gaps. international community has to invest more in filling these gaps.
Collier, P. and D. Dollar (2002),“Aid allocation and poverty reduction”, European Economic Review, Vol. 46 (8), pp. 1475-1500.
Djankov, S., Freund, C. and S. Pham Cong (2006), “Trading on time”, Policy Research Working Paper 3909, The World Bank.
Francois J. and M. Manchin (2007), “Institutions, Infrastructure, and Trade”, IIDE Discussion Papers 2007-401, Institute for International and Development Economics.
Hoekman B. and A. Nicita (2008), “Trade Policy, Trade Costs and Developing Country Trade”.
Jansen, M. (2004), “Income volatility in small and developing economies: export concentration matters”, World Trade Organization Publication.
Limao, N. and Venables, A. J. (1999), “Infrastructure, geographical disadvantage, and transport costs”, Policy Research Working Paper 2257, The World Bank.
Nordas, H. and R. Piermartini (2004),“Infrastructure and Trade”, WTO Staff Working Paper, World Trade Organization.
Turnovsky, S.J. and P. Chattopadhyay (2003), "Volatility and Growth in Developing Economies: Some Numerical Results and Empirical Evidence", Journal of International Economics 59.
Wilson, J. S., Mann, C. L. and T. Otsuki (2004), “Assessing the potential benefit of trade facilitation: A global perspective”, Policy Research Working Paper 3224, The World Bank.
Selected ReferencesSelected References
For details to this presentation, see Elisa Gamberoni and Richard Newfarmer “Aid for Trade: Matching Potential Demand with Supply” World Bank, Sept 15, 2008

Aid for Trade: Aid for Trade: Matching Demand with SupplyMatching Demand with Supply
WTO Experts MeetingWTO Experts Meeting
This presentation is based on Elisa Gamberoni and Richard Newfarmer “Aid for Trade: Matching Potential Demand with Supply” World Bank, Sept 15, 2008
Richard Newfarmer World Bank
Geneva, Sept 15 2008