ahel q3fy14 earnings update - apollo hospitals healthcare services (existing) sap existing...
TRANSCRIPT
1
Q2 FY 2013 Earnings UpdateQ3 FY 2014 Earnings Update

2
Safe Harbour
No representation or warranty, express or implied, is made as to, and no reliance should be placed on, the fairness, accuracy, completeness or correctness of the information or opinions contained in this presentation. Such information and opinions are in all events not current after the date of this presentation. Certain statements made in this presentation may not be based on historical information or facts and may be "forward looking statements" based on the currently held beliefs and assumptions of the management of the Company, which are expressed in good faith and in their opinion reasonable, including those relating to the Company’s general business plans and strategy, its future financial condition and growth prospects and future developments in its industry and its competitive and regulatory environment.
Forward-looking statements involve known and unknown risks, uncertainties and other factors, which may cause the actual results, financial condition, performance or achievements of the Company or industry results to differ materially from the results, financial condition, performance or achievements expressed or implied by such forward-looking statements, including future changes or developments in the Company’s business, its competitive environment and political, economic, legal and social conditions. Further, past performance is not necessarily indicative of future results. Given these risks, uncertainties and other factors, viewers of this presentation are cautioned not to place undue reliance on these forward-looking statements. The Company disclaims any obligation to update these forward-looking statements to reflect future events or developments.
Numbers mentioned in this Presentation in respect of information provided on hospital operating parameters and other operating metrics have been compiled by the management and are being provided only by way of additional information. These are not to be construed as being provided under any legal or regulatory requirements. The accuracy of these numbers have neither been vetted nor approved by the Audit Committee and the Board of Directors of Apollo Hospitals Enterprise Limited (AHEL), nor have they been vetted or reviewed by the Auditors, and therefore may differ from the actual.
Important risk factors and uncertainties could make a material difference to the Company’s operations. These risks include but are not limited to, the risk factors described in AHEL’s prospectus, annual reports and other periodic filings made by the company. The Company assumes no responsibility to publicly amend, modify or revise any forward looking statement, on the basis of any subsequent development, information or events, or otherwise.
This presentation is for general information purposes only, without regard to any specific objectives, financial situations or informational needs of any particular person. The Company may alter, modify or otherwise change in any manner the content of this presentation, without obligation to notify any person of such change or changes. This presentation may not be copied or disseminated in any manner.
The Company on a quarterly basis adopts and publishes Standalone financial results as per the stock exchange listing agreement requirements. The consolidated financial results provided for the Quarter are unaudited and for information purposes only.
Previous year figures have been reworked/regrouped /rearranged and reclassified wherever necessary to conform to the requirement of revised Schedule VI format

3
• Highlights
• Standalone Financial Performance
• Consolidated Financial Performance
• Operational Performance – Hospitals
• Operational Performance – Standalone Pharmacy
• Update on Projects
• Update on non-hospital JVs
Contents

4
Financial Performance
Key Operational highlights
Chennai cluster displayed 12% increase in the revenues in YTD Dec FY14 at Rs. 8,325 mio as compared to Rs. 7,460 mio in YTD Dec FY13.
Hyderabad Revenues grew by 11% in YTD Dec FY14 to Rs. 3,427 mio as compared to Rs. 3,097 mio in YTD Dec FY13.
Other Hospitals outside of Chennai & Hyderabad displayed good growth Bhubaneswar occupancy at 209 beds (84% utilization on capacity of 250 beds) as compared to
185 beds in YTD Dec FY13. YTD Dec FY14 EBITDA margins at 22% from 21% in the same period last year.
Mysore occupancy at 154 beds as compared to 142 beds in YTD Dec FY13. Subsidiary & JV Hospitals at Ahmedabad, Kolkata & Bangalore displayed good growth in Revenues Stand Alone Pharmacies (SAP) continues its EBITDA expansion trajectory. 35 stores added in Q3 FY14
& 9 stores closed taking the total count of stores as at 31st Dec 2013 to 1,586. SAP EBITDA at Rs. 323 mio (3.2% margin) in YTD Dec FY14 as compared to Rs. 221 mio (2.7% margin) in YTD Dec FY13.
Apollo Munich achieved a Gross Written Premium of Rs. 3,729 mio in YTD Dec FY14 against Rs. 3,591 mio achieved during the same period in the previous year representing a growth of 4%.
Highlights – (1/2)
YTD Dec FY14 Consolidated Revenues of Rs. 32,616 mio (up 16.2% yoy)
YTD Dec FY14 Consolidated EBITDA of Rs. 5,117 mio (up 9.4% yoy)
• New Hospitals in initial stages of operations reported operating loss of Rs 168 mio in YTD Dec FY14
• AHLL reported an EBITDA loss of Rs. 125 mio due to addition of 2 birthing centers and new Clinics added last fiscal
YTD Dec FY14 Consolidated EBITDA margin at 15.7% as compared to 16.7% in YTD Dec FY13
Consolidated PAT of Rs. 2,450 mio (up 4.2% yoy)
5
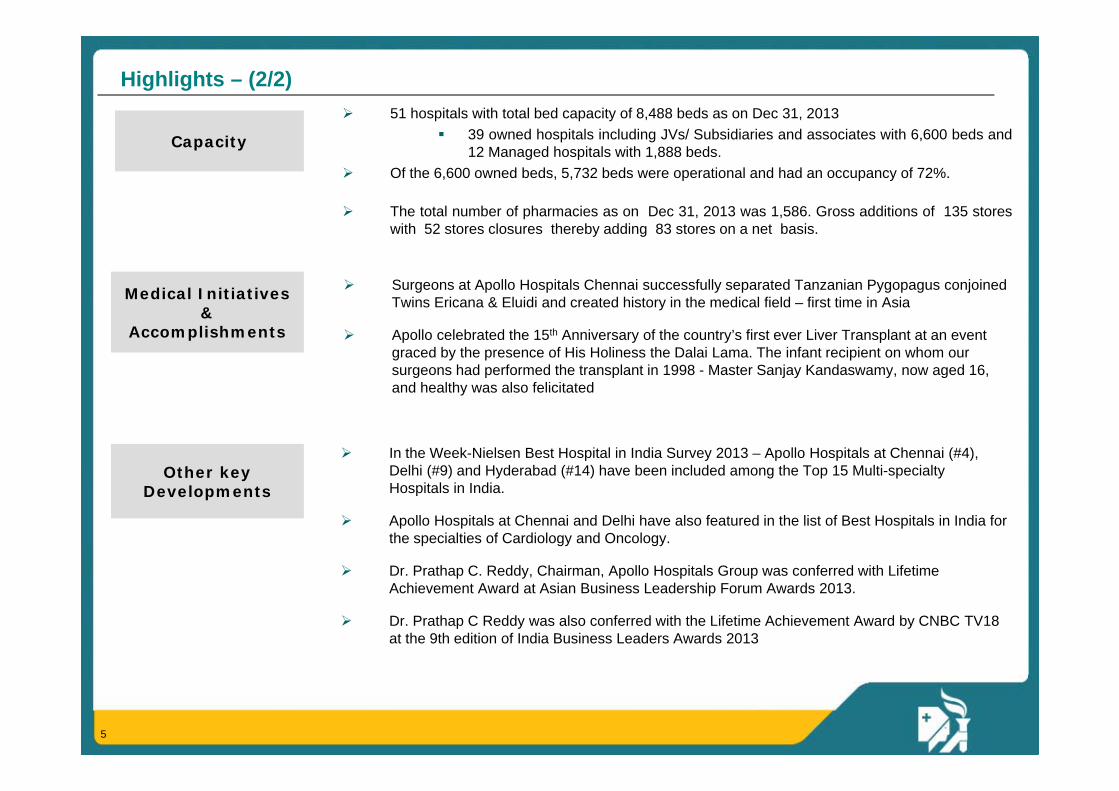
Surgeons at Apollo Hospitals Chennai successfully separated Tanzanian Pygopagus conjoined Twins Ericana & Eluidi and created history in the medical field – first time in Asia
Apollo celebrated the 15th Anniversary of the country’s first ever Liver Transplant at an event graced by the presence of His Holiness the Dalai Lama. The infant recipient on whom our surgeons had performed the transplant in 1998 - Master Sanjay Kandaswamy, now aged 16, and healthy was also felicitated
Other key Developments
Medical Initiatives &
Accomplishments
Highlights – (2/2)
Capacity
In the Week-Nielsen Best Hospital in India Survey 2013 – Apollo Hospitals at Chennai (#4), Delhi (#9) and Hyderabad (#14) have been included among the Top 15 Multi-specialty Hospitals in India.
Apollo Hospitals at Chennai and Delhi have also featured in the list of Best Hospitals in India for the specialties of Cardiology and Oncology.
Dr. Prathap C. Reddy, Chairman, Apollo Hospitals Group was conferred with Lifetime Achievement Award at Asian Business Leadership Forum Awards 2013.
Dr. Prathap C Reddy was also conferred with the Lifetime Achievement Award by CNBC TV18 at the 9th edition of India Business Leaders Awards 2013
51 hospitals with total bed capacity of 8,488 beds as on Dec 31, 2013 39 owned hospitals including JVs/ Subsidiaries and associates with 6,600 beds and
12 Managed hospitals with 1,888 beds. Of the 6,600 owned beds, 5,732 beds were operational and had an occupancy of 72%.
The total number of pharmacies as on Dec 31, 2013 was 1,586. Gross additions of 135 storeswith 52 stores closures thereby adding 83 stores on a net basis.

6
• Highlights
• Standalone Financial Performance
• Consolidated Financial Performance
• Operational Performance – Hospitals
• Operational Performance – Standalone Pharmacy
• Update on Projects
• Update on non-hospital JVs
Contents
7
Q3 FY 13 Q3 FY 14 yoy (%)YTD Dec
FY 13YTD Dec
FY 14 yoy (%)
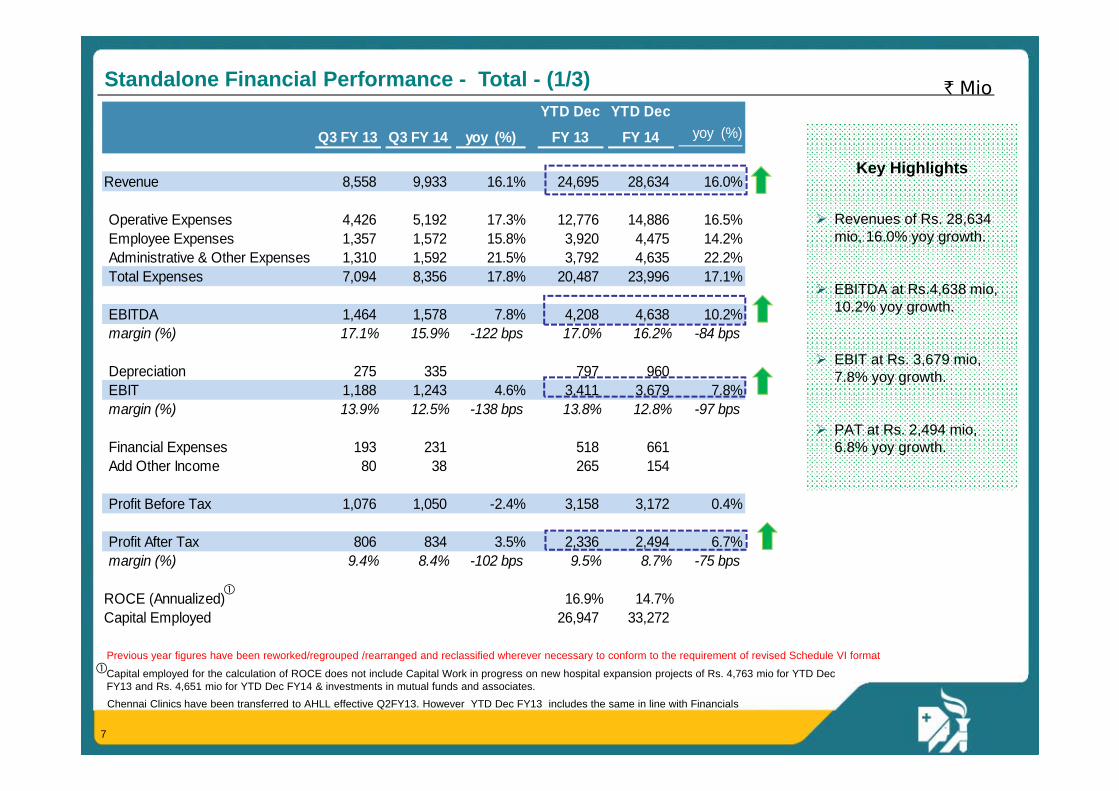
Revenue 8,558 9,933 16.1% 24,695 28,634 16.0%
Operative Expenses 4,426 5,192 17.3% 12,776 14,886 16.5%Employee Expenses 1,357 1,572 15.8% 3,920 4,475 14.2%Administrative & Other Expenses 1,310 1,592 21.5% 3,792 4,635 22.2%Total Expenses 7,094 8,356 17.8% 20,487 23,996 17.1%
EBITDA 1,464 1,578 7.8% 4,208 4,638 10.2%margin (%) 17.1% 15.9% -122 bps 17.0% 16.2% -84 bps
Depreciation 275 335 797 960 EBIT 1,188 1,243 4.6% 3,411 3,679 7.8%margin (%) 13.9% 12.5% -138 bps 13.8% 12.8% -97 bps
Financial Expenses 193 231 518 661 Add Other Income 80 38 265 154
Profit Before Tax 1,076 1,050 -2.4% 3,158 3,172 0.4%
Profit After Tax 806 834 3.5% 2,336 2,494 6.7%margin (%) 9.4% 8.4% -102 bps 9.5% 8.7% -75 bps
ROCE (Annualized) 16.9% 14.7%Capital Employed 26,947 33,272
Capital employed for the calculation of ROCE does not include Capital Work in progress on new hospital expansion projects of Rs. 4,763 mio for YTD Dec FY13 and Rs. 4,651 mio for YTD Dec FY14 & investments in mutual funds and associates.
` MioStandalone Financial Performance - Total - (1/3)
Key Highlights
Revenues of Rs. 28,634 mio, 16.0% yoy growth.
EBITDA at Rs.4,638 mio, 10.2% yoy growth.
EBIT at Rs. 3,679 mio, 7.8% yoy growth.
PAT at Rs. 2,494 mio, 6.8% yoy growth.
Previous year figures have been reworked/regrouped /rearranged and reclassified wherever necessary to conform to the requirement of revised Schedule VI format
Chennai Clinics have been transferred to AHLL effective Q2FY13. However YTD Dec FY13 includes the same in line with Financials

8
Healthcare services (Existing) SAP
Existing Standalone
New Hospitals Standalone
YTD Dec FY 14Revenue 18,297 10,000 28,296 338 28,634
EBITDA 4,482 323 4,806 (168) 4,638 margin (%) 24.5% 3.2% 17.0% 16.2%
EBIT 3,688 246 3,934 (255) 3,679 margin (%) 20.2% 2.5% 13.9% 12.8%YTD Dec FY 13Revenue 16,496 8,158 24,655 - 24,695
EBITDA 3,987 221 4,208 - 4,208 margin (%) 24.2% 2.7% 17.1% 17.0%
EBIT 3,260 151 3,411 - 3,411 margin (%) 19.8% 1.9% 13.8% 13.8%YoY GrowthRevenue 10.9% 22.6% 14.8% - 16.0%EBITDA 12.4% 46.4% 14.2% - 10.2%EBIT 13.1% 62.7% 15.3% - 7.8%
` MioStandalone Financial Performance – Existing & New Breakup - (2/3)
Chennai Clinics have been transferred to AHLL effective Q2FY13 and has been excluded from HCS (Existing) in YTD Dec FY13 for like to like comparison However Total Standalone includes the same in line with Financials
Key Highlights
Existing Health Care Services LFL (like for like ) revenue growth at 11%
Existing Health Care Services EBITDA grew 12.4% from Rs 3,987 mn in YTD Dec FY13 to Rs 4,482 mn in YTD Dec FY14. EBITDA margins expanded by 33 bps from 24.2% in YTD Dec FY13 to 24.5% in YTD Dec FY14.
New Hospitals (Vanagaram , Jayanagar & Trichy) are still in initial stages of operations and have an operating loss of Rs 168 mn in YTD Dec FY14
9
Q3 FY 13 Q3 FY 14 yoy (%)YTD Dec
FY 13YTD Dec
FY 14 yoy (%)Revenues from each segment
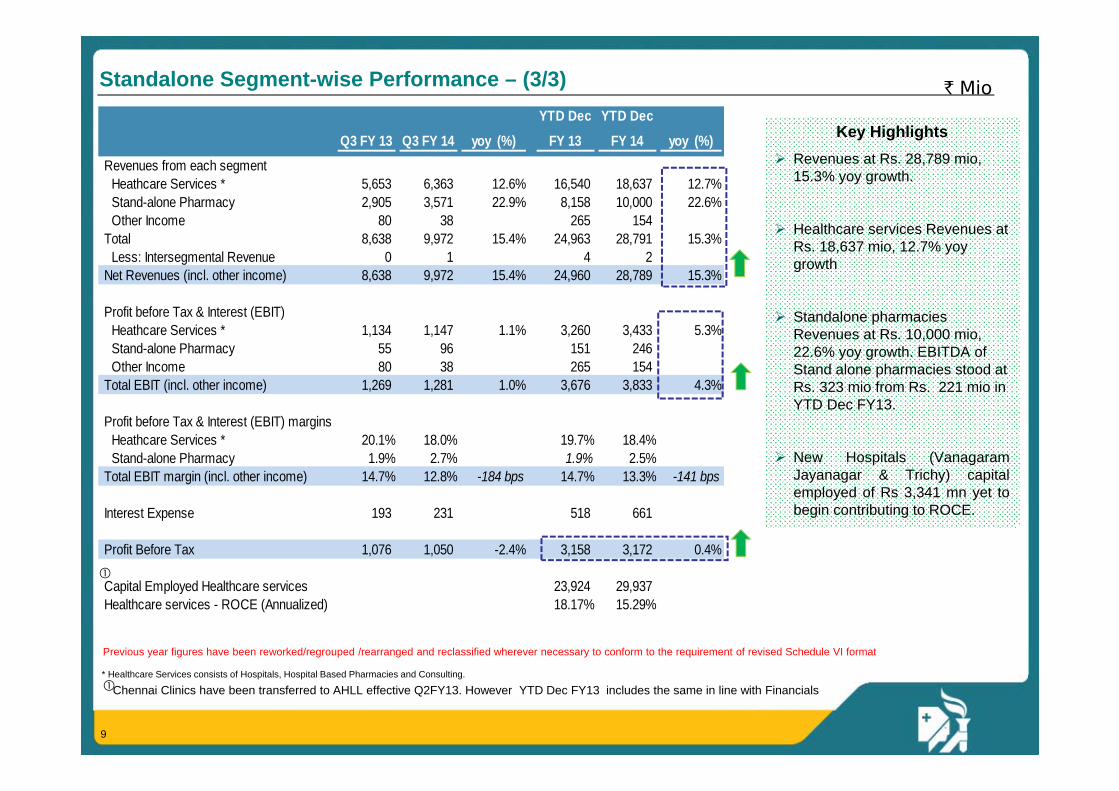
Heathcare Services * 5,653 6,363 12.6% 16,540 18,637 12.7%Stand-alone Pharmacy 2,905 3,571 22.9% 8,158 10,000 22.6%Other Income 80 38 265 154
Total 8,638 9,972 15.4% 24,963 28,791 15.3%Less: Intersegmental Revenue 0 1 4 2
Net Revenues (incl. other income) 8,638 9,972 15.4% 24,960 28,789 15.3%
Profit before Tax & Interest (EBIT)Heathcare Services * 1,134 1,147 1.1% 3,260 3,433 5.3%Stand-alone Pharmacy 55 96 151 246 Other Income 80 38 265 154
Total EBIT (incl. other income) 1,269 1,281 1.0% 3,676 3,833 4.3%
Profit before Tax & Interest (EBIT) marginsHeathcare Services * 20.1% 18.0% 19.7% 18.4%Stand-alone Pharmacy 1.9% 2.7% 1.9% 2.5%
Total EBIT margin (incl. other income) 14.7% 12.8% -184 bps 14.7% 13.3% -141 bps
Interest Expense 193 231 518 661
Profit Before Tax 1,076 1,050 -2.4% 3,158 3,172 0.4%
Capital Employed Healthcare services 23,924 29,937 Healthcare services - ROCE (Annualized) 18.17% 15.29%
* Healthcare Services consists of Hospitals, Hospital Based Pharmacies and Consulting.
` MioStandalone Segment-wise Performance – (3/3)
Key Highlights Revenues at Rs. 28,789 mio,
15.3% yoy growth.
Healthcare services Revenues at Rs. 18,637 mio, 12.7% yoy growth
Standalone pharmacies Revenues at Rs. 10,000 mio, 22.6% yoy growth. EBITDA of Stand alone pharmacies stood at Rs. 323 mio from Rs. 221 mio in YTD Dec FY13.
New Hospitals (VanagaramJayanagar & Trichy) capitalemployed of Rs 3,341 mn yet tobegin contributing to ROCE.
Previous year figures have been reworked/regrouped /rearranged and reclassified wherever necessary to conform to the requirement of revised Schedule VI format
Chennai Clinics have been transferred to AHLL effective Q2FY13. However YTD Dec FY13 includes the same in line with Financials

10
• Highlights
• Standalone Financial Performance
• Consolidated Financial Performance
• Operational Performance – Hospitals
• Operational Performance – Standalone Pharmacy
• Update on Projects
• Update on non-hospital JVs
Contents

11
• Basis of consolidation in the Appendix (page 22)
• JVs include Ahmedabad-50%, Kolkata-50% ,PET CT - 50%, Apollo Munich – 10.23%, Quintiles – 40%, Apollo Lavasa – 34.66% and Future Parking Pvt Ltd – 49%
` MioConsolidated Financial Performance (Unaudited Management Estimates) – Total - (1/2)
Key Highlights
Revenue growth of 16.2% fromRs. 28,069 mio in YTD DecFY13 to Rs. 32,616 mio in YTDDec FY14 .
Consolidated EBITDA grew by9.4% aided by expansion inHealthcare services EBITDA,improved EBITDA contributionby SAPs
Consolidated PAT grew 4.2%from Rs. 2,351mio in YTD DecFY13 to Rs. 2,450 mio in YTDDec FY14.
Previous year figures have been reworked/regrouped /rearranged and reclassified wherever necessary to conform to the requirement of revised Schedule VI formatApollo Health Street (divested) financials have not been considered in the Consolidated financials in YTD Dec FY13 for LFL (like for like) comparison
Q3 FY 13 Q3 FY 14 yoy (%)YTD Dec
FY 13YTD Dec
FY 14 yoy (%)
Income from Operations 9,131 10,611 16.2% 26,310 30,611 16.4%Add: Share of JVs 600 677 12.8% 1,759 2,005 13.9%Total Revenues 9,731 11,288 16.0% 28,069 32,616 16.2%
EBITDA 1,578 1,724 9.2% 4,678 5,117 9.4%margin (%) 16.2% 15.3% -95 bps 16.7% 15.7% -98 bps
EBIT 1,217 1,286 5.6% 3,637 3,843 5.7%margin (%) 12.5% 11.4% -112 bps 13.0% 11.8% -118 bps
Profit After Tax 746 778 4.3% 2,351 2,450 4.2%
Total Debt 15,508 Cash & Cash equivalents (includes investment in liquid funds) 5,331
Standalone financialsTotal Debt 12,361 Cash & Cash equivalents (includes investment in liquid funds) 4,966

12
Total Healthcare
serv (Existing) SAP
New Hospitals Munich
AHLL (incl Cradle) Consol
YTD Dec FY 14Revenue 21,320 10,000 338 442 517 32,616
EBITDA 5,105 323 (168) (19) (125) 5,117 margin (%) 23.9% 3.2% 15.7%
EBIT 4,065 246 (255) (24) (189) 3,843 margin (%) 19.1% 2.5% 11.8%YTD Dec FY 13Revenue 19,145 8,158 - 366 401 28,069
EBITDA 4,486 221 - 1 (30) 4,678 margin (%) 23.4% 2.7% 16.7%
EBIT 3,561 151 - (6) (69) 3,637 margin (%) 18.6% 1.9% 13.0%YoY GrowthRevenue 11.4% 22.6% 20.8% 28.9% 16.2%EBITDA 13.8% 46.4% 9.4%EBIT 14.2% 62.7% 5.7%
` MioConsolidated Financial Performance – Existing & New Breakup - (2/2)
Key Highlights
Total healthcare service(existing) EBITDA marginsexpanded from 23.4% in YTDDec FY13 to 23.9% in YTD DecFY14.
SAP EBITDA of Rs 323 mn(3.2% margin) in YTD DecFY14 as compared to Rs 221(2.7% margin) mn in YTD DecFY13.
AHLL – Cradle & Clinicsreported an EBITDA loss of Rs125 mn due to addition of 2Birthing Centers, new clinicsadded in the last fiscal &corporate overheads.

13
• Highlights
• Standalone Financial Performance
• Consolidated Financial Performance
• Operational Performance – Hospitals
• Operational Performance – Standalone Pharmacy
• Update on Projects
• Update on non-hospital JVs
Contents
14
Particulars YTD Dec FY 13
YTD Dec FY 14
Growth yoy (%)
YTD Dec FY 13
YTD Dec FY 14
Growth yoy (%)
YTD Dec FY 13
YTD Dec FY 14
Growth yoy (%)
YTD Dec FY 13
YTD Dec FY 14
Growth yoy (%)
YTD Dec FY 13
YTD Dec FY 14
Growth yoy (%)
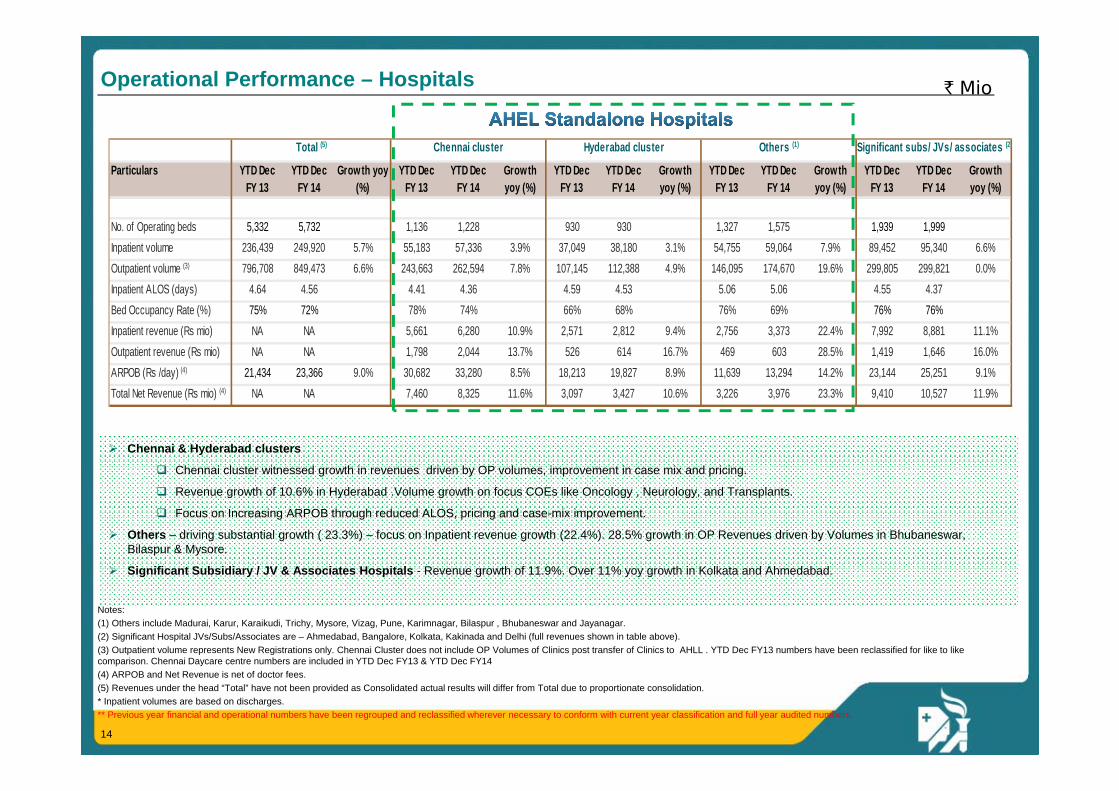
No. of Operating beds 5,332 5,732 1,136 1,228 930 930 1,327 1,575 1,939 1,999Inpatient volume 236,439 249,920 5.7% 55,183 57,336 3.9% 37,049 38,180 3.1% 54,755 59,064 7.9% 89,452 95,340 6.6%Outpatient volume (3) 796,708 849,473 6.6% 243,663 262,594 7.8% 107,145 112,388 4.9% 146,095 174,670 19.6% 299,805 299,821 0.0%Inpatient ALOS (days) 4.64 4.56 4.41 4.36 4.59 4.53 5.06 5.06 4.55 4.37Bed Occupancy Rate (%) 75% 72% 78% 74% 66% 68% 76% 69% 76% 76%Inpatient revenue (Rs mio) NA NA 5,661 6,280 10.9% 2,571 2,812 9.4% 2,756 3,373 22.4% 7,992 8,881 11.1%Outpatient revenue (Rs mio) NA NA 1,798 2,044 13.7% 526 614 16.7% 469 603 28.5% 1,419 1,646 16.0%ARPOB (Rs /day) (4) 21,434 23,366 9.0% 30,682 33,280 8.5% 18,213 19,827 8.9% 11,639 13,294 14.2% 23,144 25,251 9.1%Total Net Revenue (Rs mio) (4) NA NA 7,460 8,325 11.6% 3,097 3,427 10.6% 3,226 3,976 23.3% 9,410 10,527 11.9%
Total (5) Chennai cluster Hyderabad cluster Others (1) Significant subs/ JVs/ associates (2)
Notes:(1) Others include Madurai, Karur, Karaikudi, Trichy, Mysore, Vizag, Pune, Karimnagar, Bilaspur , Bhubaneswar and Jayanagar.(2) Significant Hospital JVs/Subs/Associates are – Ahmedabad, Bangalore, Kolkata, Kakinada and Delhi (full revenues shown in table above).(3) Outpatient volume represents New Registrations only. Chennai Cluster does not include OP Volumes of Clinics post transfer of Clinics to AHLL . YTD Dec FY13 numbers have been reclassified for like to like comparison. Chennai Daycare centre numbers are included in YTD Dec FY13 & YTD Dec FY14(4) ARPOB and Net Revenue is net of doctor fees.(5) Revenues under the head “Total” have not been provided as Consolidated actual results will differ from Total due to proportionate consolidation.* Inpatient volumes are based on discharges.** Previous year financial and operational numbers have been regrouped and reclassified wherever necessary to conform with current year classification and full year audited numbers.
Chennai & Hyderabad clusters
Chennai cluster witnessed growth in revenues driven by OP volumes, improvement in case mix and pricing.
Revenue growth of 10.6% in Hyderabad .Volume growth on focus COEs like Oncology , Neurology, and Transplants.
Focus on Increasing ARPOB through reduced ALOS, pricing and case-mix improvement.
Others – driving substantial growth ( 23.3%) – focus on Inpatient revenue growth (22.4%). 28.5% growth in OP Revenues driven by Volumes in Bhubaneswar, Bilaspur & Mysore.
Significant Subsidiary / JV & Associates Hospitals - Revenue growth of 11.9%. Over 11% yoy growth in Kolkata and Ahmedabad.
` MioOperational Performance – Hospitals
15
• Highlights
• Standalone Financial Performance
• Consolidated Financial Performance
• Operational Performance – Hospitals
• Operational Performance – Standalone Pharmacy
• Update on Projects
• Update on non-hospital JVs
Contents

16
Batch Particulars Q3 FY 13 Q3 FY 14 yoy %YTD Dec
FY 13YTD Dec
FY 14 yoy %No of Stores 461 437 461 437 Revenue/store 2.65 2.97 11.9% 7.69 8.60 11.8%EBITDA /store 0.14 0.17 0.40 0.48 EBITDA Margin % 5.4% 5.8% 36 bps 5.3% 5.6% 33 bps
No of Stores 205 196 205 196 Revenue/store 2.24 2.61 16.6% 6.47 7.45 15.3%EBITDA /store 0.05 0.08 50.5% 0.15 0.21 39.7%EBITDA Margin % 2.3% 3.0% 68 bps 2.3% 2.8% 50 bps
No of Stores 193 186 193 186 Revenue/store 2.03 2.32 14.4% 5.78 6.70 16.0%EBITDA /store 0.06 0.10 66.4% 0.17 0.27 64.5%EBITDA Margin % 3.1% 4.5% 139 bps 2.9% 4.1% 121 bps
No of Stores 1,445 1,586 1,445 1,586 Revenue/store 2.01 2.25 11.9% 5.64 6.30 11.7%EBITDA /store 0.05 0.08 0.15 0.20 EBITDA Margin % 2.7% 3.4% 71 bps 2.7% 3.2% 51 bpsTotal Revenues 2,905 3,571 22.9% 8,158 10,000 22.6%EBITDA 78.1 122.3 221.0 323.4 EBITDA Margin % 2.7% 3.4% 74 bps 2.7% 3.2% 53 bps
3,023 3,336 135 161
Total No. of Employees 9,195 10,403
Upto FY 2008 Batch
FY 2009 Batch
FY 2010 Batch
Total
Capital Employed ( Rs Mio)Capex (Rs Mio)
` MioOperational Performance – Standalone Pharmacy
Gross stores added 35 and stores closed 9 during this quarter. Net addition of 83 stores in the nine months. No. of stores as on 31st Dec 2013 is 1,586 .
LFL (Like-for-like) Revenue per store growth for pre FY2008 batch of stores is 11.8% (yoy) and FY 2009 batch is 15.3% (yoy).
Key Highlights
Revenues at Rs. 10,000 mio, 22.6% yoy growth.
EBITDA of Rs. 323 mio in YTD Dec FY14 as compared to Rs. 221 mio in YTD Dec FY13
EBITDA margins of FY 2007 batch of stores (most mature) at 6.1%.

17
• Highlights
• Standalone Financial Performance
• Consolidated Financial Performance
• Operational Performance – Hospitals
• Operational Performance – Standalone Pharmacy
• Update on Projects
• Update on non-hospital JVs
Contents
18
*Expected date of completion
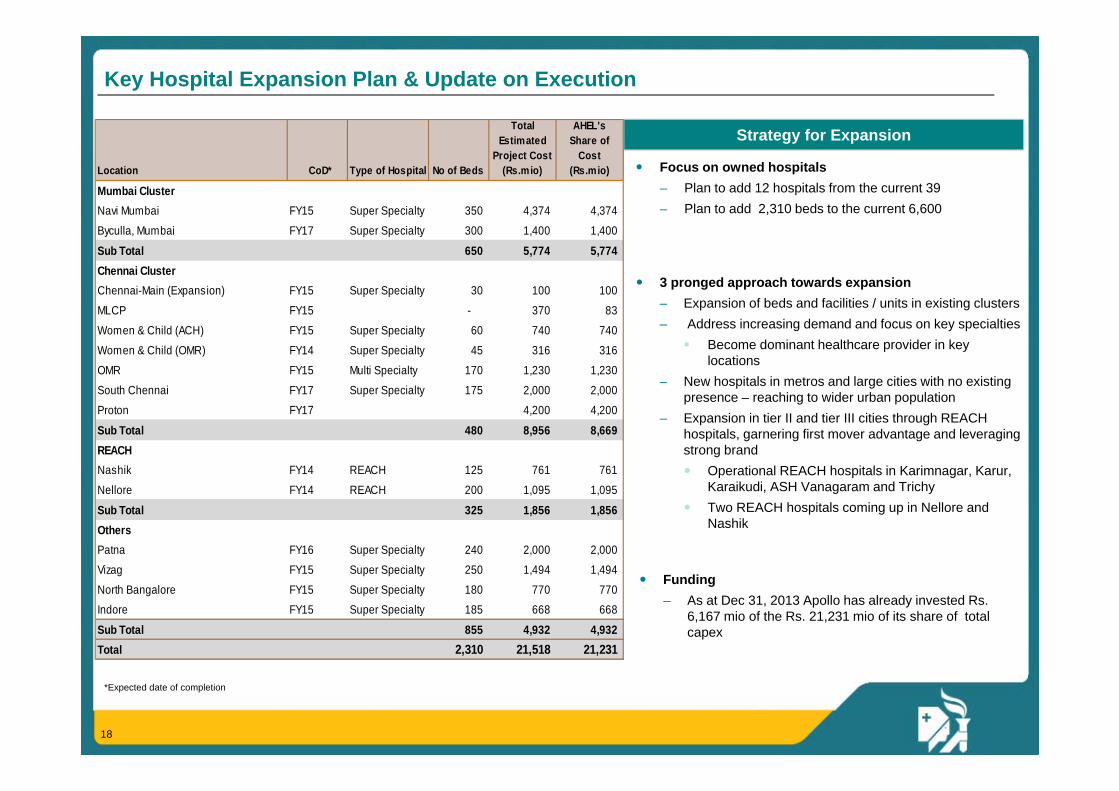
Key Hospital Expansion Plan & Update on Execution
Focus on owned hospitals– Plan to add 12 hospitals from the current 39– Plan to add 2,310 beds to the current 6,600
3 pronged approach towards expansion– Expansion of beds and facilities / units in existing clusters– Address increasing demand and focus on key specialties
Become dominant healthcare provider in key locations
– New hospitals in metros and large cities with no existing presence – reaching to wider urban population
– Expansion in tier II and tier III cities through REACH hospitals, garnering first mover advantage and leveraging strong brand Operational REACH hospitals in Karimnagar, Karur,
Karaikudi, ASH Vanagaram and Trichy Two REACH hospitals coming up in Nellore and
Nashik
Strategy for Expansion
Funding– As at Dec 31, 2013 Apollo has already invested Rs.
6,167 mio of the Rs. 21,231 mio of its share of total capex
Location CoD* Type of Hospital No of Beds
TotalEstimated
Project Cost (Rs.mio)
AHEL's Share of
Cost (Rs.mio)
Mumbai ClusterNavi Mumbai FY15 Super Specialty 350 4,374 4,374
Byculla, Mumbai FY17 Super Specialty 300 1,400 1,400
Sub Total 650 5,774 5,774 Chennai ClusterChennai-Main (Expansion) FY15 Super Specialty 30 100 100
MLCP FY15 - 370 83
Women & Child (ACH) FY15 Super Specialty 60 740 740
Women & Child (OMR) FY14 Super Specialty 45 316 316
OMR FY15 Multi Specialty 170 1,230 1,230
South Chennai FY17 Super Specialty 175 2,000 2,000
Proton FY17 4,200 4,200
Sub Total 480 8,956 8,669 REACHNashik FY14 REACH 125 761 761
Nellore FY14 REACH 200 1,095 1,095
Sub Total 325 1,856 1,856 OthersPatna FY16 Super Specialty 240 2,000 2,000
Vizag FY15 Super Specialty 250 1,494 1,494
North Bangalore FY15 Super Specialty 180 770 770 Indore FY15 Super Specialty 185 668 668
Sub Total 855 4,932 4,932 Total 2,310 21,518 21,231
19
• Highlights
• Standalone Financial Performance
• Consolidated Financial Performance
• Operational Performance - Hospitals
• Operational Performance - Standalone Pharmacy
• Update on Projects
• Update on non-hospital JVs
Contents

20
` MioUpdate on non-hospital JVs
Previous year figures have been reworked/ regrouped /rearranged and reclassified wherever necessary to conform to the requirement of revised Schedule VI format
During YTD Dec FY14, the company achieved a Gross Written Premium (GWP) of Rs. 3,729 mio against a GWP of Rs. 3,591 mio in YTD Dec FY13.
EBITDA loss of Rs. 190 mio in YTD Dec FY14 as compared to a positive EBITDA of Rs. 6 mio in YTD Dec FY13
PAT loss of Rs. 234 mio in YTD Dec FY14 in comparison to a loss of Rs 56 mio in YTD Dec FY13 .
The incurred claim loss ratio was at 66.5% in YTD Dec FY14
The Assets under Management stood at Rs. 4,947 mio as on Dec 31, 2013.
The Company now has 52 offices across the country.
Particulars Q3 FY 13 Q3 FY 14 yoy (%)YTD Dec
FY 13YTD Dec
FY 14 yoy (%)
Total Income 1,249 1,455 16.5% 3,500 4,319 23.4%
EBITDA (18) (144) 6 (190)
Profit after Tax (39) (159) (56) (234)

21
Q & A
22
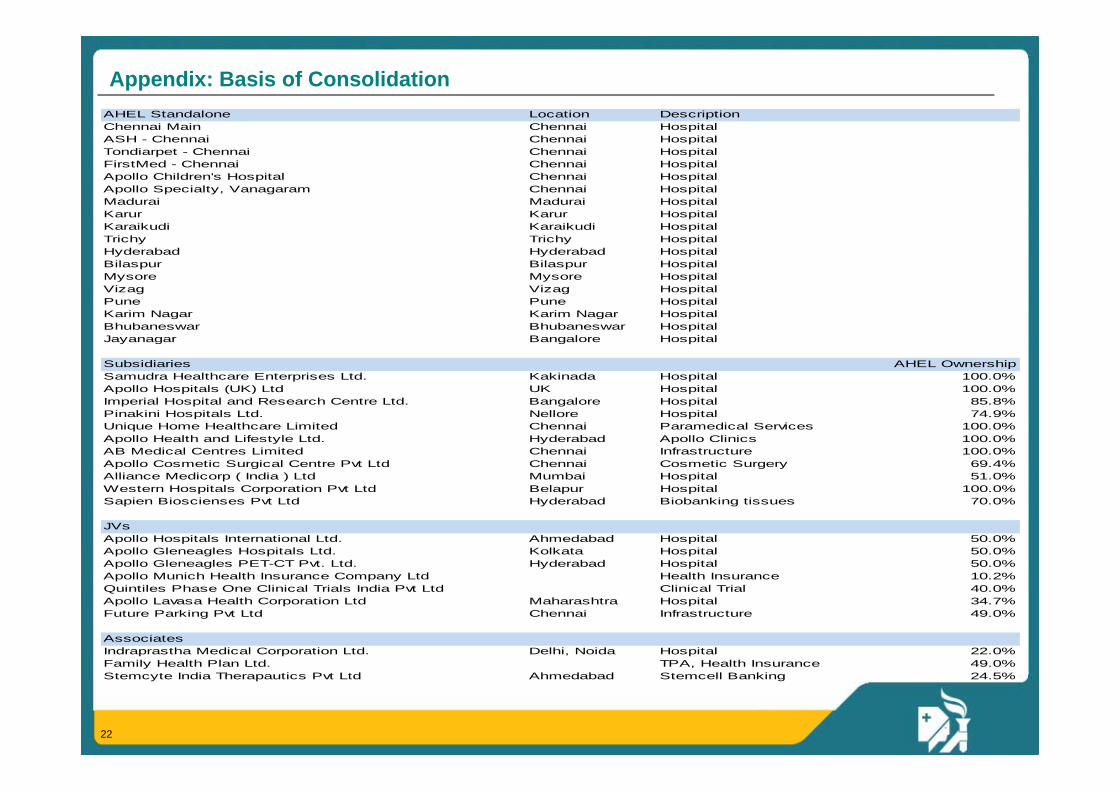
Appendix: Basis of ConsolidationAHEL Standalone Location DescriptionChennai Main Chennai HospitalASH - Chennai Chennai HospitalTondiarpet - Chennai Chennai HospitalFirstMed - Chennai Chennai HospitalApollo Children's Hospital Chennai HospitalApollo Specialty, Vanagaram Chennai HospitalMadurai Madurai HospitalKarur Karur HospitalKaraikudi Karaikudi HospitalTrichy Trichy HospitalHyderabad Hyderabad HospitalBilaspur Bilaspur HospitalMysore Mysore HospitalVizag Vizag HospitalPune Pune HospitalKarim Nagar Karim Nagar HospitalBhubaneswar Bhubaneswar HospitalJayanagar Bangalore Hospital
Subsidiaries AHEL OwnershipSamudra Healthcare Enterprises Ltd. Kakinada Hospital 100.0%Apollo Hospitals (UK) Ltd UK Hospital 100.0%Imperial Hospital and Research Centre Ltd. Bangalore Hospital 85.8%Pinakini Hospitals Ltd. Nellore Hospital 74.9%Unique Home Healthcare Limited Chennai Paramedical Services 100.0%Apollo Health and Lifestyle Ltd. Hyderabad Apollo Clinics 100.0%AB Medical Centres Limited Chennai Infrastructure 100.0%Apollo Cosmetic Surgical Centre Pvt Ltd Chennai Cosmetic Surgery 69.4%Alliance Medicorp ( India ) Ltd Mumbai Hospital 51.0%Western Hospitals Corporation Pvt Ltd Belapur Hospital 100.0%Sapien Bioscienses Pvt Ltd Hyderabad Biobanking tissues 70.0%
JVsApollo Hospitals International Ltd. Ahmedabad Hospital 50.0%Apollo Gleneagles Hospitals Ltd. Kolkata Hospital 50.0%Apollo Gleneagles PET-CT Pvt. Ltd. Hyderabad Hospital 50.0%Apollo Munich Health Insurance Company Ltd Health Insurance 10.2%Quintiles Phase One Clinical Trials India Pvt Ltd Clinical Trial 40.0%Apollo Lavasa Health Corporation Ltd Maharashtra Hospital 34.7%Future Parking Pvt Ltd Chennai Infrastructure 49.0%
AssociatesIndraprastha Medical Corporation Ltd. Delhi, Noida Hospital 22.0%Family Health Plan Ltd. TPA, Health Insurance 49.0%Stemcyte India Therapautics Pvt Ltd Ahmedabad Stemcell Banking 24.5%

23
Number of operating beds
Occupancy
AvLOS
ARPOB / day
x
x
x
In-patient Bed Days
Average Length of Stay per In-patient
Average Revenue Per Occupied Bed Day
Description
In-patient Bed Days Billed
In-Patient Bed Days / In-Patient Admissions
(IP Revenue1 + OP Revenue + Hospital Based Pharmacy Revenue) /IP Bed Days
Formula / Calculation
Project execution Capital Expenditure
Brand Doctor reputation Quality of outcomes Competition
Case-Mix / Type of procedures Leverage technology and quality of
clinical care to shorten stay
Case-Mix / Type of procedures Better utilization of operational
theatres, medical equipment Pricing
Key Driver
1. Apollo does not include consultant fee in its IP Revenue reporting as consultants at Apollo operate on a fee-for-service model.
Contribution
x
Contribution Revenue – Variable costs
Purchasing efficiency Operating efficiency
Hospitals – Understanding Key Operating Metrics
Operating Beds