agriculture integrated growth and development plan 2012 · october 2012 agriculture, forestry and...
TRANSCRIPT

Agriculture, Forestry And Fisheries
2012
agriculture,forestry & fisheriesDepartment:Agriculture, Forestry and FisheriesREPUBLIC OF SOUTH AFRICA
Iintegrated growth and development Plan

october 2012
Agriculture, Forestry And Fisheries
integrated growthand development Plan

© 2012 All rights reserved
Published by the Department of Agriculture, Forestry and Fisheries
Layout by Directorate Communication Services Private Bag X144, Pretoria, 0001 South Africa
Obtainable from Resource Centre Directorate Knowledge and Information Management Private Bag X388 Pretoria 0001
ISBN 978-1-86871-349-3

Contents
Acronyms ....................................................................................................................................................................................................................................... vi
Foreword by the Minister ................................................................................................................................................................................................. vii
statement by the deputy Minister ........................................................................................................................................................................... ix
overview by the Acting director-general .......................................................................................................................................................... x
1. introduction ............................................................................................................................................................................................................... 1
2. situation analysis ................................................................................................................................................................................................... 32.1 Sector profile ................................................................................................................................................................................................................ 3
2.1.1 Agriculture ..................................................................................................................................................................................................................... 3
2.1.2 Forestry ............................................................................................................................................................................................................................ 8
2.1.3 Fisheries ........................................................................................................................................................................................................................... 12
2.2 The Role of State Owned Enterprises ........................................................................................................................................................... 14
2.3 Policy Framework ...................................................................................................................................................................................................... 16
2.3.1 Introduction ................................................................................................................................................................................................................. 16
2.3.2 White papers ................................................................................................................................................................................................................ 16
2.3.3 National Policies and Programmes ................................................................................................................................................................ 19
2.3.4 Regional policies and programmes ............................................................................................................................................................... 27
2.2.5 Conclusion—policy framework ....................................................................................................................................................................... 29
3. current realities and challenges ................................................................................................................................................................ 313.1 Equity and transformation .................................................................................................................................................................................. 32
3.1.1 Rationale ......................................................................................................................................................................................................................... 32
3.1.2 Problems and causal factors ............................................................................................................................................................................... 33
3.1.3 Types of interventions required ....................................................................................................................................................................... 35
3.2 Equitable Growth and Competitiveness .................................................................................................................................................... 36
3.2.1 Rationale ......................................................................................................................................................................................................................... 36
3.2.2 Problems and causal factors ............................................................................................................................................................................... 36
3.2.3 Types of interventions required ....................................................................................................................................................................... 40
3.3 Ecological sustainability ........................................................................................................................................................................................ 41
3.3.1 The challenge and why it is a key one ......................................................................................................................................................... 41
3.3.2 Problems and causal factors ............................................................................................................................................................................... 43
3.3.3 Interventions required ........................................................................................................................................................................................... 44
3.4 Governance .................................................................................................................................................................................................................. 45
3.4.1 Support services ........................................................................................................................................................................................................ 46
3.4.2 Skills development ................................................................................................................................................................................................... 47
3.4.3 Research and development ............................................................................................................................................................................... 47
iv Agriculture, Forestry and Fisheries IGDP: Contents
3.4.4 Knowledge and information management ............................................................................................................................................. 47
3.4.5 Market access, information and regulation .............................................................................................................................................. 47
3.4.6 Integrated spatial planning ................................................................................................................................................................................ 47
3.4.7 Institutional arrangements ................................................................................................................................................................................. 48
3.4.8 Disaster/risk management .................................................................................................................................................................................. 48
3.4.9 Compliance and enforcement .......................................................................................................................................................................... 48
4. implementation of frameworks ................................................................................................................................................................. 494.1 Vision for the sector ................................................................................................................................................................................................. 49
4.2 Purpose of the IGDP ................................................................................................................................................................................................ 49
4.3 Sector goals, objectives and interventions ............................................................................................................................................... 50
4.3.1 (A) Equity and transformation ........................................................................................................................................................................... 51
4.3.2 (B) Equitable growth and competitiveness .............................................................................................................................................. 54
4.3.2 (C) Environmental sustainability ...................................................................................................................................................................... 56
4.3.4 (D) Governance .......................................................................................................................................................................................................... 57
5. igdP implementation Plan ............................................................................................................................................................................ 595.1 Spatial planning for the Implementation Plan ....................................................................................................................................... 59
5.2 Political leadership ................................................................................................................................................................................................... 59
5.3 Administration ............................................................................................................................................................................................................ 60
5.4 Ministerial Service Delivery Forum ................................................................................................................................................................. 60
5.5 Priority Setting ............................................................................................................................................................................................................ 61
6. Monitoring and evaluation framework ................................................................................................................................................ 636.1 Introduction ................................................................................................................................................................................................................. 63
6.2 Monitoring and Evaluation System ............................................................................................................................................................... 63
6.3 Monitoring processes ............................................................................................................................................................................................. 64
6.3.1 Development and definition of indicators ................................................................................................................................................ 64
6.3.2 Data collection mechanisms ............................................................................................................................................................................. 64
6.3.3 Reporting on the progress made on implementation ...................................................................................................................... 64
6.3.4 Data verification and validation ....................................................................................................................................................................... 65
6.3.5 Programme/sector evaluation .......................................................................................................................................................................... 65
6.3.6 Distribution and feedback mechanisms ..................................................................................................................................................... 65
6.4 Monitoring and evaluation responsibilities .............................................................................................................................................. 65
6.5 Proposed M&E framework envisaged for the sector ........................................................................................................................... 65
bibliography ............................................................................................................................................................................................................................... 67
glossary .......................................................................................................................................................................................................................................... 69
Agriculture, Forestry and Fisheries IGDP: Contents v
Figures
Fig. 1 Indices of the volume of the agricultural production ............................................................................................................... 4
Fig. 2 Aggregate net farm income ...................................................................................................................................................................... 5
Fig. 3 The contribution of agriculture, forestry and fisheries to GDP ............................................................................................ 5
Fig. 4 Employment in primary agriculture by quarter ............................................................................................................................ 6
Fig. 5 Extension staff and total staff complements, by province ..................................................................................................... 7
Fig. 6 Round wood production ............................................................................................................................................................................. 10
Fig. 7 Comparison of gross value of output .................................................................................................................................................. 10
Fig. 8 The contribution of forestry and forestry products to GDP ................................................................................................... 11
Fig. 9 The three pillars of sustainable development ................................................................................................................................ 30
Fig. 10 Challenges or constraints to be addressed ...................................................................................................................................... 31
Fig. 11 Problem tree analysing challenges faced within the sectors ............................................................................................... 32
Fig. 12 Problem tree analysing jobless, inequitable growth .................................................................................................................. 34
Fig. 13 Urbanisation levels from the 2001 census ........................................................................................................................................ 35
Fig. 14 Problem tree analysing suboptimal economic growth ........................................................................................................... 37
Fig. 15 Self-sufficiency indices of selected agricultural commodities ............................................................................................. 39
Fig. 16 Key challenges – ecological sustainability ........................................................................................................................................ 41
Fig. 17 Ecosystem services and dis-services to and from agriculture .............................................................................................. 42
Fig. 18 Sector goals, objectives and interventions ...................................................................................................................................... 51
Fig. 19 Ministerial Advisory Committee .............................................................................................................................................................. 61
Fig. 20 M&E framework ................................................................................................................................................................................................. 66
tables
Table 1 Black subsistence and smallholder households receiving support by type of support, 2010 .......................... 7
Table 2 Distribution of forests .................................................................................................................................................................................... 8
Table 3 The forestry sector in South Africa ......................................................................................................................................................... 9
Table 4 Small growers in the forestry sector ..................................................................................................................................................... 9
Table 5 Equity ownership in forestry ...................................................................................................................................................................... 11
Table 6 Participants in the fisheries sector and the BEE profile of the sector ............................................................................... 14
Table 7 Alignment of MTSF priorities and key outcomes ......................................................................................................................... 22
Table 8 Key outcomes to which the DAFF must contribute ................................................................................................................... 22
Table 9 Urban farming by province in South Africa ..................................................................................................................................... 36
Table 10 CASP expenditure, projects and beneficiaries ................................................................................................................................ 46
Table 11 Alignment of key sector challenges, sector goals and strategic outcomes ................................................................ 50
Table 12 Equity and transformation – Sector objectives, results and key role players .............................................................. 52
Table 13 Equitable growth and competitiveness – Sector objectives, results and key role players ................................. 54
Table 14 Environmental sustainability – Sector objectives, results and key role players ......................................................... 56
Table 15 Governance – Sector objectives, results and key role players .............................................................................................. 57
box
Box 1 Forestry BBBEE charter undertakings ................................................................................................................................................... 27

AISP Agricultural Input Support ProgrammeANC African National CongressARC Agriculture Research CouncilAsgiSA Accelerated and Shared Growth Initiative for
South AfricaBEE Black Economic EmpowermentBBBEE Broad-Based Black Economic EmpowermentBCLME Benguela Current Large Marine EcosystemBER Bureau of Economic ResearchCAADP Comprehensive Africa Agricultural Development
ProgrammeCCAMLR Convention on the Conservation of Antarctic
Marine Living ResourcesCARWG Conservation Agriculture Regional Working
Group CASP Comprehensive Agricultural Support
ProgrammeCRDP Comprehensive Rural Development ProgrammeDAFF Department of Agriculture, Forestry and
FisheriesEDD Economic Development DepartmentDRDLR Departments of Rural Development and Land
Reformdti Department of Trade and IndustryEBM Ecosystem-Based ManagementEIU Economist Intelligence UnitEU European UnionFAO Food and Agricultural Organisation of the
United NationsFAPRI Food and Agricultural Policy Research InstituteFED Forestry Enterprise DevelopmentFIP Fruit Industry ProgrammeFSP Farmer Settlement ProgrammeFTA Free Trade AreaGATT General Agreement on Tariffs and TradeGDP Gross Domestic ProductGEF Global Environment FacilityGGP Gross Geographic ProductHDI Historically Disadvantaged IndividualICCAT International Commission for Conservation of
Atlantic TunasIGDP Integrated Growth and Development PlanIIED International Institute for Environment and
DevelopmentIMF International Monetary FundIOTC Indian Ocean Tuna CommissionIP Intellectual Property
IPAP Industrial Policy Action PlanIUCN International Union for Conservation of NatureLARP Land and Agrarian Reform ProjectLDSP Livelihoods Development Support ProgrammeLIMS Livestock Information Management SystemLRAD Land Redistribution for Agricultural
Development ProgrammeM&E Monitoring & EvaluationMAFF Ministry of Agriculture, Forestry and FisheriesMafisa Micro Agricultural Financial Institutional Scheme
of South AfricaNAMC National Agricultural Marketing CouncilMPA Marine Protected AreaMTEF Medium Term Expenditure FrameworkMTSF Medium Term Strategic FrameworkNEPAD New Partnership for Africa’s DevelopmentNFAP National Forestry Action ProgrammeNFP National Forestry ProgrammeNIPF National Industrial Policy FrameworkNTB Non-Trade BarrierOBPM Outcome Based Performance ManagementOECD Organisation for Economic Cooperation and
DevelopmentPES Payments for Ecosystem ServicesPSE Producer Support EstimateR&D Research and DevelopmentREDD Reducing Emissions from Deforestation and
DegradationRFMO Regional Fisheries Management OrganisationsSACU Southern African Customs UnionSADC Southern African Development CommunitySAFEX South African Futures ExchangeSEAFO South East Atlantic Fisheries OrganizationSESP Second Economy Strategy ProjectSG Sector GoalSMME Small Medium and Micro EnterprisesSOE State-Owned EnterprisesSDA Service Delivery AgreementsSPSAA Strategic Plan for South African AgricultureSPGRC SADC Plant Genetic Resources CentreSWIOFC South West Indian Ocean Fisheries CommissionTIPS Trade and Industrial Policy StrategiesUNDP United Nations Development ProgrammeUNEP United Nations Environment ProgrammeUS United StatesWTO World Trade Organization
Acronyms

Foreword by the Minister
Ms Tina Joemat-Pettersson
IIt gives me great pleasure to present the Integrated Growth and Development Plan (IGDP) for Agriculture, Forestry and Fisheries which outlines key areas of development for the sector. This is the first time that the three subsectors of agriculture, forestry and fisheries have developed a common vision and integrated implementation framework.
South Africa’s agriculture, forestry and fisheries sector has not grown as fast as other sectors over the past few decades, but remains a criti-cal sector for employment and food security among the country’s rural poor in particular and is thus, a sector in which development opportu-nities should be vigorously pursued and not overlooked. According to our Constitution, every citizen has the right to have access to sufficient food and water and the State must, within its available resources, avail to progressive realisation of the right to sufficient food. Right now, a fifth of South African households have inadequate access to food and we need to do something about this through developing a prosperous sector that provides people with a hand out of poverty. At the same time, the direct reliance of the sector on South Africa’s natural capital, means that we have a tremendous responsibility to maintain the fragile balance between achieving rural development within the constraints required for assuring ecological sustainability, such that the opportunities avail-able to our grandchildren are not compromised.
The IGDP describes the current realities and challenges of the agriculture, forestry and fisheries sector and outlines the goals, objectives and interventions that need to be made to achieve the vision of “an equitable, productive, competitive and sustainable agriculture, forestry and fisheries sector, growing to the benefit of ALL South Africans”.
The IGDP takes its cue from the twelve outcomes identified in the Medium Term Strategic Framework to address the country’s key challenges. Achieving these outcomes will rely on intergovernmental cooperation in the implementation of key policies including the New Growth Path, National Development Plan, the Industrial Policy Action Plan II, the Com-prehensive Rural Development Programme (CRDP) as well as this Integrated Growth and Development Plan (IGDP) for

agriculture, forestry and fisheries. In terms of the outcomes, the DAFF contributes directly to three of the 12 outcomes – to achieve decent employment through inclusive economic growth (Outcome 4), to have vibrant, equitable and sustainable rural communities contributing towards food security for all (Outcome 7) and to protect and enhance our environmental assets and natural resources (Outcome 10). The IGDP will play a crucial role in achieving these three outcomes and DAFF remains committed to working together with the industry in implementing the interventions that have been identified.
In achieving the three outcomes, the goals of the IGDP include attaining equity and transformation, equitable growth and competitiveness, environmental sustainability and good governance. Among the work we have outlined for ourselves, is the refinement of the Agricultural Black Economic Empowerment (AgriBEE) Charter to address transformation constraints in the sector. We further propose to publish the AgriBEE Charter in terms of section 9 of the Broad-Based Black Economic Empowerment Act, 2003 (Act No. 53 of 2003), in order to pave the way for implementation and enforcement. The Forestry Charter, the most advanced of the three sectors, must be implemented. A charter for fisheries needs to be developed and is a priority for the department.
In conclusion, I wish to extend my appreciation to my Deputy Minister, Dr Pieter Mulder and the Director-General, Mr Langa Zita, for their dedication, expertise and support. Secondly, I would like to express my gratitude to the Chairpersons and Members of the Portfolio and Select Committees on Agriculture, Forestry and Fisheries in the National Assembly and the National Council of Provinces for their guidance, knowledge and oversight. I would further like to thank the agricultural industry, organised agriculture and our agribusiness partners for their continued efforts to achieve economic prosperity of the sector. Lastly, I want to thank the department, provincial departments and state-owned entities for their commitment in meeting the objectives of the department. By working together, we can achieve our vision!
Ms tina Joemat-PetterssonMINISTER OF AGRICULTURE, FORESTRY AND FISHERIES
Vision statement
“Equitable, productive, competetive, profitable and sustainable
agriculture, forestry and fisheries sectors, growing to the benefit of
all South Africans”.
Statement by the Deputy Minister
Dr Pieter Mulder
AAs we present the Integrated Growth and Development Plan (IGDP) for Agriculture, Forestry and Fisheries, I believe that it is important to remember the cliché, stating that any plan is only as good as its execution.
To farm successfully in today’s challenging agricultural environment requires much more than only the desire to farm. One needs agricultural knowledge, financial expertise, mechanisation, marketing, production, etc. to succeed as a farmer. I am however, proud to say that South Africa has some of the best farmers in the world. Our farmers overcome enor-mous difficulties, including climate challenges like floods and droughts and compete in international markets where farmers from other coun-tries enjoy governmental protectionism and subsidies.
Both commercial and emerging farmers are important role players in making a success of agriculture in South Africa. The great challenge in the next number of years will be to find the right balance between these role players. The IGDP provides a structural view of the sectors’ current circumstances and the challenges we face. It further describes the goals and the actions needed to achieve South Africa’s vision for agriculture, forestry and fisheries management and in so doing ensur-ing productive and sustainable sectors.
The agriculture, forestry and fisheries sector faces many challenges and has not shown the same growth over the last decade as other sectors. I believe that we can be successful if we build strong productive partnerships between the department, SOEs, the relevant organisations and the private sector. It is key that we base our decisions and policy-making on facts and do so in the best interest of South Africa. This approach will ensure the successful execution of the IGDP and yield the much needed job creation within the sectors.
I wish to thank the Minister, the Director-General, the department, organized agriculture and the industry for their co - operation. We do not have any other option but to make agriculture, forestry and fisheries succeed.
dr Pieter Mulder, MPDEPUTY MINISTER: AGRICULTURE, FORESTRY AND FISHERIES

Overview by the Acting Director-General
Mr S.I.S. Ntombela
TThe Department of Agriculture, Forestry and Fisheries was created by means of amalgamating the previous Department of Agriculture, with the forestry and fisheries branches previously situated in other national departments. The process has been time-consuming and challenging, however the rationale was always clear. Agriculture, forestry and fisher-ies have a strong affinity with one another because they are primarily resource-based and largely rural. While many of the key interventions in these three sectors are and will likely remain distinct, the sectors share a number of common strategic questions which are usefully considered together: How can we ensure that the respective growth paths become more inclusive? What should sectorial development look like? What market dynamics are at work in shaping these sectors and how could we influence these to work to the benefit of all South Africans? How can we promote growth without compromising the integrity of the under-lying natural resource base? How can better care of the natural resource base promote stronger growth? How can we implement our policies and programmes more efficaciously for the common good while keep-ing an eye on the most vulnerable?
This Integrated Growth and Development Plan (IGDP) for Agriculture, Forestry and Fisheries explores the commonalities and differences between the
three sectors while addressing these core, strategic questions. It represents our first effort to do so and should be under-stood as the beginning of a work-in-progress. As a guiding vision for DAFF, the document in effect replaces the Strategic Plan for South African Agriculture, which was published in 2001. That document served the previous Department of Agri-culture very well; while the IGDP builds on it in numerous respects, its scope is necessarily expanded and the analysis updated.
The IGDP has a logical structure. After a brief introduction, it sets out a concise analysis of the current situation in respect of our three sectors, focusing both on recent performance as well as on the underlying institutional and policy frame-works. Chapter 3 then delves into four key themes, which in essence constitute the building blocks of sustainable devel-opment: equity and transformation, growth and competitiveness, ecological sustainability and governance. By organising the discussion according to these building blocks, we can see where we are doing well, where we fall short and where we should look for answers in order to sustainably advance our three sectors in pursuit of our main objectives. Thereafter, Chapters 4 through 7 seek to methodically translate the high-level analysis and discussion into the practical measures necessary to effect the changes we wish to see.
I believe this preliminary effort bears out the wisdom of having brought together agriculture, forestry and fisheries under one roof. It brings greater clarity to the challenges and tasks before us, to the advantage of all three sectors individually as well as collectively.
Finally, I wish to take this opportunity to express my gratitude to the Minister, the Deputy Minister and the Chairpersons of the Parliamentary Committees for their support and guidance. Furthermore, I would like to extend my appreciation to the DAFF staff who participated in the development of the IGDP, as well as the reference group members representing industry and academia.
Mr s.i.s. ntombelaACTING DIRECTOR-GENERAL: AGRICULTURE, FORESTRY AND FISHERIES

1Introduction
DDespite the small direct share of the total Gross Domestic Product (GDP), agriculture, forestry and fisheries are vital to South Africa and its economy. These sectors furnish some of the most important material needs of South Africans, such as food and fibre, while providing large numbers of jobs and self-employment opportunities. However, the sectors are not fulfill ing their potential, particularly in terms of job creation. What constrains these sectors from meeting their potential? Indeed, what accounts for the fact that employment continues to decline, and what can be done about it?
The Integrated Growth and Development Plan (IGDP) has been developed to provide a long-term strategy for the growth and development of South Africa’s agriculture, forestry and fisheries sectors, to enable them to address key national priorities and outcomes. The purpose is to develop a common vision encompassing all three sectors, and to develop an integrated implementation framework which allows common issues to be addressed in unison, and specific issues to be addressed in separate policies and strategies. The IGDP is furthermore a response of the Minister to the national goals outlined in the Medium Term Strategic Framework (MTSF) document, adopted in July 2009 and stated through the 12 Outcomes identified during the January 2010 Lekgotla.
The last half century has seen substantive shifts in the structure of South Africa’s agricultural sector. Farm size has grown, farm numbers have declined and production has increasingly emphasised higher-value commodities, notably a range of horticultural crops. The agriculture sectors’ share of GDP has been steadily declining for many decades. From 1965 to 2009, agriculture’s share of total GDP declined from over 9% to around 3%. Currently, primary agriculture contributes about 3% to South Africa’s gross domestic product (GDP) and about 7% to formal employment. However, there are strong link-ages into the economy, so that the agro-industrial sector contributes about 12% of GDP. Given these realities, it is argued within the context of the IGDP that the role of the agricultural sector lies in ensuring national and household-level food security; ensuring social and economic growth and development through job creation; and contributing to rural socio-economic development. The Strategic Plan for South African Agriculture (also known as the ‘Sector Plan’) was published in 2001 and it presented a shared perspective between the government and industry on strategic issues in the sector. Strategic goals identified in this plan included enhanced access and participation; competitiveness and profitability; and sustainable resource management. A review of the Strategic Plan completed in 2008, identified a number of ongoing concerns, namely the slow pace of implementation, limited implementation capacity within government and limited coverage and inadequate funding of some critical programmes. Other factors identified by the review as contributing to the lack of impact of the Strategic Plan included weak implementation capacity and the absence of a comprehensive implementation plan.
Forestry plays an important role in contributing to local and national economic output and social well-being, through the production of timber and non-timber forestry resources from plantation forests, natural forests and woodlands. Managing
2 Agriculture, Forestry and Fisheries IGDP: Introduction
forest resources requires flexibility to accommodate change. This may include pressure to address community needs, incorporation of conservation practices, water catchment management principles and new commercial and non-com-mercial opportunities for woodlands, forests and plantation use. The National Forestry Action Programme (NFAP) was published in 1997, with the expressed purpose of mobilising and organising national and international resources and catalysing action to implement programmes and plans in a coordinated manner. It set out the most important work to be done in the first three years of implementation, identified specific goals for each issue and provided a framework for implementing forestry policy as set out in the White Paper, i.e. to promote a thriving, equitable and sustainable forestry sector. A review of the NFAP in 2003, led to the development of the National Forestry Programme (NFP), using a globally-adopted framework for national forestry policy development, planning and implementation. It was designed to address forestry issues within the context of sustainable development, to link all government and non-government forestry plans and strategies and to maximise the contribution of forestry to poverty reduction. The process of developing a long-term strategy for the forestry sector was initiated in 2007. After a two-year period of consultation and deliberation between government and industry, the Forestry 2030 Roadmap was finalised. Among other things, this roadmap seeks to guide the forestry sector to realise its full potential to create jobs and wealth, as well as to promote biological diversity.
The fisheries sector has probably undergone the greatest changes in recent years through the reorganisation of fishing rights. It however, remains a challenge to balance the high demand for access to marine living resources as a means of household income and subsistence, with the need to ensure the environmental sustainability of resources. Being the meeting place of land and sea, the coast is a distinctive, complex and interconnected natural system with finite and vul-nerable resources that are impacted by perturbations such as pollution, inappropriate development and environmental degradation. It provides substantial opportunities for economic and social development, but care must be taken such that these can be enjoyed on a sustainable basis. Although there are detailed policies addressing the allocation and management of long-term commercial fishing rights, as well as the management, methodologies and procedures to be applied in specific subsectors, there is no encompassing plan for fisheries. The expectation is therefore that the IGDP will address this gap by providing strategic direction to the fisheries subsector.
The IGDP furthermore speaks to strategic plans within national government, including the Green Paper on Land Reform, the Comprehensive Rural Development Plan of the Department of Rural Development and Land Reform, the New Growth Path of the Economic Development Department and the National Development Plan (Vision 2030) of the National Plan-ning Commission within the Presidency. At a strategic level, the IGDP for Agriculture, Forestry and Fisheries thus seeks to be consistent with emerging policy directions from elsewhere in government, while at a practical level, when devising actual interventions based on the IGDP, the DAFF will continuously strive to align itself with other departments’ activities through intergovernmental planning systems.
Ultimately, the IGDP seeks to identify what all role players must do in order to achieve the common vision of “equitable, productive, competitive and sustainable agriculture, forestry and fisheries sectors, growing to the benefit of all South Africans”.
Vision statement
“Equitable, productive, competetive, profitable and sustainable
agriculture, forestry and fisheries sectors, growing to the benefit of
all South Africans”.

2Situation analysis
2.1 sector ProFile
2.1.1 Agriculture
The 20th century saw substantive shifts in the structure of South Africa’s agricultural sector (Liebenberg et al., 2010). For the most part, these shifts involved the long-term, relative decline of the agricultural sector as the economy diversified, together with the relative decline of food prices. However, in more recent years, owing to new global realities, we have witnessed episodes of significant food price inflation, amidst growing volatility of food prices (Vermeulen & Meyer, 2009) and general economic instability. The concern over rising and more volatile food prices has prompted many countries to re-examine the economic and social role of the agricultural sector and South Africa is no exception. It is argued within the context of the IGDP that the importance of agriculture in the broader economic framework of South Africa must be re-emphasised, focussing in particular on:
• ensuringnationalandhousehold-levelfoodsecurity
• theeconomicgrowthanddevelopmentofagriculture
• ruraleconomicdevelopment.
It is within this context that the IGDP seeks to position agriculture for the purpose of improving national food safety and security and agricultural economic output in a profitable and sustainable manner, through a qualitative and quantita-tive improvement of South Africa’s agricultural productivity and its trade and regulatory environment. By achieving the aforementioned, agriculture can contribute vitally to rural economic growth and development and thus increase rural employment, both on and off-farm.
Types of producers
The agricultural sector subsumes three distinct types of producers:
(1) Commercial farmers number less than 40 000 and are predominantly white. They occupy approximately 82 million ha and appear to be responsible for more than 95% of South Africa’s formal marketed agricultural output. Since the mid-20th century, there has been a steady decline in the number of commercial farming units, resulting ultimately in a significant concentration of farm holdings. The process is complex, but among other things reflects the fact that as the South African economy has diversified, farming has become a relatively unattractive career choice, such that upon retirement many commercial farmers have no one to bequeath their farms to. Despite the decrease in the number of farming units, output from commercial agriculture has continued to grow, implying an increase in the efficiency of production. Export growth has continued, especially in the horticultural sector, however the robust trade surplus in the production of agricultural commodities is increasingly offset by the net import of processed foods. Trade figures show that for the past five years, agricultural exports have contributed on average about 6,5% of total South African exports. Exports increased from 5% (1988) to 46% (2009) of agricultural production. Farm exports of South Africa increased from R45 billion in 2008 to R46 billion in 2009 while imports decreased by 8,5% to R35 billion in 2009. Commercial farmers remain primarily family businesses, but there is a discernible trend towards the ‘corporatisation’ of farming, especially in some subsectors.
(2) Smallholder farmers number approximately 225 000 as of 2010, belonging to about 150 000 households, and are predominantly black. Most of these farmers are located in the former homeland areas of the country, which comprise about 14 mil lion ha of agricultural land, but which also accommodate far larger numbers of subsistence producers. Agricultural conditions within the former homelands are complex: on the one hand, infrastructure is poor and land degradation is widespread; on the other hand, some areas are characterised by seemingly large amounts of under-utilised arable land of good quality. Removing the impediments to fuller and more productive use of agricultural resources in the former homelands is a priority.

4 Agriculture, Forestry and Fisheries IGDP: Situation analysis
(3) Subsistence producers consist of approximately 2,8 million households who practise agriculture mainly for purposes of own-consumption, largely by means of gardening and small-scale animal husbandry. Few households involved in subsistence production are, or seek to be, fully self-sufficient in food. Rather subsistence production is widely seen either as a means of ensuring a basic level of nutrition or reducing the grocery bill.
Production
Production statistics generally capture trends among commercial producers and omit smallholder and subsistence pro-duction. The quantity of the total agricultural output grew at an average annual rate of 2,3% from 1975 to 2010. Over the same period, field crop production increased by 2,8%, horticultural production by 2,9% and livestock production by 2,3% per annum (see Fig. 1). The total area under field crops is projected to increase by more than 400 000 ha in 2012 on the back of significant improvements in profit margins in 2011 that boosted the cash flow positions of many farmers, as well as higher than expected commodity prices at the time of planting. By value, the largest component of the agricultural sector is livestock and livestock products, because of the fact that three quarters of the country’s farmland is mainly suit-able for livestock production, however, horticultural exports are capturing an increasing share of total agricultural output. Variations in crop production are largely derived from the variability in maize production, which is, in turn, influenced by climatic conditions, the producers’ willingness to plant and industry average yields. The farmers’ willingness to produce, is, in turn, influenced by the profitability of production i.e. price offers, both domestically and internationally and the suit-ability of the natural resource base. The tradeoffs between these factors influence the affordability and availability of food. However, self-sufficiency levels are currently below domestic consumption requirements for basic food commodities and are supplemented through imports, e.g. red meat, wheat and other livestock products. Research conducted by South Africa’s Competition Commission (Rakudu, 2008) further suggests that an increase in anti-competitive behaviour has negatively impacted on food productivity, food availability and affordability within the country. In 2011 it was reported that predation costs South Africa’s small-stock industry about R1,4 billion a year. Stock theft is also a major concern which impacts heavily on small livestock farmers. Scholtz & Bester (2010) report that 87% of cattle stolen annually are from com-munal areas.
160
140
120
100
80
60
40
20
0
Inde
x (2
005
= 10
0)
Year
1975 1977 1979 1981 1983 1985 1987 1989 1991 1993 1995 1997 1999 2001 2005 2007 2009 20112003
Field crops Horticulture Livestock
Source: DAFF, 2012
Fig. 1: indices of the volume of the agricultural production
Profitability of the sector
Agriculture incomes are volatile owing to both production and price risk. Fig. 2 shows aggregate net farm income for South Africa’s commercial farm sector for the period 1980 to 2009, adjusted for inflation. The figure conveys some idea as to why agriculture is such a challenging sector. While the past decade would appear to show an upward swing (despite a deep trough around 2004–05), it is meaningless to speak of real trends.

Agriculture, Forestry and Fisheries IGDP: Situation analysis 5
Source: DAFF, 2012
Fig. 2: Aggregate net farm income
50
45
40
35
30
25
20
15
10
5
0
Year
2000 2001 2002 2003 2004 2005 2006 2007 2008 2009 2010 2011
Net
farm
inco
me
(R b
illio
ns)
According to the Bureau for Food and Agricultural Policy’s Baseline (2011: vii), in 2009 and 2010, real net farming income of the South African agricultural industry declined by 12% and 15% respectively. However this trend was reversed in 2011. DAFF (2011) reported that as at 31 December 2011 gross farming income was estimated at R144 603 million, which was 11% higher than the previous corresponding period. Gross farming income from field crops had increased by 29,8% while the value of horticulture and livestock production increased by 3,4% and 8,1% respectively. Despite these increases attributed to a recovery in commodity prices, BFAP (2011) projects that real net farming income is projected to remain fairly stagnant after 2011.
Contribution to the economyAfter adjusting for inflation, between 1980 and 2008, South Africa’s gross value added in agriculture, forestry and fisheries increased by about 75%, whereas the economy as a whole grew by more than twice as much (Stats SA, 2009). Thus, agri-culture represents a declining share of the South African economy (Fig. 3). However, agriculture’s small contribution tends to overshadow the many other positive contributions this sector makes to the economy, i.e. secondary growth genera-tion of approximately 20% to 30%. Agriculture has some of the strongest backward, forward and employment multipliers in the economy and provides a social welfare net to the most vulnerable in society, especially in rural areas. Eight percent of the total employment is primary by agriculture. It is, however, a concern that agriculture has lost 50% of its employment over the period 1970–1995 and a further 5,1% decline in the past year (DAFF, 2011). This is especially important in light of the fact that it has one of the strongest employment multipliers in the economy. The sector as a whole is a net earner of foreign exchange. However, cognisance must be taken that South Africa is a net importer of processed foods.
Source: Stats SA, 2012
Fig. 3: the contribution of agriculture, forestry and fisheries to gdP
5
4
3
2
1
0
Year
2002 2003 2004 2005 2006 2007 2008 2009 2010 2011
Perc
enta
ge (%
)

6 Agriculture, Forestry and Fisheries IGDP: Situation analysis
Potential for growth
Arable land capable of sustaining intensive to moderately well-adapted cultivation amounts to about 12,6% of South Africa’s land. Only 2% (2 446 million ha) is prime agricultural land (Classes I and II) and an additional 1,5 million ha are irri-gated land. Together, the high potential land (prime and irrigated land) makes up approximately 4% of the total area. The potential for lateral expansion is thus extremely limited. Land reform projects occupy approximately 5.9 million ha of land and there remains an estimated 3 000 000 ha of high potential land in former homelands. However, to date, land reform projects report high rates of failure and prime agricultural land in communal areas will not be used to its full potential if communal tenure systems remain insecure and without a supporting legal and administrative framework. Agricultural production in land reform and communal settings has also been hampered by inadequate infrastructure and services to support sustainable development. Increasing competition over scarce water resources is a further constraint. Opportu-nities for further growth lie in greater technical efficiency, accessing more niche markets and value-addition within the established commercial agricultural sector combined with improved systems of smallholder support which progressively address key constraints.
Safety and security
Between April 2008 and March 2009, about 121 000 head of stock were stolen at a total value of about R365 million (34 000 cattle, with a monetary value of R255 million; 28 000 goats, at a value of R40 million; and 60 000 sheep, valued at R71 million). Stock theft has become one of the largest problems facing livestock farmers, especially along the borders of Swaziland, Lesotho, Namibia and Zimbabwe. There are threats to food safety with increasing illegal importing of agricul-tural goods, especially with regard to animal diseases. There is also a persistence of violence against farm workers and farmers, highlighting the fact that both groups are vulnerable, albeit in different ways.
Employment
There has been an absolute decline in employment on commercial farms over the long term, reflecting above all the process of mechanisation. Since 1971, agricultural employment has dropped by almost half. Between 1993 and 2007, total agricultural employment declined by 27%; and between 2008 and 2012, employment declined by 18%. Moreover, this latter period has witnessed a gradual process of casualisation, in the sense that the number of ‘regular’ farm jobs has declined more rapidly than casual farm employment. Studies conducted by OECD among developing countries, ranging from the richest to the poorest, clearly indicates the importance of agriculture in the growth and development of devel-oping economies (Cervantes-Godoy & Dewbre, 2010). South Africa however, has a proportionally smaller percentage of its population actively involved in agriculture (BFAP, 2010).
850
800
750
700
650
600
550
500
Num
ber o
f wor
kers
(tho
usan
ds)
2008 2009 2010 2011 2012
Q1 Q2 Q3 Q4 Q1 Q2 Q3 Q4 Q1 Q2 Q3 Q4 Q1 Q2 Q3 Q4 Q1
Fig. 4: employment in primary agriculture by quarter
Equity in the sector
Aliber & Hall (2009) note that there are an estimated 4,5 million ‘semi-subsistence’ and 200,000 ‘semi-commercial’ small-holder farmers in South Africa compared to just under 40,000 commercial farming units. Thus the sector continues to wrestle with entrenched inequalities.

Agriculture, Forestry and Fisheries IGDP: Situation analysis 7
Support to the sectorCommercial, smallholder and subsistence farmers currently receive less support from the State than their counterparts in every industrialised country in the world. These industrialised countries also happen to be among the most important destinations for South Africa’s agricultural exports, where their competitiveness is undermined by our trade partners’ sub - sidies. Measured in terms of the Producer Support Estimate (PSE) as calculated by the OECD, an internationally accepted benchmark, direct support provided to the agricultural sector in South Africa is similar to that of countries like Chile and Brazil. These latter two countries are making concerted efforts to increase support to their agricultural sectors in various ways, but the level of support offered to producers in South Africa and in these two countries is considerably lower than the OECD average. The total cost of support to South Africa’s agricultural sector, measured as a percentage of GDP, decreased from 1% between 1995 and 1997, to 0,6% between 2005 and 2007. This is considerably lower than the average of 1,0% for developed countries. The difference in the total cost of support measured in value terms is significant if one considers the enormous difference between the GDPs of developed countries and that of a country like South Africa. Prior to the 1970s, the intensity of agricultural R&D investment in South Africa exceeded that of Australia and the United States, but has consistently lagged behind the United States since 1980.
Since 1994, State support has largely shifted away from the large-scale commercial farming subsector, in favour of small-holders and subsistence producers. However, due to the fact that the number of smallholders and subsistence producers is so vast relative to the extension corps, the actual support rendered to smallholders and subsistence producers has been patchy and generally inadequate. Table 1 highlights the limited extent of available support services to the estimated 2,8 mil-lion subsistence and 150 000 smallholder farmer households.
tAble 1: black subsistence and smallholder households receiving support by type of support, 2010
share of both subsistence and smallholder hhs receiving support in previous year
share of all smallholder hhs receiving support in previous year
Training 1,8% 5,0%Visits from extension officers 2,4% 8,0%Grants 0,3% 0,2%Loans 0,3% 1,1%Inputs as part of a loan 1,1% 1,3%Inputs for free 5,4% 2,6%Dipping and vet. services 9,2% 17,9%Other 0,2% 0,3%Any one or more of the above % 8,1% 24,8%Any one or more of the above – number of beneficiaries 202 600 32 600
Source: Stats SA, 2011, GHS 2010 and own calculations
7 000
6 000
5 000
4 000
3 000
2 000
1 000
0
Extension staff as of January 2007*
Departmental staff as on 31 March 2007**N
umbe
r of p
erso
nnel
Lim
popo
KwaZ
ulu-
Nat
al
East
ern
Cape
Nor
th W
est
Mpu
mal
anga
Free
Sta
te
Wes
tern
Cap
e
Gau
teng
Nor
ther
n Ca
pe
Sources: * NDA, 2008 ** National Treasury, 2009
Fig. 5: extension staff and total staff complements, by province

8 Agriculture, Forestry and Fisheries IGDP: Situation analysis
Fig. 5 on the previous page highlights the low ratio of extension staff to total employees in the provincial departments of agriculture, several of which still carry a large complement of ‘supernumeraries’ – staff originally employed by former home-land departments of agriculture.
Under the Outcomes approach adopted by the current administration, government has committed itself to expanding the smallholder sector from 200 000 to 250 000 by 2014, while the New Growth Path envisages the sector expanding to 500 000 smallholder farmers by 2020 (Economic Development, 2010). The achievement of these targets requires a sub-stantial expansion in the coverage of extension and related support services and more appropriate targeting in regions where small-scale farmers are concentrated.
2.1.2 Forestry
Following two decades of shrinkage of the country’s plantation resources and increasing pressure on natural forests and woodlands, the forestry sector’s goal is to ensure renewed growth, transformation and sustainability throughout the value chain. Of increasing importance is the role that can be played by plantations and the timber processing and downstream manufacturing industries, especially in boosting South Africa’s energy security and meeting its commitments to address-ing climate change.
Forests are renewable ecosystems capable of providing a wide range of environmental, economic, social and cultural benefits (National Forest Act, 1998). Broadly speaking, there are three categories of forests: indigenous forests, woodlands and plantation forests. ‘Forestry’ on the other hand refers to all activities or practices associated with any of the types of forests mentioned above. Forestry activities in indigenous forests and woodlands are not limited to the protection of the resource as a natural heritage, but include their development, use and management, as well as the management and prowvast areas of land with exotic species that are harvested and processed into pulp for the paper and packaging indus-tries, or sawn timber for the furniture and construction industries.
South Africa’s indigenous forests cover approximately 0,5% of the country’s total land area. There are approximately 16 275 forest patches, ranging from the smallest forests covering 2 ha to the largest single forest of 25 706 ha (Knysna-Tsitsikama Forest). Woodlands comprise the most extensive vegetation type in South Africa. The potential area covered by wood-lands is estimated at 39 to 42 million ha depending on the classification system used (Table 2).
tAble 2: distribution of forests
Forest type Area (millions of hectares) % of land cover
Indigenous forests 0,5 0,5Woodlands 39,0 40,0Plantation forests 1,3 1,1
Sources: Mucina & Rutherford, 2006 DWAF, 2009a
Types of producers
(a) Commercial forestry: The area under commercial forestry comprises about 1,3 million ha, or 1% of the country’s total land area. Of the land under plantation, approximately 51% is pine, 40% is eucalyptus, 8% is wattle and 0,4% under other species. Approximately 89 390 ha were converted out of commercial timber production between 1980 and 2009 (Forestry South Africa, 2010). Eighty-two percent of all plantation estates are Forest Stewardship Council (FSC) certified. Statistics relating to the commercial forest sector are reflected in the table below. In the commercial forestry sector, 57% of the total area belongs to corporate growers, 25% to private producers, 14% to the State and 4% to emerging farmers. Like commercial farmers, the commercial sector is affected by State Administered Pricing, especially regarding electricity and water. Between 1980 and 2009, approximately 550 000 ha of South Africa’s plantation forests were damaged by fire, while another 382 000 ha were damaged by other causes such as insects, diseases and animals (Forestry South Africa, 2010).
(b) Smallholder forestry: Small growers are expanding as an alternative source of secured fibre for the forestry industry. In addition to the above, there are 37 independent small growers and 47 community woodlots, covering a total area of just under 1 000 ha.

Agriculture, Forestry and Fisheries IGDP: Situation analysis 9
(c) Subsistence forestry (woodlots, woodlands and non-timber forest products): Twenty-seven million people rely on medicinal plants for health care; 65% of the plants used for this purpose are forest or woodland species. Between 9 and 12 million people use fuel wood, wild fruits and wooden utensils obtained from forests and woodlands. Each year, the average rural household uses 5,3 tons of firewood, 104 kg of wild fruits, 185 large poles for fences and construction and 58 kg of wild spinach – most of which is sourced from woodlands. The direct-use value of woodland resources consumed each year is at least R8 billion. Access to woodland resources contributes between 20% and 25% of total livelihood accruals. If these goods were not available, the benefits they provide would have to be provided by the State in order to stem the tide of rural poverty. Approximately 800 000 people operate in the craft industry, which is heavily reliant on woodland resources, while up to 100 000 households in South Africa engage in small-scale trade in forest products from woodlands.
tAble 3: the forestry sector in south Africa
gdP contribution (Millions of rand)
employment number & type of producers
Commercial forestry 3 700 107 000 4 major companies
Pulp & paper manufacturers 6 500 24 000 4 major companies
Sawmillers 1 660 20 000–30 000 80 large and 240 small-scale mills
Wood chip processors 960 <500 3 major companies
Composite board producers 950 6 000 4 major companies
Treated pole producers 160 5 000 4 major companies
Mining timber producers 110 2 200 10 large mills
Charcoal producers 115 5 500 160 smallholder producers
tAble 4: small growers in the forestry sector
company numbers of growers Area in ha Average size in ha
SAPPI – Project Grow 9 810 15 000 1,5
MONDIBP – Khulanathi 3 000 7 000 2,3
NCT Forestry Coop 1 600 25 000 15,6
TWK Agriculture Ltd 500 1 800 3,6
Siyathuthuka Co-op 2 860 4 560 1,6
Independent growers +200 809 4,0
Government supported projects (11 projects)
6 200 2 584 0,4
subtotal 24 170 56 753 4,1
Production
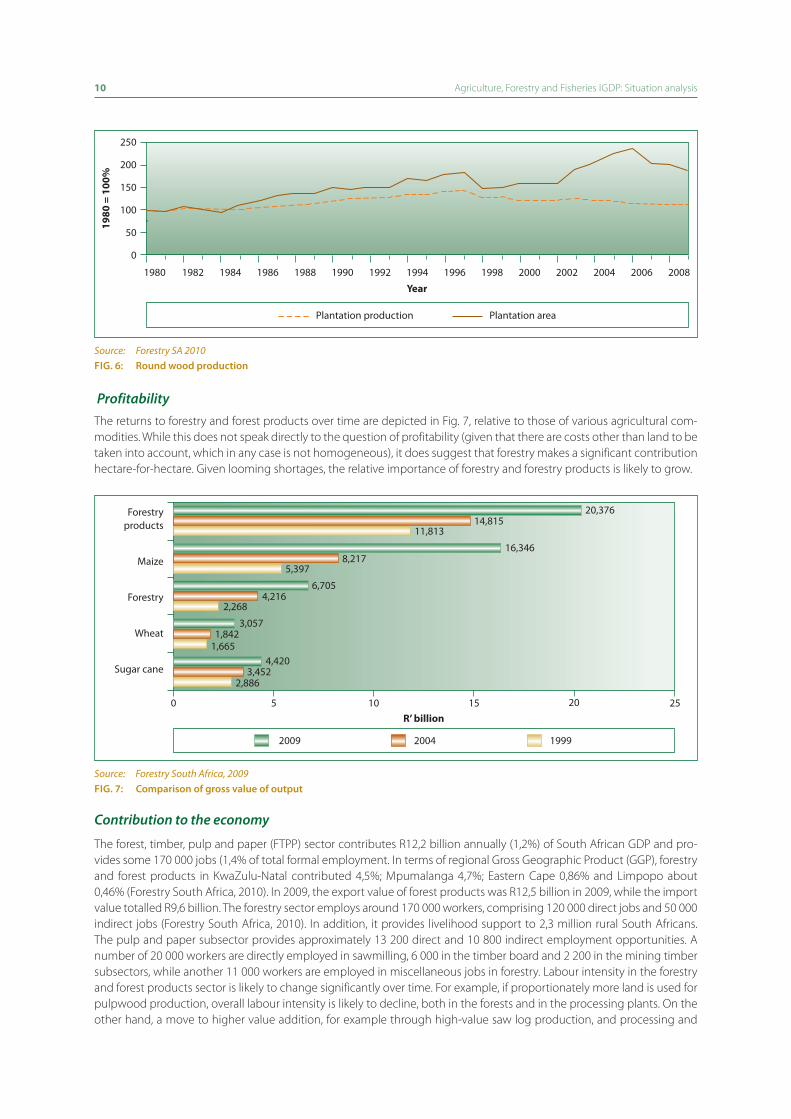
Although the area under plantations has decreased over the past few years from a peak of 1 518 138 ha in 1997 to about 1 274 870 ha in 2009, the volume of production increased by about 1,3% over the same period (Forestry South Africa, 2010; Fig. 6 on page 10). However, South Africa is approaching the limits of increasing productivity from a declining resource, such that it is facing a looming shortage of both softwood sawn timber and hardwood pulpwood over the medium and long term. The estimated shortage of timber saw logs is currently approximately 13% prior to adjustments. The expansion of plantation forestry is hampered by the availability of water and suitable land. As a result, the South African government has prioritised the expansion of plantations in areas where it is economically, environmentally and socially appropriate to do so. This is not just important for the country’s growth, but also for transformation, as it is difficult to achieve meaningful change in any of the key transformation areas in a stagnant or declining sector. For this reason, the Industrial Policy Action Plan of the dti has prioritised increasing the area under plantations and the use of the Forestry Transformation Charter as a growth and transformation strategy.
10 Agriculture, Forestry and Fisheries IGDP: Situation analysis
250
200
150
100
50
0
Year1980 1982 1984 1986 1988 1990 1992 1994 1996 1998 2000 2002 2004 2006 2008
1980
= 1
00%
Plantation production Plantation area
Source: Forestry SA 2010Fig. 6: round wood production
ProfitabilityThe returns to forestry and forest products over time are depicted in Fig. 7, relative to those of various agricultural com-modities. While this does not speak directly to the question of profitability (given that there are costs other than land to be taken into account, which in any case is not homogeneous), it does suggest that forestry makes a significant contribution hectare-for-hectare. Given looming shortages, the relative importance of forestry and forestry products is likely to grow.
R’ billion 50 10 15 20 25
Forestry products
Maize
Forestry
Wheat
Sugar cane
20042009 1999
20,37614,815
11,813
16,3468,217
5,397
6,7054,216
2,268
3,0571,842
1,6654,420
3,4522,886
Source: Forestry South Africa, 2009Fig. 7: comparison of gross value of output
Contribution to the economy
The forest, timber, pulp and paper (FTPP) sector contributes R12,2 billion annually (1,2%) of South African GDP and pro-vides some 170 000 jobs (1,4% of total formal employment. In terms of regional Gross Geographic Product (GGP), forestry and forest products in KwaZulu-Natal contributed 4,5%; Mpumalanga 4,7%; Eastern Cape 0,86% and Limpopo about 0,46% (Forestry South Africa, 2010). In 2009, the export value of forest products was R12,5 billion in 2009, while the import value totalled R9,6 billion. The forestry sector employs around 170 000 workers, comprising 120 000 direct jobs and 50 000 indirect jobs (Forestry South Africa, 2010). In addition, it provides livelihood support to 2,3 million rural South Africans. The pulp and paper subsector provides approximately 13 200 direct and 10 800 indirect employment opportunities. A number of 20 000 workers are directly employed in sawmilling, 6 000 in the timber board and 2 200 in the mining timber subsectors, while another 11 000 workers are employed in miscellaneous jobs in forestry. Labour intensity in the forestry and forest products sector is likely to change significantly over time. For example, if proportionately more land is used for pulpwood production, overall labour intensity is likely to decline, both in the forests and in the processing plants. On the other hand, a move to higher value addition, for example through high-value saw log production, and processing and

Agriculture, Forestry and Fisheries IGDP: Situation analysis 11
marketing of quality solid wood products from this resource, could contribute to higher and more rewarding employ-ment. The choice of appropriate policy would strongly influence this picture.
14
12
10
8
6
4
2
0
Forestry as % of agricultural GDP
Forestry products as a % of manufacturing GDP
Perc
enta
ge (%
)
Year
1980 1983 1986 1989 20101992 1995 1998 2001 2004 2007
Source: Forestry SA 2010
Fig. 8: the contribution of forestry and forestry products to gdP
Equity
Ownership in South Africa’s forestry sector is similar to that in other parts of the world where, given the long-term nature of the investments required in growing timber and the highly capital-intensive nature of large-scale processing and manufacturing, there is a concentration of ownership by a handful of grower-processors. So-called ‘large growers’ own 50% to 60% of all plantations, of which four-fifths accrues to two companies. In addition there are two cooperatives which control a significant percentage of the independent small and medium growers – this is a model thought to be useful for the more than 30 000 other small growers in the country. Recently there has been a rapid development of black owner-ship and management in the form of out-grower timber schemes and increasing black ownership of larger companies with a recent empowerment transaction worth over R800 million. However, the percentage of plantation land owned by independent small and medium growers remains one of the lowest in the world.
tAble 5: equity ownership in forestry
subsectorWeighted average
black total (%) black women (%)
Plantation growers
– Corporate 8,01 0,11
– Private farmers2 < 5 < 5
– Emerging growers > 95 > 80
Fibre (pulp, paper and composite board producers) 10,5 0,0
Sawmilling
– Large millers
– Medium millers
– Small millers2
20,1
5,1
> 80
0,3
2,1
< 20
Pole producers 7,6 0,5
Charcoal producers
– Corporate
– Small producers2
1,3
> 80
> 0,0
> 50
Forestry contractors 39,8 6,7
1 Figures estimated from survey data of fibre and large sawmilling groups (i.e. integrated forestry and forest products processing companies)
2 Estimated

12 Agriculture, Forestry and Fisheries IGDP: Situation analysis
Support
Companies have established projects to support small growers, i.e. SAPPI’s Project Grow, MONDI’s Khulanathi, etc. How-ever, the DAFF does not provide extension services. Limited support is provided by government in terms of the Forestry Enterprise Development Programme.
2.1.3 Fisheries
The mandate of the DAFF’s Fisheries Branch is to manage the development and sustainable utilisation of marine and coastal resources, to maximise the economic potential of the fisheries sector and to protect the integrity and quality of the country’s marine and coastal ecosystems. There are two main challenges in pursuing this mandate: creating a balance between maximising the social and economic potential of the fisheries sector and protecting the integrity and quality of the country’s marine and coastal ecosystems and promoting transformation in the sector. Expansion of the fisheries sector’s total activity is limited by the natural productive capacity of our living marine resources, which are already under strain.
The Marine Living Resources Act, 1998 (Act No. 18 of 1998) provides for the conservation of the marine ecosystem and the long-term sustainable utilisation of marine living resources. The main tool in pursuit of these objectives is the main-tenance of orderly access to exploitation, utilisation and protection of marine living resources, conducted in a fair and equitable manner.
Types of fisheries
South Africa’s fisheries sector comprises two distinct components: well-established wild capture fisheries and a relatively underdeveloped aquaculture component. Wild capture fisheries can be disaggregated into commercial, recreational and subsistence fisheries, each of which requires specific management interventions. The commercial fishing sector can be further broken down into highly industrialised, capital-intensive fisheries, which generally operate in deep water (e.g. hake trawl and pelagic purse seine fisheries) and ‘near-shore fisheries’ that are more easily accessible and tend to use traditional types of gear (line fishery and near shore rock lobster hoop net fishery).
(a) Commercial fisheries: Marine living resources are mostly fully utilised and many high-value species are over-exploited. Some rebuilding strategies are underway, for example in hake, rock lobster and abalone. The total annual production is more than 600 000 tons, valued at R5,8 billion. Overall, South African commercial fisheries earn R992 million per annum (Branch & Clark, 2006). Demersal fishing sectors contribute approximately 70% of the total value of the fishing industry. Large-scale capital investment (e.g. in vessels and factories) is generally a prerequisite for participation, hence the relatively narrow pattern of participation in the commercial fishing sector. Long-term rights have been allocated in 22 fishing subsectors, with just over 2 900 rights holders and about 1 788 vessels. Allocation and management of commercial fishing rights is guided by five core principles:
(1) Transformation;
(2) Sustainable harvesting (total allowable catch and total allowable effort);
(3) Ecological considerations (impact on the marine ecosystem);
(4) Industry, socio-economic and commercial considerations;
(5) Performance or potential to perform (financial and fishing performance, value adding, enterprise development and job creation and compliance with legislation).
Research, especially in the fields of marine biology, population dynamics, stock assessment and ecosystem dynamics, is crucial to generating the knowledge required for effective management. Monitoring, surveillance, control and enforce-ment are difficult and costly, not least because of the heterogeneity and geographical spread of the sector.
(b) Recreational fisheries: Some estimates indicate that approximately 750 000 people participate in recreational angling, although less than 200 000 anglers are issued with annual recreational licences. The actual annual catch is approximately 17 000 tons of high-value species. There are important economic spin-offs from activities associated with recreational fisheries (e.g. boat-building, fishing tackle and tourism), but these have not been properly assessed.

Agriculture, Forestry and Fisheries IGDP: Situation analysis 13
(c) Small-scale and subsistence fisheries: This subsector spans a range of different levels, from truly subsistence to small-scale commercial and it therefore requires a differentiated approach. Participation in the subsistence subsector is broad. Coastal communities traditionally make use of intertidal and shallow-water resources as a source of food, with only the occasional surplus sold, usually locally. A national survey conducted in 2002 suggested that the subsistence fisheries subsector comprised about 28 000 fisher households residing in 147 fishing communities (Clark et al., 2002). Small-scale fishers have previously not been recognised as a category of fishers in legislation and the allocation of commercial rights to only a small number of traditional small-scale fishers has had a negative impact on the traditional fishing communities and their lifestyles. A draft policy for the small-scale fisheries sector in South Africa was gazetted in September 2010. The new policy describes how small-scale fisheries resources will be managed in terms of a community-based co-management approach that must ensure that harvesting and utilisation of the resources occurs in a sustainable manner. The policy encourages small-scale fishing communities to establish community bodies (i.e. legal entities) to identify how individual members of the community will be allowed to benefit from rights that have been given to the community. This allows for small-scale fishing communities to play a role in the management of marine living resources and to be involved in the decision making that concerns them. Government and community bodies will manage small-scale fisheries jointly and work together in co-management committees. With the new policy, small-scale fisheries may provide substantial job creation and livelihood opportunities, if the communities are involved in and are part of the entire supply chain and related activities.
(d) Aquaculture and aquaculture production: Aquaculture in effect is “farming with fish” through the construction of artificial basins or enclosures. At present, South Africa’s aquaculture production is approximately 3 500 tons per annum with a value of around R218 million. Aquaculture is focused mainly on high-value products (abalone, oysters mussels), but is considered to be underdeveloped relative to its potential. It has been estimated that production could increase to over 90 000 tons per year over the next 10 to 20 years, that is, 26 times its current scale. Most potential for expansion is in freshwater aquaculture. Marine aquaculture has limited potential because of South Africa’s high energy coastline. However, because aquaculture development tends to be capital and skills-intensive, strategies are required to enable participation of the poor. Distance from markets requires a focus on high-value products and there are concerns about genetic contamination and environmental impacts in sensitive areas. Aquaculture is highly dependent on culture technology and a research strategy is under development. Major government investment is required in terms of experimental facilities and state hatcheries for this sector to be stimulated effectively.
Contribution to the economy
In terms of catch, South Africa is the largest fishing nation in Africa, but only ranks 30th among fishing nations worldwide. The fishing industry contributes approximately 0,5% to GDP, but it is regionally more important, especially in the Western Cape, where it contributes approximately 2% to Gross Geographic Product (GGP). South Africa is a net exporter of fish and fish products, with exports and imports during 2008 valued at approximately R3,1 billion and R1 billion, respectively. Fifty-five percent of demersal trawl catches are exported, and in the rock lobster, squid, tuna and demersal long-line sub-sectors, almost the total production is exported. The commercial fishing industry currently employs approximately 27 000 people directly and approximately 100 000 indirectly. Employment in aquaculture is small at present with 1 817 employed directly on farms in 2006.
Equity
Although the current transformation profile of the sector is under review, transformation is reported to be approxi-mately 59%, depending on the subsector (Table 5). The exclusion of some traditional fishing communities (e.g. on the West Coast) led to attempts to promote an interim relief process and new policy development. The draft Small-Scale Fisheries Policy focuses on people and communities so that members of fishing communities (including women, the youth and the elderly) can be involved in the fishing process. The idea is to develop and grow these communities and improve the benefits for the communities that come from fishing. A performance review process has been conducted for existing rights holders to assess behaviour as rights holders and better determine whether transformation goals are being met.

14 Agriculture, Forestry and Fisheries IGDP: Situation analysis
tAble 6: Participants in the fisheries sector and the bee profile of the sector
Fisherynumber of rightsholders
number ofvessels
% blackowned
Fisherynumber of rightsholders
number ofvessels
% blackowned
Demersal: offshore trawl 52 91 48 Large pelagic 44 24
Demersal: inshore trawl 17 44 47 Tuna pole 191 151 55
Demersal: long lining 140 72 91 Line fish 455 453 43
Demersal: shark 6 6 73 Miscellaneous nets 120 110 51
Hake hand line 95 95 36 Oysters 104 0 60
Purse seine (pelagic) 111 89 62 Patagonian toothfish 5 2 58
Rock lobster (SC) 17 10 75 Seaweed 13 0 55
Rock lobster (WC Nearshore) 823 389 93 KZN beach seine 24 21 37
Rock lobster (WC Offshore) 246 80 62 Horse mackerel 18 13 43
Crustacean trawl 4 4 63 White mussel 7 0 100
Squid (jigging) 120 135 48 total 2 612 1 789
Support
Training in fishing and maritime techniques is often conducted by fishing companies rather than government. Some NGOs are also active, for example, the World Wildlife Fund in ecosystem-related issues. More emphasis is required on training and education in all aspects of the fishing industry, i.e. in product development and processing, marketing, conservation, as well as in science itself. The knowledge base on commercial and recreational fisheries is high, but low in subsistence fisheries. There is a need for innovative approaches to assess subsistence fisheries because data collec-tion is difficult. Approaches and funding to make more effective use of traditional knowledge are required. Support and extension services are urgently required to support small-scale fishers. The draft Small-Scale Fisheries Policy recognises the need for infrastructure and services that are vital for economic development—for example transport infrastructure to markets and the provision of education and health care facilities—in order to drive small-scale fisheries.
Potential for growth
New fisheries introduced since 1994 include: large pelagics (long line), patagonian toothfish and an experimental fishery for octopus. Certain other fisheries such as horse mackerel and round-herring have potential for expansion, but more accu-rate population estimates are required. Capture fisheries have limited potential for growth and many are over extended.
Most of the growth potential in the fisheries sector lies in aquaculture. There is potential for value addition and job creation in, for example, the pelagic fishery for anchovy, but an implementation strategy and incentives are needed to stimulate its development.
2.2 the role oF stAte oWned enterPrisesThe following public entities report directly to the Minister:
• Agricultural Research Council (ARC)
• Marine Living Resources Fund (MLRF)
• National Agricultural Marketing Council (NAMC)
• Ncera Farms (Pty) Ltd
• Onderstepoort Biological Products Ltd (OBP)
• Perishable Products Export Control Board (PPECB)

Agriculture, Forestry and Fisheries IGDP: Situation analysis 15
Agricultural Research Council
The Agricultural Research Council (ARC) was established in terms of section 2 of the Agricultural Research Act, 1990 (Act No. 86 of 1990), and its functions are as follows: • Itestablishesandcontrolsfacilitiesinthefieldsofresearchanddevelopment(R&D)andthetransferoftechnology,as
the Council may determine from time to time.• ItpromotescooperationbetweentheRepublicofSouthAfrica (RSA)andothercountrieswithregardtoresearch,
development and the transfer of technology to other countries.
AccountAbility ArrAngements
In terms of section 22(3) of the Act, the Council must furnish the Minister with an annual report on its activities at the end of every financial year.
Marine Living Resources Fund
The Marine Living Resources Fund (MLRF) was established in terms of section 10 of the Marine Living Resources Act (MLRA), 1998 (Act No. 18 of 1998). The MLRF is the main source of funding for the operational activities of the department’s Fisheries Branch.
AccountAbility ArrAngements
In terms of section 10(3) of the MLRA, the Director-General administers the MLRF in consultation with the Minister. The MLRF is a schedule 3A Public Entity, as specified under the Public Finance Management Act (PFMA), 1999 (Act No. 1 of 1999).
National Agricultural Marketing Council
The National Agricultural Marketing Council (NAMC) was established in terms of section 3 of the Marketing of Agricultural Products Act, 1996 (Act No. 47 of 1996) and its functions are as follows:• The Council prepares and submits statutory measures and changes to statutory measures to the Minister for
consideration.• Itmonitorstheapplicationofstatutorymeasures,reportsonthesemeasurestotheMinisterandevaluatesandreviews
them at least every two years.
AccountAbility ArrAngements
In terms of section 8(A)(4)(c) of the Act, the accounting officer must furnish the Minister with a year-end financial state-ment within four months after the end of every financial year.
Ncera Farms (Pty) Ltd
Ncera Farms is a public company, listed under Schedule 3B of the PFMA, with the department as the sole shareholder. Ncera Farms is situated at Kidd’s Beach near East London in the Eastern Cape, on state-owned land, totalling approxi-mately 3 102 ha.
The primary function of Ncera Farms is to assist small and emerging farmers by providing a variety of services, such as advice, extension services, training and information on ploughing methods.
AccountAbility ArrAngements
The company’s Board of Directors is accountable to the department and reports to the Minister of Agriculture, Forestry and Fisheries in her capacity as executive authority. In terms of the PFMA, annual reports and financial statements are submitted annually within six months of the end of the financial year
Onderstepoort Biological Products Ltd
Onderstepoort Biological Products Ltd (OBP) was established in terms of section 2 of the Onderstepoort Biological Products Incorporation Act, 1999 (Act No. 19 of 1999). OBP manufactures and distributes vaccines and other biological products pertaining to animals.

16 Agriculture, Forestry and Fisheries IGDP: Situation analysis
AccountAbility ArrAngements
In terms of section 55 of the PFMA, OBP, as a national government business enterprise, is entitled to submit its audited financial statements and its annual report to the Minister within five months of the end of every financial year.
Perishable Products Export Control Board
The Perishable Products Export Control Board (PPECB) was established in terms of section 2 of the Perishable Products Export Control Act, 1983 (Act No. 9 of 1983), and its functions are the following:• It controls the export shipmentsofperishableproducts from theRSA, aswell as theorderof shipmentof these
products at all ports.• Itmakesrecommendationspertainingtothehandlingofperishableproductswhenthesearemovedtoandfrom
railway trucks and to other vehicles, as well as to cold stores.• Itpromotesuniformfreightratesfortheexportofperishableproducts,withdueallowanceforspecificperishable
products, port of export and means of conveyance.
AccountAbility ArrAngements
In terms of section 16 of the Act, the Board must furnish the Minister, and all registered exporters, with a report on its activities within six months of the end of every financial year.
Considering the absence of a comprehensive national policy on the role of SOEs, the IGDP seeks to provide a broad policy framework in guiding the mandate and work of SOEs affiliated to DAFF.
Critical in the effective functioning of SOEs are their contribution to the broader objectives of a developmental state. The broad policy objectives of all DAFF SOEs must therefore be to effectively participate in government programmes, including the restructuring of the economy in order to create decent job opportunities, improve the current disparities with respect to income distribution levels, enhance the quality of service delivery and address social justice concerns.
Aligned to ANC policy documents, and the National Development Plan, much more can be done to align the strategies and policies of SOEs to that of a development state. Strategic Planning Processes within DAFF thus becomes a critical tool in this regard.
2.3 Policy FrAMeWork
2.3.1 introduction
There are a number of existing sector-specific as well as cross-sectorial policies that have bearing on the management of and growth and development in the agriculture, forestry and fisheries sector. The IGDP seeks to optimise the effectiveness of policies governing the three sectors and fast track the implementation thereof, in accordance with the encompassing national goals outlined in the Medium Term Strategic Framework (MTSF) and other cross-sectorial policies. The key goals and objectives presented in these policy documents are summarised on the following pages.
2.3.2 White papersIn terms of the Agriculture, Forestry and Fisheries Sector, the three key policy documents which guide government are the White Paper on Agriculture (1995), the White Paper on Sustainable Forest Development in South Africa (1997) and the White Paper on Marine Fisheries Policy for South Africa (1997).
White Paper on Agriculture, 1995
The White Paper on Agriculture lists the following critical agricultural policy goals to be pursued:• Developinganeworderofeconomically-viable,market-directedcommercialfarmers,withthefamilyfarmasthebasis;• The broadening of access to agriculture via land reform should be enhanced by adequate agricultural policy
instruments and supported through the provision of appropriate services;• Financial systemsshould focuson the resource-poorandbeginner farmers,enabling themtopurchase landand
agricultural inputs;
Agriculture, Forestry and Fisheries IGDP: Situation analysis 17
• Tradeinandmarketingofagriculturalproductsshouldreflectmarkettendencies;• Agriculturalproductionshouldbebasedonthesustainableuseofnaturalagriculturalandwaterresources• Developingagriculture’simportantroleintheregionaldevelopmentofsouthernAfricaandothercountries.
The White Paper provides a good policy framework within which agricultural development programmes can be formu-lated, but it is believed that more can be done within the sector by expanding the policy to include and elaborate on the following goals:• Knowledgeandinformationmanagement,includingspatialplanning;• Institutionalarrangements,includingR&D,skillsdevelopmentandimprovedsupportservices;• Naturalresourcemanagement;• Broad-basedBlackEconomicEmpowerment• Governanceissues,suchasqualitycontrol.
The vision for agriculture is “to direct the development of agriculture in such a way that the factors of production, together with the related functions, will be utilised in such a manner that agriculture will contribute to the optimum economic, political and social development and stability of the Republic of South Africa, while simultaneously making a contribution towards the promotion of an economically sound farming community”.
Some of these issues were picked up in the Strategic Agriculture Sector Plan, published in 2001, which identified access and participation, competitiveness and profitability and sustainable resource management, as being the main areas where intervention was required. However, a review of this plan, published in 2008, indicated that many of these goals had not been adequately addressed. This was attributed to the slow pace of implementation, the limited capacity within government to implement many of the programmes and the limited coverage and inadequate funding of some critical programmes. The review team also found that inadequate leadership, in directing the Strategic Plan with a focused sense of urgency and commitment and implementation capacity (institutional and management capacity and skills), as well as the lack of a comprehensive implementation plan, were contributing factors. Key areas identified as requiring urgent strategic attention included food security, sustainability, resilience to climate change, land reform, support services and participation of vulnerable groups.
White Paper on Sustainable Forest Development in South Africa, 1996
The White Paper on Sustainable Forest Development in South Africa provided a policy framework for the management and sustainable development of forests and set out goals to be pursued over a five-year time frame. The National Forest Act, 1998 (Act No. 84 of 1998) was promulgated to give effect to the provisions of the White Paper. A number of strategies and policies were subsequently developed. These include the following:• NationalForestryActionProgrammeanditsreviews;• PolicyregardingaccesstoStateForests;• ComplianceandEnforcementPolicy;• DraftStrategyFrameworkforForestryEnterpriseDevelopment;• ParticipatoryForestManagementPolicyandStrategy;• KeyIssuePaperforPolicyonTransferofState-ownedIndustrialPlantations;• WoodlandStrategyFramework;• UrbanGreeningStrategy;• ForestrySectorTransformationCharter.
Although the five-year time frame referred to in the White Paper (1996–2001) has lapsed, the White Paper remains relevant in terms of specific issues, e.g. conservation of natural resources, research and community forests, to name a few. A desk-top analysis conducted in 2008 indicated that the White Paper had not been implemented in its entirety and suggested that efforts should be focussed on finalising a long-term strategy, which includes a detailed implementation plan to guide the work of government and industry in taking the forestry sector forward.
The overall goal for forestry is “to promote a thriving forestry sector, to be utilised for the lasting benefit of the nation and developed and managed to protect the environment”.

18 Agriculture, Forestry and Fisheries IGDP: Situation analysis
The recently-published Forestry 2030 Roadmap, for effective and sustainable development of all forestry resources, presents the following strategic objectives as agreed between government and industry:• Facilitateimprovedtimberavailabilityandsecureasupplyoftimbertoensuresustainabilityoftheentiretimbervalue
chain;• IncreasethecontributionofalltypesofforestsandrelatedgoodsandservicestothequalityoflifeofSouthAfricans,
with a particular focus on rural and disadvantaged communities; • Promoteconservationofforestbiologicaldiversity,ecosystemsandhabitats,whilepromotingthefairandequitable
distribution of their economic, social, health and environmental benefits;• Facilitateskillsdevelopment,awarenessraisingandinformationsharingwithaviewtoenhancetheprofileofforestry
as a sector;• Implementinnovativewaystoenhanceandstreamlinetheregulatoryenvironmenttoassistthesectortobecompliant
while reaching its potential in terms of sustainable development;• Createenablinginstitutionalandfinancialarrangementsforsustainableforestmanagement;• MaintaintheSouthAfricanforestsectorasaknowledge-basedenterprise,adeptataddressingconstraintstogrowth
in the sector and managing the risks to growth;• Strengtheninternationalandregionalpartnershipsinordertoenhancesustainableforestmanagement;• Createanenablingenvironmentforforestresearchinthecountry, includingstrengtheninglinkageswithresearch
and academic institutions and with other SADC and NEPAD initiatives, as well as by encouraging participatory forest research in general.
White Paper on Marine Fisheries Policy for South Africa, 1997
The Marine Fisheries Policy for South Africa is based on the understanding that all natural marine living resources of South Africa, as well as the environment in which they exist and in which mariculture activities may occur, are a national asset and the heritage of all South Africans and should be managed and developed for the benefit of present and future gene-rations in the entire country. The policy is based on the following main objectives and principles:• Optimisationoflong-termsocialandeconomicbenefitstothenation;• Promotionofsustainableutilisationandthereplenishmentoflivingmarineresources;• Transparencyandaccountabilityinmarineresourcemanagement;• Fairandequitableaccess;• Managementoflivingmarineresourcesbasedonthebestavailableknowledgeandmultidisciplinaryresearchwithin
the context of sustainable utilisation;• Aholisticapproachtofisheriesandtheutilisationofmarineresources;• Nationalandprovinciallevelsofmanagement;• Participationinresourcemanagement.
The Marine Living Resources Act, 1998 (Act No. 18 of 1998) was promulgated to give effect to the provisions of the White Paper. A number of strategic and policy outputs have been developed subsequently, including:
• TheGeneralPolicyontheManagementandAllocationofLong-termCommercialFishingRights;
• Sector-specificpoliciesfortheallocationoflong-termcommercialfishingrightsin22fisheries;
• AdraftSmall-ScaleFisheriesPolicy;
• AFisheriesPerformanceReview.
The overall goal for fisheries is “to improve the overall contribution from the fishing industry to the long-term vision of government as laid out in the Macro-Economic Strategy”.
Access to commercial fishing rights was significantly broadened by the long-term rights allocation process. However, the envisaged development of support structures for smallholder operators was not implemented and the depth of the reported transformation has been questioned. Although subsistence use of marine resources was recognised as important in South Africa, the importance of traditional small-scale fishing by communities (particularly along the east coast) was not recognised. In addition, the encompassing long-term policy for fisheries and fishery-specific management plans have not been developed.

Agriculture, Forestry and Fisheries IGDP: Situation analysis 19
2.3.3 national Policies and Programmes
The purpose of the IGDP is to contribute to and define the role of agriculture, forestry and fisheries in all programmes and strategies of national government. The following are key programmes and strategies through which the IGDP will find expression.
The National Development Plan (Vision 2030)
South Africa, according to the National Development Plan (NDP) can eliminate poverty and reduce inequality by 2030. It emphasises the importance of hard work, leadership and unity. It furthermore identifies Infrastructure Development, Job Creation, Health, Education, Governance, Inclusive Planning and the Fight against Corruption as key focus areas and spells out specific projects for each.
As the primary economic activity in rural areas, the NDP identifies agriculture as having the potential to create close to 1 million new jobs by 2030, a significant contribution to the overall employment target. To achieve this, the NDP proposes the following policy imperatives:
• Expandirrigatedagriculture.Evidenceshowsthatthe1,5millionhaunderirrigation(whichproducevirtuallyallSouthAfrica’s horticultural harvest and some field crops) can be expanded by at least 500 000 ha through the better use of existing water resources and developing new water schemes.
• Usesomeunderusedlandincommunalareasandland-reformprojectsforcommercialproduction.
• Pick and support commercial agricultural sectors and regions that have the highest potential for growth andemployment.
• Supportjobcreationintheupstreamanddownstreamindustries.Potentialemploymentwillcomefromthegrowthin output resulting from the first three strategies.
• Findcreativecombinationsbetweenopportunities.Forexample,emphasisshouldbeplacedonlandthathasthepotential to benefit from irrigation infrastructure; priority should be given to successful farmers in communal areas, which would support further improvement of the area; and industries and areas with high potential to create jobs should receive the most support. All these will increase collaboration between existing farmers and the beneficiaries of land reform.
• Developstrategiesthatgivenewentrantsaccesstoproductvaluechainsandsupportfrombetter-resourcedplayers.
The NDP makes the following detailed recommendations, in achieving the goal of 1 million new jobs by 2030.
• Substantially increase investment inwater resourcesand irrigation infrastructurewhere thenatural resourcebaseallows and improves the efficiency of existing irrigation to make more water available.
• Investsubstantiallyinprovidinginnovativemarketlinkagesforsmall-scalefarmersinthecommunalandlandreformareas, with provisions to link these farmers to markets in South Africa and further afield in the sub-continent.
• Asubstantialproportionoftheagriculturaloutputisconsumedinthe“food-away–from-home”marketinSouthAfrica.While this includes restaurants and take-away outlets, which are hardly relevant in most rural areas, it also includes school feeding schemes and other forms of institutionalised catering, such as food service in hospitals, correctional facilities and emergency food packages where the state is the main purchaser. As part of comprehensive support packages for farmers, preferential procurement mechanisms should be put in place to ensure that new entrants into agriculture can also access these markets.
• Createtenuresecurityforcommunalfarmers.Tenuresecurityisvitaltosecureincomesfromallexistingfarmersandfor new entrants. Investigate the possibility of flexible systems of land use for different kinds of farming on communal lands.
• Investigatedifferentformsoffinancingandvestingofprivatepropertyrightstolandreformbeneficiariesthatdoesnot hamper beneficiaries with a high debt burden.
• Thereshouldbegreatersupportforinnovativepublic-privatepartnerships.SouthAfrica’scommercialfarmingsectorisfull of examples of major investments that have resulted in new growth and new job opportunities.
• Increaseandrefocusinvestmentinresearchanddevelopmentfortheagriculturalsector.

20 Agriculture, Forestry and Fisheries IGDP: Situation analysis
• Improveandextendskillsdevelopmentandtrainingintheagriculturalsector,includingentrepreneurshiptraining.This should include the training of a new cadre of extension officers that will respond effectively to the needs of smallholding farmers and contribute to their successful integration into the food value chain.
• Fortheseextensionofficerstobesuccessful,itisnecessarytoinvestigatewhetherextensionandotheragriculturalservices are appropriately located at provincial level. Innovative means for agricultural extension and training by the State in partnership with industries should be sought.
The New Growth Path
The New Growth Path is South Africa’s vision to place jobs and decent work at the centre of economic policy. It sets a target of five million new jobs to be created by 2020 and sets out the key employment drivers and the priority sectors that the country will focus on over the next few years.
It is based on strong and sustained, inclusive economic growth and the rebuilding of the productive sectors of the economy. Infrastructure development and agriculture, in particular, has been identified as a foundation for more jobs and addressing rural underdevelopment.
The job drivers the NGP identified are:(1) Substantial public investment in infrastructure both to create employment directly, in construction, operation and
maintenance as well as the production of inputs and indirectly by improving efficiency across the economy.(2) Targeting more labour-absorbing activities across the main economic sectors – the agricultural and mining value
chains, manufacturing and services.(3) Taking advantage of new opportunities in the knowledge and green economies.(4) Leveraging social capital in the social economy and the public services.(5) Fostering rural development and regional integration.
Agriculture is identified as one of the key job drivers within the NGP and targets opportunities for 300 000 households in agricultural smallholder schemes plus 145 000 jobs in agro-processing by 2020, while it sees potential to upgrade con ditions for 660 000 farm workers.
The NGP provides the following broad policy guidelines for agriculture, forestry and fisheries:• Restructuringof land reform to support smallholder schemeswithcomprehensive supportaround infrastructure,
marketing, finance, extension services, etc.;• Upgradingemploymentincommercialagriculture,especiallythroughimprovedworkervoice;• Measurestosupportgrowthincommercialfarmingandtohelpaddressfluctuationsinmaizeandwheatpriceswhile
supporting national food security; • Accelerationoflandclaimsprocessesandbettersupporttonewfarmersfollowingland-claimssettlements;• Programmestoensurecompetitivepricingofinputs,especiallyfertiliser;• Supportforfishingandaquaculture.
National Infrastructure Plan—Strategic Integrated Projects
The Presidential Infrastructure Coordinating Commission (PICC) was established with the aim of directing infrastructure development, a key job driver as identified by the NGP. From the spatial analysis of South Africa’s needs, 17 Strategic Inte-grated Projects (SIPs) have been identified. The SIPs cover a range of economic and social infrastructure.
Of relevance to agriculture, forestry and fisheries, is SIP 11: Agro-logistics and rural infrastructure. SIP 11, aims to improve investment in agricultural and rural infrastructure that supports expansion of production and employment, small-scale farming and rural development, including facilities for storage (silos, fresh-produce facilities, packing houses), transport links to main networks (rural roads, branch train-line, ports), fencing of farms, irrigation schemes to poor areas, improved R&D on rural issues (including expansion of colleges of agriculture), processing facilities (abattoirs, dairy infrastructure), aquaculture incubation schemes and rural tourism infrastructure.
Key interventions identified, include:• Newinfrastructureinvestmentsinunderservicedformerhomelands

Agriculture, Forestry and Fisheries IGDP: Situation analysis 21
• Freshproducemarketingdepots• Animalproductionandprocessinginfrastructureintheformerhomelands• Cropproductionandprocessinginfrastructureintheformerhomelands• Animalhealthinfrastructure(includingKrugerParkfencing)• Forestryinfrastructure• Fisheriesprojects• Collegesofagriculture• Revitalisationofirrigationschemes• Revitalisationofexistingrailandroadinfrastructure• Improvingaccesstoexistinginfrastructure• Improvinguseandprovisionofagro-logistics• Creatingaconduciveenvironmenttoefficientagro-logistics.
Accelerated and Shared Growth Initiative for South Africa
The Accelerated and Shared Growth Initiative for South Africa (AsgiSA), 2006 and the National Industrial Policy Framework (NIPF), 2007, both emphasise the importance of promoting and developing small enterprise as a strategy to stimulate growth in the 2nd economy and for meeting the Millennium Development Goals.
The objective of AsgiSA was to attain a growth rate of at least 6% per annum by 2010. A growth diagnostic analysis was undertaken as part of the process and through the analysis, the following constraints to growth were identified (National Treasury, 2008):• volatilityandleveloftherealexchange• thecost,efficiencyandcapacityofthenationallogisticssystem• shortageofsuitablyskilledlabour• barrierstoentry,limitstocompetitionandlimitednewinvestmentopportunities• theexcessiveregulatoryburdenonsmallandmediumbusinesses• deficienciesinStateorganisations,capacityandleadership.
National Industrial Policy Framework
In January 2007, the Cabinet adopted the National Industrial Policy Framework (NIPF), which sets out government’s broad approach to industrialisation. Guided by the NIPF, the implementation of industrial policy was set out in the Industrial Policy Action Plan (IPAP). In August 2007, the Cabinet approved the first 2007/08 IPAP, which reflected chiefly ‘easy-to-do’ actions. The 2007/08 IPAP has largely been implemented. However, there has been growing recognition that industrial policy needs to be scaled up from ‘easy-to-do’ actions to interventions that government ‘needs-to-do’ to generate a structurally sound new path of industrialisation. A process of intensive consultation and analysis has culminated in a revised IPAP for the period 2010/11 through 2012/13, with the idea of updating on an annual basis. The 2010/11–2012/13 IPAP represents a significant step forward in industrial policy efforts. The agriculture, forestry and fisheries sectors’ deliver-ables are included in the 2010/11–2012/13 IPAP, the fulfilment of which is expected to contribute towards growth and development. These require intergovernmental cooperation and coordination.
Medium Term Strategic Framework (MTSF)
The 4th democratic elections ushered in a new electoral mandate which defines the strategic objectives and targets of government for the period 2009–2014. These objectives and targets were outlined in the Medium Term Strategic Frame-work (MTSF) document, adopted in July 2009, hence the ‘MTSF priorities’. The MTSF priorities build on the successes of 15 years of democracy. During the January 2010 Lekgotla, the government decided that in order to translate the MTSF priorities into measurable deliverables, there was a need to concretise planning and policy-making in relation to measur-able outcomes. Government therefore introduced the Outcome-Based Performance Management (OBPM) System. The OBPM System outlines 12 key outcomes, which are aligned to the 10 MTSF priorities.
Ministers of each government department signed Service Delivery Agreements (SDAs) with the President for their term of office. The SDAs outline which outcomes each Minister will be responsible for delivering on and how to achieve the

22 Agriculture, Forestry and Fisheries IGDP: Situation analysis
targets as outlined. The Minister of Agriculture, Forestry and Fisheries is directly responsible for three outcomes and indirectly contributes to five as indicated in Table 7.
It must be noted that the OBPM system is not prescriptive as to how departments and their respective sectors will imple-ment the outcomes, but seeks to increase focus on high-priority areas and effective monitoring and implementation thereof.
tAble 7: Alignment of MtsF priorities and key outcomes
MtsF priorities key outcomes
Speed up economic growth and transform the economy to create decent work and sustainable livelihoods
Decent employment through inclusive economic growth (4)
Massive programme to build economic and social infrastructure An efficient, competitive and responsive economic infrastructure network (6)
Comprehensive rural development strategy linked to land and agrarian reform and food security
Vibrant, equitable, sustainable rural communities contributing towards food security for all (7)
Strengthen the skills and human resource base Skilled and capable workforce to support an inclusive growth path (5)
Quality basic education (1)
Improve the health profile of society A long and healthy life for all South Africans (2)
Intensify the fight against crime and corruption All people in South Africa are free and feel safe (3)
Build cohesive, caring and sustainable communities An efficient, effective and development-oriented public service and an empowered, fair and inclusive citizenship (12)
Sustainable human settlements and improved quality of household life (8)
Pursue regional development, African advancement and enhanced international cooperation
Create a better South Africa, a better Africa and better world (11)
Sustainable resource management and use Protect and enhance our environmental assets and natural resources (10)
Build a developmental state, including the improvement of public services and strengthening democratic institutions
An efficient, effective and development-oriented public service and an empowered, fair and inclusive citizenship (12)
Responsive, accountable, effective and efficient Local Government System (9)
tAble 8: key outcomes to which the dAFF must contribute
direct contribution indirect and/or supporting
Outcome 4: Decent employment through inclusive economic growth
Outcome 5: Skilled and capable workforce to support and inclusive growth path
Outcome 7: Vibrant, equitable, sustainable rural communities contributing towards food security for all
Outcome 8: Sustainable human settlements and improved quality of household life
Outcome 10: Protect and enhance our environmental assets and natural resources
Outcome 11: Create a better South Africa, a better Africa and a better world
Market and trade policies
One of the major policies that have an impact on South Africa’s agriculture, forestry and fisheries sectors has been the progressive deregulation of markets since the 1990s. This market deregulation process went hand-in-hand with another process, namely the foreign trade liberalisation, which had already started prior to the new democratic dispensation as South Africa sought to fulfil its commitments under the World Trade Organization’s Agreement on Agriculture of 1994. Further more, at around the same time, a wide range of other instruments used to subsidise agricultural produc-tion among commercial farmers, such as fixed improvements, conservation works, fencing and emergency relief, were removed (Committee to Review the Agricultural Marketing Environment, 2006).
Agriculture, Forestry and Fisheries IGDP: Situation analysis 23
Openness to trade has long been regarded as an important element of sound economic policy towards economic growth and the alleviation of poverty. The question, however, is how strong a force trade liberalisation is in economic growth and how economic growth transmits such benefits to the poor. While there seems to be consensus among growth and development economists that economic growth will, in general, lead to increases in income, there is growing evidence that suggests that high levels of inequality hamper the pace at which an economy can benefit from liberalisation, which means that growth on its own cannot be an adequate antidote to inequality (Wagle, 2007).
While the impact of trade liberalisation on food security in South Africa remains uncertain, increasing trade remains a priority and there are several challenges that the industry faces to fully realise its export potential. One challenge, for example, is the poor state of market intelligence on international agricultural markets; another is the absence of effective trade promotion strategies; and a third is the persistence of high tariff barriers to agricultural imports among some of South Africa’s major trading partners.
The composition and direction of trade is not optimal. Issues to consider include: • South Africa’s positioning in Africa (i.e. Africa requires special interventions, for example, to mitigate trade risks,
standardise Non-Tariff Measures where policy space allows, etc.) given the opportunities that exist, but also the lack of capacity on trade issues in Africa.
• Redirectingtradetonewandpossiblymoresustainablemarkets,e.g.Asia.Innovativeinterventionsarerequiredtocapitalise on the opportunities that exist. In this regard public-private partnerships are vitally important, as well as closer cooperation between relevant government departments and parastatals.
It is imperative that more emphasis is put on the potential impact of bilateral trade agreements since it has implications for policy space and South Africa’s future trade direction.
Land Reform Policy
Rooted in the RDP, the White Paper on South African Land Policy of 1997 set the foundation for one of South Africa’s major post-apartheid programmes, namely land reform. The White Paper confirmed the three major elements of the land reform programme: (1) Redistribution, through which citizens can apply for assistance to acquire or access land for farming and/or settlement;(2) Restitution, involving the restoration of land, or cash compensation, to victims of forced removals and operating
under the Restitution of Land Rights Act (Act No. 22 of 1994);(3) Tenure reform, aimed at improving tenure security of all South Africans and to accommodate diverse forms of land
tenure, including types of communal tenure.
Land reform has enabled the broadening of access to land and participation in agriculture and forestry. Different approaches have been adopted and modified over time, especially in terms of the redistribution component. The first period of land redistribution (1994–1999), focused on acquiring farmland on behalf of groups of previously dis advantaged people, which they typically held through communal property associations. Often these projects received limited sup-port for production and were also compromised by unworkable plans involving group production. The second period of land reform (2001–2006), focused on the redistribution of commercial farms to individuals and small groups. The third period of land reform (2006–present), saw the introduction of a proactive approach to land acquisition, enabling the State to purchase land and then allocate it on a leasehold basis to farmers.
By means of these policy adjustments, redistribution projects have become more successful in terms of production. However, as the amount of support per individual has risen, the number of different individuals benefitting has declined to the point where redistribution is scarcely able to address the land needs of smallholders who might like to ‘graduate’ out of the former homelands.
Land restitution has changed far less than redistribution, though there are some notable developments, for example, an increase in resources made available to provide development support pre and post the claim settlement process and the testing of various partnership approaches. As for tenure reform, while the situation of labour tenants and farm dwellers have been partially addressed by targeted legislation, reforms applicable to the former homelands remain elusive. This constitutes arguably the biggest obstacle to unlocking the agricultural potential of the former homelands, where most black farmers are situated, often side-by-side with large amounts of underutilised arable land.

24 Agriculture, Forestry and Fisheries IGDP: Situation analysis
The DAFF is also involved, together with other national departments, in a number of initiatives that are geared to improving opportunities and well-being for the rural poor. These include the Comprehensive Rural Development Programme (CRDP), as well as the Land Reform Programme of the Department of Rural Development and Land Reform that involves land redistribution, restitution and tenure reform in fulfilment of its Constitutional obligations.
A key land reform challenge that has an impact on both the forestry and agriculture sectors is that of providing effective development support to land reform beneficiaries. Various attempts have been made to address this deficiency.
The Comprehensive Agricultural Support Programme (CASP) was established in 2004. The function of this programme is to support new farmers. CASP is relevant in the context of the development of the agriculture and forestry sectors as it could be applied to emerging farmers and forestry growers now that forestry and agriculture have been combined into a single department.
The Land and Agrarian Reform Project (LARP) was launched in February 2008 as a joint initiative between the former Department of Land Affairs and the then Department of Agriculture. The LARP drew on the Settlement and Implementa-tion Support Strategy for Land and Agrarian Reform developed within the Department of Land Affairs. The LARP aimed to align the implementation of the CASP with the Land Redistribution for Agricultural Development Programme (LRAD). The LARP proposes the establishment of ‘one-stop shop’ service centres located close to farming and rural beneficiaries. This concept is in line with the concept of creating ‘integrated access points’ for SMMEs as presented in the dti’s Integrated Strategy on the Promotion of Entrepreneurship and Small Enterprises. However, it is not clear at this stage how the ‘one-stop shop’ interventions proposed by the LARP will fit into the integrated access points proposed by the dti, or what the implications are for the roll-out of SMME services in agriculture and forestry.
A lot has changed since then. In 2009, the new administration created a new Ministry of Rural Development and Land Reform and the Comprehensive Rural Development Programme was designed to address the new rural development mandate. The Department of Rural Development and Land Reform (DRDLR) continued to focus on acquiring land for redistribution to land reform beneficiaries through the Proactive Land Acquisition Strategy (PLAS) in which land acquired by the State was leased to qualifying beneficiaries. At the same time, the DRDLR launched the Recapitalisation and Develop-ment Programme to identify and support distressed land reform projects through investment in infrastructure and recruitment of strategic partners to support land reform beneficiaries.
In terms of support to smallholder farmers, Aliber & Hall (2010), found that between 50 and 200 black farming households receive over R500 000 each per annum; approximately 350 000 receive R17 000, while 2,3 million households are receiving almost nothing. There is therefore, an imbalance between relatively large amounts of support to rather few “new farmers” in poorly conceptualised land reform projects, at the expense of many existing black farmers within the ex-Bantustans (Aliber & Hall, 2010). Aliber & Hall (2010), recommended that available resources be used in more effective ways and that the emphasis in CASP shift from on-farm infrastructure and inputs to community-level infrastructure, market development and institutional re-engineering.
Comprehensive Rural Development Programme (CRDP)
Following the 2009 elections, the government recommitted itself to intensifying its rural development efforts through the establishment of a new Department of Rural Development and Land Reform (DRDLR). The DRDLR has been given the mandate to develop a Comprehensive Rural Development Programme (CRDP) throughout the country. The intention is to use this programme to promote rural development on the one hand and land and agrarian reform on the other, in a manner that is mutually supportive.
The CRDP is aimed at being an effective response against poverty and food insecurity by maximizing the use and manage-ment of natural resources to create vibrant, equitable and sustainable rural communities. The programme must improve the standard of living and welfare, rectify past injustices through rights-based interventions and address skewed patterns of distribution and ownership of wealth and assets. The strategic objective of the CRDP is therefore to facilitate integrated development and social cohesion through participatory approaches in partnership with all sectors of society.
This IGDP needs to obtain maximum leverage from the opportunities created through the CRDP. Coordination between DRDLR and DAFF will be critical to ensure the success of the CRDP. This will be effected in part through the provision of decentralised one stop shop service centres.
Agriculture, Forestry and Fisheries IGDP: Situation analysis 25
Integrated Strategy on the Promotion of Entrepreneurship and Small Enterprises, 2005
A key policy directive to be taken into consideration in the development of small-scale entrepreneurs in the agriculture, forestry and fisheries sectors is the dti’s Integrated Strategy on the Promotion of Entrepreneurship and Small Enterprises, which was approved by Cabinet in 2005. This Strategy follows on and updates the White Paper on National Strategy for the Development and Promotion of Small Business in South Africa (1995), which laid the foundation for the promotion of small enterprise in South Africa. It identifies the small enterprise sector as a key driver of development in post-1994 South Africa.
The 2005 Strategy works from the premise that a lot is already known and accepted of what should be done to support small enterprise development and that the main challenge is how this support should be structured and rolled out. The strategy emphasises the importance of a cooperative and integrated approach to service delivery involving all spheres of government and the private sector. The strategy calls for steps to co-locate as many small enterprise support agencies as possible, in order to create integrated access points for existing and aspiring entrepreneurs. Finally, the strategy rec-ognises the need for sector strategies that focus on small enterprise development for priority sectors and proposes that programmes be developed after thorough examination of the support needs of small businesses in those sectors. It also states that individual departments within each sector will play a key role in leading the conceptualisation and design of sector-specific support programmes.
Livelihoods Development Support Programme
The Farmer Settlement Programme (FSP), which was responsible for post-settlement agricultural support to land reform beneficiaries, had no dedicated budget until 2004. The FSP, now renamed the Livelihoods Development
Support Programme, has limited reach and impact, rather than being a mechanism for restructuring the economic and market environment for smallholder and subsistence farmers (National Treasury, 2007; Hall, 2009). Recently, an evalua-tion of the implementation of the 2001 Sector Plan, which assessed the extent to which the intended objectives and outcomes had been realised over the past five years, was conducted (Vink et al., 2008). The performance scorecard sug-gested that good progress was made in some areas, such as sustainable resource management, while other areas, such as equitable access and participation, still required urgent attention (Vink & Kirsten, 2002).
Although all strategies devised by the department since 1995 state the importance of support for the commercial and smallholder farmers (smallholder and subsistence), currently they receive less support from the state than their coun-terparts in every industrial country in the world with the exception of New Zealand (Vink et al., 2008). Direct support to agriculture, as measured by the Organisation for Economic Cooperation and Development (OECD), is expressed as a percentage of gross farming income (NAMC, 2008). This is referred to as the Producer Support Estimate (PSE) and was as follows for the period of 2005 to 2007: Chile (4%), Brazil (6%), South Africa (6%), China (9%), Ukraine (9%) and Russia (14%), (NAMC, 2008). The level of support offered to producers is considerably lower than the OECD average of 26% (NAMC, 2008).
Second Economy Strategy Project (SESP)
This initiative of the Presidency, hosted by Trade and Industrial Policy Strategies (TIPS), provides a framework for address-ing inequality and economic marginalisation in South Africa. It specifically notes:
• “Thecentralised,monopolystructureofSA’scoreeconomy—includingthelabourmarketlegaciesofpasslaws,aswell as the highly skewed distribution of assets such as land and capital;
• ThespatiallegacyofBantustansandapartheidcities;
• Thelegaciesofdeepinequalityinthedevelopmentofhumancapital”,(SESP,2009a).
In response to these features of a dualistic economy, the SESP framework presents a strategy for promoting structural change to create a more broad-based economy. It emphasises the need to improve “the distribution of returns from economic activity more equitably across the society”, (SESP, 2009a: 2). A top priority is therefore, to improve the situation of subsistence or poor farmers, mostly in the former Bantustan areas who, despite engaging in productive work, derive too little benefit from it. It notes that “strategies to develop a smallholder sector and strengthen subsistence agriculture

26 Agriculture, Forestry and Fisheries IGDP: Situation analysis
face many challenges and start off a low base: but their potential impact on poverty and on rural employment makes this investment— and the associated risk— imperative” (SESP, 2009a: 9).
The SESP framework proposes a departure from the implementation of transformation programmes that require imple-mentation at a project level in favour of interventions by the State that achieve systemic, societal-level impact. Instead of relying wholly on delivering project-level support to individual farmers or projects and in line with the notion of a ‘develop mental state’, government will need to reshape markets to achieve wider changes in the market environment in which small producers are often marginalised.
A first set of required state interventions includes the provision of a combination of incentives and regulation of the com-mercial sector, particularly the large companies that dominate agricultural value chains. The purpose of such incentives and regulation is to ensure that large businesses have to increase the proportion of small producers among their clients and engage with them on more equitable terms.
A second set of required state interventions is to promote coordination and cooperation between small producers them-selves, through input supply and marketing cooperatives, to overcome the coordination problems that isolate small producers and to strengthen their leverage in engaging with larger market players. These two sets of interventions are critical to achieving the economies of scale associated with marketing.
Agricultural Broad-Based Black Economic Empowerment (AgriBEE)
As the name implies, Agricultural Broad-Based Black Economic Empowerment (‘AgriBEE’), encapsulates the agricultural sector’s approach to Broad-Based Black Economic Empowerment. AgriBEE seeks to complement other initiatives such as farmer development support and land reform, by incentivising the sector to integrate black people in different ways (e.g. equity owners, managers, etc.) and at different points in the agricultural value chain, broadly speaking. The AgriBEE Transformation Charter was gazetted in March 2008 and the AgriBEE Charter council was inaugurated in December 2008. The mandate of the Council is, inter alia, to align the AgriBEE Charter with the Codes of Good Practise in terms of section 9 of the Broad-Based Black Economic Empowerment Act, Act No. 53 of 2003.
While the rationale for AgriBEE is clear enough, to date it appears to have had little impact because it is not enforceable, i.e. the charter is not legally binding and only indicative scorecards are in place. The DAFF is therefore, in the process of consulting the dti in order to have sector codes published in terms of section 9 of the Act, which will allow DAFF to apply binding sector codes.
Forest Sector Transformation Charter, 2009
This charter was developed by sector stakeholders over a period of two years and was gazetted as Sector Codes, in terms of section 9(1) of the Broad-Based Black Empowerment (BBBEE) Act in May 2009. The Charter highlights the need for SMME development “in underpinning economic growth and ensuring that black economic empowerment is broad-based”.
The charter contains a number of undertakings by government and industry for creating an enabling the environment for SMME development in the forest sector (see Box below). Many of these undertakings reiterate and further detail the initiatives already identified in the draft Strategy Framework for Forestry Enterprise Development. The charter also com-mits enterprises in the forest sector to support BBBEE and SMME development through procurement and enterprise spending.
Overall, the charter sees both government and industry as having an important role to play in supporting emerging black entrepreneurs in the forest sector. The charter proposes doing, not by creating new delivery structures, but by strengthening existing delivery structures in both the corporate and public sector. This approach is in line with what is being proposed in the Integrated Strategy on the Promotion of Entrepreneurship and Small Enterprises, which is discussed above.
Competition Act
The new South African competition law forms an important part of reforms designed to address the country’s historical economic structure and encourage broad-based economic growth. Addressing the trend towards increasing concentration in agriculture, forestry and fisheries, requires robust application of competition policy, although this is
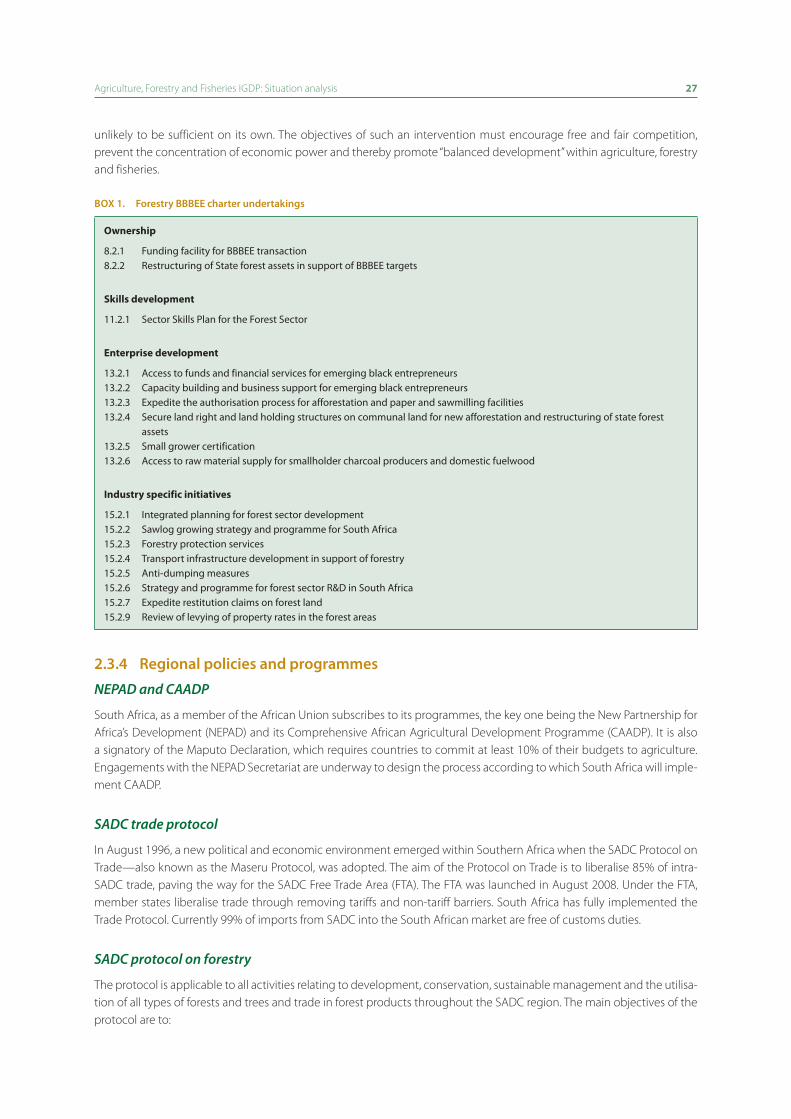
Agriculture, Forestry and Fisheries IGDP: Situation analysis 27
unlikely to be sufficient on its own. The objectives of such an intervention must encourage free and fair competition, prevent the concentration of economic power and thereby promote “balanced development” within agriculture, forestry and fisheries.
box 1. Forestry bbbee charter undertakings
Ownership
8.2.1 Funding facility for BBBEE transaction8.2.2 Restructuring of State forest assets in support of BBBEE targets
Skills development
11.2.1 Sector Skills Plan for the Forest Sector
Enterprise development
13.2.1 Access to funds and financial services for emerging black entrepreneurs13.2.2 Capacity building and business support for emerging black entrepreneurs13.2.3 Expedite the authorisation process for afforestation and paper and sawmilling facilities13.2.4 Secure land right and land holding structures on communal land for new afforestation and restructuring of state forest
assets13.2.5 Small grower certification13.2.6 Access to raw material supply for smallholder charcoal producers and domestic fuelwood
Industry specific initiatives
15.2.1 Integrated planning for forest sector development15.2.2 Sawlog growing strategy and programme for South Africa15.2.3 Forestry protection services15.2.4 Transport infrastructure development in support of forestry15.2.5 Anti-dumping measures15.2.6 Strategy and programme for forest sector R&D in South Africa15.2.7 Expedite restitution claims on forest land15.2.9 Review of levying of property rates in the forest areas
2.3.4 regional policies and programmes
NEPAD and CAADP
South Africa, as a member of the African Union subscribes to its programmes, the key one being the New Partnership for Africa’s Development (NEPAD) and its Comprehensive African Agricultural Development Programme (CAADP). It is also a signatory of the Maputo Declaration, which requires countries to commit at least 10% of their budgets to agriculture. Engagements with the NEPAD Secretariat are underway to design the process according to which South Africa will imple-ment CAADP.
SADC trade protocol
In August 1996, a new political and economic environment emerged within Southern Africa when the SADC Protocol on Trade—also known as the Maseru Protocol, was adopted. The aim of the Protocol on Trade is to liberalise 85% of intra-SADC trade, paving the way for the SADC Free Trade Area (FTA). The FTA was launched in August 2008. Under the FTA, member states liberalise trade through removing tariffs and non-tariff barriers. South Africa has fully implemented the Trade Protocol. Currently 99% of imports from SADC into the South African market are free of customs duties.
SADC protocol on forestry
The protocol is applicable to all activities relating to development, conservation, sustainable management and the utilisa-tion of all types of forests and trees and trade in forest products throughout the SADC region. The main objectives of the protocol are to:

28 Agriculture, Forestry and Fisheries IGDP: Situation analysis
• promotethedevelopment,conservation,sustainablemanagementandutilisationofalltypesofforestsandtrees• promote trade in forest products throughout the region in order to alleviate poverty and generate economic
opportunities for the people of the region• achieveeffectiveprotectionoftheenvironmentandtherebysafeguardtheinterestsofboththepresentandfuture
generations.
The challenge in terms of the forestry protocol remains the slow progress towards ratification by SADC member countries. It therefore remains an unexploited mechanism for strengthening regional collaboration.
SADC protocol on fisheries
The objective of this protocol is to promote responsible and sustainable use of the living aquatic resources and aquatic ecosystems of interest to State parties in order to:• promoteandenhancefoodsecurityandhumanhealth• safeguardthelivelihoodoffishingcommunities• generateeconomicopportunitiesfornationalsintheregion• ensurethatfuturegenerationsbenefitfromtheserenewableresources• alleviatepovertywiththeultimateobjectiveofitseradication.
Other regional fisheries programmes include:• TheBenguelaCurrentCommission,comprisingSouthAfrica,NamibiaandAngola;• TheInternationalCommissionforConservationofAtlanticTunas(ICCAT)• TheIndianOceanTunaCommission(IOTC)• TheSouthWestIndianOceanFisheriesCommission(SWIOFC)

Agriculture, Forestry and Fisheries IGDP: Situation analysis 29
• TheConventionontheConservationofAntarcticMarineLivingResources(CCAMLR)• TheSouthEastAtlanticFisheriesOrganization(SEAFO)
Other SADC protocols, agreements and programmes
There are a number of other protocols, programmes and agreements that South Africa has entered into or participates in, in the context of SADC regional integration. The following are some of the key ones:• SADCFireManagementActionPlan• RevisedProtocolonSharedWatercourseSystems• SADCSugarProtocol• SADCProtocolonInlandFisheries• DraftProtocolonManagementofFarmAnimalGeneticResources• SeedSecurityNetwork• SADCPlantGeneticResourcesCentre(SPGRC)Long-termSustainabilityStrategy• SADCProgrammeonConservationandSustainableUseofPlantandGeneticResourcesforFoodandAgriculture• LivestockInformationManagementSystem(LIMS)• RegionalPlanforAvianInfluenzaContingencies• Harmonisationofsanitaryandphytosanitaryrequirements• ConservationAgricultureRegionalWorkingGroup(CARWG)TheSouthernAfricanCustomsUnion(SACU)
The SACU consists of Botswana, Lesotho, Namibia, South Africa and Swaziland and was established in 1910, with its primary aim being to promote economic development among its members through regional coordination of trade. SACU has successfully negotiated trade agreements with the European Union (EU) and SADC, among others. Since all members of SACU are also members of SADC, questions remain about the future of SACU, given the SADC’s long-term targets to become a Customs Union.
2.3.5 conclusion—policy framework
In conclusion, it seems that despite the above-mentioned policies, strategies, programmes and agreements, government at this stage lacks an effective policy framework through which an economic and market environment can be provided for the transformation of South Africa’s agricultural, forestry and fisheries sectors, while maintaining productivity and production efficiency for purposes of ensuring national food security and a robust trade balance. Furthermore, unco-ordinated implementation and planning by government has frustrated the effective implementation of government strategy, with each programme designing its own implementation plan, leaving a fragmented scattering of projects across South Africa’s landscape. The realisation of the change government aims to effect through its strategies critically depends on its ability to translate strategic objectives into effective implementation plans, supported by monitoring and evaluation systems. There is much to be gained from an improvement in our governance systems. The lack of effective implementation, continuous monitoring and evaluation of progress made and resultant corrective action have left many policies and strategies abandoned. More important is the disjointed implementation of government policies and strate-gies. Cooperative governance requires effective management across all three spheres of government, sector organisa-tions and producers. Without an integrated approach and effective management of actions, roles and responsibilities, most strategies devised by the DAFF will result in ineffective implementation.
However, fundamental contradictions or conflict between South Africa’s current macroeconomic policies and develop-ment policies and strategies are matters of concern. A sector that displays great levels of concentration and exclusion, while propagating smallholders and subsistence farming as a means to overcome rural poverty and food insecurity, reflects fundamental policy gaps. In terms of transformation and equity interventions and initiatives, the focus in agri-culture in particular has been skewed towards new entrants, especially linked to the land reform programme, while inadequate support has been given to existing participants in the sector who are marginalised. There is therefore a need to correct this imbalance, for example, by effecting changes that will facilitate existing smallholders’ gainful access to mar-kets, by focusing less on primary cooperatives and more on secondary (e.g. marketing) cooperatives; and to improve the quality and accessibility of support systems and infrastructure so that larger numbers of producers may benefit.
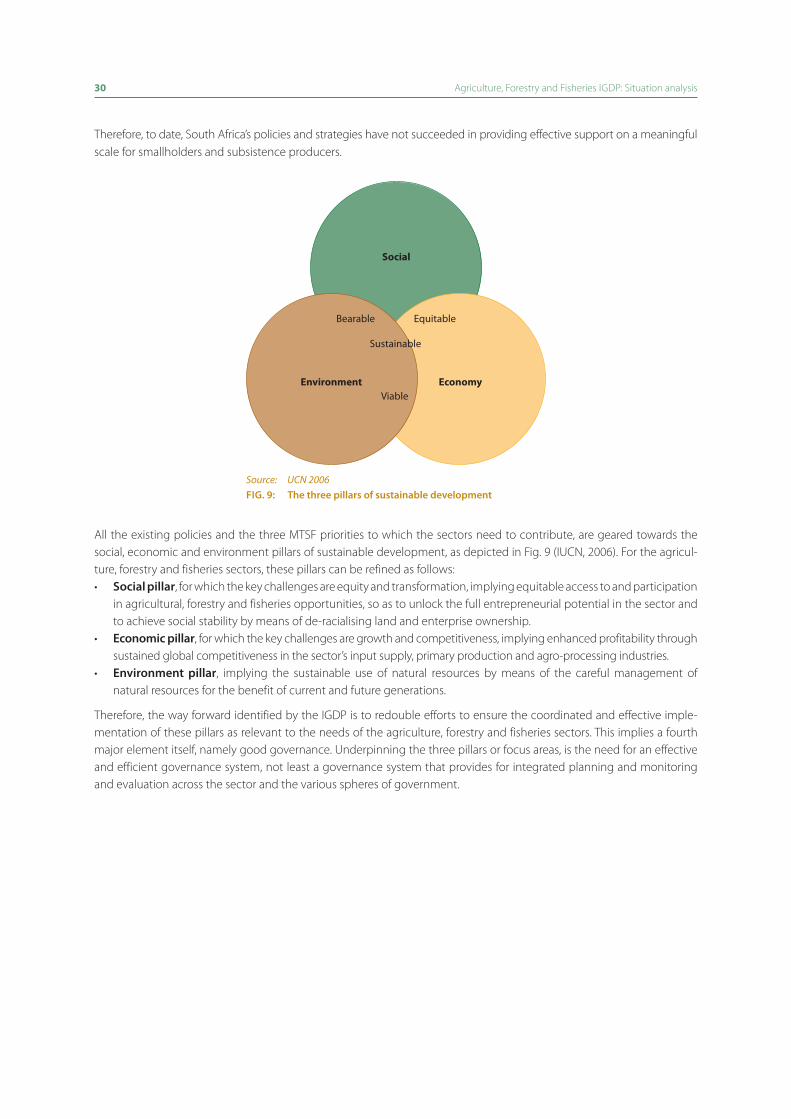
30 Agriculture, Forestry and Fisheries IGDP: Situation analysis
Therefore, to date, South Africa’s policies and strategies have not succeeded in providing effective support on a meaningful scale for smallholders and subsistence producers.
Social
Environment Economy
Bearable
Sustainable
Viable
Equitable
Source: UCN 2006Fig. 9: the three pillars of sustainable development
All the existing policies and the three MTSF priorities to which the sectors need to contribute, are geared towards the social, economic and environment pillars of sustainable development, as depicted in Fig. 9 (IUCN, 2006). For the agricul-ture, forestry and fisheries sectors, these pillars can be refined as follows:• social pillar, for which the key challenges are equity and transformation, implying equitable access to and participation
in agricultural, forestry and fisheries opportunities, so as to unlock the full entrepreneurial potential in the sector and to achieve social stability by means of de-racialising land and enterprise ownership.
• economic pillar, for which the key challenges are growth and competitiveness, implying enhanced profitability through sustained global competitiveness in the sector’s input supply, primary production and agro-processing industries.
• environment pillar, implying the sustainable use of natural resources by means of the careful management of natural resources for the benefit of current and future generations.
Therefore, the way forward identified by the IGDP is to redouble efforts to ensure the coordinated and effective imple-mentation of these pillars as relevant to the needs of the agriculture, forestry and fisheries sectors. This implies a fourth major element itself, namely good governance. Underpinning the three pillars or focus areas, is the need for an effective and efficient governance system, not least a governance system that provides for integrated planning and monitoring and evaluation across the sector and the various spheres of government.
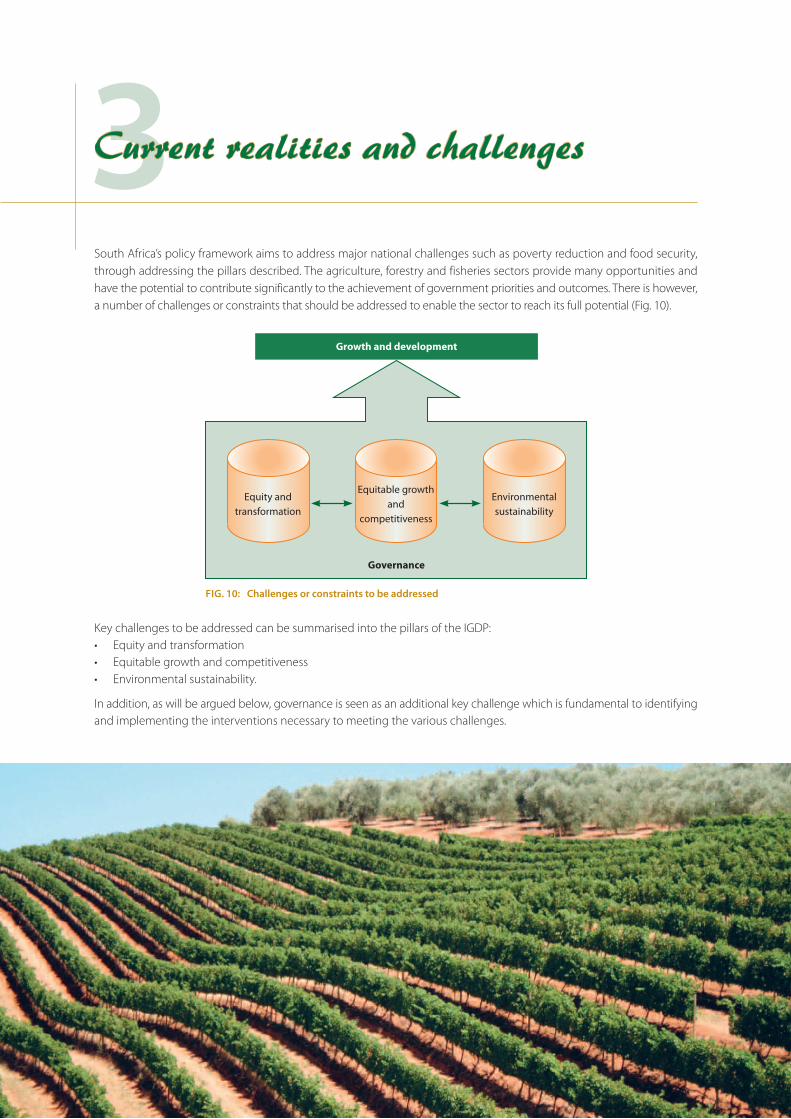
South Africa’s policy framework aims to address major national challenges such as poverty reduction and food security, through addressing the pillars described. The agriculture, forestry and fisheries sectors provide many opportunities and have the potential to contribute significantly to the achievement of government priorities and outcomes. There is however, a number of challenges or constraints that should be addressed to enable the sector to reach its full potential (Fig. 10).
3Current realities and challenges
Key challenges to be addressed can be summarised into the pillars of the IGDP: • Equityandtransformation• Equitablegrowthandcompetitiveness• Environmentalsustainability.
In addition, as will be argued below, governance is seen as an additional key challenge which is fundamental to identifying and implementing the interventions necessary to meeting the various challenges.
Fig. 10: challenges or constraints to be addressed
Equity and transformation
Equitable growth and
competitiveness
Environmental sustainability
Governance
Growth and development

32 Agriculture, Forestry and Fisheries IGDP: Current realities and challenges
The key challenges and their main causal factors are summarised in the problem tree on page 30. In the rest of this section, these key challenges, which are common to agriculture, forestry and fisheries, are reflected upon with a view to identifying interventions that will address them.
Fig. 11: Problem tree analysing challenges faced within the sectors
Key challenges Causes External root causes
Poverty and inequality
Jobless, inequitable growth Insufficient economic growthUnsustainable use of natural resources
Slow rate of establishment of SMMEs
Slow rate of transformation
Job losses and casualisation of employ-ment
Suboptimal production systems
Not making the most of opportunities
SA is less competitive in face of trade liberalisation
Suboptical regulatory framework (not prepared for climate change and other shocks)
Poor compliance
Inefficient and ineffective governance (dearth of capacity in the public sector – skills, experience, finances, organisation, coordination, knowledge management)
Inadequate knowledge and research
Poor enforce-ment
Poverty and inequality
Social ills, e.g. crime, HIV and AIDS
Poor education system
Poverty and inequality
Poor planning and M&E systems
Inadequate regulatory framework and enforcement
Dearth of skilled labour
Poor infrastructure and services
Inadequate support to new and emerging producers, SMMEs
Anti- competitive behaviour and poor access to markets
Slow reform of land and resource rights
Inadequate investment in and alignment of R&D
Inadequate support and/or protection
High input costs
Labour legislation issues
3.1 equity And trAnsForMAtion
3.1.1 rationale
Equity and transformation are interrelated topics. Equity refers to fairness and equal outcomes in terms of gender, race and class. Transformation is a process of profound change that should result in a new direction to a different level of effectiveness, where everyone contributes to a shared outcome and the economy is meaningfully depicted at all levels. Without the rules of transformation, equity cannot be reached.
The skewed interpretation that transformation is about the ‘blackness’ of a company, has not addressed economic, gender inequality and disability issues. The latter notion has displaced the transformation agenda away from addressing the condi-tions facing the workers and the achievement of meaningful economic empowerment. By allowing shallow interpreta-tions, transformation in agriculture, forestry and fisheries has only benefited a small number of black entrepreneurs to become the preferred beneficiaries of ‘transformation’ through shareholding.The challenge the facing the sectors in terms of equity, includes skewed and insufficient levels of transformation regarding broad-based black economic empowerment, equity in terms of access to markets, information and sufficient support provided at required scales and sufficient levels.

Agriculture, Forestry and Fisheries IGDP: Current realities and challenges 33
3.1.2 Problems and causal factors
Growth in the sector has not been accompanied by concomitant increases in transformation or employment. The AgriBEE and Forest Sector Charters provide for transformation in the sector, while the Land reform and redistribution process also provides for the redistribution of land in terms of ownership. At the same time, policies have attempted to broaden participation in the fisheries subsector. Despite various instruments, strategies and programmes developed specifically to address transformation, the sectors continue to wrestle with entrenched inequalities and to effectively address transfor-mation (Parusel & Viegi, 2009; Hall & Aliber, 2010). Furthermore, poverty and food insecurity remain unabated and in some cases worse than before.
Inadequate support to smallholder and subsistence farmers, small growers and small-scale fishers
Factors such as the lack of access to land, water, markets, finance, communications infrastructure, education and skills training, still prevent marginalised South Africans from making substantive progress in primary farming, forestry and fisheries, as well as in upstream and downstream enterprises associated with them. These are some of the factors that gave way to a cycle of skills deficit, crushing poverty, underdeveloped markets, low rates of public and private sector investment and a lack of infrastructure, reinforcing the cycle by impacting on the ability of black communities to engage in meaningful rural-based economic activities. Broad-based black economic empowerment and land reform initiatives are regarded as vitally important catalysts to address these imbalances (FIP, 2006).
Most national programmes explicitly targeting the so-called second economy within agriculture, forestry and fisheries, with the expected outcome of transforming the sector and building equity, fall short because they were not designed to impact at the scale required to make a difference at a socio-economic level and they have acted in isolation of each other, leaving beneficiaries seeking support from a fragmented array of projects and programmes.
As a result, they have benefitted relatively few people, without addressing the structural and systemic challenges that perpetuate inequality along racial divides within these sectors.
There is a lack of capacity within government and state-owned enterprises to reach and offer efficient and sufficient sup-port, limiting their scope to achieve the scale required. In agriculture, there has been a significant growth in budgets to provide direct support to black and disadvantaged smallholder farmers in the form of grants for infrastructure, production inputs and other items and recently through an extension service recovery programme (Hall & Aliber, 2010). However, these interventions have not been far-reaching. The Comprehensive Agricultural Support Programme (CASP), the Micro Agricultural Financial Institutional Scheme of South Africa (Mafisa) and extension services, averaging over the period 2005/06 through 2008/09, collectively absorbed about 58% of total provincial expenditure. During that period, there were about 61 000 beneficiaries per year under CASP (mostly land reform beneficiaries) and about 2 500 loan recipients via Mafisa. However, as the then NDA observed (PMG, 2008), while funding for CASP increased substantially year on year, the number of people supported by the programme remained more or less the same. Projects receiving funding tended to expand in size which benefitted a relatively small number of individuals.
According to the Stats SA 1997 Rural Survey, only 11% of farmers in the former homelands had had contact with an extension officer within the previous 12 months (Hall & Aliber, 2010). Thus, in a given year, at most 13% of black farming households derived direct benefits from the provincial spending on these three interventions. This picture is corroborated by Stats SA’s General Household Survey for 2009 and 2010. Unfortunately, similar data for the forestry and fisheries sectors is lacking.
This suggests that despite strong political and policy support for smallholder producers in South Africa and significant increases in budgets dedicated to this over the past decade, the support currently rendered to smallholder producers in South Africa is not consistent with the visions of the current policy and strategy. The lack of access to information and complex and unaffordable business transactional services, hamper the capacity of historically disadvantaged individuals to actively pursue the process of their own empowerment.
Meanwhile, these problems are being exacerbated by an increase in the consolidation of business and farming enter-prises, with generally smaller commercial farmers and firms closing down or being taken over. As a result, between 1993 and 2007, the number of commercial farm units declined by a third, while just under half of the 83% of forest plantation area that is privately owned is owned by big corporations. A similar pattern exists in fisheries.

34 Agriculture, Forestry and Fisheries IGDP: Current realities and challenges
Jobless growth
The process of farm consolidation continues despite the generally positive growth trend within agriculture—there is little reason to believe that consolidation is the cause of that growth. There appears to be a correlation between the con-solidation process and the decline in the size of the agricultural labour force. This is in part a statistical correlation (i.e. com-paring the 1993 and 2002 agricultural censuses, one observes a high correspondence between those districts with large amounts of consolidation and those with large drops in the numbers of farm workers), but there is also qualitative evi-dence to back it up (e.g. Simbi et al., 2000). In other words, agriculture is characterised by jobless growth coupled with the increasing externalisation of labour in certain sectors. The ongoing structural change in the sector is a cause for concern.
The distribution of income has grown more unequal within the agricultural sector, with 51% of all agricultural farms earning a gross income below R300 000 a year, while just eight agri-business companies have a turnover above R1 billion a year (Hall, 2009). At the same time, Vuk’uzenzele (2012) cites Stats SA which states that employment in the agricultural sector has declined at an average of about 5% per quarter—leaving a total of 598 000 jobs in agriculture by June 2011. There are also real concerns about the decline in permanent labour and the trend of increased casualisation of labour. Labour practices in the sector remain a concern.
In fisheries, although some fishing rights have been reallocated, most bona fide small-scale fishers have lost out and SMMEs, which government expected would create employment, have struggled (Isaacs et al., 2009). While the realloca-tion of rights has served to reduce poverty for the rights holders and entrepreneurs, the subsequent creation of jobs has only reduced poverty among those able to survive a robust, liberalised market. Government support programmes to SMMEs within the fishing industry are thus imperative (Isaacs et al., 2009).
Effects of trade liberalisation on transformation and national food security
The liberalisation of agricultural and food markets was premised on the expectation that deregulated market outcomes would be more efficient and would increase access to all market participants, benefitting producers and consumers alike (Chabane et al., 2008). However, this has not been the case. Liberalisation has not created a competitive market. At best, state intervention is replaced by private sector regulation (Rakhudu, 2009), which is a growing scenario within fisheries (Crosoer et al., 2006).
The agriculture, forestry and fisheries sectors remain largely characterised by anti-competitive outcomes, including a high concentration of ownership as well as vertical integration by major firms. The overall picture is that of high concentration at each level of the supply chain, signifying oligopolistic structures (Rakhudu, 2009), especially among input-suppliers (e.g. seed, fertiliser, etc.) and agro-processors.
Jobless, inequitable growth
Slow rate of establishment of SMMEs
Slow rate of transformationJob losses and casualisation of employment
Poor planning and M&E systemsInadequate regulatory framework and enforcement
Inadequate support to new and emerging producers, SMMEs
Anti-competitive behaviour and poor access to markets
Slow reform of land and resource rights
Labour legislation issues
A liberalised market policy environment favouring stronger companies, leading to the concentration of the sector and job losses
Fig. 12: Problem tree analysing jobless, inequitable growth
+

Agriculture, Forestry and Fisheries IGDP: Current realities and challenges 35
The major agro-processing firms are largely those that dominated at the time of liberalisation, although some are pri-vatised former cooperatives that have thrived particularly since liberalisation. At the same time, liberalisation has meant much greater volatility in the prices of agricultural products (Chabane et al., 2008). The resulting increase in the risk of farming has prevented new entrants from being effective competitors, or has deterred them from entering in the first place. Similarly, the integration of South African fisheries into the global economy has operated as a powerful constraint on post-apartheid fisheries reform (Crosoer et al., 2006).
It is apparent that South Africa’s trade and market policies have only benefitted the commercial sector, leaving smallholder producers and the small-scale fisheries sector struggling with growing socio-economic inequalities (Naudé & Coetzee, 2004). Therefore according to Rodrik (1998) and Mabugu & Chitiga (2007), trade policy on its own is an unreliable instru-ment for generating shared economic growth and the efficiency consequences of trade reform pale in comparison to its negative distributive effects.
There are studies that indicate that the impact of trade liberalisation on food security is ambiguous (Bezemer & Headey, 2008). However, with or without trade reform, world food prices are expected to continue rising indefinitely (Collier & Dercon, 2006; Cotula, 2008; Demeke et al., 2008), with dire consequences for poor households.
3.1.3 types of interventions required
All three sectors are challenged by ineffective and insufficient levels of transformation because of minimum compliance, lack of enforcement and monitoring and in some instances an absence of appropriate policies. As mentioned above, rendering AgriBEE more enforceable is one way of encouraging real change. Along with improved enforcement, there is a need for improved support and spending strategies, ensuring that government spending is a reflection of government policy and strategy for transformation. In order to fast track transformation within South Africa, systems and polices have to be put in place to enforce and ensure compliance among all parties.
As discussed in Altman et al., (2009), lessons from elsewhere in Africa suggest that input support interventions that target smallholders can boost production and food security. An example is the Agricultural Input Support Programme (AISP) of Malawi, which has raised yields across a large number of staple foods produced by smallholder farmers. Higher yields further enabled more households to withstand or cope with the food price shocks.
As urbanisation accelerates in South Africa, poverty is increasingly urbanised within metropolitan areas, cities and towns. The South African Cities Network (2002) observed that the typical “face of poverty” in South Africa is no longer only a rural woman engaged in subsistence agricultural production. It is an HIV positive child living in an environmentally degraded informal settlement in a rapidly growing city—without services. The table below, indicates urbanisation levels from the 2001 census.
Source: Kok and Collinson, Stats SA, 2006
Fig. 13: urbanisation levels from the 2001 census
100
90
80
70
60
50
40
30
20
10
0
Prop
orti
on u
rban
(%)
Western Cape
Eastern Cape
Northern Cape
Free State KwaZulu-Natal
North West Gauteng Mpuma-langa
Limpopo South Africa
Province

36 Agriculture, Forestry and Fisheries IGDP: Current realities and challenges
According the National Development Plan (2012), 60% of South Africans now live in the urban areas and the urbanisa-tion rate is expected to rise to 70% by 2030. However, urbanisation rates vary substantially between provinces. There are complex patterns of migration within rural provinces and between these provinces and large metropolitan areas as people move in search of work and livelihood opportunities. Burger et al., (2009), cited in Crush et al., (2010), suggest that in metropolitan areas urban farming remains a livelihood option of last resort but that in the smaller and poorer urban centres, urban farming makes a significant contribution to the livelihoods of the poor.
tAble 9: urban farming by province in south Africa
Province 2002 2007
no. % no. %
Eastern Cape 48 036 77 52 344 64
Free State 8 621 14 8 512 10
Gauteng 3 180 5 12 441 15
Northern Cape 1 559 2 1 779 2
Western Cape 723 1 1 767 2
North West 602 1 5 190 6
Source: Burger et al., (2009; 22), in Crush et al., (2010)
In this context, both urban food gardens and livestock farming will assume increased importance. Investigating the potential of urban farming to address food insecurity around the cities must be on the Food Policy Agenda of South Africa across the three spheres of government. An enabling policy and regulatory environment, education, resources, skills and support are crucial for ensuring household food security. The development and improvement of support services such as research and development, finance, extension, market access and infrastructure, is also needed.
More broadly, the IGDP also sees the need for agriculture, forestry and fisheries to support land reform, by creating an enabling environment for the sector to grow for the benefit of rural development. While this focuses on interventions primarily in rural areas, it also takes into account rural urban linkages and the implications of the urbanisation of poverty for household food security.
3.2 equitAble groWth And coMPetitiveness
3.2.1 rationale
The second key challenge to be addressed in the sectors is growth and competitiveness. Economic prosperity is vital—though not sufficient—for addressing poverty and improving human well-being. The main challenge facing these sectors is to contribute to economic growth and competitiveness while at the same time addressing equity and transformation, national food security and sustainability. This will require supporting the commercial sector while also increasing the contribution of smallholder and subsistence producers, increasing food production for domestic consumption as well as higher value exports.
3.2.2 Problems and causal factors
The commercial sector has shown positive growth over the past two decades. For instance, between 1990 and 2009, field crop production increased by 13%, horticultural production by 62% and animal products by 29%. Meanwhile, the export of forest products increased from R9,5 billion in 2001 to R12,5 billion in 2009.
However, several factors hamper the economic growth of agriculture, forestry and fisheries. Three important proximal fac-tors are the slow progress in terms of increasing production efficiency, poor innovation systems, the slow rate of opening up new markets and value-adding opportunities and the impact of the former in conjunction with the effect of globalisa-tion and free trade on South Africa’s competitiveness in global markets.

Agriculture, Forestry and Fisheries IGDP: Current realities and challenges 37
In a survey on the competitiveness in the agriculture sector (ABC, 2008), ten of the top fifteen constraining factors in 2008 were exactly the same as in 2004. The three ‘cost factors’, namely the cost of transport, cost of finance and the overall cost of doing business in South Africa, as well as the ‘lack of capacity’ factors, namely electricity supply and the lack of sufficient scientific research capacity, were perceived to be more restrictive in 2008 compared to 2004. These factors will have a direct influence on the ability of agribusiness in South Africa to continue to sell their products at competitive prices and the future sustainability of the agricultural sector. It is also important to note that the average score for the top fifteen constraining factors in 2008 is much lower than the average score in 2004. This indicates that the constraining impact of these factors on the competitiveness of agribusinesses in South Africa is becoming more severe.
These findings are in line with the Global Competitiveness Report published by the World Economic Forum in 2007. In explaining South Africa’s drop in global competitiveness rankings; the five most problematic factors for doing business in South Africa were identified to be: crime and theft, inefficient government bureaucracy, an inadequately educated workforce, restrictive labour regulations and inadequate supply of infrastructure.
The factors affecting the competitiveness of the agricultural subsector are probably equally applicable to the forestry and fisheries sectors.
Profitability
Efficiency and profitability within the sector are impeded by a number of factors, notably high input costs and innovation systems that do not efficiently translate R&D into practice. Contributing to the high costs of doing business are state-administered prices and taxes (e.g. electricity and property rates), lack of infrastructure (rail, harbour, electricity), crime, HIV and AIDS and a shortage of skilled labour. High oil prices have also contributed to escalating input costs, while the volatility of oil prices has contributed to uncertainty. Net importing countries of oil, such as South Africa, will probably continue to feel the burden of high oil prices, which affects its ability to increase its competitiveness.
Innovation
Innovations are new creations of economic significance of a material or intangible nature and play a central role in the productivity and sustainability of the sectors and therefore in keeping the sectors globally competitive. Innovation policies include elements of R&D, information and communications technology, education and infrastructure development and act as a fundamental driver of economic growth and development. The capacity of the sectors to support innovation is therefore vital.
Social ills, e.g. crime, HIV and AIDS
Poor education system Poverty and inequality
Suboptimal economic growth
Poor infrastructure and services
Dearth of skilled labour
Suboptical production systems
Unrealised opportunitiesSA is less competitive in face of trade liberalisation
High input costsInadequate investment in and alignment of R&D
Inadequate support and/or protection
Fig. 14: Problem tree analysing suboptimal economic growth

38 Agriculture, Forestry and Fisheries IGDP: Current realities and challenges
In South African agriculture, commercial farmers have historically been relatively well advanced in terms of technology, although quite dependent on imported technology, whether through imported machinery and agrochemicals, or under licence as is the case for genetically modified (GM) seed. On the other hand, smallholders and subsistence farms have been less endowed in terms of technology. The question is why South Africa’s innovation system is unable to support a growing commercial sector and a needy smallholder sector. With the limited data available, Sandrey & Vink (2008) show that innovation within the commercial sector has been the main driver in the growth of South Africa’s agricultural exports, while the innovative response by subsistence farmers seems to have been much more limited.
Effects of trade liberalisation on competitiveness
Trade liberalisation has been promoted by the World Bank and the International Monetary Fund (IMF) based on the argu-ment that openness to trade will contribute to competitiveness and therefore, in turn, economic growth and develop-ment, job creation and alleviation of poverty. Consequently, “South Africa is a case study of sweeping liberalisation of a formerly extensively regulated agricultural sector” (Roberts, 2009).
Foreign trade liberalisation over the past decades has led to the implementation of South Africa’s commitments under the World Trade Organization’s Agreement on Agriculture of 1994. Consequently, a wide range of instruments formerly used to subsidise commercial farmers were removed (Committee to Review the Agricultural Marketing Environment, 2006, citing Vink & Kirsten, 2002 and OECD, 2005). The process of deregulation had a mixed impact on different agricul-tural subsectors (Minister of Agriculture and Land Affairs, 2006). The greatest impact was on the grain industry, through its effect on the quantity and composition of output (e.g. the shift away from wheat and the increase in the production of soya beans), the location of production, the adoption of new minimum-intervention production practices and the structure of the supporting institutions such as the creation of the South African Futures Exchange (SAFEX), etc. In addition, there were considerable effects on agribusiness both in terms of supply of inputs and in terms of downstream processors. Further more, many input industries have experienced a decline in domestic sales.
Although earlier analyses (e.g. by the OECD and World Bank) found that policy reform related to foreign trade liberalisation has benefited the entire agricultural sector, further analysis reflects that those who gained were the most efficient com-mercial farmers and a few farm workers who have been able to retain positions as permanent employees (Committee to Review the Agricultural Marketing Environment, 2006, citing Vink & Kirsten, 2002 and OECD, 2005). Those who lost include consumers, owing to increasing food prices, smaller commercial farmers, some 400 000 farm workers who lost their jobs and a smaller but significant number of farm workers who lost permanent jobs and became seasonal/temporary workers.
Other studies, however, have shown that further trade liberalisation envisaged under a successful Doha Round of negotia-tions would have overall positive benefits for the South African economy, mainly in the form of net increases in employ-ment (Nyhodo et al., 2009). Although the exact magnitude of the economic benefits is not clear, whatever marginal benefits that would have to be forgone as a result of lack of progress in trade liberalisation, would also mean stalled progress towards ensuring economic growth and equity. The need for a united front in multilateral negotiations by African and developing countries becomes even more serious for the purposes of effective bargaining for mutual interests and priorities. South Africa should therefore invest in the formation of strong alliances with its African partners from the south in order to more effectively participate in any future agricultural trade liberalisation negotiations.
There are increasing bilateral trade arrangements between countries. The impact of this is that preferential trade arrange-ments and tariff policy space are eroded. Managing a multitude of trade agreements is increasingly cumbersome and puts a heavy burden on government resources to police trade within the ambit of such agreements. This leads to increasing competition for local producers. Tools to manage trade among countries are changing: tariffs have been reduced signifi-cantly since the conclusion of the Uruguay Round of international trade negotiations (1995–2000) and there has been a significant increase in the use of mandatory, voluntary and private standards and regulations that affect trade. This has meant that players within the sector have to meet stricter requirements in order to compete in certain markets and this has led to the loss of trade in some areas. In the World Trade Organization’s subsequent Doha Round (2001 to present), it has been anticipated that less developed countries will be afforded more consideration. However, the collapse of trade talks in this round has been seen as a blow for the developing world’s agriculture and related sectors. This means a stalling of potential agreements that would have seen reduction of subsidies by developed countries as well as achievement of duty-free, quota-free market access for developing countries in the developed world.
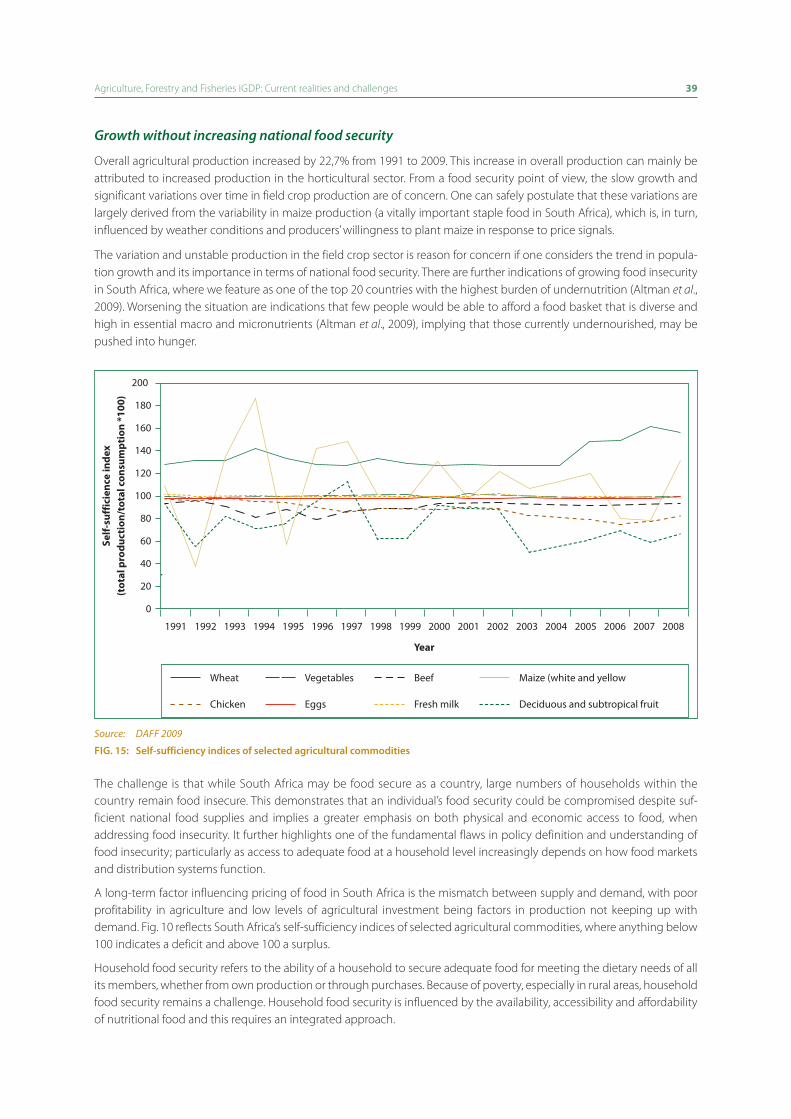
Agriculture, Forestry and Fisheries IGDP: Current realities and challenges 39
Growth without increasing national food security
Overall agricultural production increased by 22,7% from 1991 to 2009. This increase in overall production can mainly be attributed to increased production in the horticultural sector. From a food security point of view, the slow growth and significant variations over time in field crop production are of concern. One can safely postulate that these variations are largely derived from the variability in maize production (a vitally important staple food in South Africa), which is, in turn, influenced by weather conditions and producers’ willingness to plant maize in response to price signals.
The variation and unstable production in the field crop sector is reason for concern if one considers the trend in popula-tion growth and its importance in terms of national food security. There are further indications of growing food insecurity in South Africa, where we feature as one of the top 20 countries with the highest burden of undernutrition (Altman et al., 2009). Worsening the situation are indications that few people would be able to afford a food basket that is diverse and high in essential macro and micronutrients (Altman et al., 2009), implying that those currently undernourished, may be pushed into hunger.
200
180
160
140
120
100
80
60
40
20
0
Year
1991 1992 1993 1994 1995 1996 1997 1998 1999 2000 2001 2002 2003 2004 2006 2007 20082005
Source: DAFF 2009
Fig. 15: self-sufficiency indices of selected agricultural commodities
Self-
suff
icie
nce
inde
x
(tot
al p
rodu
ctio
n/to
tal c
onsu
mpt
ion
*100
)
Wheat Maize (white and yellow
Chicken Deciduous and subtropical fruit
Vegetables Beef
Eggs Fresh milk
The challenge is that while South Africa may be food secure as a country, large numbers of households within the country remain food insecure. This demonstrates that an individual’s food security could be compromised despite suf-ficient national food supplies and implies a greater emphasis on both physical and economic access to food, when addressing food insecurity. It further highlights one of the fundamental flaws in policy definition and understanding of food insecurity; particularly as access to adequate food at a household level increasingly depends on how food markets and distribution systems function.
A long-term factor influencing pricing of food in South Africa is the mismatch between supply and demand, with poor profitability in agriculture and low levels of agricultural investment being factors in production not keeping up with demand. Fig. 10 reflects South Africa’s self-sufficiency indices of selected agricultural commodities, where anything below 100 indicates a deficit and above 100 a surplus.
Household food security refers to the ability of a household to secure adequate food for meeting the dietary needs of all its members, whether from own production or through purchases. Because of poverty, especially in rural areas, household food security remains a challenge. Household food security is influenced by the availability, accessibility and affordability of nutritional food and this requires an integrated approach.

40 Agriculture, Forestry and Fisheries IGDP: Current realities and challenges
3.2.3 types of interventions required
The total area of production for agriculture and forestry must be increased and the productivity of existing areas increased in a manner that ensures equitable growth and competitiveness of the sector. The Industrial Policy Action Plan II (IPAP 2) of the South African government has identified sectors that possess the most potential for promoting sustainable and equitable economic growth and employment. The Agriculture, Forestry and Fisheries IGDP is therefore crafted with the deliberate aim of aligning with the relevant interventions as identified in IPAP 2.
There is a real need for targeted investment to lower the overall cost of production and enhance the competitiveness of the sector by broadening participation within the commercial sector.
In South Africa, farmers are facing a dynamic global economic and trade environment caused by the liberalisation of inter-national markets and rapid advances in information and technologies. The main factors that will help promote the global competitiveness of South African farmers and the agricultural sector in general, include good governance at all levels of government and industry, an innovation system for commercial and smallholder farmers, improving the skills levels of labour and promoting the adoption of new technologies.
The new South African competition law forms an important part of reforms designed to both address the historical economic structure and encourage broad-based economic growth. Addressing increasing concentration within these sectors requires the IGDP to look at factors affecting the competition policy alongside the Department of Trade and Industry (dti) and the Economic Development Department (EDD), with a focus on the food-producing sector. The objec-tives of such an intervention must encourage free and fair competition, prevent the concentration of market power and thereby promote ‘balanced development’ within agriculture, forestry and fisheries. However, a key challenge in determin-ing appropriate medium to long-term interventions is the development of policy settings which enable producers to efficiently adjust to a less regulated, liberalised marketing environment.
In terms of agro-processing, there is a clear need to support South African exporters to position their products better in fast-growing, developing country destinations and Africa. This may require focused export intelligence and marketing support as well as intergovernmental assistance to ensure that South African products are not unfairly subject to non-tariff barriers. Greater emphasis and investment is required in understanding and managing international trade standards and regulations, especially in the areas of food safety and sanitary and phytosanitary measures. A further dimension is to efficiently address trade disputes that arise from the aforementioned.
The changing economic outlook determined by continued uncertainty in the global economy combined with domestic structural constraints will have an impact on the realisation of the potential of the agriculture, forestry and fisheries sectors to contribute to growth and development. Interventions and deliverables within the IGDP have been proposed with due consideration of these forecasts. In crafting strategies and plans it is important to take cognisance of internal and external constraints and opportunities as these may affect the eventual realisation of targets and objectives arising from such plans. Having identified some of the key global realities affecting the sector, the remaining question is how these realities are likely to impact on the envisaged sector growth plan in terms of its key pillars, namely growth and competitiveness, equity and environmental sustainability. In addition, what critical choices and trade-offs would have to be made in these key intervention areas as a consequence?
Innovative interventions are required to capitalise on the opportunities that exist. In this regard Public-Private Partner-ships are vitally important, as well as closer cooperation between relevant government departments and parastatals. It is also imperative that greater emphasis is put on the potential impact of bilateral trade agreements, because these have significant implications for South Africa’s future trade direction. Bilateral trade agreements provide the opportunity to increase trade by gaining preferential market access and providing the foundation for collaboration. For purposes of this IGDP it is therefore imperative that changes to trade policy and the use of trade tools receive careful and transparent consideration to address equity as well as growth and competitiveness.
Investment in innovation is critical for supporting further growth of agriculture, forestry and fisheries. However, innovation must not only support the growth of large-scale commercial enterprises, but support the competitiveness of smallhold-ers so that they can constitute an ever-larger part of an increasingly heterogeneous commercial sector. Innovation is also critical to support subsistence producers so that they can more effectively and efficiently meet their own food needs, even if only partially.

Agriculture, Forestry and Fisheries IGDP: Current realities and challenges 41
There is also increasing pressure on plantation forestry to contribute towards renewable energy (Talbot & Ackerman, 2009). Plantations are rationally laid out, located in areas of high productivity, typically have good infrastructure and are serviced by technologically efficient harvesting systems. Therefore they have an inherent capacity to contribute more to bio-energy feed stocks than other, more natural forms of forest or forest management.
The potential for new fisheries is being investigated and product development in the existing fisheries sector needs atten-tion. The potential of many existing fisheries could be improved if the resources were allowed to recover to levels that would allow harvesting at higher sustainable yields. However, human needs make this a challenge; with growing com-petition for natural resources, there is a need to establish the value of the ecosystem services within fisheries, to better inform policy and strategic trade-off decisions.
3.3 ecologicAl sustAinAbility
3.3.1 the challenge and why it is a key one
Sustainability is about the capacity to endure. It pertains to the maintenance of the productivity of ecological systems and the potential for long-term maintenance of human well-being. It is about ensuring that future generations are no worse off as a result of decisions made in the present.
Unsustainable use of natural resources
Suboptimal regulatory framework (not prepared for climate change and other shocks)
Poor compliance
Inadequate knowledge and research
Poor enforcementPoverty and inequality and/or protection
Fig. 16: key challenges – ecological sustainability
Activities within each of the sectors impact on the resources upon which they depend, as well as on other ecosystems which provide value elsewhere. These values are derived from the ‘services’ that ecosystems provide. The term ‘ecosystem services’ refers to diverse benefits that ecosystems provide to society. Ecosystems provide harvestable outputs such as grazing, fish, timber and other natural resources, which underpin much of our farm production and many of the activities in the forestry and fisheries subsectors (apart from plantation forestry and aquaculture). However, ecosystems also furnish benefits such as maintaining biodiversity, promoting climatic stability by means of carbon sequestration and storage and they have implicit and often under-recognised cultural value. The provision of these services is dependent on the management and protection of ‘natural capital’, or the resource base. If this natural capital is compromised, for example by overexploitation or bad choices, then the flow of services is compromised as well.
One of the main ways that natural capital is protected is by means of law and regulation. South Africa has a myriad of laws and regulations that seek to protect the environment. There are also a number of practices that correct for the sometimes negative externalities of agricultural production, such as trapping of eroded sediments and water purification. Agriculture, forestry and fisheries are also affected by ecosystem ‘dis-services’ that have the effect of reducing productivity or increas-ing production costs (e.g. competition for water and nutrients by undesired species). The flows of these services and dis-services directly depend on how ecosystems are managed and upon the diversity, composition and functioning of the remaining natural ecosystems in the landscape/seascape (see Fig. 17). Managing landscapes and seascapes to provide sufficient supporting and regulating ecosystem services and fewer dis-services, must become a key focus of the IGDP and may still require research that is policy relevant, multidisciplinary and collaborative. Without required evidence it is
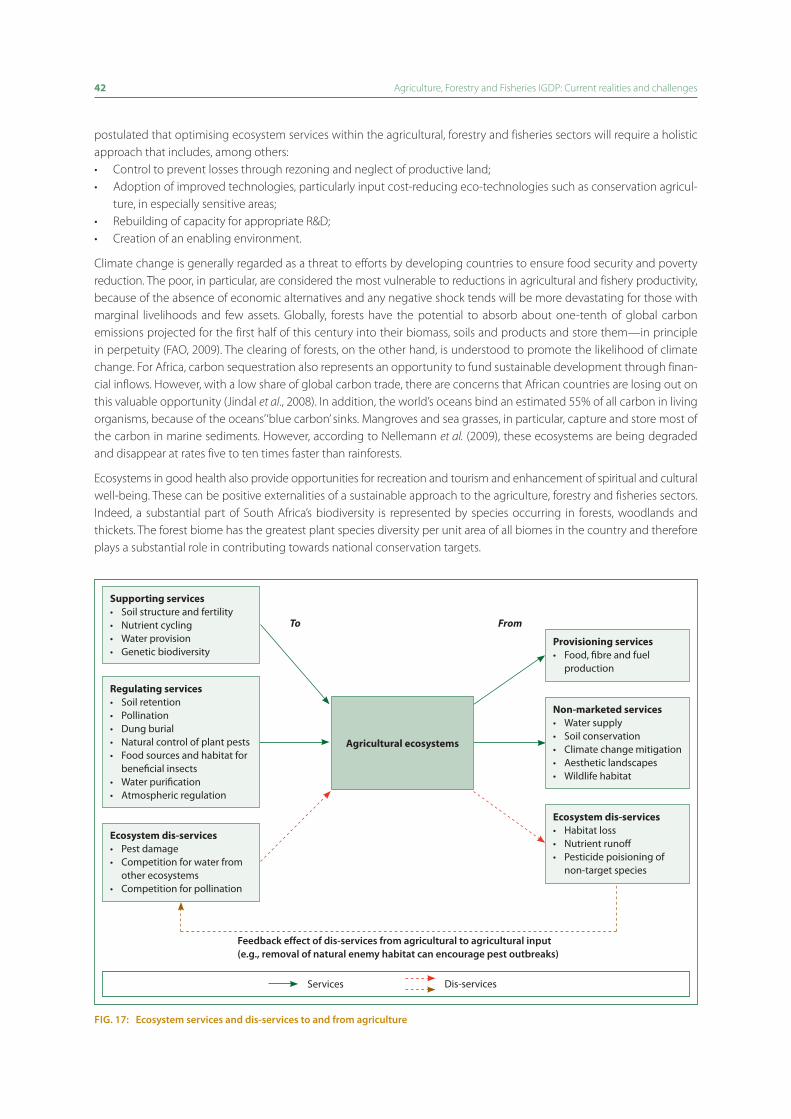
42 Agriculture, Forestry and Fisheries IGDP: Current realities and challenges
postulated that optimising ecosystem services within the agricultural, forestry and fisheries sectors will require a holistic approach that includes, among others:• Controltopreventlossesthroughrezoningandneglectofproductiveland;• Adoptionofimprovedtechnologies,particularlyinputcost-reducingeco-technologiessuchasconservationagricul-
ture, in especially sensitive areas;• RebuildingofcapacityforappropriateR&D;• Creationofanenablingenvironment.
Climate change is generally regarded as a threat to efforts by developing countries to ensure food security and poverty reduction. The poor, in particular, are considered the most vulnerable to reductions in agricultural and fishery productivity, because of the absence of economic alternatives and any negative shock tends will be more devastating for those with marginal livelihoods and few assets. Globally, forests have the potential to absorb about one-tenth of global carbon emissions projected for the first half of this century into their biomass, soils and products and store them—in principle in perpetuity (FAO, 2009). The clearing of forests, on the other hand, is understood to promote the likelihood of climate change. For Africa, carbon sequestration also represents an opportunity to fund sustainable development through finan-cial inflows. However, with a low share of global carbon trade, there are concerns that African countries are losing out on this valuable opportunity (Jindal et al., 2008). In addition, the world’s oceans bind an estimated 55% of all carbon in living organisms, because of the oceans’ ‘blue carbon’ sinks. Mangroves and sea grasses, in particular, capture and store most of the carbon in marine sediments. However, according to Nellemann et al. (2009), these ecosystems are being degraded and disappear at rates five to ten times faster than rainforests.
Ecosystems in good health also provide opportunities for recreation and tourism and enhancement of spiritual and cultural well-being. These can be positive externalities of a sustainable approach to the agriculture, forestry and fisheries sectors. Indeed, a substantial part of South Africa’s biodiversity is represented by species occurring in forests, woodlands and thickets. The forest biome has the greatest plant species diversity per unit area of all biomes in the country and therefore plays a substantial role in contributing towards national conservation targets.
To
Fig. 17: ecosystem services and dis-services to and from agriculture
From
Feedback effect of dis-services from agricultural to agricultural input (e.g., removal of natural enemy habitat can encourage pest outbreaks)
Services Dis-services
Agricultural ecosystems
Regulating services• Soil retention• Pollination• Dung burial• Natural control of plant pests• Food sources and habitat for
beneficial insects• Water purification• Atmospheric regulation
Supporting services• Soil structure and fertility• Nutrient cycling• Water provision• Genetic biodiversity
Ecosystem dis-services• Pest damage• Competition for water from
other ecosystems• Competition for pollination
Non-marketed services• Water supply• Soil conservation• Climate change mitigation• Aesthetic landscapes• Wildlife habitat
Provisioning services• Food, fibre and fuel
production
Ecosystem dis-services• Habitat loss• Nutrient runoff• Pesticide poisioning of
non-target species
Agriculture, Forestry and Fisheries IGDP: Current realities and challenges 43
3.3.2 Problems and causal factors
The impact of sector activities
Agricultural practices can have a direct impact on productive lands and biodiversity, as well as an indirect impact on downstream water quality and flows and aquatic ecosystem health. The continued pressure on agriculture to increase output per unit of land intensifies the challenge to ensure that the natural resource base is protected. Programmes initi-ated by the former Department of Agriculture to protect the resource base are successful, but insufficient.
Agriculture also contributes to global climate change through the release into the atmosphere of greenhouse gases such as carbon dioxide, methane and nitrous oxide. Livestock contribute 18% of global greenhouse gas emissions (FAO, 2006). Industrial meat production contributes to global warming through deforestation for ranching—this industry is the largest contributor to deforestation—and gas production. Commercial, export-oriented and input-intensive agriculture contributes to climate change through carbon emissions from petrol and diesel, in the production and sourcing of inputs, in primary production, in processing and in transport and international trade. Smallholder farming is less environmentally damaging, in terms of climate impact. Some studies point out that the most pervasive response to climate change in agricultural policies in Africa has been the promotion of large industrial-scale biofuel production, which itself is a carbon-intensive form of production and has displaced many smallholder farmers engaged in less ecologically damaging forms of production (Oxfam, 2008).
While it is generally agreed that biofuels can be benign or even result in positive net contributions to environmental sustainability, much depends on the details of the choices made, e.g. what kind of biofuel using which feedstock under what kind of production system.
Plantation forestry displaces indigenous vegetation such as grasslands, impacts on stream flows and therefore has an impact on biodiversity and other production systems, e.g. through the spread of invasive species. Commercial forestry and water yield is a significant issue in a dry country like South Africa. Commercial forest plantations cover 1,2% of the total area of the country and reduce the total mean annual stream flow by about 2,7%. Pulp and paper mills are the largest users of water (± 250 million m³ per annum) among the forest industry processing plants and produce the largest volume of waste. However, when well managed, plantation forestry tends to have positive effects on water quality by reducing surface runoff, evaporation and loss of topsoil, while poor management of certain forest operations (e.g. road construc-tion, timber extraction and site preparation) can result in large quantities of suspended sediment being discharged into river systems.
The commercial use of indigenous forests has a more direct impact on biodiversity. However, these pressures are relatively minor in comparison to the pressure on the natural woodlands that cover a large part of South Africa. These woodlands coincide with the majority of South Africa’s poorest inhabitants who depend on them for food, fuel, shelter and medicine.
Many capture fisheries in South Africa are exploited beyond sustainable levels and some resource stocks have collapsed or have reached economic extinction. Sustainable resource management is essential in terms of fisheries management and the expansion of the fisheries sector’s total activity is limited by the natural productive capacity of the living marine resources upon which the activities depend. It is therefore necessary to limit and control the harvesting pressure according to what the resources can sustain on a long-term basis. Aquaculture can also have a negative impact on the environment, most notably on water quality and genetic integrity of wild stocks, alien species and disease.
Lack of compliance
Many of the above problems stem from a lack of compliance rather than lack of appropriate regulations. This lack of com-pliance can be attributed to a combination of poor enforcement within the sectors as well as the problems of poverty and inequality that are much bigger than in the other sectors.
Climate change
Climate change will have an impact on all three sectors and the absence of clear mitigation and adaptation strategies is of real concern. Temperatures are predicted to rise by 4 to 7 °C by the end of the 21st century (Lord Stern, 2009). Some of the effects of climate change are already visible and are advancing fast. The effects of climate change on agricultural production include (FAO, 2003):
44 Agriculture, Forestry and Fisheries IGDP: Current realities and challenges
• Increased heat stress to crops and livestock, for example, higher night-time temperatures, which could adversely affect grain formation and other aspects of crop development;
• Apossibledeclineinprecipitationinsomefood-insecureareas,includingmuchofsouthernAfrica;• Increasedevapo-transpirationratescausedbyhighertemperaturesandlowersoilmoisturelevels;• Concentrationofrainfallintofewerdiscreteevents,whichwillincreaseerosionandfloodrisks;• Changesinseasonaldistributionofrainfall,withlessfallinginthemajorgrowingcropseason;• Disruptionoffoodproductionandsupplybymorefrequent,severeandextremeclimaticevents.
In addition, developed countries are expected to experience an increase in production, while developing countries are expected to see a decline in production, with an overall 10% global reduction in cereals farmed, which will likely lead to higher food prices (Future Water, 2008).
Climate change will also have detrimental effects on fisheries. On a global scale, climate change will lead to changes in ocean circulation, a rise in sea levels, increased frequency and severity of storm events, water-column stratification and loss of coastal pumps, ocean acidification, loss of coral reefs and associated biodiversity, loss of mangrove forests and sea-grasses, and, ultimately, changes in the distribution, abundance and availability of fish stocks.
The impact of climate change will add significantly to the development challenges of ensuring food security and poverty reduction. It is the poor who are the most vulnerable to reductions in agricultural productivity, especially with subsistence farming. The poor also often have limited access to alternatives and cannot easily move away from farming options into other sectors to generate alternative incomes (Jones & Thornton, 2003).
Regulatory frameworks and lack of compliance
All of these activities have regulatory frameworks which aim to minimise their impact and ensure their sustainability. In some cases these regulatory frameworks are inadequate. To some extent management effectiveness is also limited by a lack of information.
Insufficient research and development
Research and technology development is of particular importance in the management of our natural resource base within fisheries. A huge percentage of current government-funded and managed research projects within fisheries is directed at managing the natural resource base, which, in turn, informs existing management systems. Continued and improved research and development (R&D) support in this regard is therefore of particular importance within fisheries. It is important that fisheries research be conducted in accordance with best international practice and concepts, such as an Ecosystem Approach to Fisheries and be inculcated into the research and management protocols. With respect to aquaculture, new research focused on the development of culture technology is needed. A major gap also exists in the fields of social and economic research relevant to fisheries and fishing communities. This has to be addressed urgently.
Similarly, forestry relies heavily on R&D support for the improvement in silviculture, management of limited water resources and risk and disaster management (fires, pest and disease control).
3.3.3 interventions required
Scholars have pointed out the need for increased investment in economic sectors that build on and enhance the earth’s natural capital and/or reduce ecological scarcities and environmental risks—otherwise referred to as the green economy. Examples are renewable energy, low-carbon transport, energy efficient buildings, clean technologies, improved waste management, improved freshwater provision, sustainable agriculture and forest management and sustainable fisheries. The Agriculture, Forestry and Fisheries Sector has the potential to contribute to the green economy and creation of green jobs. DAFF, through the integrated growth and development plan, should therefore position itself to take advantage of the significant growth, employment and environmental sustainability benefits provided by the green economy.
South Africa must balance the demands of economic development and its finite supplies of natural resources. To aid in the sustainable management of our natural resources, ecosystem-based management (EBM) has recently been proposed as a benefit optimisation and decision-making strategy that incorporates often conflicting development and conserva-tion uses. In other words, the environment does not have preference over people and people are not allowed to exploit

Agriculture, Forestry and Fisheries IGDP: Current realities and challenges 45
and destroy our natural resources. This will include establishment of adequate protected area management systems. There is already a commitment to increasing emphasis on Marine Protected Areas (MPAs) and exploration of ecosystem-based management (Branch & Clark, 2006). The conservation planning process that aims at conserving key natural forests, thickets and woodlands is still in its early stages and will have to be advanced during the next five years through national scale mapping of the woodlands (including thickets) and through generating primary data on their biological diversity that would support quantitative decision models for the determination of conservation priorities and targets.
With regard to climate change, there is the need to develop both adaptation and mitigation strategies for the sector. In agriculture, the most important adaptation strategies identified in major research studies on African farmers and climate change are diversification in crop and livestock production (varieties and breeds), income diversification and migration (Dinar et al., 2008). However, opportunities to adapt in these ways are not equally available to all; as one major study concludes, “too often it will be poor people whose adaptive capacities are the most constrained” (Mortimer et al., 2009). This forms the basis for a strong argument in favour of public policies to support adaptation by poor producers, on the grounds of human rights, economic development and environmental sustainability. The most effective adaptations will require substantial public and private investments in irrigation and support of “crop varieties and animal breeds that are tolerant to heat, water and low fertility stresses” and to build roads and marketing infrastructure to improve small farmers’ access to critical inputs as well as to output markets (Dinar et al., 2008). For both crop production and animal husbandry, diversification (of crops and varieties and of breeds) is a centrally important adaptation strategy that may be pursued autonomously (‘private adaptation’) by farmers but should be accompanied and anticipated by ‘public adaptation’—these shifts in production should be planned for, researched and supported through government policies. Planting different varieties of the same crop—and maintaining seed varieties—is also a key adaptation strategy to limit the possibilities of total harvest failure.
There is an important role therefore for research on the robustness of seed varieties and extension services to advise on crop choice and planting times, as precipitation and temperature changes have an increasingly bigger effect. Similarly, “adaptation by livestock farmers includes changing seasonal grazing migrations to take advantage of alternative forage when their usual grazing is damaged by drought. More water-efficient production technologies will be essential in South Africa, as will rainwater harvesting for smallholder production” (Dinar et al., 2008). In contrast to much of the literature that emphasises the need for greater investment in irrigation, a major study by three respected institutions—IIED, IUCN and UNDP—shows how drylands can be resilient ecosystems and, in the face of climate change, people living and producing in drylands are themselves already resilient. IIED promotes a “resilience paradigm” to responding to climate change in dry-lands, in which the priority is development that can promote sustainability—rather than degrading resources. Increased production is needed in drylands, not less and producers in marginal areas should have stronger, more secure rights to natural resources. Enabling policy should focus on valuing dryland ecosystems, restoring investment, linking up with effective (and equitable) markets and rebuilding institutions (Mortimer et al., 2009).
Climate change will undoubtedly influence South African fisheries and options that can both reduce and mitigate these effects have to be developed and implemented as a matter of urgency. The strong decadal variability implies that we must use adaptive management strategies at five to ten-year intervals as productivity and distribution of resources change.
3.4 governAnceThe inadequate implementation of good policies is a result of the misalignment of policies between different govern-ment departments and ministries, the lack of proper understanding of the effects of policies at macro and micro levels and poor communication between regulators, implementation bodies and stakeholders in general. These issues are not unique to South Africa and have to be addressed within the proper institutional frameworks.
It is imperative that policies, which are made within government departments and between different ministries, are efficiently synchronised at national and provincial levels. Efficient communication pertaining to such synchronisation between all stakeholders and directly affected groups is vitally important. Furthermore, the cross-cutting effects of policy making and implementation between different government departments and the constituencies they represent have to be taken into consideration. In order to address this situation, cognisance must be taken of the fact that effective policy implementation depends on the level of detail at which implementation structures and mechanisms are scrutinised and engineered for their appropriateness for implementation.
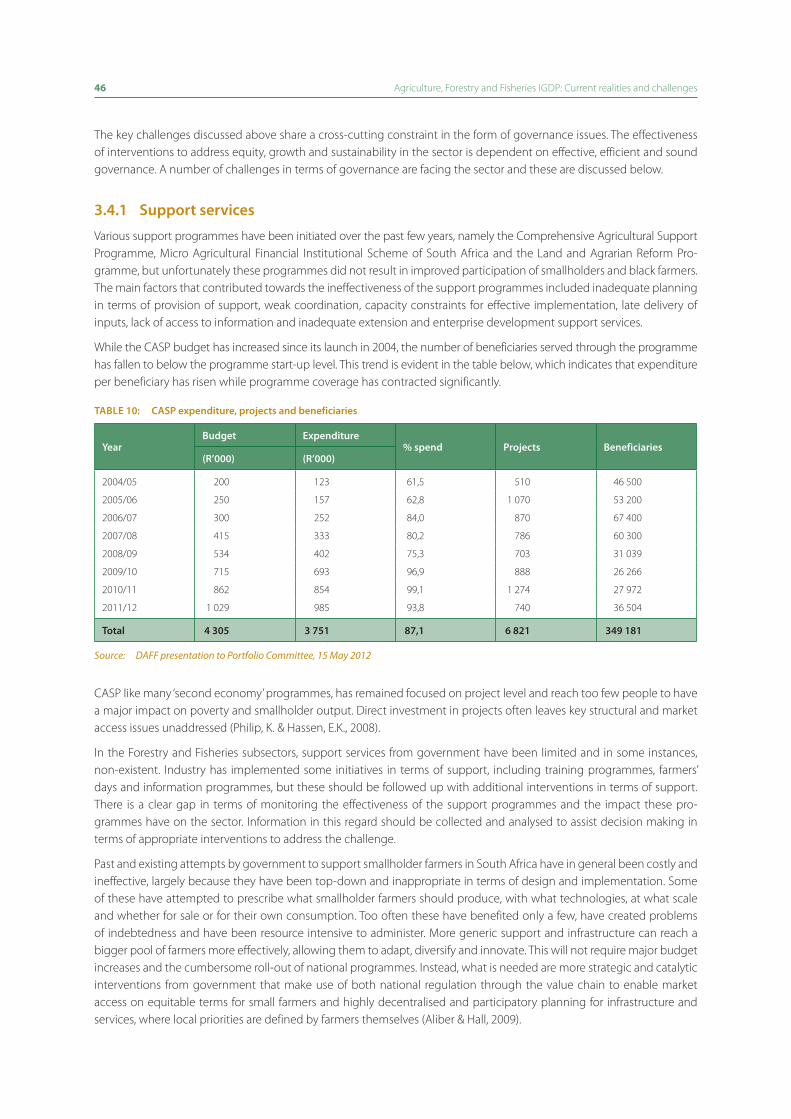
46 Agriculture, Forestry and Fisheries IGDP: Current realities and challenges
The key challenges discussed above share a cross-cutting constraint in the form of governance issues. The effectiveness of interventions to address equity, growth and sustainability in the sector is dependent on effective, efficient and sound governance. A number of challenges in terms of governance are facing the sector and these are discussed below.
3.4.1 support services
Various support programmes have been initiated over the past few years, namely the Comprehensive Agricultural Support Programme, Micro Agricultural Financial Institutional Scheme of South Africa and the Land and Agrarian Reform Pro-gramme, but unfortunately these programmes did not result in improved participation of smallholders and black farmers. The main factors that contributed towards the ineffectiveness of the support programmes included inadequate planning in terms of provision of support, weak coordination, capacity constraints for effective implementation, late delivery of inputs, lack of access to information and inadequate extension and enterprise development support services.
While the CASP budget has increased since its launch in 2004, the number of beneficiaries served through the programme has fallen to below the programme start-up level. This trend is evident in the table below, which indicates that expenditure per beneficiary has risen while programme coverage has contracted significantly.
tAble 10: cAsP expenditure, projects and beneficiaries
yearbudget expenditure
% spend Projects beneficiaries(r’000) (r’000)
2004/05 200 123 61,5 510 46 500
2005/06 250 157 62,8 1 070 53 200
2006/07 300 252 84,0 870 67 400
2007/08 415 333 80,2 786 60 300
2008/09 534 402 75,3 703 31 039
2009/10 715 693 96,9 888 26 266
2010/11 862 854 99,1 1 274 27 972
2011/12 1 029 985 93,8 740 36 504
total 4 305 3 751 87,1 6 821 349 181
Source: DAFF presentation to Portfolio Committee, 15 May 2012
CASP like many ‘second economy’ programmes, has remained focused on project level and reach too few people to have a major impact on poverty and smallholder output. Direct investment in projects often leaves key structural and market access issues unaddressed (Philip, K. & Hassen, E.K., 2008).
In the Forestry and Fisheries subsectors, support services from government have been limited and in some instances, non-existent. Industry has implemented some initiatives in terms of support, including training programmes, farmers’ days and information programmes, but these should be followed up with additional interventions in terms of support. There is a clear gap in terms of monitoring the effectiveness of the support programmes and the impact these pro-grammes have on the sector. Information in this regard should be collected and analysed to assist decision making in terms of appropriate interventions to address the challenge.
Past and existing attempts by government to support smallholder farmers in South Africa have in general been costly and ineffective, largely because they have been top-down and inappropriate in terms of design and implementation. Some of these have attempted to prescribe what smallholder farmers should produce, with what technologies, at what scale and whether for sale or for their own consumption. Too often these have benefited only a few, have created problems of indebtedness and have been resource intensive to administer. More generic support and infrastructure can reach a bigger pool of farmers more effectively, allowing them to adapt, diversify and innovate. This will not require major budget increases and the cumbersome roll-out of national programmes. Instead, what is needed are more strategic and catalytic interventions from government that make use of both national regulation through the value chain to enable market access on equitable terms for small farmers and highly decentralised and participatory planning for infrastructure and services, where local priorities are defined by farmers themselves (Aliber & Hall, 2009).
Agriculture, Forestry and Fisheries IGDP: Current realities and challenges 47
Dramatic increases in public expenditure support to smallholder agriculture are highly unlikely, while further incremental increases to support the sector will make little difference. Much of the funds already available to support smallholder agriculture are not well spent, with a particular imbalance being evident between relatively large amounts of support to poor conceptualised land reform projects at the expense of black farmers within the ex-Bantustans. There is an urgent need to shift the emphasis of support from on-farm infrastructure and inputs, to community-level infrastructure, market development and institutional re-engineering (Aliber & Hall, 2009).
3.4.2 skills development
Internal (government and State-owned Entities) and external (industry) skills shortages remain an inhibiting factor in the Agriculture, Forestry and Fisheries Sector. Although skills development should ideally be included in terms of the Support Programmes, the negative impact the lack of skills has on the performance of the sector elevates its importance and it is therefore specifically mentioned as a challenge. The absence of the correct and required skills, compromises the productivity and effectiveness of government and industry.
3.4.3 research and development
The Agriculture, Forestry and Fisheries Sector faced a number of challenges in terms of R&D. R&D forms the basis for sustainable and equitable growth of the sector and enables the sector to respond proactively to changes in the environment in which it operates, to accelerate development of the sector and to address socio-economic issues in the sector. The current institutional arrangements do not maximise the benefits that should be flowing from R&D. Existing institutions have major capacity constraints and experience difficulties in attending and retaining scientists. R&D projects are not co ordinated and are not aligned to government and industry priorities. In the Forestry subsector R&D has been neglected and in Fisheries, research has focused on biological and natural resource management aspects. In all subsectors, inadequate funds have been allocated to R&D. In terms of the risks associated with climate change, R&D will be essential to ensure the sector response is appropriate and adequate to offset these risks.
3.4.4 knowledge and information management
Decision making should be based on correct, relevant and most recent information, both within government and in the sector. There are, however, areas where information is not readily available. This can be the result of information not being collected or information that has been collected not being analysed, documented and disseminated. Access to information also remains a challenge, especially for small-scale producers, which affects their productivity and competitive-ness. Inadequate information also has a negative impact in terms of government’s ability to plan support interventions, identify priority areas where interventions are required and therefore maximise the impact of these interventions. The lack of knowledge systems also limits the scope of options to be considered in terms of best practices, interventions and marketing.
3.4.5 Market access, information and regulation
The Agriculture, Forestry and Fisheries Sector experiences similar challenges in terms of improving market access, especially for the small-scale producers. Industry statistics and market information is not available and support to small-scale pro-ducers is also still inadequate. Concerns have been raised whether the same form of regulation is required to assist these producers.
3.4.6 integrated spatial planning
The lack of integrated spatial planning is hampering the growth of the Agriculture, Forestry and Fisheries Sector as well as the effectiveness and success of support programmes and other interventions made by government. The absence of integrated spatial information in terms of, among others, land use, existing infrastructure (markets, roads, electricity pro-vision) and available arable or suitable land limits planning and results in ineffective programme/project development.

48 Agriculture, Forestry and Fisheries IGDP: Current realities and challenges
3.4.7 institutional arrangements
Weak governance and governance structures resulted in poor/fragmented implementation of existing programmes. Non-alignment between the three spheres of government and between government and state-owned entities as well as non-alignment of programmes has had a negative impact on the sector. It resulted in poor implementation of programmes, because of the absence of integration, coordination and monitoring. Some of the factors that contribute to poor governance include capacity constraints, lack of accountability, lack of comprehensive, integrated planning and, in some instances, lack of enforcement. The importance of partnerships, clearly defined governance structures and coordination in terms of planning and implementation, supported by effective monitoring, cannot be stressed enough. Institutional arrangements relating to optimal delivery on social, economic and natural sciences are of particular importance, because good science requires an environment conducive to innovation.
3.4.8 disaster/risk management
Pests and diseases and natural disasters like fires, droughts and floods have a huge impact on the productivity and trade opportunities of the sector. A comprehensive risk-management strategy and implementation plan is required to ensure these risks are addressed in terms of all three subsectors and to enable government and industry to remain proactive. Sanitary and phytosanitary systems should be improved to enhance bio-security.
3.4.9 compliance and enforcement
The Agriculture, Forestry and Fisheries Sector is regulated by a number of pieces of legislation and although good pro-gress has been made in developing the administrative mechanisms (policies, business processes, licensing and permit systems, awareness material) to facilitate the implementation of the Acts; the monitoring of compliance and subsequent enforcement actions, where required, have not been achieved to the desired extent. This has mainly been the result of a dearth of officials dedicated to the functions of monitoring and enforcement and budget constraints. The building of institutional capacity for law compliance and enforcement is critical to achieve the objects of the legislature and is there-fore an area that will require intervention.

South Africa’s implementation of frameworks are guided and implemented through a sector-wide approach that involves all spheres of government, the private sector and civil society. Stakeholders are seen as strategic partners to support the implementation of key sector interventions. The government and the private sector are expected to play different but complementary roles to effect agriculture, forestry and fisheries’ contribution to economic growth.
4.1 vision For the sectorThe vision for South Africa’s Agriculture, Forestry and Fisheries Sector is to have “An equitable, productive, competitive, profitable and sustainable Agriculture, Forestry and Fisheries Sector growing to the benefit of all South Africans”.
This vision is supported by a mission that states that the vision will be achieved through developing and sustaining a sector that contributes to and embraces:
• economicgrowth(anddevelopment)
• jobcreation
• ruraldevelopment
• sustainableuseofnaturalresources
• maintenanceofbiodiversityandecosystems
• sustainablelivelihoods
• foodsecurity.
The vision and mission are further elaborated as follows:
• Thetotalareaofproductionforagricultureandforestryisincreasedandtheproductivityofexistingareasisincreasedin a manner that ensures equitable growth and competitiveness;
• TheuniquecharacteroftheSouthAfricanterrestrialandmarine“biomes”andtheintegrityofthebiologicaldiversityand its associated environment are retained;
• Agriculture,forestryandfisheriesindustries,foundedonexcellenceandinnovation,areexpandedtocontributetoeconomic and employment growth;
• The South African community has a sound understanding of the agriculture, forestry and fisheries policies andparticipates in decision-making processes;
• Thereisaccountabilitybygovernment,theprivatesectorandusers;
• Thesectorrespondstolocalandnationalinterests,includingtheneedsoffuturegenerations.
Through realisation of the above, the Agriculture, Forestry and Fisheries Sector will be able to make a meaningful contri-bution to achieve the following MTSF outcomes:
• Decentemploymentthroughinclusiveeconomicgrowth;
• Vibrant,equitable,sustainableruralcommunitiescontributingtowardsfoodsecurityforall;
• Protectionandenhancementofourenvironmentalassetsandnaturalresources.
4.2 PurPose oF the igdPThe primary purpose of the IGDP is to achieve the transformation and restructuring of the agriculture, forestry and fisheries sectors, which are currently dominated by a small number of large companies and to ensure that constraints experienced in the areas of input supply, production and marketing are addressed cost-effectively and in a timely manner. Transforma-tion and restructuring involves broad-based growth and the growth of the “missing middle” of successful small-scale
4Implementation of frameworks

50 Agriculture, Forestry and Fisheries IGDP: Implementation frameworks
commercial sectors, alongside continued resilience of the commercial sector and improvement in the contribution of the subsistence sector to the needs of the rural population.
The interventions listed below are geared towards providing an enabling environment that will facilitate growing the sector through equity interventions, increased profitability and competiveness, sustainable resource management and strengthened, well-coordinated governance systems. The involvement, commitment, cooperation and support of various government institutions, including national and provincial departments, state-owned entities and development agencies will be required to achieve the deliverables specified in the plan.
The sector (government, industry and civil society) will only be able to address the challenges and constraints discussed above if critical choices are made that will result in the prioritisation of specific interventions. It is clear that compromises and trade-offs will be required to ensure that issues relating to equity, growth and sustainability are addressed in the sector.
The policy decisions to be made in the growth and development plan will have certain future outcomes, both intended and unintended and it is proposed that these decisions should take into consideration the similarities and dissimilarities of the agriculture, forestry and fisheries sectors and the implications of certain decisions on these. The goals of the overall sector should therefore be clear in directing these policy decisions.
The plan for transforming and enhancing the agriculture, forestry and fisheries sectors are (a) to focus on equity (transfor-mation and equitable access to markets and support and equity in the value chain), (b) to focus on growth and competi-tiveness (through provision of support to large numbers of small producers to enable them to improve their productivity and incomes, while ensuring the commercial sector continues to grow) and (c) to focus on environmental sustainability to ensure that the natural resources the sector is dependent on are used sustainably and efficiently.
4.3 sector goAls, obJectives And interventionsIn order to address the key challenges identified, i.e. equity; growth and competitiveness; and environmental sustain-ability, the following sector goals (SGs) were developed:
• Sectorgoal1: Atransformedandequitablesector(SG1);
• Sectorgoal2: Equitablegrowthandcompetitiveness(SG2);
• Sectorgoal3: Improvedsustainablenaturalresourcemanagement(SG3);
• Sectorgoal4: Effectiveandefficientgovernancesystems(SG4).
tAble 11: Alignment of key sector challenges, sector goals and strategic outcomes
sector challenges sector goals strategic outcomes
Equity and transformation (SG1) A transformed and equitable sector Vibrant, equitable, sustainable rural communities contributing towards food security for all (7)
Growth and competitiveness (SG2) Increased production, competitiveness and profitability
Decent employment through inclusive economic growth (4)
Environmental/ecological sustainability (SG3) Improved sustainable natural resource management
Protect and enhance our environmental assets and natural resources (10)
Governance (SG4) Effective and efficient governance systems
An efficient, effective and development oriented public service and an empowered, fair and inclusive citizenship (12)
These sector goals were aligned to the Government Strategic Outcomes to ensure that the sector realises its potential to contribute towards growth and development, especially in rural areas as mandated by the government. To ensure that the commercial, smallholder and subsistence sectors all contribute to growth and development, specific interventions are required for each sector, which should include trade-offs where required. The sector goals, objectives and intentions are summarised in the objectives tree below and a more detailed implementation plan in the following tables.

Agriculture, Forestry and Fisheries IGDP: Implementation frameworks 51
Fig. 18: sector goals, objectives and interventions
Sector goals Objectives Interventions
Faster rate of establishment of SMMEs
Accelerated transforma-tion
Job creation
Food security
Increased productivity
Improved profitability and com - petitiveness
Improve natural resource manage ment for greater resillience, using ecosystem approach
Integrated climate change strategies and early warning systems for natural disasters
Social well-being Economic growth Sustainability
Equity and transformationEquitable growth and competitiveness
Sustainable use of natural resources
Support to new and existing producers
Access to markets
Access to resources
Develop food and production policy
Labour intensive enterprises across the value chain Research rehab
and restoration programmes
Incentives and schemes for reduced input costs
Innovation policy
Improve infrastructure, services and water supply
Improved regulatory framework for monitoring and enforcement
Develop alternative livelihoods
Decentralised pre and post- settlement support centres
Develop/refine and implement charters for 3 subsectors
Improved planning (spatial) M&E systems
Fast-track reform of land and resource rights Incentive
measures
Review market and trade-related strategies
National knowledge management systems
Market policy secure market access
Improved governance
Enhance governance systems Improve systems for minitoring and evaluationStrengthen institutional arrange- ments and regulatory framework
4.3.1 (A) equity and transformation
Problem statement
The challenge facing the sector in terms of equity, includes skewed or insufficient levels of transformation in terms of broad-based black economic empowerment; equity in terms of access to markets, gender, information and sufficient support provided at required scales and sufficient levels.
Purpose statement
To ensure community-orientated, broad-based black economic empowerment to increase the economic participation of previously disadvantaged communities in agriculture, forestry and fisheries in a way that transforms the industries and that brings socio-economic development.

52 Agriculture, Forestry and Fisheries IGDP: Implementation frameworks
tAble 12: equity and transformation – sector objectives, results and key role players
sector objective interventions/activities expected resultskey role players and partners
A1. Accelerate transformation for equitable growth of the sector in terms of six pillars of transformation* and develop a framework for the enforcement of all charters
A1.1 Fast-track Agribee charter to address transforma-tion constraints in primary production as well as the value chain; publish in terms of section 9 of the BBBEE Act, 2003; and implement the charter
AgriBEE Charter published in terms of section 9 of the BBBEE Act, 2003
DAFF, industry, dti
A1.2 Implement and enforce the Forestry sector charter, with specific focus on additional instruments specified in the charter
Forestry Charter implemented
A1.3 Develop and implement a Fisheries Charter in collaboration with the fisheries subsector
Fisheries Charter implemented
A1.4 Establishment of a single administration unit for the implementation, enforcement, monitoring and evaluation of all three charters (agriculture, forestry and fisheries)
Effective implementation of sector charters
A2. Job creation by establishing access to equitable and transparent markets
A2.1 Analyse existing markets and value chains and review existing policies and strategies and design/improve interventions to facilitate equitable access to markets (e.g. to secure domestic/local market access for smallholder farmers; improve terms on which markets are accessed and increasing participation in the value chain for smallholder producers)
Growth in sales by smallholder producers
DAFF, dti, EDD, DRDLR, DED, DoT, DPW, provincial departments of agriculture, develop- ment agencies, SoEs, industry
A2.2 Develop and implement commodity-specific market strategies that address specific requirements of small-scale producers, including regulatory provisions; incentive schemes and agreements with commercial/processing/manufacturing sector to purchase produce from smallholder producers
Participation on equitable terms in transformed value chains
DAFF, dti, DRDLR, EDD, DoT, DPW, provincial departments of agriculture, development agencies, SoEs,industry
A2.3 Agriculture, Forestry and Fisheries Infrastructure Development Plan in line with the National Infra - structure Plan, more specifically SIPs 11 interven-tions must include the following:
• Newinfrastructureinvestmentsinunderservicedformer homelands
• Freshproducemarketingdepots
• Animalproductionandprocessinginfrastructurein the former homelands
• Cropproductionandprocessinginfrastructureinthe former homelands
• Animalhealthinfrastructure(includingKrugerParkfencing)
• Forestryinfrastructure
• Fisheriesprojects
• Collegesofagriculture
• Revitalisationofirrigationschemes
• Revitalisationofexistingrailandroadinfrastructure
• Improvingaccesstoexistinginfrastructure
• Improvingtheuseandprovisionofagro-logistics
• Creatingaconduciveenvironmenttoefficientagro-logistics
2–5 projects per province, leading to improved market access in rural areas
* Equity ownership and employment equity; management; skills development; preferential procurement; enterprise development and socio-economic development

Agriculture, Forestry and Fisheries IGDP: Implementation frameworks 53
sector objective interventions/activities expected resultskey role players and partners
A3. Job creation by improving the viability of subsistence and small-scale production as a resource use option, keeping redistributed land in production
A3.1 Support the fast-tracking of land reform to achieve targets set by government (DRDLR) by conducting a land audit and develop a GIS system that includes the location of smallholder and subsistence producers
Improved planning, monitoring and evaluation of land reform programme
DAFF, DRDLR, provincial departments of agriculture, industry, development, SoEs, tertiary training institutions, SETAs, Department of Higher Education and Training. Land Bank, dti, agribusiness, IDC
A3.2 Commission an independent assessment of existing support programmes and successes/failures of completed land reform projects, including an inventory of supply-side constraints at provincial and local level
Improved sustainable production of land reform beneficiaries
A3.3 Develop a Finance Policy for small-scale and sub- sistence producers in agriculture, forestry and fisheries
Greater access to cheaper loans
A3.4 Design and implement an integrated and holistic development support programme to address key needs of subsistence and small-scale producers, including decentralised integrated one-stop-shop support services** (inputs, finance, extension shaped by rural spatial dynamics and underpinned by development finance and the capacity to deliver support services in a timely and efficient manner
Sustainable producers, increased production, access to inputs and tech nology, improved access to support services
** This will include, but is not limited to: Spatial plans reflecting the optimal location of decentralised support services and common infra structure required by smallholder producers; a GIS system that includes the location of smallholder and subsistence producers; inventory of supply side constraints at provincial and local level; provincial and local government budgets relating to support services aligned in terms of availability and expenditure needs; skills development and skills transfer programme for extension service providers and producers; mentorship programmes that include the private sector (commercial producers to mentor smallholder producers); system to improve access to technology and high-quality inputs, planting and stocking materials and access to planning and management tools.
tAble 12: equity and transformation – sector objectives, results and key role players (cont.)
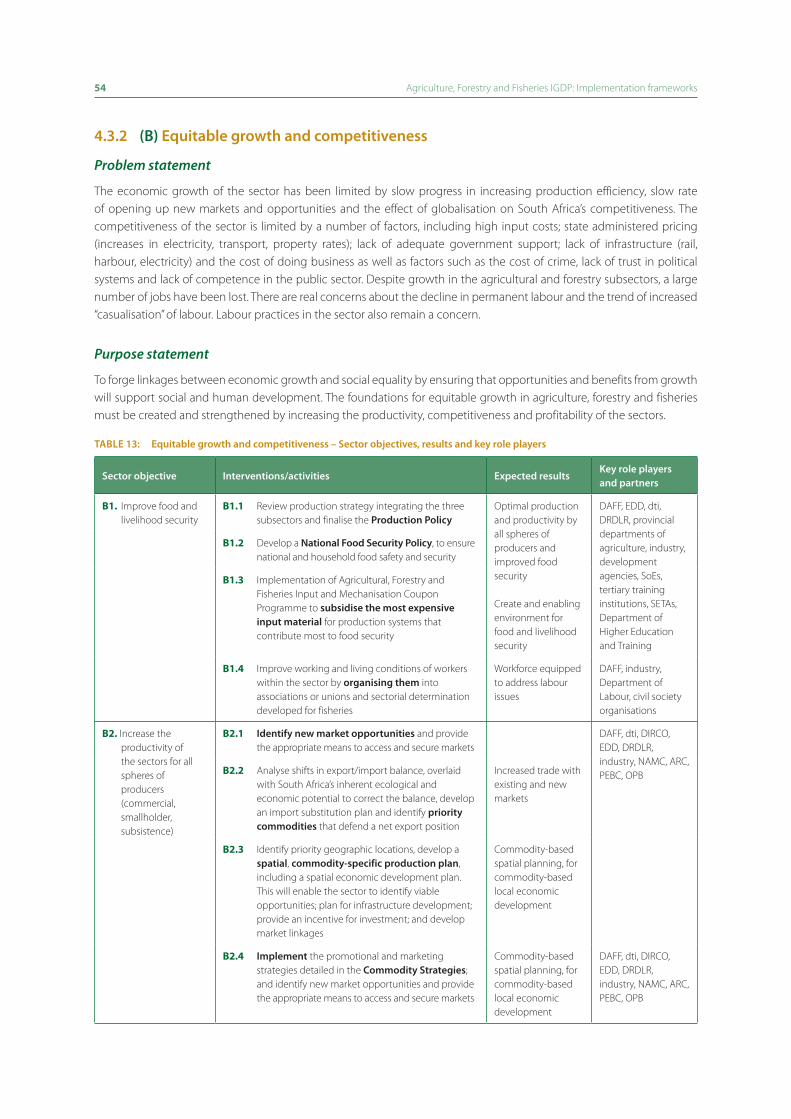
54 Agriculture, Forestry and Fisheries IGDP: Implementation frameworks
4.3.2 (b) equitable growth and competitiveness
Problem statement
The economic growth of the sector has been limited by slow progress in increasing production efficiency, slow rate of opening up new markets and opportunities and the effect of globalisation on South Africa’s competitiveness. The competitiveness of the sector is limited by a number of factors, including high input costs; state administered pricing (increases in electricity, transport, property rates); lack of adequate government support; lack of infrastructure (rail, harbour, electricity) and the cost of doing business as well as factors such as the cost of crime, lack of trust in political systems and lack of competence in the public sector. Despite growth in the agricultural and forestry subsectors, a large number of jobs have been lost. There are real concerns about the decline in permanent labour and the trend of increased “casualisation” of labour. Labour practices in the sector also remain a concern.
Purpose statement
To forge linkages between economic growth and social equality by ensuring that opportunities and benefits from growth will support social and human development. The foundations for equitable growth in agriculture, forestry and fisheries must be created and strengthened by increasing the productivity, competitiveness and profitability of the sectors.
tAble 13: equitable growth and competitiveness – sector objectives, results and key role players
sector objective interventions/activities expected resultskey role players and partners
B1. Improve food and livelihood security
B1.1 Review production strategy integrating the three subsectors and finalise the Production Policy
Optimal production and productivity by all spheres of producers and improved food security
Create and enabling environment for food and livelihood security
DAFF, EDD, dti, DRDLR, provincial departments of agriculture, industry, development agencies, SoEs, tertiary training institutions, SETAs, Department of Higher Education and Training
B1.2 Develop a national Food security Policy, to ensure national and household food safety and security
B1.3 Implementation of Agricultural, Forestry and Fisheries Input and Mechanisation Coupon Programme to subsidise the most expensive input material for production systems that contribute most to food security
B1.4 Improve working and living conditions of workers within the sector by organising them into associations or unions and sectorial determination developed for fisheries
Workforce equipped to address labour issues
DAFF, industry, Department of Labour, civil society organisations
B2. Increase the productivity of the sectors for all spheres of producers (commercial, smallholder, subsistence)
B2.1 identify new market opportunities and provide the appropriate means to access and secure markets
DAFF, dti, DIRCO, EDD, DRDLR, industry, NAMC, ARC, PEBC, OPBB2.2 Analyse shifts in export/import balance, overlaid
with South Africa’s inherent ecological and economic potential to correct the balance, develop an import substitution plan and identify priority commodities that defend a net export position
Increased trade with existing and new markets
B2.3 Identify priority geographic locations, develop a spatial, commodity-specific production plan, including a spatial economic development plan. This will enable the sector to identify viable opportunities; plan for infrastructure development; provide an incentive for investment; and develop market linkages
Commodity-based spatial planning, for commodity-based local economic development
B2.4 implement the promotional and marketing strategies detailed in the commodity strategies; and identify new market opportunities and provide the appropriate means to access and secure markets
Commodity-based spatial planning, for commodity-based local economic development
DAFF, dti, DIRCO, EDD, DRDLR, industry, NAMC, ARC, PEBC, OPB
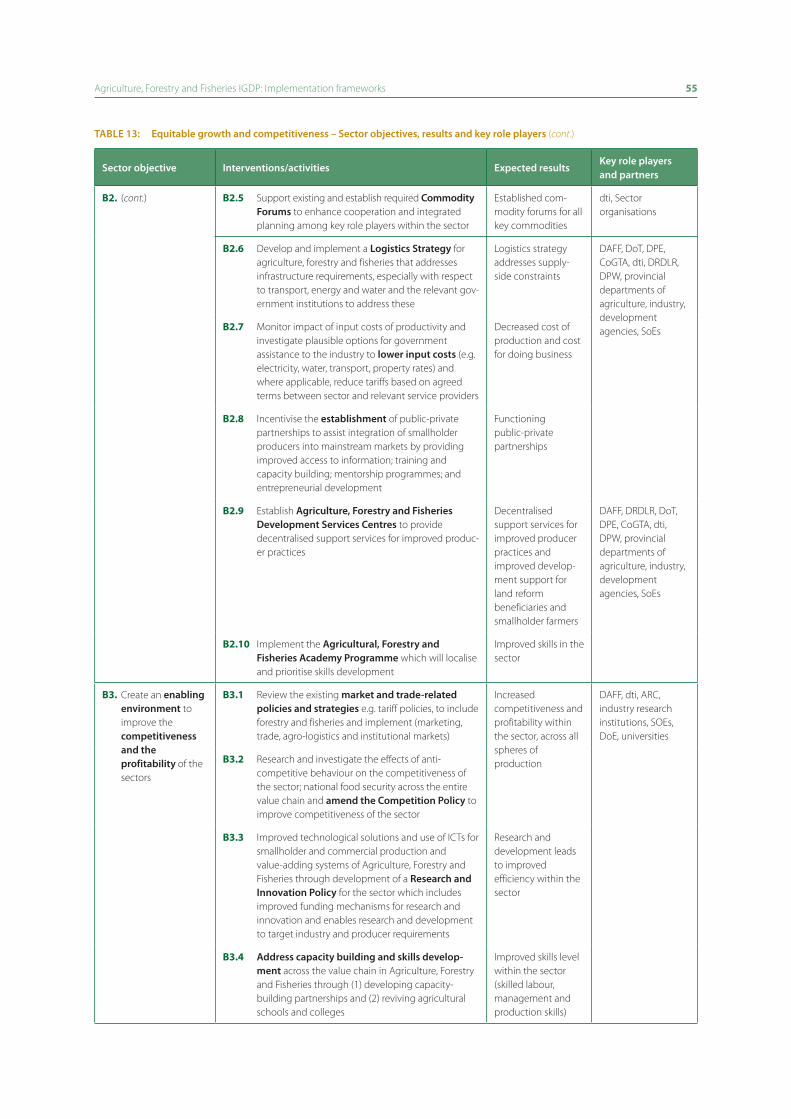
Agriculture, Forestry and Fisheries IGDP: Implementation frameworks 55
sector objective interventions/activities expected resultskey role players and partners
B2. (cont.) B2.5 Support existing and establish required commodity Forums to enhance cooperation and integrated planning among key role players within the sector
Established com - modity forums for all key commodities
dti, Sector organisations
B2.6 Develop and implement a logistics strategy for agriculture, forestry and fisheries that addresses infrastructure requirements, especially with respect to transport, energy and water and the relevant gov-ernment institutions to address these
Logistics strategy addresses supply-side constraints
DAFF, DoT, DPE, CoGTA, dti, DRDLR, DPW, provincial departments of agriculture, industry, development agencies, SoEsB2.7 Monitor impact of input costs of productivity and
investigate plausible options for government assistance to the industry to lower input costs (e.g. electricity, water, transport, property rates) and where applicable, reduce tariffs based on agreed terms between sector and relevant service providers
Decreased cost of production and cost for doing business
B2.8 Incentivise the establishment of public-private partnerships to assist integration of smallholder producers into mainstream markets by providing improved access to information; training and capacity building; mentorship programmes; and entrepreneurial development
Functioning public-private partnerships
B2.9 Establish Agriculture, Forestry and Fisheries development services centres to provide decentralised support services for improved produc-er practices
Decentralised support services for improved producer practices and improved develop- ment support for land reform beneficiaries and smallholder farmers
DAFF, DRDLR, DoT, DPE, CoGTA, dti, DPW, provincial departments of agriculture, industry, development agencies, SoEs
B2.10 Implement the Agricultural, Forestry and Fisheries Academy Programme which will localise and prioritise skills development
Improved skills in the sector
B3. Create an enabling environment to improve the competitiveness and the profitability of the sectors
B3.1 Review the existing market and trade-related policies and strategies e.g. tariff policies, to include forestry and fisheries and implement (marketing, trade, agro-logistics and institutional markets)
Increased competitiveness and profitability within the sector, across all spheres of production
DAFF, dti, ARC, industry research institutions, SOEs, DoE, universities
B3.2 Research and investigate the effects of anti- competitive behaviour on the competitiveness of the sector; national food security across the entire value chain and amend the competition Policy to improve competitiveness of the sector
B3.3 Improved technological solutions and use of ICTs for smallholder and commercial production and value-adding systems of Agriculture, Forestry and Fisheries through development of a research and innovation Policy for the sector which includes improved funding mechanisms for research and innovation and enables research and development to target industry and producer requirements
Research and development leads to improved efficiency within the sector
B3.4 Address capacity building and skills develop-ment across the value chain in Agriculture, Forestry and Fisheries through (1) developing capacity-building partnerships and (2) reviving agricultural schools and colleges
Improved skills level within the sector (skilled labour, management and production skills)
tAble 13: equitable growth and competitiveness – sector objectives, results and key role players (cont.)
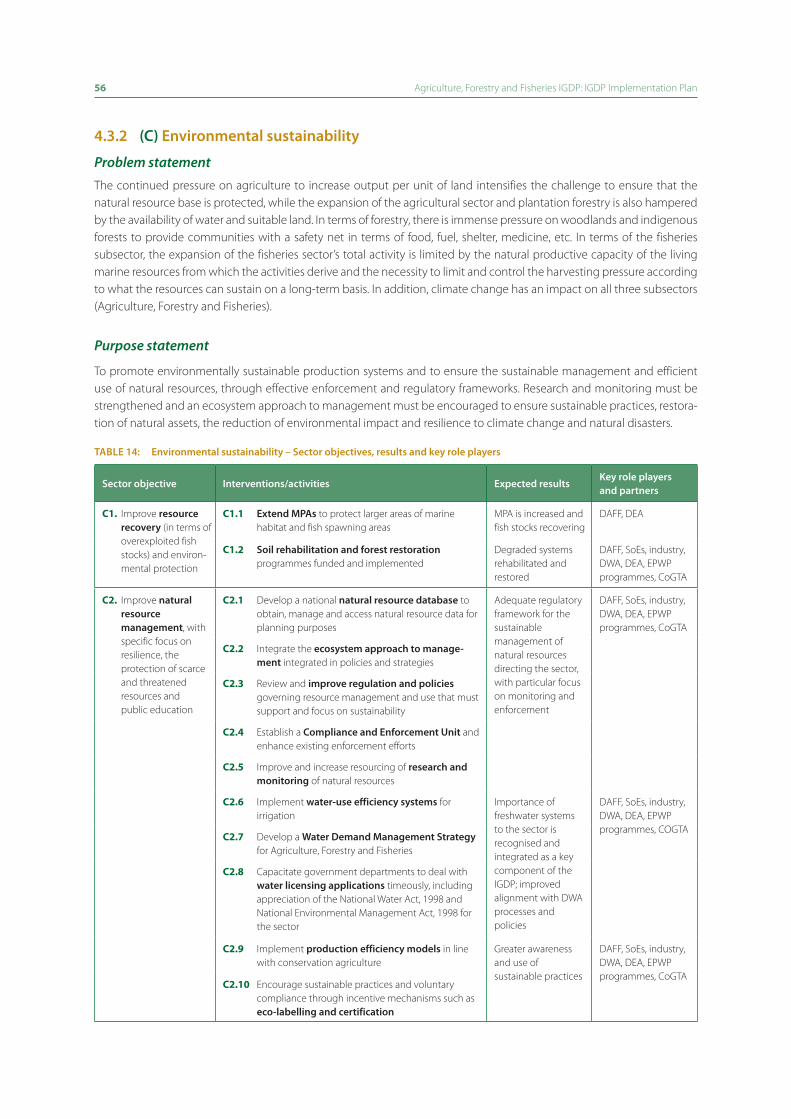
56 Agriculture, Forestry and Fisheries IGDP: IGDP Implementation Plan
4.3.2 (c) environmental sustainability
Problem statementThe continued pressure on agriculture to increase output per unit of land intensifies the challenge to ensure that the natural resource base is protected, while the expansion of the agricultural sector and plantation forestry is also hampered by the availability of water and suitable land. In terms of forestry, there is immense pressure on woodlands and indigenous forests to provide communities with a safety net in terms of food, fuel, shelter, medicine, etc. In terms of the fisheries subsector, the expansion of the fisheries sector’s total activity is limited by the natural productive capacity of the living marine resources from which the activities derive and the necessity to limit and control the harvesting pressure according to what the resources can sustain on a long-term basis. In addition, climate change has an impact on all three subsectors (Agriculture, Forestry and Fisheries).
Purpose statement
To promote environmentally sustainable production systems and to ensure the sustainable management and efficient use of natural resources, through effective enforcement and regulatory frameworks. Research and monitoring must be strengthened and an ecosystem approach to management must be encouraged to ensure sustainable practices, restora-tion of natural assets, the reduction of environmental impact and resilience to climate change and natural disasters.
tAble 14: environmental sustainability – sector objectives, results and key role players
sector objective interventions/activities expected resultskey role players and partners
C1. Improve resource recovery (in terms of overexploited fish stocks) and environ- mental protection
C1.1 extend MPAs to protect larger areas of marine habitat and fish spawning areas
MPA is increased and fish stocks recovering
DAFF, DEA
C1.2 soil rehabilitation and forest restoration programmes funded and implemented
Degraded systems rehabilitated and restored
DAFF, SoEs, industry, DWA, DEA, EPWP programmes, CoGTA
C2. Improve natural resource management, with specific focus on resilience, the protection of scarce and threatened resources and public education
C2.1 Develop a national natural resource database to obtain, manage and access natural resource data for planning purposes
Adequate regulatory framework for the sustainable management of natural resources directing the sector, with particular focus on monitoring and enforcement
DAFF, SoEs, industry, DWA, DEA, EPWP programmes, CoGTA
C2.2 Integrate the ecosystem approach to manage-ment integrated in policies and strategies
C2.3 Review and improve regulation and policies governing resource management and use that must support and focus on sustainability
C2.4 Establish a compliance and enforcement unit and enhance existing enforcement efforts
C2.5 Improve and increase resourcing of research and monitoring of natural resources
C2.6 Implement water-use efficiency systems for irrigation
Importance of freshwater systems to the sector is recognised and integrated as a key component of the IGDP; improved alignment with DWA processes and policies
DAFF, SoEs, industry, DWA, DEA, EPWP programmes, COGTA
C2.7 Develop a Water demand Management strategy for Agriculture, Forestry and Fisheries
C2.8 Capacitate government departments to deal with water licensing applications timeously, including appreciation of the National Water Act, 1998 and National Environmental Management Act, 1998 for the sector
C2.9 Implement production efficiency models in line with conservation agriculture
Greater awareness and use of sustainable practices
DAFF, SoEs, industry, DWA, DEA, EPWP programmes, CoGTA
C2.10 Encourage sustainable practices and voluntary compliance through incentive mechanisms such as eco-labelling and certification
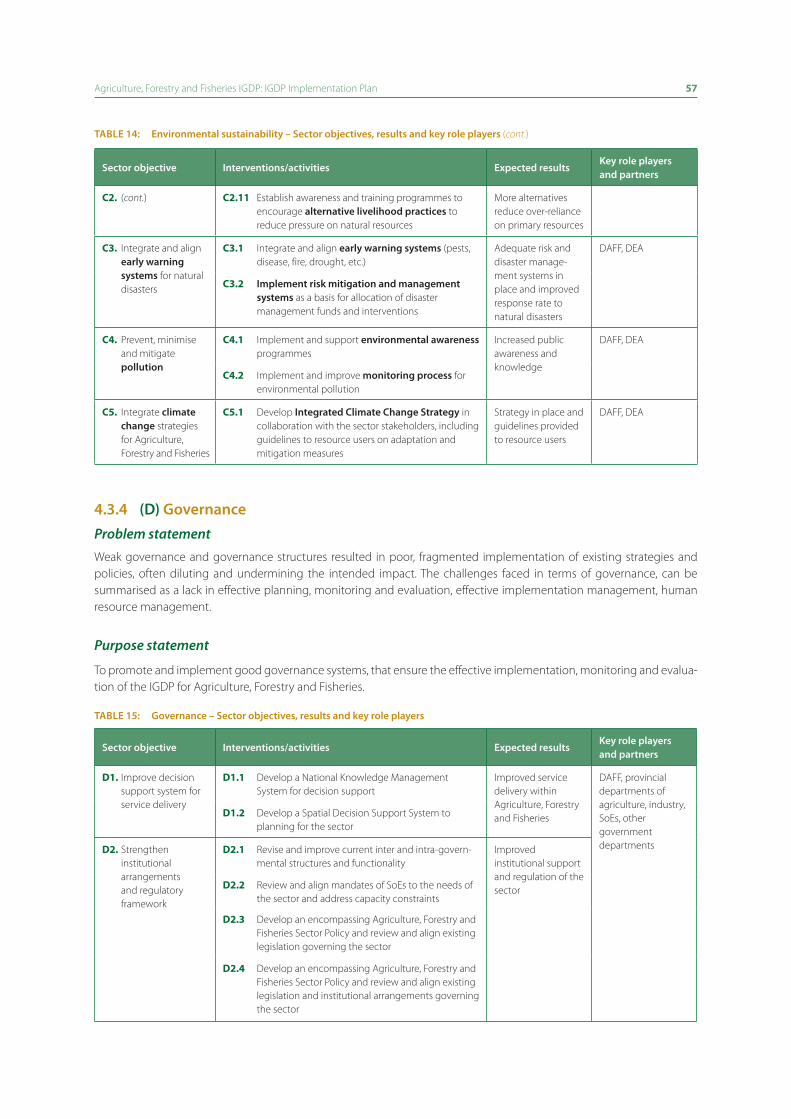
Agriculture, Forestry and Fisheries IGDP: IGDP Implementation Plan 57
tAble 14: environmental sustainability – sector objectives, results and key role players (cont.)
sector objective interventions/activities expected resultskey role players and partners
C2. (cont.) C2.11 Establish awareness and training programmes to encourage alternative livelihood practices to reduce pressure on natural resources
More alternatives reduce over-reliance on primary resources
C3. Integrate and align early warning systems for natural disasters
C3.1 Integrate and align early warning systems (pests, disease, fire, drought, etc.)
Adequate risk and disaster manage-ment systems in place and improved response rate to natural disasters
DAFF, DEA
C3.2 implement risk mitigation and management systems as a basis for allocation of disaster management funds and interventions
C4. Prevent, minimise and mitigate pollution
C4.1 Implement and support environmental awareness programmes
Increased public awareness and knowledge
DAFF, DEA
C4.2 Implement and improve monitoring process for environmental pollution
C5. Integrate climate change strategies for Agriculture, Forestry and Fisheries
C5.1 Develop integrated climate change strategy in collaboration with the sector stakeholders, including guidelines to resource users on adaptation and mitigation measures
Strategy in place and guidelines provided to resource users
DAFF, DEA
4.3.4 (d) governanceProblem statementWeak governance and governance structures resulted in poor, fragmented implementation of existing strategies and policies, often diluting and undermining the intended impact. The challenges faced in terms of governance, can be summarised as a lack in effective planning, monitoring and evaluation, effective implementation management, human resource management.
Purpose statement
To promote and implement good governance systems, that ensure the effective implementation, monitoring and evalua-tion of the IGDP for Agriculture, Forestry and Fisheries.
tAble 15: governance – sector objectives, results and key role players
sector objective interventions/activities expected resultskey role players and partners
D1. Improve decision support system for service delivery
D1.1 Develop a National Knowledge Management System for decision support
Improved service delivery within Agriculture, Forestry and Fisheries
DAFF, provincial departments of agriculture, industry, SoEs, other government departments
D1.2 Develop a Spatial Decision Support System to planning for the sector
D2. Strengthen institutional arrangements and regulatory framework
D2.1 Revise and improve current inter and intra-govern-mental structures and functionality
Improved institutional support and regulation of the sector D2.2 Review and align mandates of SoEs to the needs of
the sector and address capacity constraints
D2.3 Develop an encompassing Agriculture, Forestry and Fisheries Sector Policy and review and align existing legislation governing the sector
D2.4 Develop an encompassing Agriculture, Forestry and Fisheries Sector Policy and review and align existing legislation and institutional arrangements governing the sector

58 Agriculture, Forestry and Fisheries IGDP: IGDP Implementation Plan
sector objective interventions/activities expected resultskey role players and partners
D3. Improve governance through monitoring and evaluation
D3.1 Establish intergovernmental structure that provides for integrated planning, budgeting and monitoring and reporting
Improved knowl-edge and informa-tion management, growth and develop-ment framework of the sector underpinned by enabling legisla- tion and effective governance systems
D3.2 Develop and implement a comprehensive, integrated monitoring and evaluation system that is outcomes- based and aligned with the President’s M&E system and focusing on impact of policies
D3.3 Encourage private sector compliance
tAble 15: governance – sector objectives, results and key role players (cont.)

5.1 sPAtiAl PlAnning For the iMPleMentAtion PlAnAn IGDP Spatial Implementation Plan will be developed in conjunction with the above implementation framework. Spatial planning allows for an integrated approach to planning across sectors, different spheres of government, avoiding overlap, double dipping and duplication. It also allows for a coherent approach to national priorities like job creation and food security and provides for a practical application of interventions identified in the IGDP. More importantly, it allows for the translation of strategy and policy into a spatial analysis of required interventions, identifying what must be done and where.
The spatial framework of the IGDP therefore serves as an analytical and technical platform for further analysis of the status quo and a detailed account of what the sector intends to do for the next 20 years, where and by whom. The Spatial Implementation Plan therefore intends to guide all stakeholders and role players involved, by highlighting roles and responsibilities, deliverables and a time frame for delivery. The Spatial Implementation Plan therefore aims to improve the implementation, monitoring and evaluation readiness of the IGDP.
5.2 PoliticAl leAdershiPThere is a need to guard against parallel Agriculture, Forestry and Fisheries policies, planning and implementation processes. South Africa has a National Planning Commission that should provide strategic macro-planning for the country. Related Ministries such as Trade and Industry, Economic Development, Rural Development and Land Reform will through the co ordination of the Presidency cooperate and collaborate in this regard. Key political leadership is provided by the following structures in the AFF Sector:
(a) Cabinet chaired by the President of the country is the key coordinating, decision making and monitoring committee on the implementation of government’s plan of action. Cabinet has an approved Cluster System that coordinates the Outcomes Based Approach and has identified key ministries to lead the Delivery Forums.
(b) Parliament’s Portfolio Committee on Agriculture, Forestry and Fisheries as well the National Council of Provinces’ Select Committee on Land and the Environment provides functional and strategic oversight to the Ministry of Agriculture, Forestry and Fisheries. They furthermore consider and approve annual plans and reports of the MAFF.
5IGDP Implementation Plan

60 Agriculture, Forestry and Fisheries IGDP: IGDP Implementation Plan
(c) Committees of MinMec (Minister/s and the responsible Members of the Provincial Executive Councils) and MINTECH (Director-General/s and the responsible Provincial Heads of Departments, State-owned Entities and Public Enterprises) meet at most quarterly to consider the implementation of AFF Programmes. MinMec provides the political leadership, including articulation of Parliament and Cabinet priorities.
(d) Each of the nine provinces has a Provincial Executive Council; the council led by the Provincial Premier implements AFF programmes at regional/provincial and local government level.
5.3 AdMinistrAtionThe Constitution of the Republic of South Africa, Schedule 4 and 5 (as adopted on 8 May 1996 and amended on 11 October 1996 by the Constitutional Assembly) specifies functional areas of concurrent national and provincial legisla-tive competence as well as functional areas of exclusive provincial legislative competence.
Schedule 4, Part A states that national and provinces are jointly responsible for the following functional areas that are within the legal mandate of the Ministry of Agriculture, Forestry and Fisheries:
• Administrationofindigenousforests;
• Agriculture;
• Airportsotherthaninternationalandnationalairports;
• Animalcontrolanddiseases;
• Disastermanagement;
• Natureconservation,excludingnationalparks,nationalbotanicalgardensandmarineresources;
• Regionalplanninganddevelopment;
• Soilconservation;
• Trade;
• Urbanandruraldevelopment.
Schedule 4, Part B states areas of concurrent competency applicable to local government; the areas relevant to the (MAFF) are fire-fighting services, trade regulations and pontoons, ferries, piers and harbours, excluding the regulation of international and national shipping and matters related thereto.
Schedule 5, Part A states that provinces are exclusively responsible for the following functional areas relevant to MAFF:
• Abattoirs;
• Veterinaryservices,excludingregulationoftheprofession.
Schedule 5, Part B, states areas of exclusive provincial competence applicable to local government and relevant to MAFF:
• Facilitiesfortheaccommodation,careandburialofanimals;
• Fencingandfences;
• Licensingofdogs;
• Municipalabattoirs;
• Municipalparksandrecreation;
• Pounds.
5.4 MinisteriAl service delivery ForuMOnce the IGDP has been finalised and approved by Cabinet, its official adoption, implementation planning, monitoring and evaluation requires the management by a representative group of key stakeholders and role players of industry, civil society and labour within Agriculture, Forestry and Fisheries. This group must allow for the constructive interaction between all stakeholders and role players within the sector and present the Minister of Agriculture, Forestry and Fisheries with a sound reflection of the status quo within the sector and report on progress made on the IGDP and in this way plan for meeting government’s key priorities.

Agriculture, Forestry and Fisheries IGDP: IGDP Implementation Plan 61
Following the adoption of the IGDP, a Ministerial Delivery Forum will be appointed by the Minister to serve as the platform for the constructive interaction between stakeholders and role players of the industry and government on key issues of political and socio-economic importance, such as food security and job creation. The Ministerial Advisory Committee will be responsible for mitigation against increasing unemployment, food insecurity, unsustainable environmental manage-ment and other issues identified as priorities.
Fig. 19 indicates the draft organisational arrangements. Supporting the Ministerial Delivery Forum will be the IGDP work-ing group, which provides management, administration and research support to the Ministerial Advisory Committee. The IGDP working group (IGDP-WG) is in turn supported by ITCAFF, the intergovernmental technical committee and an M&E coordinating unit. Feeding into and out of the reporting lines of the Ministerial Advisory Committee, are the service delivery clusters to which DAFF reports to on delivery of the government’s Key Outcomes and Outputs. The IGDP Working Committee will be responsible for:
• ReportingtotheMinisterandMinMeconprogressmadeontheformulationoftheIGDPSpatialImplementationPlan;
• Providingannualsectorreportspersubsectorandperprioritycommodity;
• ProvidingannualIGDPprogressreports;
• Basedonannualreportsandcommoditystatusreports,raisingcriticalissuestobeaddressedbytheMinisterialAdvisory Committee.
Fig. 19: Ministerial delivery Forum
MinMEC
Fisheries Steering Committee later Fisheries Charter Council
AgriBee Charter CouncilForestry Charter Council and Forestry Advisory Committee
Ministerial Delivery Forum
IGDP working group
IGDP – M&E unit ITCAFF
Service delivery clusters
5.5 Priority settingThe IGDP in itself does not include all that needs to be done within the sector, but represents a plan to stimulate and opti-mise growth to the benefit of all South Africans. The IGDP Spatial Implementation Plan will contribute to priority setting and key interventions, including defining the required resources, cooperation and strategic partnerships. It is critical that the IGDP Spatial Implementation Plan focuses on key priorities for agriculture, forestry and fisheries.
In setting the priorities the sector will:
• Acknowledgethattheannualallocationsbythestatemaynotfullyaddresskeyinterventionsrequiredforthegrowthof the sector;
• Considertheneedfortheprivatesectorandotherdevelopmentfundingagenciestocontribute;

62 Agriculture, Forestry and Fisheries IGDP: IGDP Implementation Plan
• Notethepossibilityofmisallocationofresourcesbythestate;andtheneedtomatchallocationstokeypriorities;
• Considerpossibleunderspendingbythestateanditsagencies.
Noting the commitment from the stakeholders to collaborate and partner the state in the implementation of the IGDP; it is important for the key partners to plan jointly and agree on the priorities. The key interventions should be precisely defined with clear targets set and will be spelt out within the Spatial Implementation Plan of the IGDP.

6.1 introductionThe government-wide Monitoring and Evaluation System (2007) lists the following principles to which a good Moni-toring and Evaluation (M&E) system should adhere to: it should contribute to improved governance; should be rights based; should be development-orientated—nationally, institutionally and locally; should be undertaken ethically and with integrity; should be utilisation oriented; should be methodologically sound; and should be operationally effective.
M&E are two complementary, but separate functions, which often serve distinct purposes. Monitoring is a continuing function that uses systematic collection of data on specified indicators to provide management and the main stakehold-ers of an ongoing development intervention with indicators of the extent of progress and achievement of objectives and progress in the use of allocated funds. Evaluation is the systematic and objective assessment of an ongoing or completed project, programme or policy, its design, implementation and results, with the aim to determine the relevance and fulfil-ment of objectives, development efficiency, effectiveness, impact and sustainability.
A functional, integrated M&E system is important for the sector, not only for the purpose of providing a framework for monitoring, planning, budgeting and evaluation activities, but also for the possibility of establishing a joint M&E commit-tee, which allows for the participation of other key sectors and stakeholders.
Establishing an effective performance management system requires developing an understanding and agreement among all stakeholders within the sector as to what needs to be achieved and how important performance manage-ment decisions will be made. Therefore, where appropriate, all stakeholders within the sector will have to be included in the design and implementation of the integrated M&E system and subsequent performance reviews.
6.2 Monitoring And evAluAtion systeM Monitoring and evaluation is an absolutely critical component of the Agriculture, Forestry and Fisheries IGDP. A good, integrated M&E system within the sector must be able to generate timely reports on progress made towards achieving the government’s outcomes, provide an alarm where progress is stagnating and to provide management within the sector with adequate information to help keep the interventions identified running as smoothly as possible. During the monitoring process, sufficient evidence should be accumulated for evaluation studies to be conducted to inform all stakeholders within the sector and the general public at large, as to whether activities identified have achieved the objec-tives of the IGDP and to highlight any unexpected outcomes.
6Monitoring and evaluation framework
64 Agriculture, Forestry and Fisheries IGDP: IGDP Implementation Plan
Therefore, the objectives of the M&E system are to collect and provide information that will be used to:• Trackprogressonimplementationofallinterventions/activitieswithinthesectorintegratedgrowthanddevelopment
plan;• Identifygapsandweaknessesinthedeliveryofservices;• Plan,prioritise,allocateandmanageresources;• Monitortheimpactofinterventions/activitiesontheintendedbeneficiaries/communitieswithinthesector.
The measures and or indicators used for monitoring and evaluation will depend on the programmatic issue as well as the level of planning. Furthermore it will be critical to conduct financial and performance monitoring to determine sector efficiencies, the use of resources for intended purposes and the achievements of the outcomes or national goals.
6.3 Monitoring ProcessesThis section sets out the key elements of the monitoring framework.
6.3.1 development and definition of indicators
Indicators need to be defined to measure the progress made towards meeting relevant objectives (aligned to the gov-ernment outcomes). This process was preceded by the development of the 12 national government outcomes, which are premised on the ANC election manifesto of 2009 and the government’s adoption of its MTSF for the mandate period of 2009 to 2014. The development and defining of indicators will be based on outcomes to which the sector’s outputs and key activities contribute directly. The development and defining of the performance indicators will be based on the interventions identified that contribute to the achievement of the sector goals.
6.3.2 data collection mechanisms
The proposed integrated M&E system will have to target data collection on interventions/activities directly implemented by DAFF and its partners/stakeholders, looking at the direct impact of those activities. This ensures that the results are within the DAFF Ministry’s ability to influence. The sector will also have to design and implement specific M&E surveys and studies to investigate the secondary impact on agriculture, forestry and fisheries where appropriate.
The tools that will be used in collecting data and the frequency of data collection will vary/depend on the type of perfor-mance indicators identified. Monitoring from a financial management perspective, for example, may include monitoring of expenditure against budget or adherence to financial prescripts and controls. Monitoring from the perspective of pro-gramme or service delivery performance involves the monitoring of performance against pre-set objectives, indicators and targets. In practical terms, the monitoring involves the routine collection of data on all the indicators in strategic and performance plans and preparation of reports to managers at different levels on the values of the indicators compared to a baseline or target.
Each lead institution/agency responsible for a particular performance indicator will have to develop a monitoring sched-ule that ensures that mutual definitions and standards are developed and that the necessary capacity is available for the integrated sector M&E system. It will be necessary to assess the state of readiness of various existing M&E mechanisms within the sector and, where possible, to collect the baseline data for all performance indicators.
6.3.3 reporting on the progress made on implementation
In defining/developing performance indicators for the sector prescribed reporting templates, data collection mecha-nisms and schedules will have to be developed to ensure that the institutions/participants within the sector have a systematic mechanism for monitoring institution/participant specific performance indicators. This will ensure that lead agencies/institutions responsible for a performance indicator, will develop specific reports at specified intervals to assist in the tracking of progress of activities towards delivery. The frequency of reports will depend on the internal reporting processes of the individual institutions/agencies within the sector. A timeline will, however, have to be agreed upon by the sector; on how many times a report on specific indicators will be sent by the individual institutions/agencies to the central coordinating sector M&E committee. This could either be quarterly, half yearly or annually.

Agriculture, Forestry and Fisheries IGDP: IGDP Implementation Plan 65
6.3.4 data verification and validation
Performance information auditing shares a focus on performance with value-for-money audits, which assist departments, public entities (SOEs), municipalities and communities, to focus their attention on areas where performance and account-ability can be improved. A methodology will have to be developed to verify data and reports received from individual institutions/agencies within the sector with regard to their specific performance indicators. A report approval process also has to be agreed upon by the various institutions/agencies within the sector.
6.3.5 Programme/sector evaluation
The purpose of performing evaluation processes is to:• Measureoutcomesandtheimpactofanactivityanddistinguishthesefromtheinfluenceofotherfactors;• Helptoclarifywhethercostsforanactivityarejustified;• Makerecommendationsforfutureobjectives;• Identifyefficiencymeasures;• Informdecisionsonwhethertoexpand,modifyoreliminateprojects,programmes,interventionsorpolicies;• Drawlessonsforimprovingthedesignandmanagementoffutureactivities;• Comparetheeffectivenessofalternativeinterventions;• Strengthenaccountabilityofresults.
A decision will have to be taken on the process of performing evaluation studies, in terms of who will be responsible, i.e. will it be individual institutions/agencies within the sector, an outside independent third party or will it be the central coordinating M&E committee together with the frequency or scheduling of these evaluation studies and the types of evaluations studies that have to be conducted?
Annual programme reviews will have to focus on how the available inputs have been used and what outputs and short-term outcomes have been produced. These reviews should also focus on the challenges, role players and interactions between various role players and lead institutions/agencies.
6.3.6 distribution and feedback mechanisms
Feedback mechanisms for the dissemination of performance indicator data will have to be strengthened and integrated though normal government systems and structures. Lead institutions/agencies will also have to report back to their con-stituencies using their own communication channels.
6.4 Monitoring And evAluAtion resPonsibilitiesThe effective management of performance information requires a clear understanding of the different responsibilities involved in managing performance. A number of stakeholders within the sector will have to play a key role in ensuring that the monitoring, reporting and programme evaluation are competently undertaken within the sector. Roles and responsibilities of the key stakeholders within the sector will have to be identified.
6.5 ProPosed M&e FrAMeWork envisAged For the sectorThe depicted framework is an adaptation of the framework envisaged within the HIV and AIDS and STI National Strategic Plan for South Africa 2007–2011.
As discussed in Chapter 6 above a Monitoring and Evaluation Coordinating Unit, under the management of the IGDP WG, will be responsible for:• ThedevelopmentofanIGDPM&Estrategy,detailingreportingmechanisms,evaluationguidelinesandsystemsfor
corrective measures to be taken. • Theunitwillalsoberesponsibletoestablishamechanismfordatacollectionandforcoordinatingreportingfromthe
various stakeholders within the sector.• ThisM&EUnitmayhavetoworkinclosecollaborationwiththegovernment-wideMonitoringandEvaluationSystem
of the Presidency.

66 Agriculture, Forestry and Fisheries IGDP: IGDP Implementation Plan
Terms of Reference for the establishment of a coordinating M&E unit for the sector will have to be developed. These terms of reference will include among other things, the size of the M&E unit, who will be part of the coordinating M&E unit, frequencies of meetings of the M&E unit, selection of a chairperson if necessary, etc.
Fig. 20: M&e framework
Presidency government-wide M&E system
Institutional-specific M&E units
Performance indicators
Business and private sector
Feedback
Departmental-specific M&E units
Central Sector M&E Coordinating Unit
Government departments
SOE-specific M&E units
State-owned Enterprises
• M&E guidelines development• Reporting guidelines (format, frequency, etc.)• Collection of baseline and setting up M&E
database• Terms of reference for M&E coordinating unit• Evaluation strategies• Mid-year and annual progress reports

7Bibliography
ABC. 2009. Measuring the competitiveness of and confidence in the agribusiness sector of South Africa. Report by the Agribusiness Chamber, Pretoria.
Aliber, M. & HAll, R. 2010. Development of evidencebased policy around smallscale farming. Programme to Support Pro-Poor Policy Develop ment (PSPPD). The Presidency, Republic of South Africa and European Union.
AltmAn, M., HArt, T. & JAcobs, P. 2009. Household food security status in South Africa. Agrekon, 48(4): 345–361.
bezemer, D. & HeAdey, D. 2008. Agriculture, development and urban bias. World Development, 36(8): 1342–1364.
brAncH, G.M. & clArk, B. M. 2006. Fish stocks and their management: the changing face of fisheries in South Africa. Marine Policy, 30: 3–17.
burger, P., cloete, J., geldenHuys, J., mArAis, L. & tHornton, A., 2009. Assessing the role of UA in addressing poverty in South Africa. Un published report prepared for the Global Development Network (GDNet).
cHAbAne, N., rAkHudu, M. & roberts, S. 2008. Market power and competition concerns in food: a review of conduct and outcomes following deregulation. Pretoria: Competition Commission of South Africa.
collier, P. & dercon, S. 2006. Review article: The complementarities of poverty reduction, equity and growth: A perspective on the world development report 2006. Economic Development and Cultural Change 55(1): 223–236.
cotulA, L. 2008. The right to food and access to natural resources—using human rights arguments and mechanisms to improve resource access for the rural poor.
crosoer, D., vAn sittert, L. & Ponte, S. 2006. The integration of South African fisheries into the global economy: Past, present and future. Marine Policy, 30(1): 18–29.
crusH, J., HovorkA, A. & teverA, D. 2010. Urban food production and household food security in Southern African cities [Online]. Kingston and Cape Town: Queen’s University and African Food Security Urban Network. Accessed online: http://queensu.ca/samp/afsun/files/AFSUN_4.pdf on 30 May 2012.
DAFF. 2009. 2010. Abstract of Agricultural Statistics. Directorate: Statistics, Department of Agriculture, Forestry and Fisheries.
DAFF. 2009b. Economic review of South African agriculture. Pretoria, South Africa: Department of Agriculture, Forestry and Fisheries.
DAFF. 2011. Abstract of Agricultural Statistics. Directorate: Statistics, Department of Agriculture, Forestry and Fisheries.
demeke, M., PAngrAzio, G. & mAetz, M. 2008. Country responses to the food security crisis, nature and the preliminary implications of the policies pursued. FAO.
dinAr, A., HAssAn, R., mendelsoHn, R. & benHin, J. 2008. Climate change and agriculture in Africa: impact assessment and adaptation strategies. Earthscan, London.
doA. 2008. National agricultural research and development strategy. Department of Agriculture: Pretoria, Republic of South Africa.
DWAF. 2009. Draft Forestry 2030 Roadmap. Department of Water Affairs and Forestry: Pretoria, Republic of South Africa.
DWAF. 2009. Forest Sector Charter. Department of Water Affairs and Forestry, Pretoria, Republic of South Africa. Economist Intelligence Unit, (2010). Country Forecast.
FAO. 2003. Future climate change and regional fisheries: a collaborative analysis. Food and Agricultural Organization of the United Nations, FAO Fisheries Technical Paper, No 452, Rome.
FAO. 2006. World Agriculture: Towards 2030/2050 - Interim report. Rome.
FIP. 2006. The future strategy of the fruit industry in South Africa. Fruit South Africa, Cape Town.
Forestry soutH AFricA. 2010. The South African Forestry and Forest Products Industry 2009. Accessed online: http://www.forestry.co.za/ uploads/File/home/facts/SA_Forestry_Industry_2010_colour.ppt, on 24/10/2011.
Food And AgriculturAl Policy reseArcH institute. 2010. U.S. and world agricultural outlook. Iowa State University and the University of Missouri-Columbia, U.S.
Food Pricing monitoring committee. 2004. South Africa Food Cost Review. Pretoria: NAMC.
Future WAter. 2008. Climate change impact and adaption on global food security. Available online: http://www.futurewater.nl/uk/ projects/dwc-global on 22 February 2012.
HAll, R. 2009. Another countryside? Policy options for land and agrarian reform in South Africa. Bellville, South Africa: PLAAS, University of the Western Cape.
HAll, R. 2009. A fresh start for rural development and agrarian reform? Policy Brief (29), PLAAS, University of the Western Cape.
HAll, R. and Aliber, M. 2009. The case for restrategising spending priorities to support smallscale farmers in South Africa. Paper presented at the IDASA conference on Governance and Small-scale Agriculture in southern Africa, Indaba Hotel, Gauteng 9–11 November 2009.

68 Agriculture, Forestry and Fisheries IGDP: Bibliography
JindAl, R., sWAlloW, B. & kerr, J. 2008. Forestry-based carbon sequestration projects in Africa: Potential benefits and challenges. Natural Resources Forum, 32(2): 116–130.
Jones, P.G. & Thornton, P.K. 2003. The potential impacts of climate change on maize production in Africa and Latin America in 2055. Global Environmental Change, (13): 51–59.
kok, P. & collinson, M. 2006. Migration and urbanisation in South Africa. Report 03-04-02, Pretoria: Statistics South Africa.
liebenberg, F., PArdey, P. G. & kAHn, M. 2010. South African agricultural research and development: a century of change. Staff Series Papers: College of Food, Agricultural and Natural Resource Sciences, University of Minnesota.
liPton, M. 2010. Land reform in developing countries: property rights and property wrongs, Routledge.
lord stern. 2009. “Lord Stern on global warming: It’s even worse than I thought”, The Independent , (March 13, 2009).
mAbugu, R. & cHitigA, M. 2007. South Africa trade liberalization and poverty in a dynamic microsimulation CGE model. Department of Economics Working Paper Series: University of Pretoria, South Africa.
mucinA, L. & rutHerFord, M.C. (Eds) 2006. The vegetation of South Africa, Lesotho and Swaziland. in Strelitzia 19: South African National Biodiversity Institute, Pretoria.
NAMC. 2008. Food cost review. Pretoria, South Africa: NAMC and DAFF.
NAMC. 2008. War on Poverty—towards sustainable food security, jobs and wealth creation through agriculture. Discussion document— Agricultural Summit, Polokwane, Limpopo.
nAtionAl treAsury. 2007. Estimates of national expenditure 2007/08. Pretoria, South Africa: National Treasury.
nAtionAl treAsury, 2009. Provincial Budgets and Expenditure Review: 2005/06–2011/12. Pretoria, South Africa: National Treasury.
NDA. 2008. The State of Extension and Advisory Service within the Agricultural Public Service: A Need for Recovery. Government memorandum.
nAudé, W. & coetzee, R. 2004. Globalisation and inequality in South Africa: Modelling the labour market transmission. Journal of Policy Modelling, (26): 911–925.
nyHodo, B., Punt, C. & vink, N. 2009. The potential impact of the Doha Development Agenda on the South African economy: liberalising OECD agriculture and food trade. Agrekon, 48 (1): 35–59.
PHiliP, K. & HAssen, E.K. 2008. The review of second economy programmes: An overview of the Presidency’s Fifteen—Year Review Second Economy Strategy Project. Accessed online: http://www.tips.org.za/files/2nd_Economy_15-Year_Review_Presidency_April08.pdf on 30/05/2012.
rAkHudu, M. 2008. Competition Commission’s focus on agriculture and food value chains. Pretoria: Competition Commission, dti.
rodrik, D. 1998. Trade Policy and Economic Performance in SubSaharan Africa, Working Paper 6562. National Bureau of Economic Research, Cambridge.
scHoltz, M & bester, J. 2010. The effect of stock theft and mortalities on the livestock industry in South Africa. Journal of Applied Animal Husbandry and Rural Development. 3 (1): 15–18.
SESP. 2009a. Second Economy Strategy: addressing inequality and economic marginalisation: A Strategic Framework. The Presidency: Pretoria, South Africa.
simbi, T. & Aliber, M. 2000. The Agricultural Employment Crisis in South Africa, TIPS Working Paper 13–2000.
stAts SA. 2009. South African Statistics 2009. Pretoria: Statistics South Africa.
tAlbot, B. & AckermAn, P.A. 2009. Renewable energy: the potential opportunities and obligations of plantation forestry. Southern Forests: Journal of Forest Science,71: 79–83.
toulmin, C. 2009. Climate Change in Africa. Zed Books: London, UK.
UNEP. 2010. Green Economy Report: A Preview.
vermeulen, H. & meyer, F. 2009. Impact analysis of food policy response on household food security: the case of South Africa’s maize subsector. International Association of Agricultural Economists’ 2009 Conference, Beijing, China.
vink, N. & kirsten, J. 2002. Pricing behaviour in the South African food and agricultural sector. A Report to the National Treasury.
vink, N., tregurtHA, N. & kirsten, J. 2008. Presidency fifteen year review report—review of agricultural policies and support. Pretoria, South Africa: ComMark Trust.
von brAun, J. 2008. Rising food prices what should be done? IFPRI Policy Brief, April 2008.
vuk’uzenzele, 2012. GCIS. Accessed online http://www.info.gov.za/vukuzenzele/2012/jan/employ_12jan_agri_grow.htm on 22/05/2012
WAgle, U. R. 2007. Are economic liberalization and equality compatible? Evidence from South Asia. World Development, 35(11): 1836–1857.
zHAng, W., ricketts, T.H., kremen, C., cArney, K. & sWinton, S.M. 2007. Ecosystem services and dis-services to agriculture. Ecological Economics, 64: 253–260.

8Glossary
Agroforestry: the practice of planting trees and crops together.
Aquaculture: farming with aquatic plants or animals in controlled or selected environments, with some form of intervention in the rearing process to enhance production. Examples include fish farming and algal cultures.
climate change: the process by which the changing composition of the earth’s atmosphere leads to long-term changes in weather patterns, for example, average temperatures and climate variability.
co-management: a governance approach in which government and communities share the responsibility and authority for the manage ment of a resource.
commercial farmers: commercial farmers are defined as those who produce primarily for the market and make considerable living from farming.
competitiveness: a comparative concept of the ability and performance of a firm, subsector or country to sell and supply goods and/or services in a given market.
consumptive use: use of natural resources which involves changing them from their natural state through various forms of harvesting.
convention: agreement made by nations over particular issues that are for the benefit of all.
deforestation: indiscriminate removal of trees from a forested area without adequate replanting.
environmental degradation: depletion or destruction of potentially renewable resources such as soil, grassland, forest or wildlife, by using it at a faster rate than it is naturally or deliberately replenished.
equity: fairness and equal outcomes in terms of gender, race and class.
Food security: a situation that exists when all people, at all times, have physical, social and economic access to sufficient, safe and nutri-tious food that meets their dietary needs and food preferences for an active and healthy life.
Forestry outgrower schemes: formalised partnership arrangements which involve legal contracts between two or more parties combining land, capital, management and market opportunities.
government/governments: the national Department of Agriculture, Forestry and Fisheries, provincial departments and local govern-ment and their State-owned Enterprises.
gross domestic product: the total monetary value of all goods and services produced domestically by a country. It includes income earned domestically by foreigners, but does not include income earned by domestic residents on foreign ground.
liberalisation: a relaxation of previous government restrictions, usually in areas of social or economic policy.
Pelagic: occurring in the open ocean.
Profitability: the amount of profit received relative to the amount invested, often measured as the rate of return on investment.
regulatory framework: The set of laws and regulations that govern rights and activities, often complemented by policies, standards, directives and guidelines.
research and development: Research and development (R&D) consists of various activities aimed at discovering new knowledge and applications of that knowledge in the hope of creating new products, processes, or services, or improving present products, processes, or services.
resource scarcity: a situation in which there are not enough actual or affordable supplies of a resource to meet present or future demand.
rural development: used to denote the actions and initiatives taken to improve the standard of living in non-urban neighbourhoods, countryside and remote villages.
small-growers: farmers within the forestry industry who run small and low intensity managed plantations.
smallholder farmers: those producers who produce food for home consumption, as well as sell surplus produce to the market, meaning that earning an income is a conscious objective.
Small-scale fishers: persons that fish to meet food and basic livelihood needs; are directly involved in harvesting; operate on or near to the shore or in coastal water bodies; employ low technology or passive fishing gear; undertake single-day fishing operations and subsist from their catch.
70 Agriculture, Forestry and Fisheries IGDP: Glossary
stakeholder/stakeholders: the private sector, development partners and interested and affected parties within agriculture, forestry and fisheries.
subsistence producers: those who produce food to supplement their household food needs, with little or no selling of produce to the market.
Sustainable development: development which meets the needs of the present without compromising the ability of future generations to meet their own needs; development that does not require a continuous input from outside to sustain itself.
transformation: a process of profound change that should result in a new direction to a different level of effectiveness, where everyone contributes to a shared outcome and the economy is meaningfully depicted at all levels.