agriculture in russia - cn888ru.com in russia.pdf · 4.6%). fisheries are viewed separately from...
TRANSCRIPT

Agriculture in Russia
Industry overview and investment opportunities
—
May 2016

© 2016 JSC KPMG, a company incorporated under the Laws of the Russian Federation, a member firm of the KPMG network of independent member firms affiliated with KPMG International Cooperative (“KPMG International”), a Swiss entity. All rights reserved. Printed in Russia. 2
11 119 8 8 8
7 6 6 6
02,04,06,08,0
10,012,0
Alta
y Kr
ai
Ore
nbur
g O
blas
t
Volg
ogra
d O
blas
t
Ros
tov
Obl
ast
Sara
tov
Obl
ast
Nov
osib
irsk
Bash
korto
stan
Om
sk O
blas
t
Kalm
ykiy
a
Stav
ropo
l Kra
i
Agriculture in Russia
A clear trend of domestic production replacing imported food and the weak rouble coupled with a food import ban enable rapid expansion of local production and make agriculture one of the most attractive sectors of the Russian economy
Agriculture’s share in the gross value added (GVA) of Russia fluctuated at around 4% from 2008 to 2015 (from 3.6% to 4.6%). Fisheries are viewed separately from agriculture, and its share was around 0.3% of GVA.
In 2015 agricultural production increased by 17% compared to 2014 (from RUB4,319 bn to RUB5,037 bn).
The proportion of key agricultural sub-sectors, namely crop cultivation and livestock breeding, in the total value of agricultural output was almost equal throughout 2008-2015 and averaged 50%.
64% of total agricultural production is concentrated in three Federal Districts: Central (25%), Volga (24%) and Southern (15%).
The agricultural sector in the Russian economy
Agriculture in Russia
Source: Rosstat
2 461 2 516 2 5883 262 3 339 3 687 4 319
5 0374,2% 4,4%
3,6%4,2%
3,7% 3,8%4,2% 4,6%
0,0%
1,0%
2,0%
3,0%
4,0%
5,0%
0
2 000
4 000
6 000
2008 2009 2010 2011 2012 2013 2014 2015Agri production volume, RUB blnAgri, % of Gross value added
Agricultural production by key sub-segments
Source: Rosstat
Top-10 countries by farmland, m hectares
Note: Total farmland in Russia shown in this diagram differs from that in the pie chart on the next slide due to different sources
Source: FAO UN
Top-10 regions in Russia by farmland area, m hectares
Source: Rosstat
515 409 405 276 214 208 179 173 149
424 506363 560
1 423
62 11842 125
844
Chi
na
US
A
Aust
ralia
Braz
il
Rus
sia
Kaza
khst
an
Indi
a
Saud
i Ara
bia
Arge
ntin
a
Can
ada
Other land area Agricultural areaFarmland
0% 50% 100%
2014
2015
Crop Livestock
16%
10%
11%
14%28%
16%5%
Grain crop
Vegetables
Potato
Other Crop
Meat
Milk
Other LivestockProducts
48%
51% 49%
52%

© 2016 JSC KPMG, a company incorporated under the Laws of the Russian Federation, a member firm of the KPMG network of independent member firms affiliated with KPMG International Cooperative (“KPMG International”), a Swiss entity. All rights reserved. Printed in Russia. 3
Agriculture in Russia
Top-20 farmland holders as at 2014, k hectares
Note: * the company or part of the holding is in financial distress
Source: Companies’ official info
Legislation Impact Suggested approach
Ownership restrictions
Foreign nationals and legal entities as well as entities controlled by them (more than 50% equity) can only rent farmland. The minimal term for rent is set at three years (N 101-Federal Law , N 87-Federal Law) and is suggested to be limited by ten years maximum
Co-ownership with Russian owners
Requirements for farmland use
The owner or lessee should use farmland in accordance with its category. A land plot unused for three or more years can be withdrawn from the owner
It is essential for a farmland owner to be aware of and compliant with this regulation
Requirements for changing land type
A change in land type is only allowed in exceptional cases such as changes of locality borders or inability to use the land under its current category. Changing land type is prohibited if the cadastral value of the land is more than 30% higher that the average in the area. (N 172-Federal Law)
If a change of land type is planned, it is important to check if it is possible and prepare all of the required documentation
Source: Russian legislation
Agricultural companies
Financial investors
Top-20 farmland holders account for only 7.7 million hectares, or 4% of total farmland.
Out of the top land holders, a number of holdings are in financial difficulties or close to bankruptcy. This relates only to publicly available information and the actual number of distressed companies could be even higher.
Farmland in Russia by types, m hectares
Source: Rosstat
11557
19 5
Arable land Grazings Hayfields Others
560
550
480
460
400
381
361
350
346
322
308
280
259
238
200
200
200
196
164
160
0 100 200 300 400 500
ProdimexIvolga-holding
Ak BarsRusagro
Vamin Tatarstan*Miratorg
Siberian Agroholding (SAHO)*Razgulay*Avangard
Krasny VostokAgro-invest
AgroterraAgrosilaValinor*
AgrocomplexBin Finam Group
Yug RusiEcoNiva
RAV Agro-proASB
© 2016 JSC KPMG, a company incorporated under the Laws of the Russian Federation, a member firm of the KPMG network of independent member firms affiliated with KPMG International Cooperative (“KPMG International”), a Swiss entity. All rights reserved. Printed in Russia. 4
Agriculture in Russia
Major implications
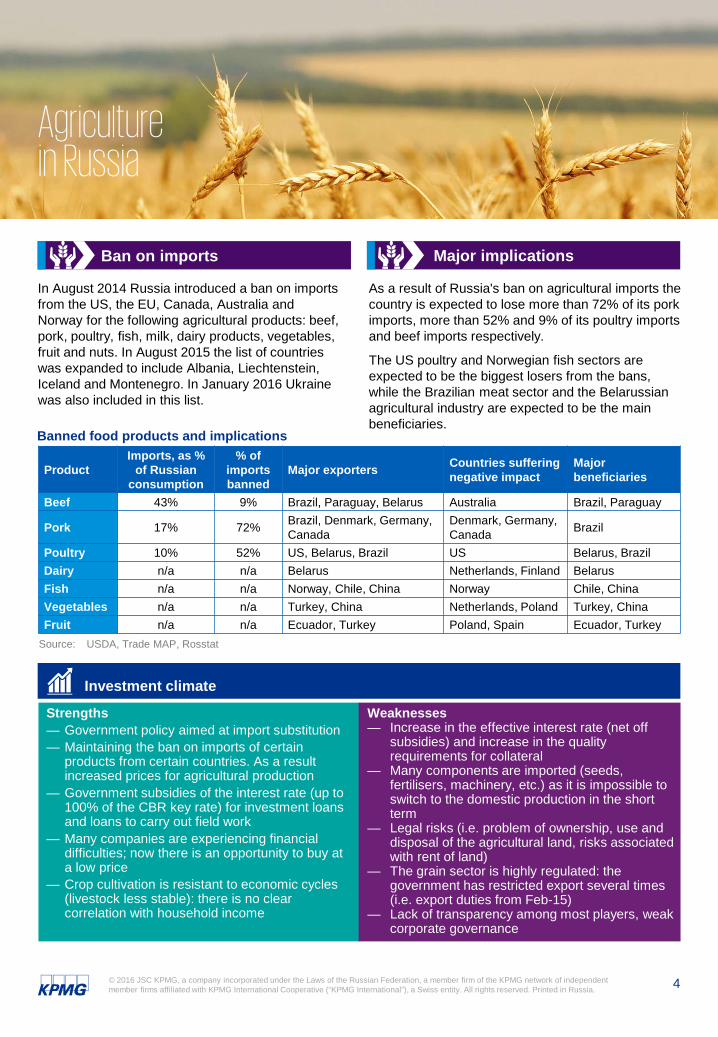
As a result of Russia's ban on agricultural imports the country is expected to lose more than 72% of its pork imports, more than 52% and 9% of its poultry imports and beef imports respectively.
The US poultry and Norwegian fish sectors are expected to be the biggest losers from the bans, while the Brazilian meat sector and the Belarussian agricultural industry are expected to be the main beneficiaries.
Ban on imports
In August 2014 Russia introduced a ban on imports from the US, the EU, Canada, Australia and Norway for the following agricultural products: beef, pork, poultry, fish, milk, dairy products, vegetables, fruit and nuts. In August 2015 the list of countries was expanded to include Albania, Liechtenstein, Iceland and Montenegro. In January 2016 Ukraine was also included in this list.
Banned food products and implications
Product Imports, as %
of Russian consumption
% of imports banned
Major exporters Countries suffering negative impact
Major beneficiaries
Beef 43% 9% Brazil, Paraguay, Belarus Australia Brazil, Paraguay
Pork 17% 72% Brazil, Denmark, Germany, Canada
Denmark, Germany, Canada Brazil
Poultry 10% 52% US, Belarus, Brazil US Belarus, Brazil Dairy n/a n/a Belarus Netherlands, Finland BelarusFish n/a n/a Norway, Chile, China Norway Chile, China Vegetables n/a n/a Turkey, China Netherlands, Poland Turkey, China Fruit n/a n/a Ecuador, Turkey Poland, Spain Ecuador, Turkey
Source: USDA, Trade MAP, Rosstat
Strengths— Government policy aimed at import substitution— Maintaining the ban on imports of certain
products from certain countries. As a result increased prices for agricultural production
— Government subsidies of the interest rate (up to 100% of the CBR key rate) for investment loans and loans to carry out field work
— Many companies are experiencing financial difficulties; now there is an opportunity to buy at a low price
— Crop cultivation is resistant to economic cycles (livestock less stable): there is no clear correlation with household income
Weaknesses— Increase in the effective interest rate (net off
subsidies) and increase in the quality requirements for collateral
— Many components are imported (seeds, fertilisers, machinery, etc.) as it is impossible to switch to the domestic production in the short term
— Legal risks (i.e. problem of ownership, use and disposal of the agricultural land, risks associated with rent of land)
— The grain sector is highly regulated: the government has restricted export several times (i.e. export duties from Feb-15)
— Lack of transparency among most players, weak corporate governance
Investment climate

© 2016 JSC KPMG, a company incorporated under the Laws of the Russian Federation, a member firm of the KPMG network of independent member firms affiliated with KPMG International Cooperative (“KPMG International”), a Swiss entity. All rights reserved. Printed in Russia. 5
Agriculture in Russia
Agriculture Segments to invest in
Agriculture segments Rationale for investing Potential sellers
Pork — Opportunity to replace imports, as 17% of pork is imported— Russian pork market has growth potential, due to consumption per
capita lagging behind that on many western countries and China
Local players looking for growth or exit
Poultry — Despite the near saturation of the market, growth is forecast due to lower prices compared to pork and beef
— Poultry consumption per capita in Russia is substantially lower than in many other countries, i.e. Argentina, Brazil, the US, etc.
Local players looking for growth or exit
Dairy farming — Many regions with shortfall of raw milk— Stable demand for raw milk from dairy products manufacturers
(approximately 21% of the total value of the minimum food products selection, according to data from Rosstat, is attributable to dairy products)
Local players looking for growth or exit/ Green field
Dairy products
— Insufficient domestic supply, opportunity to replace imports— Opportunity for export (growing demand in Asia)
Local players looking for growth or exit/ Green field
Land holding — Opportunity to invest at a low price, at present many land-controlling companies are suffering financial difficulties
— The acquisition of good productive land is only possible by investing in a land holding company (all good land is currently controlled by these market players)
— Growth potential in the grain sector due to current low yields (24 centners per hectare in Russia compared to 60-75 for developed countries) and low utilisation of agro land (1.4 times lower than in 1992)
— Favourable forecast for the wheat market (major grain in Russia): it is expected to be in strong demand as other foods (e.g. meat) become more expensive
Management companies owning distressed assetsBanks holding collateral of distressed companiesNon-core investors (i.e. private equity funds, wishing to exit investments)
Lettuce — Heavy dependence on imports, lack of greenhouses— Unconsolidated and underdeveloped market
Green field
Beef — Opportunity to replace imports, as 43% of beef is imported— Increase in production in 2015 vs. 2014
Green field
Vegetables — Heavy dependence on imports, lack of greenhouses Green field
Fishery — Opportunities for growth and import replacement— Exports are expected to become attractive while imports are likely to
decline
Local players looking for growth or exit
Source: KPMG Analysis

kpmg.ru kpmg.com/app
© 2016 JSC KPMG, a company incorporated under the Laws of the Russian Federation, a member firm of the KPMG network of independent member firms affiliated with KPMG International Cooperative (“KPMG International”), a Swiss entity. All rights reserved. Printed in Russia.
The KPMG name, logo and “cutting through complexity” are registered trademarks or trademarks of KPMG International Cooperative (“KPMG International”).
The information contained herein is of a general nature and is not intended to address the circumstances of any particular individual or entity. Although we endeavor to provide accurate and timely information, there can be no guarantee that such information is accurate as of the date it is received or that it will continue to be accurate in the future. No one should act on such information without appropriate professional advice after a thorough examination of the particular situation.
ContactsThe contacts at KPMG in connection with this report are:
Vitaly SheremetPartnerTel: + 7 495 937 44 77 Mob: +7 916 592 39 [email protected]
Dmitry MusatovDirectorTel: + 7 495 937 44 77 Mob: +7 968 691 10 [email protected]