agriculture, forestry and other land use mitigation ... · mitigation of climate change in...
TRANSCRIPT

Agriculture, forestryand other land use
mitigation project database
MICCAMITIGATION OF CLIMATE
CHANGE IN AGRICULTURE
MIT
IGA
TIO
N O
F C
LIM
AT
E C
HA
NG
E I
N A
GR
ICU
LTU
RE
SE
RIE
S
2

MITIGATION OF CLIMATE CHANGE IN AGRICULTURE SERIES 2
Agriculture, forestry and other land use mitigation project database An assessment of the current status of land-based sectors in the carbon markets Mathias Varming, Christina Seeberg-Elverfeldt & Marja-Liisa Tapio-Biström Mitigation of Climate Change in Agriculture (MICCA) Project
Food and Agriculture Organization of the United Nations (FAO) November 2010

Cover photo: ���������� �����
The conclusions given in this report are considered appropriate for the time of its preparation. They may be modified in the light of further knowledge gained at subsequent stages of the project. The papers and case studies contained in this report have been reproduced as submitted by the participating organizations, which are responsible for the accuracy of the information reported. The designations employed and the presentation of material in this information product do not imply the expression of any opinion whatsoever on the part of the Food and Agriculture Organization of the United Nations (FAO) concerning the legal or development status of any country, territory, city or area or of its authorities, or concerning the delimitation of its frontiers or boundaries. The mention of specific companies or products of manufacturers, whether or not these have been patented, does not imply that these have been endorsed or recommended by FAO in preference to others of a similar nature that are not mentioned. The views expressed in this information product are those of the author(s) and do not necessarily reflect the views of FAO. © FAO 2010

i
Contents Acknowledgements ii Abbreviations iii Executive Summary iv 1. Introduction 1 2. Carbon offsetting at a glance 2
What is carbon offsetting? 2 Compliance vs. Voluntary 2
3. Methodology 4
Scope 4 Data collection 4 Categorisation 5 Number of projects as a measure 5
4. Regional differences 6
Project types 6 Project Development 7
5. The times are changing 10
1990-2005: The early years 10 2006: The heyday of manure 11 2007-2009: Building momentum 11 2010: Grinding to a halt 12
6. Conclusions 13
Changes and differences over time, regions and schemes 14 Terrestrial Carbon and the future 13 Outlook for AFOLU enabling mechanisms 15
Bibliography 15 Annex I: Data Sources 17 Annex II: Tables for Figures 1-6 18

ii
AcknowledgementsVarious people and organisations have helped to make this publication possible, through direct and indirect contributions. Firstly, the most valuable inputs are the provision of publicly available data by various crediting schemes, as well as the third party organisations who have compiled different databases (EcoAgriculture Partners, ICRAF, Forest Carbon Portal and UNEP Centre Risoe). Their work and data provides the basis of this publication. Contributions to the report have been made by Anders Trolle Purup and Maizura Ismail. FAO gratefully acknowledges the Government of Finland for providing funding for this publication.

iii
Abbreviations AFOLU Agriculture, Forestry and Other Land Use AFOLU MP Agriculture, Forestry and Other Land Use Mitigation Project CAR Climate Action Reserve CCBA Climate, Community and Biodiversity Alliance CCX Chicago Climate eXchange CDM Clean Development Mechanism CFI Carbon Financial Instrument ERPA Emission Reduction Purchase Agreement FAO Food and Agriculture Organisation of the United Nations GHG Greenhouse Gas IPCC Intergovernmental Panel on Climate Change MICCA Mitigation of Climate Change in Agriculture REDD Reducing of Emissions from Deforestation and Degradation SBSTA Subsidiary Body for Scientific and Technological Advice UN United Nations UNFCCC United Nations Framework Convention on Climate Change

iv
Executive Summary Agriculture, forestry and other land uses (AFOLU) account for more than 30% of the total anthropogenic greenhouse gas (GHG) emissions (IPCC, 2007). On the other hand, agriculture and forestry offer huge mitigation potentials – 5.5–6 GtCO2e/yr and 5.4 GtCO2e/yr respectively. Any decision to exclude it from carbon regulation frameworks thus ignores a huge emission reduction possibility. However, an overview and thorough analysis of the ongoing global mitigation efforts in the AFOLU sectors, within and outside of the UN System, are needed in order to move forward. Under the Mitigation of Climate Change in Agriculture (MICCA) project, information on ongoing agriculture and forestry mitigation projects was compiled from various databases into the Agriculture, Forestry and Other Land Use Mitigation Project (AFOLU MP) database (to be found at www.fao.org/climatechange/micca/en/). This paper sums up the lessons that can be drawn from the analysis and interpretation of this database, setting the context for the pilot projects that are being developed under the MICCA project, assessing the status of AFOLU mitigation projects and identifying the gaps to be filled on the climate change agenda to enable the AFOLU sectors to contribute in a recognised way to climate change mitigation. The AFOLU MP database currently contains information on 497 AFOLU mitigation projects gathered in 2010 from 11 different registries, both crediting scheme registries and third party databases. The AFOLU MP database shows that Latin America and Asia have managed to harness the potentials from market-based financing schemes, mainly through their livestock sectors (manure-related projects) that account for 76% of all projects. Unlike the two regions, Africa and Central Asia have not been able to benefit fully from carbon trading with respect to AFOLU projects, therefore have been excluded from the direct economic benefits and are less prepared for future emission reduction demands. However, Africa hosts a considerable number of carbon projects developed outside the certification schemes. North America is by far the region that has the most diversity in the types of projects developed, including the otherwise largely unexplored soil carbon initiatives. This study indicates that emission reductions through agriculture and forestry activities are a reality on the carbon markets. The potential for providing further sinks and mitigation possibilities by these sectors is given, however re-thinking is needed for its realisation as currently there is a low take-up rate for these projects under market-based schemes. The rules and the framework of the regulatory carbon markets of any post-Kyoto agreement should consider the AFOLU sectors to enable increased participation by all developing countries from all regions and to obtain the full benefit from these sectors in terms of their GHG mitigation potential. In addition, some areas such as Africa, which have not seen a notable development of market-based carbon projects but provide considerable potential for AFOLU activities, need different financing mechanisms for the land based sectors which are not solely driven by the markets to support both climate change mitigation and adaptation of agricultural activities by smallholders.

1
1. Introduction According to the Fourth Assessment Report from the Intergovernmental Panel on Climate Change (IPCC), agriculture, forestry and other land uses (AFOLU) account for approximately 30% of the total anthropogenic GHG emissions (IPCC, 2007). Of these, agriculture accounts for about 60% of N2O and 50% of CH4 emissions, whereas deforestation and land use change are mainly causing CO2 emissions (IPCC, 2007). Furthermore, agriculture and forestry provide a huge mitigation potential. Agriculture and forestry have the potential to mitigate between 5.5 – 6 GtCO2e/yr and 5.4 GtCO2e/yr, respectively (IPCC 2007). Therefore, excluding these sectors in the overall approach to mitigate climate change, as it has been the case under the Kyoto Protocol (FAOb, 2009), as well as in the American legislation proposals to regulate carbon (Chameides, 2009), is not an option. In the Kyoto Protocol, afforestation and reforestation were the only land use activities included whereas sustainable agricultural land management activities and avoided deforestation (Reducing Emissions from Deforestation and forest Degradation (REDD)) have been excluded. In early 2010 the Mitigation of Climate Change in Agriculture (MICCA) project was established at the Food and Agriculture Organization of the United Nations (FAO) to support efforts to mitigate climate change through agriculture in developing countries and to move towards climate friendly agricultural practices. In August 2010, MICCA published its first working paper on an inventory of the first experiences of agricultural practices that mitigate climate change in developing countries, and the lessons learned (FAOa, 2010). As the second MICCA working paper, this publication aims to add to the picture outlined in the “Global survey of agricultural mitigation projects” by providing a thorough overview and analysis of all agriculture and forestry mitigation projects gathered from various databases. An overall image of the global effort of mitigation in the AFOLU sector was needed to set the context of the pilot projects currently being developed under the MICCA project, but also to assess the global pool of knowledge in this field, provide an overview as complete as possible of existing AFOLU mitigation projects and identify knowledge gaps. This led to the creation of the Agriculture Forestry and Other Land Use Mitigation Project (AFOLU MP) database. The AFOLU MP database is an overview of all agriculture and forestry based mitigation projects found in a number of databases (see Annex I, for a comprehensive list of data sources). Its objective is to be a common reference point that represents the joined portfolios of all major crediting schemes of all AFOLU projects, as well as the AFOLU mitigation projects undertaken outside of formalised schemes. This paper sums up the lessons that can be drawn from the analysis and interpretation of the data derived from the database.

2
2. Carbon offsets at a glance Although the AFOLU MP database does not solely look at carbon offset projects, but also at projects outside formalised crediting schemes, the majority of the projects in the database have been formulated to compensate emissions. Therefore, a short introduction to carbon offsets is provided. For a more comprehensive explanation of carbon offsets see Making Sense of the Voluntary Carbon Market: A Comparison of Carbon Offset Standards by Kollmuss et al. (2008).
What is carbon offsetting?The basic principle of carbon offsetting is that an entity1
The principle of carbon offsetting works because the greenhouse effect is global by nature, and an emission or a reduction has the same effect, regardless of its origin (Kollmus et al, 2008).
pays someone else to reduce greenhouse gas emissions, which can be a substitute or a supplement to their own emission reductions.
To ensure that offsetting is managed in a transparent and uniform way, the offset projects are certified by a set of rules, in this report referred to as a crediting scheme.
Compliance vs. VoluntaryTwo types of carbon markets exist and thus have different rules and modalities. The compliance market is subject to mandatory rules, whereas in the voluntary market the rules are subject to the regulations established through the various certifications standards. The carbon offsets or carbon credits are traded on both types of markets. Compliance credits can generally be used on the voluntary markets, but not the other way around. Offsets which are generated under the Kyoto protocol mechanisms are referred to as compliance credits. Under the Kyoto protocol, offsets were introduced to enable the market to find the most cost efficient approach to reduce greenhouse gas emissions. That way an entity which by law has to reduce its emissions, can buy offsets generated in another country to fulfil its target. Typically these emission reductions are created at a lower cost in the other country, leading to an overall global cost reduction when reducing GHG emissions. The only crediting scheme in the AFOLU MP database that generates compliance credits is the Clean Development Mechanism (CDM), which is mandated by the Kyoto protocol and the rules of which are governed by the UNFCCC secretariat. The CDM project type is subject to a variety of rules and limitations, which restrict its applicability for AFOLU projects, especially in developing countries. Under the Kyoto protocol the requirements for projects are strict and thoroughly checked, leading to long and costly registration and validation processes. Furthermore not all project types are included in the CDM. Most relevant for the AFOLU MP database is that reductions of emissions from deforestation and forest degradation (REDD) are not permissible under CDM and neither are agricultural carbon sequestration projects. Afforestation and reforestation projects are accepted, but do not generate credits on the same terms as other projects. The credits are considered non-permanent and are temporary. That means that the credits will only count in the national carbon balances for a number of years. They can then be renewed or have to be replaced with credits from other offset activities (CMP, 2006).
1 Entities in this sense will typically be nationals or companies, but can also be other types of organisations or individuals.

3
Apart from the regulatory markets and compliance activities the voluntary markets have emerged. These are used by individuals, companies or sometimes governments wanting to offset their emissions for several reasons, such as marketing, certification and social corporate responsibility (e.g. labelling products as “carbon neutral”) or preparation for future legislation (also called early adoption). Voluntary offsets do not have to adhere to any mandatory rules, and the crediting schemes for voluntary offsets are very varied. Some schemes aim to put a value on more than the carbon emissions and integrate social criteria and reward local co-benefits, such as for example the Climate, Community and Biodiversity Alliance (CCBA), TIST (the International Small Group and Tree Planting Program), REDD+ and the Plan Vivo Scheme. Other schemes emulate the CDM, however they apply different project selection criteria and standards, for example the Voluntary Carbon Standard (VCS) and CarbonFix, while others are regional cooperations with their own rules, such as the Chicago Climate Exchange (CCX) and Climate Action Reserve (CAR) (Kollmus et al, 2008). So far, the CCX is the only crediting scheme that allows soil carbon sequestration projects. Under the VCS two methodologies have been submitted for soil carbon sequestration projects, the Adoption of Sustainable Agricultural Land Management (SALM) methodology proposed by the World Bank and the BioCarbon Fund which is close to completing the VCS’s certification process, as well as the ALM Adoption of Sustainable Grassland Management through Adjustment of Fire and Grazing, proposed by Soils for the Future and Jadora International.

4
3. Methodology For a better understanding of the AFOLU MP database, as well as this paper, we note here the central assumptions and methodological choices that are at the basis of the database. Unless otherwise specified, all data used in this report is drawn from the AFOLU MP database.
ScopeThe AFOLU MP database aims to give an overall view of the ongoing mitigation activities in the agriculture and land use sectors, especially in developing countries. The projects listed are therefore all directly related to land use and livestock keeping, and include carbon sequestration from agriculture and forestry activities, as well as manure treatment from livestock. Processing activities such as slaughter, milling or sawmilling are not included, nor are projects involving agricultural residues such as rice husk or bagasse2
.
The goal of the boundaries set for the AFOLU MP database is to maintain the overall focus on the primary agricultural activities, namely crop and livestock production, as well as the planting of new and maintenance of existing forests, including the avoidance of deforestation. As specified by IPCC these sectors have huge mitigation potentials. The motivation of this analysis is thus to obtain an overview of whether this potential is already made best use of, what is happening in these sectors in terms of mitigation projects, which volumes of offsets are generated and which regions are covered.
Data collectionThe data for the AFOLU MP database is derived from a wide range of sources. These sources can overall be divided in two categories; Crediting scheme registries and third party databases. The data was retrieved from the different databases in August 2010. The registries of the individual crediting schemes provide direct access to the official data on each project, and have been used extensively. Most of the data in the AFOLU MP database stems from these registries. The third party databases are (like the AFOLU MP database) compilations of data from other sources. These databases have been included, as they give access to projects that would not otherwise have available, as they have not been formally registered yet with certification schemes and improve our understanding of what is happening on the ground. To ensure best possible comparability of data, pipeline projects - i.e. projects awaiting registration with a crediting scheme - have not been included. For projects that have not applied for certification, only projects that have already been implemented are included. Projects that have applied for registration with more than one crediting scheme3 have been labelled according to the first scheme they have registered with, unless it is specified as a progress in the project document in which case it is listed under the second4
.
2 Bagasse is a fibrous by product from cane sugar production. 3 This applies specifically to CCX projects switching to the CAR 4 Only one project (no. 395) registered with VCS after having first registered with CCBA. Several other projects have stated this as a purpose, but have so far not registered with VCS.

5
As only the publicly available databases, and a few other sources (for full list see Annex I) have been used for this research, there will be projects that fall within the scope of the database, but which have been missed. These include projects done for purely commercial reasons that do not include carbon crediting, such as e.g. the approximately 1500 manure biogas plants in Germany (Fischer & Krieg, 2002). As a consequence, Europe has been largely omitted from the analysis in this report. Unfortunately, there are most likely some development projects which have not been registered with the crediting schemes that have been missed. By including the third party databases from EcoAgriculture Partners (Shames & Scherr., Forthcoming), ICRAF (Wambui et al, 2009) and the Forest Carbon Portal (ForestCarbon Portal, 2010), oversights should be minimized but cannot be ruled out. The data listed is in the different databases are not always directly comparable. Specifically the data on emission reductions and carbon stock increase have been very different. The CAR and CCX databases have only made public the historical data on the amount of credits sold and not total reduction prospects for the project. As the AFOLU MP database is more focussed on highlighting the potentials, this historical data has not been included. Due to the limitations in the availability and usage of the data the conclusions to be reached on the basis of the AFOLU MP database are also restricted. The compilation should be solid enough for broad characterisations of the mitigation activities within the scope of the data, especially in developing countries. To carry out narrower causality analysis becomes more delicate given the above mentioned limitations in the data.
CategorisationCategorisation within each of the characteristics of a project (type, former land use etc.) has as far as possible been done within the definitions used by the projects themselves. When the source has not given a definition under a given headline, they have been assigned according to best judgement (e.g. forest conservation has been assumed to be in forests and project owners are assumed to be the implementing organisation unless specified otherwise). Where it has not been possible to attain reasonable certainty, the characteristic has been labelled “Unknown”.
Number of projects as a measureIn this paper, the number of projects has widely been used as a measure of activity. This is only a partial image, as a one hectare project carries the same weight as a 800,000 hectare project. Thus smaller projects are favoured over larger ones. However, an insight is provided into how widely the knowledge and institutional capacity for developing projects have spread, and how the characteristics of the projects being developed changes over time. It also provides an overall view across time, sectors, and schemes. Given the lacking data for the sizes of the emission reductions and stock increases (which would have been the other choice), the number of projects was used as the point of departure for most observations. Where it has been possible to give nuances to that picture, by accounting for contributing outside factors, this has been done. The use of the number of projects as a measure means that it is the dissemination of knowledge and build-up of capacity to implement projects that is tested, rather than the concrete impacts on atmospheric carbon concentration.
6
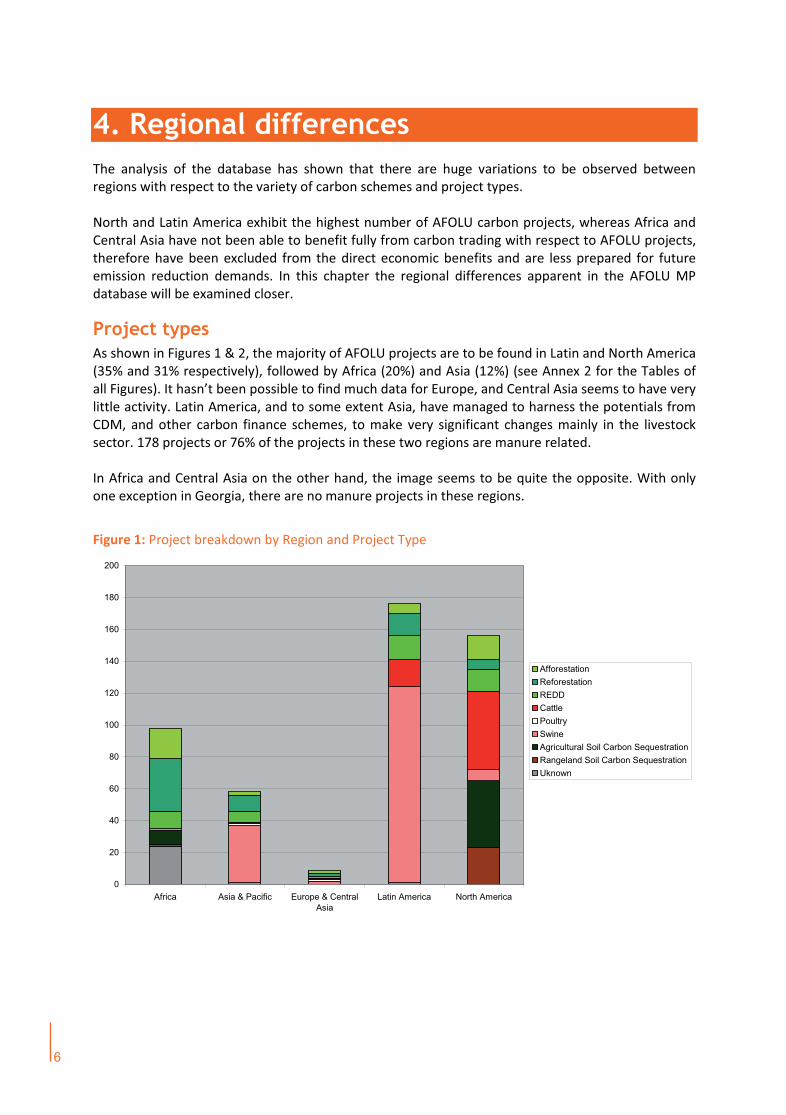
4. Regional differences The analysis of the database has shown that there are huge variations to be observed between regions with respect to the variety of carbon schemes and project types. North and Latin America exhibit the highest number of AFOLU carbon projects, whereas Africa and Central Asia have not been able to benefit fully from carbon trading with respect to AFOLU projects, therefore have been excluded from the direct economic benefits and are less prepared for future emission reduction demands. In this chapter the regional differences apparent in the AFOLU MP database will be examined closer.
Project typesAs shown in Figures 1 & 2, the majority of AFOLU projects are to be found in Latin and North America (35% and 31% respectively), followed by Africa (20%) and Asia (12%) (see Annex 2 for the Tables of all Figures). It hasn’t been possible to find much data for Europe, and Central Asia seems to have very little activity. Latin America, and to some extent Asia, have managed to harness the potentials from CDM, and other carbon finance schemes, to make very significant changes mainly in the livestock sector. 178 projects or 76% of the projects in these two regions are manure related. In Africa and Central Asia on the other hand, the image seems to be quite the opposite. With only one exception in Georgia, there are no manure projects in these regions.
Figure 1: Project breakdown by Region and Project Type
0
20
40
60
80
100
120
140
160
180
200
Africa Asia & Pacific Europe & CentralAsia
Latin America North America
AfforestationReforestationREDDCattlePoultrySwineAgricultural Soil Carbon SequestrationRangeland Soil Carbon SequestrationUknown

7
Figure 2: Project breakdown by Region and Scheme
0
20
40
60
80
100
120
140
160
180
200
Africa Asia & Pacific Europe & Central Asia Latin America North America
N/AVCSTISTREDD+Plan VivoCDMCCXCCBACarbonfixCAR
Interestingly, the CDM powerhouses of Asia, China and India, are strongly under-represented in agriculture and forestry carbon projects. The two countries, which have more than 60% of the registered CDM projects between them5
, only have 11 AFOLU projects. These countries have been concentrating on the business opportunities in green technologies and in China the government as decided to support the development of CDM projects especially in the renewable energy, as well as the industrial sector. The emphasis on these sectors, also to be observed in India, and the technological expertise developed, as well as a general focus of the regulatory carbon markets in the energy and industrial sectors, has probably lead these countries to marginalise AFOLU carbon projects. In addition, the forest sector has not been prepared for the carbon markets (Tennigkeit, 2008).
North America is by far the region that has the most diversity in the types of projects being developed. As shown in Figure 1, North America (dominated by USA) is the region with the largest amount of soil carbon projects (87% of the total), followed by Africa (13%). 42% of the total number of projects in North America are soil carbon projects and a further 22% are forestry related. The reason for this is most likely that the early adoption carbon crediting schemes in the USA allow for forestry and soil carbon sequestration projects, on equal terms with other types of projects. This suggests that, given the proper economic backing through crediting or otherwise, there could be a lot of viable projects in other regions as well.
Project DevelopmentAs indicated above, it is not only the types of projects that vary widely from region to region. Also the organisational frameworks under which the projects are developed are very different. As Figure 2 clearly shows, Asia, Latin and North America have had great success with utilising the possibilities within the
5 Own calculations based on (Fenhann, 2010).

8
market based mechanisms, whereas there are only few of these projects in Africa. Latin America alone has more than 145 AFOLU CDM projects of which the vast majority (97%) are manure projects.
Several reasons exist why Africa has not been more active in the carbon markets, such as relatively high transaction costs of carbon projects, the lack of capacity at the Designated National Authority level and missing strong leadership from industry and government. However, there is potential for mitigation activities in Africa, as has been demonstrated by the first publication in the MICCA series (FAOa, 2010) which exhibited a more or less equal amount of agricultural carbon mitigation projects in Africa in comparison to the other continents. Additionally Shames and Scherr (forthcoming), Wambui et al (2009) and Forest Trends et al (2010) all report an increasing number of terrestrial carbon projects in Africa, not all of them registered with crediting schemes, and often supported through aid projects, however supporting both climate mitigation and agricultural adaptation of smallholder activities in African countries. The analysis of the present database also shows that the proportion of African AFOLU projects, which are not registered under current crediting schemes is very high (86%), and over the later years the number of projects has been increasing (see Figure 6) indicating a growing potential for AFOLU projects on this continent. In general the private sector demand for emission reduction credits from Africa seems to be on the rise (Forest Trends et al, 2010). Simultaneously, the investment in African sustainable land management activities has been increasing over the last years which can foster also mitigation activities. For example in Zambia the Conservation Farmers Union is supporting 150,000 farmers to adopt conservation agriculture techniques, supported through Norway and with technical input from ICRAF. Furthermore the first Emissions Reductions Purchase Agreement (ERPA) has been signed in November 2010 for a Soil Carbon Project in Western Kenya. Therefore, the potential for AFOLU carbon projects in Africa is given, but needs to be leveraged and supported through other mechanisms than the regulatory carbon markets. As the GHG emissions have still not been significantly reduced, it is imperative for the world that the mitigation potentials in Africa are utilised, and vital for Africa they are rewarded on equal terms with the rest of the world for the efforts. This is should be an explicit goal, when designing future carbon remuneration legislation.
Generally, CDM does not have a good track record when it comes to land use projects (Figure 3). As of August 1st 2010, only 15 out of 2262 registered projects were forestry related (Fenhann, 2010) and 92% of the CDM projects in the AFOLU MP database are manure related. Several standards have been created for forestry projects holding about a quarter of the projects, but 50% of the projects are implemented outside crediting schemes. Similarly soil carbon projects are developed externally of the standardised mechanisms (17%), as well as in the CCX scheme in the USA (83%). A radical rethinking is necessary, how agriculture and forestry can play a bigger role in the market based mechanisms, as well as to organise a different way of financing forestry and land use projects.
Taking agriculture into account through a UNFCCC Subsidiary Body for Scientific and Technological Advice (SBSTA) work programme could support the systematic consideration and debate of outstanding technical issues to facilitate agricultural mitigation actions across developing countries (FAOa, 2009) as well as assist its integration into the climate change negotiations and legal frameworks.
Project development in North America is a success story for the early adoption markets in the form of the CCX and the CAR (see Figure 2). This shows that despite the lack of national legislation for cap and trade, there is a major interest from the agriculture sector to engage in mitigation action, given the right circumstances.

9
Figure 3: Project breakdown by Scheme and Project Type
0
50
100
150
200
250
CAR Carbonfix CCBA CCX CDM Plan Vivo REDD+ TIST VCS N/A
UnknownSoilForestryManure

10
5. The times are changing There has been a relatively constant increase over the years in the number of AFOLU carbon projects developed, with a peak in 2006 and a sharp drop in 2010. As this drop is not apparent in any other sector, it could be an indication that AFOLU projects are more susceptible to insecurities about the future climate change negotiations than other sectors.
1990-2005: The early yearsIn the time before the Kyoto Protocol came into effect in 2005, there was not a lot of activity to be observed with respect to the development of carbon projects (38 projects started before 2004, see Figure 4). Most of the projects that started at this time were forestry projects (64%, see Figure 5) and many were done outside of the certification organisations. Africa was getting a significant amount of attention, and at this time had almost two thirds of all projects (see Figure 4).
Figure 4: Project breakdown by Vintage and Scheme
0
20
40
60
80
100
120
140
<2004 2005 2006 2007 2008 2009 2010* Unknown
N/AVCSTISTREDD+Plan VivoCDMCCXCCBACarbonfixCAR
*Numbers for 2010, Jan-Jul only
After the Kyoto Protocol and consequently CDM entered into force, the focus of the first project to be developed was at first not in the forestry sector (see Figure 5), but rather swine manure projects, which in the beginning were very large. In 2005, the average project had approximately 120,000 swine. That number fell to 20-35,000 in later years. As seen in Figure 4, the CCX was also getting started around this time, but there was still not a lot of activity to be observed. The CCX was the first of the voluntary crediting schemes in USA.

11
2006: The heyday of manure2006 saw the introduction of methane avoidance from manure in the small scale AMS-III.D methodology6
under the CDM. During the last 3 months of 2006, 49 projects were registered under this methodology, more than a quarter of all the manure projects in the AFOLU MP database. During 2006 the projects had fewer animals than before but were still relatively big, with about 80,000 swine or 3,500 head of cattle on average. As can be seen from Figure 5, the year 2006 marks the peak, so far, in agricultural mitigation action, with respect to the total number of projects.
Figure 5: Project breakdown by Vintage and Project Type
0
20
40
60
80
100
120
140
<2004 2005 2006 2007 2008 2009 2010* Unknown
UnknownRangeland Soil Carbon SequestrationAgricultural Soil Carbon SequestrationSwinePoultryCattleREDDReforestationAfforestation
*Numbers for 2010, Jan-Jul only
2007-2009: Building momentumAfter a sharp drop in activity from 2006 to 2007, following the exceptionally high level of activity in the 4th quarter of 2006 and the first enthusiasm of CDM projects, the years 2007-2009 saw a continuous rise in new projects of all types. Only Latin America saw a drop in new activities (from 26 projects in 2007 and 2008 to 16 projects in 2009, see Figure 6), whereas all other regions increased the number of new projects. Even Africa and Central Asia, which had been completely left behind, were beginning to move. Equally interesting is the apparent shift in the project types in these years (Figure 5). The complete domination of manure projects started to fade. More and more forestry projects were initiated (tripling, from 11 projects in 2006 to 33 projects in 2009) and in the USA the soil carbon projects entered the market in force during these years, totalling 56 projects for the period 2007-2009.
6 For more information see http://cdm.unfccc.int/methodologies/DB/ZODCONSVY9D2ONIJKJMUZEKRE56T71/view.html

12
As it can be seen in Figure 4, new crediting schemes, i.e. the Climate, Community and Biodiversity Alliance (CCBA), Plan Vivo and Carbonfix, as well as a second regional voluntary market in the US, the Climate Action Reserve (CAR), made their entrance on the market during these years. This signifies a growing confidence in the carbon market as an investment opportunity, not only by project developers, but also in financial circles, as companies become more aware of the usefulness of their carbon footprint in marketing, as well as starting to prepare for climate regulations in USA. The latter can be seen by the growth in number of projects in North America in Figure 6 (26 projects in 2006 and 45 projects in 2009).
Figure 6: Project breakdown by vintage and region
0
20
40
60
80
100
120
140
<2004 2005 2006 2007 2008 2009 2010* Unknown
North AmericaLatin AmericaEurope & Central AsiaAsia & PacificAfrica
*Numbers for 2010, Jan-Jul only
2010: Grinding to a haltThe first half of 2010 has seen a drastic drop in activity7
. The continuing uncertainty of the carbon markets after 2012 when the Kyoto Protocol expires and stemming from the failure to make real progress towards an international agreement on emission reductions, as well as the failure of getting a cap and trade bill passed in USA, seem to finally have caught up with the project developers. As shown in Figure 6, the first half of 2010 has only seen the registration of 19 new AFOLU projects, compared to 100 in 2009. If this trend continues towards to the end of the year, this represents a drop in activity of more than 60%. The consequent loss of confidence by investors, creditors and institutions could prove very hard to regain, and must be prevented.
The CCX have already taken the consequence and have cut staff (Szabo, 2010), and the prices of Carbon Financial Investment (CFI) contracts8
have fallen to $0.05/ton (CCX, 2010).
7 Account has been taken of the fact that project numbers have only been available for the first 6 months of 2010. 8A CFI contract is the carbon offset product sold at the CCX.

13
Agriculture and forestry seem to be more susceptible to uncertainty than CDM projects in general. While activities in 2010 in the AFOLU MP database have fallen to about one third of the activity level of 2009, CDM projects in general seem to be on par with 2009 (Fenhann, 2010).

14
6. Conclusions
Changes and differences over time, regions and schemesNot all regions have seen an equal development of carbon projects since the introduction of carbon markets and the implementation of emission reduction projects. This holds true in general for carbon projects from all sectors, but also for AFOLU activities. After the first enthusiasm of CDM projects and a peak in 2006, the number of projects declined, but has been increasing afterwards steadily over the years, faced again with a drop in 2010 due to the uncertainty of the future of the international climate negotiations. Latin and North America are leading in the development of AFOLU projects, however Africa also seems to be picking up. Interestingly in Africa, even though its participation in the formalised carbon markets is very limited, a considerable number of projects are developed outside the certification schemes. Asia has to a large extend focused its efforts on other sectors, and the relatively few AFOLU projects are mostly manure based CDM projects. CDM is dominated by the manure projects, whereas the majority of soil projects are in the USA as part of the CCX scheme. In other regions soil projects are either missing completely, or done outside the crediting schemes. Different certification standards have already been developed for forestry projects, however many projects are still implemented outside these schemes.
Terrestrial carbon and the futureDuring the climate change negotiations REDD has received a lot of attention and discussion are on-going to include it in any future international climate agreement (for more on this see FAOb, 2010). It is however important not to forget, that there are other land use sectors, which also have their roles to play in avoiding dangerous changes to the earth’s climate. Agriculture has a significant mitigation potential of 5.5 – 6 GtCO2e/yr, which is equivalent to more than a fifth of the fossil carbon contribution to atmospheric carbon levels9
. If we are to avoid the worst effects of climate change, we need all sectors to be considered and contribute through all possible activities by reducing and avoiding GHG emissions.
Especially soil carbon sequestration projects are an untapped resource. Between 2008 and 2009 in the USA alone, 46 new soil carbon projects have been registered under the fairly moderate economic incentives from the CCX, and the credits from the first soil carbon project in Africa have just been sold. As most of these projects are taking place outside of the registered crediting schemes or are supported through development projects, it becomes evident that the terrestrial carbon projects need a different financial architecture than the current one to leverage them. In the ALOFU context it is also important to consider the interactions between agricultural production and forestry. Agriculture is a main driver of deforestation, and agricultural intensification on existing areas might need to be part of a mitigation package, therefore a comprehensive landscape view is needed to manage REDD and to ultimately achieve the goal of reduced emissions. Additionally, the cross-sectoral issue of wood energy use causing forest degradation needs to be food-energy production REDD.
9 Own calculation based on (IPCC, 2007).

15
Outlook for AFOLU enabling mechanisms It is of vital importance that the climate change negotiations and legal frameworks are decided in the near future. If there is no certainty, investments will not be made in the development of carbon projects in agriculture, forestry or any other sector. Therefore to get get things back on track a minimum certainty is needed for the international climate agreement as soon as possible. This paper has been assessing the activities outside the formal crediting schemes with respect to the myriad of activities to be found in the AFOLU sectors. And it clearly shows that a sound international agreement for post-Kyoto mitigation efforts is needed soon to keep the momentum and confidence of investors, built up over the last years. If that confidence is lost, it might take a long time to get it back. The land based sectors need to be part of a post-Kyoto agreement and a SBSTA agriculture work programme can support the analysis and discussion of outstanding technical issues for mitigation activities across developing countries to be integrated into the climate change negotiations. However, this analysis also shows clearly that we need to rethink how agriculture and forestry can play a bigger role in the current market-based mechanisms, but also how these mechanisms can be reformed and accommodated to include terrestrial carbon activities, which already support climate change mitigation and agricultural adaptation of numerous smallholders across developing countries.

16
Bibliography CCX, 2010. Reference date 15th August 2010. www.chicagoclimatex.com Chameides, B. 2010. What’s Different? Waxman-Markey Vs. Kerry-Boxer Climate Bills. Duke
University. www.nicholas.duke.edu/thegreengrok/waxmanmarkey-vs-kerryboxer CMP, 2006. Report of the Conference of the Parties serving as the meeting of the Parties to the Kyoto
Protocol on its first session, held at Montreal from 28 November to 10 December 2005 Addendum Part Two: Action taken by the Conference of the Parties serving as the meeting of the Parties to the Kyoto Protocol at its first session. http://cdm.unfccc.int/Reference/COPMOP/08a01.pdf#page=6
FAOa, 2010. Global survey of agricultural mitigation projects by C. Seeberg-Elverfeldt & M. Tapio-Biström. Mitigation of Climate Change in Agriculture Project. www.fao.org/docrep/012/al388e/al388e00.pdf
FAOb, 2010. Reference date 15th August 2010. www.fao.org/climatechange/unredd/en/ FAOa, 2009. Food Security and Agricultural Mitigation in Developing Countries: Options for Capturing
Synergies. www.fao.org/docrep/012/i1318e/i1318e00.pdf FAOb, 2009. State of the AFOLU sector in the COP 15 negotiations. Factsheet. DRAFT.
www.fao.org/fileadmin/templates/rome2007initiative/NENA_Forum_2009/Factsheets/FAO_CCFactsheet_StateAFOLUinCOP15negociations.pdf
FAO, 2008. Deforestation, land-use change and REDD by R.M. Martin. Unasylva 230, Vol. 59, 2008;
pages 3-11. FAO, 2006. Livestock’s long shadow: environmental issues and options, by H. Steinfeld, P. Gerber, T.
Wassenaar, V. Castel, M. Rosale & C. de Haan. Livestock, Environment and Development Initiative. Rome. www.fao.org/docrep/010/a0701e/a0701e00.htm
Fenhann, J. 2010. Overview of the CDM pipeline, August 2010. UNEP Risoe Centre.
http://cd4cdm.org/CDMJIpipeline.htm Fischer, T. & Krieg, A. Farm-Scale biogas plants. Krieg & Fischer Ingenieure GmbH.
www.kriegfischer.de/texte/farm%20scale%20Biogas%20Plants.pdf Forest Carbon Portal, 2010: Reference date August 1st 2010.
www.forestcarbonportal.com/projects Forest Trends, The Katoomba Group, Ecoagriculture Partners & Climate Focus, 2010. An African
Agricultural Carbon Facility – Feasibility Assessment and Design Recommendations. www.ecoagriculture.org/documents/files/doc_330.pdf
Hamilton, K., Sjardin, M., Peters-Stanley, M. & Marcello, T., 2010. Building Bridges: State of the Voluntary
Carbon Markets 2010. Ecosystem Marketplace & Bloomberg New Energy Finance. http://moderncms.ecosystemmarketplace.com/repository/moderncms_documents/vcarbon_2010.2.pdf

17
IPCC, 2007. Agriculture in Climate change 2007: Mitigation. Contribution of Working Group III to the Fourth Assessment Report of the Intergovernmental Panel on Climate Change. Cambridge, United Kingdom and New York, NY, U.S.A., Cambridge University Press.
Kollmuss, A., Zink, H. & Polycarp, C., 2008. Making Sense of the Voluntary Carbon Market: A
Comparison of Carbon Offset Standards. WWF. http://assets.panda.org/downloads/vcm_report_final.pdf
Shames, S. & Scherr, S., Forthcoming. Institutional models for carbon finance to mobilize sustainable
agricultural development in Africa. U.S. Agency for International Development, Washington, DC. Szabo, M., 2010. ICE cuts staff at Chicago Climate Exchange-sources. Reuters.
www.reuters.com/article/idUSLDE6791WI20100812 Tennigkeit, T., 2008. Carbon forestry in China: Carbon market prospects & requirements to generate
carbon assets from sustainable forest management. www.ceg.ncl.ac.uk/reimpact/Related%20Documents/Reports/Carbon%20Forestry%20in%20China_Timm08.pdf
Wambui, F., Minang, P.A., Chomba S., 2009. Africa Biocarbon Projects Database. ASB World
Agroforestry Centre. www.asb.cgiar.org/PDFwebdocs/biocarbon%20database.pdf
18
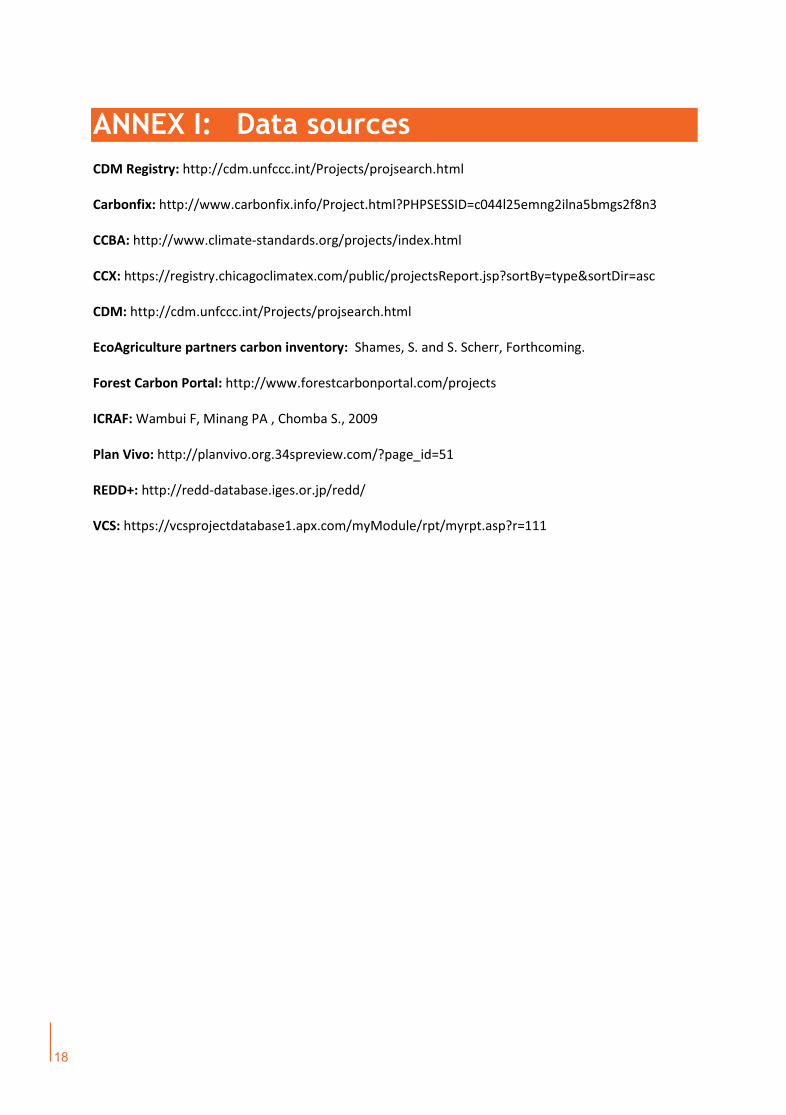
ANNEX I: Data sources CDM Registry: http://cdm.unfccc.int/Projects/projsearch.html Carbonfix: http://www.carbonfix.info/Project.html?PHPSESSID=c044l25emng2ilna5bmgs2f8n3 CCBA: http://www.climate-standards.org/projects/index.html CCX: https://registry.chicagoclimatex.com/public/projectsReport.jsp?sortBy=type&sortDir=asc CDM: http://cdm.unfccc.int/Projects/projsearch.html EcoAgriculture partners carbon inventory: Shames, S. and S. Scherr, Forthcoming. Forest Carbon Portal: http://www.forestcarbonportal.com/projects ICRAF: Wambui F, Minang PA , Chomba S., 2009 Plan Vivo: http://planvivo.org.34spreview.com/?page_id=51 REDD+: http://redd-database.iges.or.jp/redd/ VCS: https://vcsprojectdatabase1.apx.com/myModule/rpt/myrpt.asp?r=111

19
Annex 2: Tables for Figures 1-6
Table 1: Project breakdown by Region and Type
Table 2: Project breakdown by Region and Scheme
Table 3: Project breakdown by project Type and Scheme
Type\Scheme CAR Carbonfix CCBA CCX CDM Plan Vivo REDD+ TIST VCS N/A Sum
Manure 8 0 0 49 182 0 0 0 0 0 239
Forestry 3 7 23 31 15 4 5 3 1 85 177
Soil 0 0 0 65 0 0 0 0 0 13 78
Unknown 0 0 0 0 0 0 0 0 0 3 3
Sum 11 7 23 145 197 4 5 3 1 101 497
Table 4: Project breakdown by vintage and Scheme
Region\Type Afforestation Reforestation REDD Cattle Poultry Swine Agricultural Soil Carbon
Rangeland Soil Carbon Unknown Sum
Africa 19 33 11 0 0 1 9 1 24 98 Asia & Pacific 2 10 7 1 1 36 0 0 1 58 Europe & Central Asia 2 2 1 1 1 2 0 0 0 9 Latin America 6 14 15 17 0 123 0 0 1 176 North America 15 6 14 49 0 7 42 23 0 156 Sum 44 65 48 68 2 169 51 24 26 497
Region\Scheme CAR Carbonfix CCBA CCX CDM Plan Vivo REDD+ TIST VCS N/A Sum
Africa 0 1 3 0 3 3 0 3 1 84 98 Asia & Pacific 0 1 6 1 43 0 5 0 0 2 58 Europe & Central Asia 0 1 0 0 6 0 0 0 0 2 9 Latin America 0 4 7 8 145 1 0 0 0 11 176 North America 11 0 7 136 0 0 0 0 0 2 156 Sum 11 7 23 145 197 4 5 3 1 101 497
Vintage\Scheme CAR Carbonfix CCBA CCX CDM Plan Vivo REDD+ TIST VCS N/A Sum
<2004 0 1 0 3 0 2 1 3 0 28 38 2005 0 0 0 5 6 0 0 0 0 1 12 2006 2 1 0 25 94 1 0 0 0 3 126 2007 1 2 2 27 27 0 0 0 0 7 66 2008 2 0 4 44 26 0 1 0 0 10 87 2009 2 1 12 41 39 0 0 0 1 4 100 2010* 4 2 5 0 5 1 0 0 0 2 19 Unknown 0 0 0 0 0 0 3 0 0 46 49 Sum 11 7 23 145 197 4 5 3 1 101 497

20
Table 5: Project breakdown by Vintage and Type
Table 6: Project breakdown by Vintage and Region
Vintage\Type Afforestation Reforestation REDD Cattle Poultry Swine Agricultural Soil Carbon
Rangeland Soil Carbon Unknown Sum
<2004 10 10 4 0 0 1 7 1 5 38 2005 1 0 0 2 0 7 1 0 1 12 2006 4 5 2 24 1 84 6 0 0 126 2007 6 4 7 13 0 22 12 0 2 66 2008 8 4 14 16 0 26 10 7 2 87 2009 7 19 7 9 1 28 13 16 0 100 2010* 3 8 3 4 0 1 0 0 0 19 Unknown 5 15 11 0 0 0 2 0 16 49 Sum 44 65 48 68 2 169 51 24 26 497
Vintage\Region Africa Asia & Pacific Europe &
Central Asia Latin America North America Sum <2004 24 2 1 8 3 38 2005 1 0 0 7 4 12 2006 5 7 1 87 26 126 2007 6 8 1 25 26 66 2008 8 8 0 26 45 87 2009 7 27 5 16 45 100 2010* 2 3 1 6 7 19 Unknown 45 3 0 1 0 49 Sum 98 58 9 176 156 497

Land use projects are especially exposed to the insecurities regardingthe future of international climate change regulations. Therefore, it is
imperative that the long term structures of the climate change framework are settled as soon as possible, including the
reconsideration of the existing crediting schemes as the appropriate remuneration approach for AFOLU projects in developing countries.
This second publication in the MICCA series aims to set the global agricultural mitigation survey (as presented in the first publication)
in context. The AFOLU MP database is a compilation of publiclyavailable data on mitigation projects in agriculture and forestry, and
this paper describes, first, the analysis and output of the databaseand, second, which implications can be derived for the
development of mitigation activities in agriculture and forestry.
Mitigation of Climate Change in Agriculture (MICCA)Food and Agriculture Organization of the United Nations (FAO)
Viale delle Terme di Caracalla00153 Rome, Italy
[email protected]/climatechange/micca/en