agriculture, ecosystems and environment - ars home .... nichols...online xxx keywords: nitrous oxide...
TRANSCRIPT

Agriculture, Ecosystems and Environment 225 (2016) 104–115
Nitrous oxide and methane fluxes from cattle excrement on C3 pastureand C4-dominated shortgrass steppe
Kristopher L. Nicholsa,*, Stephen J. Del Grossoa, Justin D. Dernerb, Ronald F. Folletta,Shawn L. Archibequec, Catherine E. Stewarta, Keith H. Paustiand
aUnited States Department of Agriculture, Agricultural Research Service, Plains Area, Soil Management and Sugar Beet Research Unit, 2150 Centre Avenue,Building D, Fort Collins, CO 80526, USAbUnited States Department of Agriculture, Agricultural Research Service, Plains Area, Rangeland Resources Research Unit, 8408 Hildreth Road, Cheyenne, WY82009, USAcDepartment of Animal Sciences, Colorado State University, Fort Collins, CO 80523, USAdDepartment of Soil and Crop Sciences, and Natural Resource Ecology Laboratory, Colorado State University, Fort Collins, CO 80523, USA
A R T I C L E I N F O
Article history:Received 9 April 2015Received in revised form 15 January 2016Accepted 16 March 2016Available online xxx
Keywords:Nitrous oxideMethaneShortgrass steppeUrineFecesGreenhouse gas
A B S T R A C T
Cattle play a major role in nutrient cycling of grassland ecosystems through biomass removal andexcrement deposition (urine and feces). We studied the effects of cattle excrement patches (urine at430 and feces at 940 kg N ha�1) on nitrous oxide (N2O) and methane (CH4) fluxes using semi-staticchambers on cool-season (C3), Bozoisky-select (Psathyrostachys juncea) pasture, and warm-season (C4)-dominated native rangeland of the shortgrass steppe (SGS) in northeastern Colorado. Nitrous oxideemission factors (EF; i.e., percent of added N emitted as N2O��N) did not differ between urine and feceson the C4-dominated native rangeland (0.11 and 0.10%) and C3 pasture (0.13 and 0.10%). These EFs aresubstantially less than the Intergovernmental Panel on Climate Change (IPCC) Tier 1 Default EF (2%) formanure deposited on pasture, indicating that during dry years the IPCC Tier 1 Default EF would result in asignificant overestimation of emissions from excrement patches deposited on SGS C4-dominated nativerangeland and C3 pasture. Over the first year of the study (19 June 2012–18 June 2013), cumulative CH4
uptake was 38% greater for urine (�1.49 vs. �1.08 kg CH4��C ha�1) and 28% greater for control plots(�2.09 vs. �1.63 kg CH4��C ha�1) on C4-dominated native rangeland compared to C3 pasture. In contrast,feces patches were net sources of CH4 with emissions from the C3 pasture (0.64 kg CH4��C ha�1) 113%greater than the C4-dominated native rangeland (0.30 kg CH4��C ha�1). Conversion of C4-dominatednative rangeland to C3 pasture can have long term effects on CH4 uptake; therefore consideration shouldbe taken before implementing this management practice.
Published by Elsevier B.V.
Contents lists available at ScienceDirect
Agriculture, Ecosystems and Environment
journa l homepage : www.e l sev ier .com/ loca te /agee
1. Introduction
Cattle play a significant role in the nitrogen (N) cycle ofgrassland ecosystems by redistributing up to 80% of consumed Nthrough their excrement in urine and feces patches (Milchunaset al., 1988; Wachendorf et al., 2008). The high N rate depositedthrough excrement patches greatly exceeds the demands of semi-
Abbreviations: N2O, nitrous oxide; CH4, methane; EF, emission factor; GHG,greenhouse gas; SGS, shortgrass steppe; DOY, day of year; WFPS, water-filled porespace.* Corresponding author.E-mail address: [email protected] (K.L. Nichols).
http://dx.doi.org/10.1016/j.agee.2016.03.0260167-8809/Published by Elsevier B.V.
arid grassland flora, thereby subjecting excrement-N to lossesthrough nitrification, denitrification, ammonia (NH3) volatiliza-tion, and leaching (Williams et al., 1999; de Klein et al., 2003;Maljanen et al., 2007; Wachendorf et al., 2008). Leaching isminimal in semi-arid grasslands such as the shortgrass steppe(SGS) since potential evapotranspiration (PET) is substantiallylarger than the amount of precipitation received and hence watermovement below the rooting zone rarely occurs (Schimel et al.,1986; Augustine et al., 2013). Direct nitrous oxide (N2O) emissionson grazing lands range from 0.1–3.8% for urine and 0.05–0.7% forfeces patches of total excrement N applied (Milchunas et al., 1988;Oenema et al., 1997; Follett, 2008; Yao et al., 2010; van derWeerden et al., 2011; Hoeft et al., 2012). The IntergovernmentalPanel on Climate Change (IPCC) Tier 1 Default Emission Factor (EF;
K.L. Nichols et al. / Agriculture, Ecosystems and Environment 225 (2016) 104–115 105
i.e., percent of added N emitted as N2O��N) for manure depositedon pasture is 2%. This method assumes that the applied-N isentirely cycled within one year (IPCC, 2006).
Currently, knowledge on greenhouse gas (GHG) fluxes fromfeces patches is based on studies conducted over a short timeperiod (<1 year) (van der Weerden et al., 2011; Lessa et al., 2014;Mori and Hojito, 2015). Short-term studies, encompassing a singlegrowing season, may underestimate cumulative N2O emissionsfrom feces patches since organic N is the predominant form offeces-N. Depending on environmental conditions, feces composi-tion, and microbial community composition, organic forms offeces-N may take more than a single growing season to mineralize(Wachendorf et al., 2008). Wachendorf et al. (2005) found that ayear after cattle feces deposition on a sandy soil in Germany, 70% ofthe feces-N remained in the soil, accounting for 15% of the soilorganic-N. In addition, lysed microbial cells following freeze-thawcycles may release excrement-derived N previously assimilated inmicrobial biomass, which can lead to pulses of N2O emissions(Koponen and Martikainen, 2004; Holst et al., 2008; Wu et al.,2012). Therefore, when studying cumulative GHG fluxes from fecespatches, it is important to conduct measurements for >1 year toallow adequate time for mineralization of feces organic N.
Due to the vast land area that the SGS encompasses, 11%(3.4 �105 km2) of the central grasslands in North America, landmanagement practices on the SGS can have a significant impact onthe North American GHG budget (Lauenroth et al., 2008). Whilegrazing is the dominant land management practice on the SGS, theimpacts are relatively un-documented. Conversion of SGS C4-dominated native rangeland to cool-season (C3) pasture specieshas been found to be economically beneficial for ranchers (Dernerand Hart, 2010), by lengthening the growing season and providingmore sustained forage for cattle. However, data on the impacts ofsuch conversions on GHG emissions are lacking. Prior research hasshown that conversion of C4-dominated native rangeland to awinter wheat-fallow production system increased N2O emissionsand decreased CH4 uptake (Mosier et al., 1997). Mosier et al. (1997)found that three years following a tillage event, CH4 uptake was35% less and N2O emissions 25–50% greater than undisturbed C4-dominated native rangeland. Once cultivated soils of the SGS areallowed to revert back to grassland, it takes 8–50 years for CH4 andN2O soil-atmosphere gas exchange rates to return to that ofundisturbed native rangeland (Mosier et al., 1997).
The primary goal of this study was to evaluate effects of cattleexcrement patches on CH4 and N2O flux rates over a two yearperiod on a site representative of typical SGS C4-dominated nativerangeland and C3, Bozoisky-select, pasture. We tested thefollowing hypotheses for each plant community: (1) a greaterproportion of the urine-N will be emitted as N2O compared tofeces-N, (2) CH4 uptake rates will be less for urine and fecescompared to control plots, and (3) N2O emissions will be greaterfrom feces compared to the urine and control plots following thespring freeze-thaw cycle.
Table 1Soil properties (texture n = 2; bulk density and total N and C n = 16) for the 0–10 cm de
Site Depth Increment (cm) Sand (% � SE) Clay (% � SE) B
C4-dominated Native Rangeland0–5 63 � 7.1 9 � 1.0 15–10 72 � 2.0 10 � 0.0 1
C3 Pasture0–5 83 � 0.6 5 � 0.8 15–10 83 � 0.8 5 � 1.0 1
2. Materials and methods
2.1. Study site and experimental design
The study was conducted at the USDA—Agricultural ResearchService Central Plains Experimental Range (CPER), located about12 km northeast of Nunn, (40.841801,�104.70621; 1650 m abovesea level) on the western portion of the Pawnee NationalGrasslands in north-central Colorado. The soil is a Zigweid(Fine-loamy, mixed, superactive, mesic Ustic Haplocambids). Meanannual precipitation (1939–2012) was 341 mm yr�1, with 80%occurring between May-September. Mean annual temperaturewas 8.6 �C, with lowest temperatures in January (�1.5 �C) andhighest in July (22.2 �C).
This project focused on two plant communities, C3 pasture andC4-dominated native rangeland, which were directly adjacent toone another. The native rangeland site was characteristic of SGSnative rangeland, dominated by the C4 grass, blue grama(Bouteloua gracilis). Other common plants were fringed sagebrush(Artemisia frigida), buffalo grass (B. dactyloides), and plains pricklypear (Opuntia polyacantha). The C3 pasture was plowed and seededto Bozoisky-select in 1994, after having been ‘go-back’, orabandoned cropland that was allowed to naturally revegetatefollowing prior cultivation in the 1930s and 1950s with winterwheat. Bozoisky-select, a C3 bunch grass adapted to semi-aridgrasslands, is a cultivar of Psathyrostachys juncea, selected forimproved seedling vigor, winter hardiness, and drought-resis-tance. Bozoisky-select soils were significantly sandier and con-tained less C and N than C4-dominated native rangeland soils forthe top 10 cm (Table 1). Soil organic C accounted for the majority(�89%) of the total soil C (0–10 cm) for C4-dominated nativerangeland and C3 pasture soils, with carbonate-C making up <11%of total C (data not shown). The C4-dominated native rangelandwas typically grazed from mid-May to early-October, while theC3 pasture was grazed in both the spring (mid-April to mid-May)and fall (late-October to early-December). Both plant communitieshad been grazed annually leading up to the experiment, with theexception of 2007 and 2008 on the C3 pasture.
In the spring of 2012, we established a randomized completeblock design on each plant community with four blocks, orreplicates. Exclosures (7.3 m2) were constructed around each blockusing panels to exclude cattle. Four treatments 1) urine (U), 2) feces(F), 3) control water (Cw), and 4) control blank (Cb), were randomlyassigned to plots within each block. Treatment plots were 3 m2 inarea and were separated by a 0.5 m buffer. To simulate grazing,vegetation within the exclosures was periodically clipped to fivecm, removed from the study area, and kept for C and N analysis.Due to minimal aboveground biomass production in 2012,vegetation was clipped just once in the C4-dominated nativerangeland, and no clipping occurred in the C3 pasture.
Excrement was collected in May 2012 at Colorado StateUniversity’s (CSU) Agricultural Research, Development and
pth of plant communities, C4-dominated native rangeland and C3 pasture.
ulk Density (g cm�3� SE) Total N (Avg.% � SE) Total C (Avg.% � SE)
.16 � 0.03 0.12 � 0.008 1.32 � 0.13.37 � 0.03 0.07 � 0.002 0.66 � 0.02
.46 � 0.04 0.08 � 0.011 0.76 � 0.14
.45 � 0.03 0.06 � 0.002 0.53 � 0.02
106 K.L. Nichols et al. / Agriculture, Ecosystems and Environment 225 (2016) 104–115
Education Center (ARDEC). All sampling techniques, animal use,and handling were pre-approved by the CSU Animal Care and UseCommittee. Excrement was collected over a 24 h period from eight,360 kg weight cross-bred commercial steers. Steers were fed amixed ration that consisted of whole corn, silage, and hay.Homogenized samples of the mixed ration feed were oven dried at55 �C for C and N analysis. Urine was collected from each steerusing a urine collection harness and aspirated into a 45 Lpolypropylene carboy under vacuum. Fifty mL of six N hydrochloricacid (HCl) was added to each carboy prior to urine collection toprevent NH3 volatilization. Upon completion of excrementcollection, urine was homogenized and consolidated into two22.5 L carboys. A one L subsample of urine was collected to analyzethe C and N content. Feces were collected and stored in sealed,18.9 L buckets, and weighed. Urine and feces were stored at �4 �C.
One week prior to treatment application, excrement wastransferred to a walk-in cooler at 10 �C for gradual thawing. Oncethawed, feces was homogenized, and partitioned by wet weight(two kg) into 3.78 L sealable plastic bags. Subsamples were ovendried at 55 �C to calculate gravimetric moisture content andground to two mm using a Wretch grinder for C and Ndeterminations (see below). Urine was homogenized and pHadjusted to eight the morning of treatment application by adding300 mL of six N Sodium Hydroxide (NaOH) to approximately 30 L ofurine. Subsamples (1 L) were taken to analyze for C and N on a LECOTru-SPEC elemental analyzer (Leco Corp., St. Joseph, MI). Duringanalysis, liquid urine subsamples were added to Com-Aid, aninorganic compound, to dehydrate the samples for dry combus-tion. Mixed ration, feces, and C4-dominated native rangeland andC3 vegetation clipping samples were analyzed on a EuropaScientific automated N and C analyzer (ANCA/NT) with a Solid/Liquid Preparation Module (Dumas combustion sample prepara-tion system) coupled to a Europa 20–20 Stable isotope analyzercontinuous flow isotope ratio mass spectrometer (Europa ScientificLtd., Crewe, England).
Semi-permanent rectangular aluminum anchors (80.5 cm � 43cm, 0.312 m2) were installed to a depth of 10 cm over representa-tive areas within each treatment plot on 15 May (DOY 135) 2012.Excrement applications were conducted on the morning of 19 June(DOY 170) 2012. Liquid treatments, U and Cw, were applied (1.7 Lper treatment anchor) using separate watering pitchers. Homoge-nous coverage of the entire surface area within treatment anchorswas achieved by slowly pouring liquids from an approximateheight of 30 cm above the soil surface in effort to allow infiltrationwith minimal pooling. Each F treatment anchor received anaddition of six kg (19.2 kg m�2) of wet feces (76% water). Feceswere evenly spread across the soil surface within the treatmentanchor’s area to an approximate thickness of 2.5 cm using a trowel.In terms of the mass and volume applied per area, each F plot wasequivalent to 4–6 actual feces patches and each U plot wasequivalent to approximately one urine patch (Yamulki et al., 1998).Nitrogen application rates were 430 kg N ha�1 for U and 940 kg Nha�1 for F. Application rates (for the excrement deposition area) inthis study represented the average range for grazing cattle, 200–800 kg N ha�1 for urine and 500–2000 kg N ha�1 for feces (Oenemaet al., 1997; Wachendorf et al., 2008; van der Weerden et al., 2011).
2.2. Gas and soil analyses
Soil-atmosphere CH4 and N2O gas exchange was measuredusing the static chamber methodology outlined in Mosier et al.(2006). Baseline GHG measurements began on 22 May 2012 andwere taken 1–3 times a week for a month prior to treatmentapplication to establish baseline. Following treatment applicationon 19 June 2012, sampling frequency intensified. Sampling tookplace one, four, and eight hours following treatment application
and then once per day for the next three days. Sampling frequencyfor the first year of the study was three times a week during thegrowing season (May to September), two times a week during thefall (October to mid-November), two to four times a month duringthe winter (mid-November to March), and one time a week duringthe spring (March–June). During the second year of the study(2013), sampling was reduced to one time per week during thegrowing season, two times per month during the winter(November to March), and one time per week during the springof 2014 until the termination of the project in late May. Due to theimportance of soil moisture on GHG emissions, samplingfrequency was increased following large precipitation (>10 mm)and freeze-thaw events (as soil temperatures increased from <0 �Cto >0� C) in order to capture the resulting GHG dynamics.
Decagon Devices EC-TM soil moisture and temperature probes(Decagon Devices Inc., Pullman, WA) were installed to a depth of10 cm in two of the four replicates for all treatments on each plantcommunity to measure soil moisture and temperature during eachtrace gas sampling occasion. The raw dielectric permittivity valuesfrom the probes were converted to volumetric water content(VWC) using Decagon Devices ProCheck reader with the mineralsoil calibration option, which implements the Topp equation (Toppet al., 1980). Volumetric water content values measured by theprobes were cross-checked with gravimetric water content values(n = 5) determined by the soil core method for the 0–10 cm depth.For comparison purposes, the gravimetric water content valueswere converted to VWC by multiplying by the bulk density. Whilethe probes accurately measured soil water content trends, theyconsistently overestimated absolute values by 0.05–0.10 m3m�3.Water-filled pore space (WFPS) was then calculated by dividing theVWC by the soil porosity and multiplying by 100 to convert value toa percent.
Gas samples were collected in the morning, between 9:00 and12:00 h, to approximate an average daily flux and avoid diurnalvariation (Mosier et al., 1981; van der Weerden et al., 2013). Onthe day of treatment application, gas samples were also taken inthe afternoon and evening. van der Weerden et al. (2013) foundthat gas sampling urine patches three times a week between10:00 and 12:00 h resulted in minimal bias when compared tosampling every two hours over 28 days. During trace gassampling, chambers were seated onto anchors to create anairtight seal while limiting soil disturbance. Chambers weredeployed for 30 min with gas samples taken at 15 min intervals (0,15, and 30 min). Gas samples were collected using 35 mLpolypropylene syringes. The average air temperature at approxi-mately 10 cm above the soil surface was recorded during eachtrace gas sampling occasion using a Taylor digital thermometer(Taylor Precision Products, Oak Brook, IL).
Upon completion of sample collection, 25 mL of each samplewas immediately transferred to a corresponding 12 mL evacuated-glass exetainer fitted with a screw cap and rubber butyl septum(Exetainer vial from Labco Limited, High Wycombe, Buckingham-shire, UK) for storage until analysis within a month from thecollection date (Laughlin and Stevens, 2003). 5 mL of each samplewas analyzed on an automated gas chromatograph (Varian model3800, Varian Inc., Palo Alto, CA) equipped with an electron capturedetector and a flame ionization detector for N2O and CH4 analysis,respectively (Mosier et al., 2006).
Due to the dry soil conditions in 2012, baseline soil sampleswere not taken until after significant rainfall was received in July.Duplicate cores (3.5 cm core diameter) to 30 cm were sampled inCb plots, outside of the trace gas anchors, in late July 2012 for boththe C3 pasture and C4-dominated native rangeland plantcommunities. Soil cores were separated into increments accordingto GRACEnet protocol (0–5, 5–10, 10–20, 20–30 cm) (Liebig et al.,2010). Soils were air-dried and passed through a two mm sieve to
K.L. Nichols et al. / Agriculture, Ecosystems and Environment 225 (2016) 104–115 107
remove the roots and rocks �2 mm. Roots �2 mm were removedusing an electrostatic wand and remaining soils were analyzed fortotal soil C and N. Soil inorganic C (IC) concentrations weredetermined by acidifying soil with 1.0 N phosphoric acid andanalyzing the C content for acid-treated (SOC only) and non-acid-treated (SOC + IC) (Follett et al.,1997). Soil C and N content analyseswere conducted on the same instrument used for plant and fecesanalyses (see above). Soil bulk densities were determined by usingthe soil core method and a particle density of 2.65 g cm�3. Soiltextures were determined using the hydrometer method devel-oped by Bouyoucos (1962).
2.3. Statistical analysis
Because N2O and CH4 concentrations were typically low fromour field site, the linear equation method was used in calculatingfluxes to avoid over estimation. Parkin et al. (2012) found thatlinear regression had the lowest detection limit, and was leastsensitive to analytical precision and chamber deployment timewhen compared to the Hutchinson/Mosier, revised Hutchinson/Mosier, and quadratic methods (Hutchinson and Mosier, 1981).Treatment flux rates for each sampling occasion used the averageof four replicates. Flux estimates for non-sampling days were
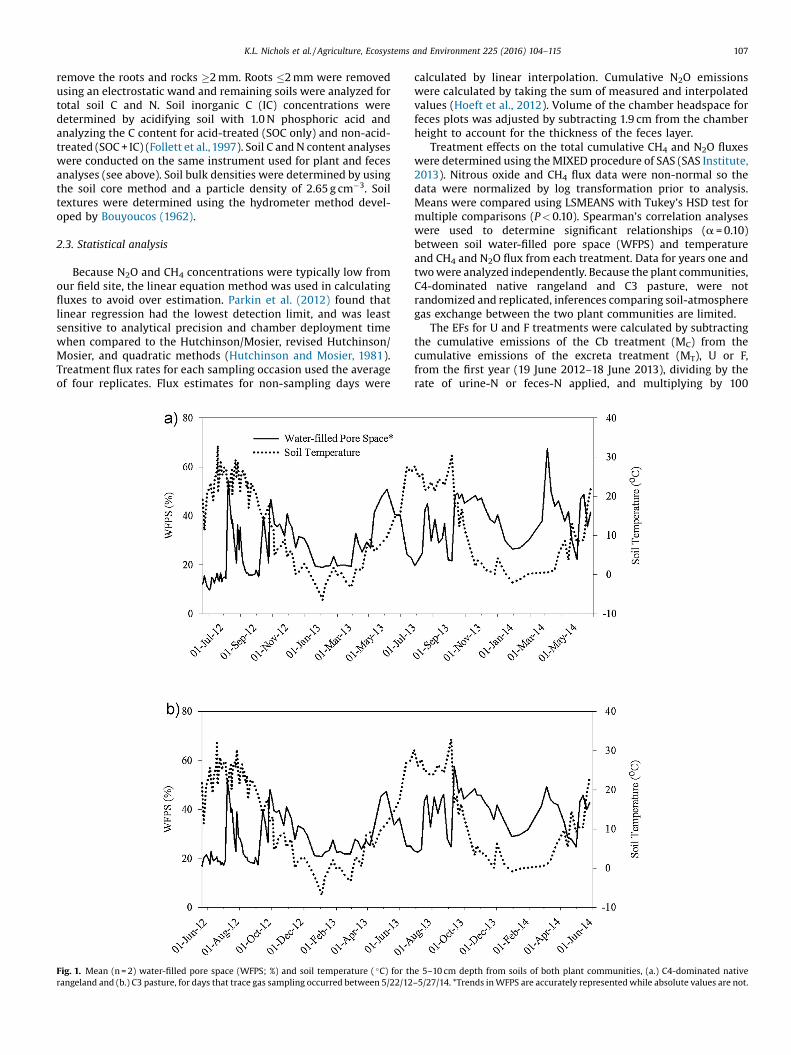
Fig. 1. Mean (n = 2) water-filled pore space (WFPS; %) and soil temperature ( �C) for thrangeland and (b.) C3 pasture, for days that trace gas sampling occurred between 5/22/12
calculated by linear interpolation. Cumulative N2O emissionswere calculated by taking the sum of measured and interpolatedvalues (Hoeft et al., 2012). Volume of the chamber headspace forfeces plots was adjusted by subtracting 1.9 cm from the chamberheight to account for the thickness of the feces layer.
Treatment effects on the total cumulative CH4 and N2O fluxeswere determined using the MIXED procedure of SAS (SAS Institute,2013). Nitrous oxide and CH4 flux data were non-normal so thedata were normalized by log transformation prior to analysis.Means were compared using LSMEANS with Tukey’s HSD test formultiple comparisons (P < 0.10). Spearman’s correlation analyseswere used to determine significant relationships (a = 0.10)between soil water-filled pore space (WFPS) and temperatureand CH4 and N2O flux from each treatment. Data for years one andtwo were analyzed independently. Because the plant communities,C4-dominated native rangeland and C3 pasture, were notrandomized and replicated, inferences comparing soil-atmospheregas exchange between the two plant communities are limited.
The EFs for U and F treatments were calculated by subtractingthe cumulative emissions of the Cb treatment (MC) from thecumulative emissions of the excreta treatment (MT), U or F,from the first year (19 June 2012–18 June 2013), dividing by therate of urine-N or feces-N applied, and multiplying by 100
e 5–10 cm depth from soils of both plant communities, (a.) C4-dominated native–5/27/14. *Trends in WFPS are accurately represented while absolute values are not.
108 K.L. Nichols et al. / Agriculture, Ecosystems and Environment 225 (2016) 104–115
(van der Weerden et al., 2011). The Eq. (1) follows:
EF %ð Þ ¼ MT � MC
TreatmentNApplied� 100 ð1Þ
3. Results
3.1. Environmental conditions
Drought conditions occurred at the onset of this experiment.The spring (April–June) of 2012 was the second driest in theprevious 74 years, receiving 27% (40 mm) of the seasonal average(146 mm). Total precipitation for 2012 (206 mm) was well below(60%) the 74 year annual average (340 mm) and was dominated bya few, large rain events in July and September. For example, 25%(51 mm) of the annual precipitation in 2012 occurred on July 7thand 8th. In addition, air temperatures were also high (>30 �C)during the early part of the experiment. Overall trends inprecipitation during 2013 and the first half of 2014 were closeto average, with the exception of a monsoonal rain event inSeptember 2013.
3.2. Plant and soil characteristics
Dry conditions during 2012 inhibited vegetative growth. TheC4-dominated native rangeland biomass production in 2012(358 kg d.m. ha�1) was approximately 39% of the 20 year (1992–2011) average 892 kg d.m. ha�1. Aboveground biomass samplingwas not conducted on the C3 pasture during 2012 due to the lack ofgrowth. Nitrogen concentrations of the aboveground vegetationfrom the U and F plots were 15% and 21% greater, respectively, thanin the control plots on C4-dominated native rangeland 29 July 2012(41 days after treatment application), while in spring 2013 (7 June2013; 354 days after treatment application) N concentrations ofthe aboveground vegetation from the same plots were 62% and 57%
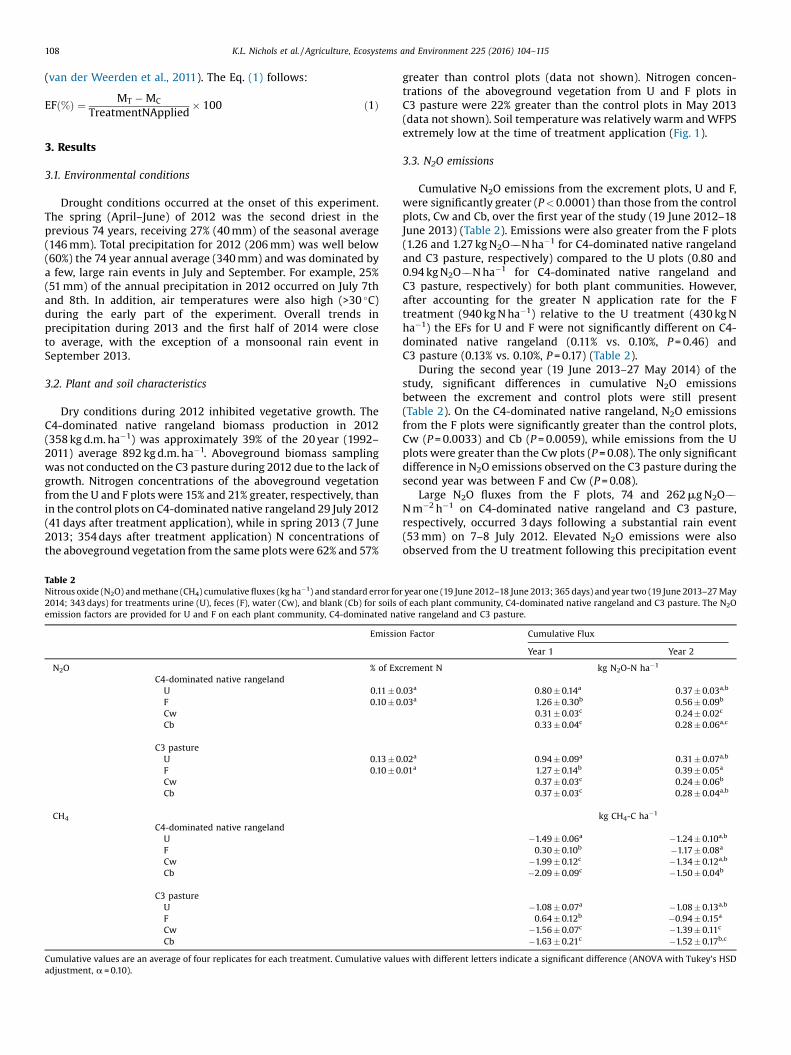
Table 2Nitrous oxide (N2O) and methane (CH4) cumulative fluxes (kg ha�1) and standard error fo2014; 343 days) for treatments urine (U), feces (F), water (Cw), and blank (Cb) for soils oemission factors are provided for U and F on each plant community, C4-dominated na
Emissio
N2O % of ExC4-dominated native rangeland
U 0.11 � 0F 0.10 � 0Cw
Cb
C3 pastureU 0.13 � 0F 0.10 � 0Cw
Cb
CH4
C4-dominated native rangelandU
F
Cw
Cb
C3 pastureU
F
Cw
Cb
Cumulative values are an average of four replicates for each treatment. Cumulative valuadjustment, a = 0.10).
greater than control plots (data not shown). Nitrogen concen-trations of the aboveground vegetation from U and F plots inC3 pasture were 22% greater than the control plots in May 2013(data not shown). Soil temperature was relatively warm and WFPSextremely low at the time of treatment application (Fig. 1).
3.3. N2O emissions
Cumulative N2O emissions from the excrement plots, U and F,were significantly greater (P < 0.0001) than those from the controlplots, Cw and Cb, over the first year of the study (19 June 2012–18June 2013) (Table 2). Emissions were also greater from the F plots(1.26 and 1.27 kg N2O��N ha�1 for C4-dominated native rangelandand C3 pasture, respectively) compared to the U plots (0.80 and0.94 kg N2O��N ha�1 for C4-dominated native rangeland andC3 pasture, respectively) for both plant communities. However,after accounting for the greater N application rate for the Ftreatment (940 kg N ha�1) relative to the U treatment (430 kg Nha�1) the EFs for U and F were not significantly different on C4-dominated native rangeland (0.11% vs. 0.10%, P = 0.46) andC3 pasture (0.13% vs. 0.10%, P = 0.17) (Table 2).
During the second year (19 June 2013–27 May 2014) of thestudy, significant differences in cumulative N2O emissionsbetween the excrement and control plots were still present(Table 2). On the C4-dominated native rangeland, N2O emissionsfrom the F plots were significantly greater than the control plots,Cw (P = 0.0033) and Cb (P = 0.0059), while emissions from the Uplots were greater than the Cw plots (P = 0.08). The only significantdifference in N2O emissions observed on the C3 pasture during thesecond year was between F and Cw (P = 0.08).
Large N2O fluxes from the F plots, 74 and 262 mg N2O��N m�2 h�1 on C4-dominated native rangeland and C3 pasture,respectively, occurred 3 days following a substantial rain event(53 mm) on 7–8 July 2012. Elevated N2O emissions were alsoobserved from the U treatment following this precipitation event
r year one (19 June 2012–18 June 2013; 365 days) and year two (19 June 2013–27 Mayf each plant community, C4-dominated native rangeland and C3 pasture. The N2Otive rangeland and C3 pasture.
n Factor Cumulative Flux
Year 1 Year 2
crement N kg N2O-N ha�1
.03a 0.80 � 0.14a 0.37 � 0.03a,b
.03a 1.26 � 0.30b 0.56 � 0.09b
0.31 � 0.03c 0.24 � 0.02c
0.33 � 0.04c 0.28 � 0.06a,c
.02a 0.94 � 0.09a 0.31 � 0.07a,b
.01a 1.27 � 0.14b 0.39 � 0.05a
0.37 � 0.03c 0.24 � 0.06b
0.37 � 0.03c 0.28 � 0.04a,b
kg CH4-C ha�1
�1.49 � 0.06a �1.24 � 0.10a,b
0.30 � 0.10b �1.17 � 0.08a
�1.99 � 0.12c �1.34 � 0.12a,b
�2.09 � 0.09c �1.50 � 0.04b
�1.08 � 0.07a �1.08 � 0.13a,b
0.64 � 0.12b �0.94 � 0.15a
�1.56 � 0.07c �1.39 � 0.11c
�1.63 � 0.21c �1.52 � 0.17b,c
es with different letters indicate a significant difference (ANOVA with Tukey’s HSD

Fig. 2. Average nitrous oxide (N2O; mg N2O��N m�2 h�1) fluxes � standard errors (n = 4) for each treatment, urine (U), feces (F), and control blank (Cb) from (a.) C4-dominatednative rangeland and (b.) C3 pasture soils and precipitation (mm) from 22 May 2012–21 May 2013. The arrow in the diagram indicates when the treatments were applied.
K.L. Nichols et al. / Agriculture, Ecosystems and Environment 225 (2016) 104–115 109
for the C4-dominated native rangeland (35 mg N2O��N m�2 h�1)and C3 pasture (49 mg N2O��N m�2 h�1) communities, but theresponse was delayed 10 days, July 18 (Fig. 2). Nitrous oxideemissions from excrement plots remained above baseline levelsuntil the end of July 2012, when the soil WFPS dropped below 30%.Substantial N2O emissions were observed consistently fromexcrement plots following large precipitation events (>10 mm)until the fall of 2013, about 15 months post application (Figs. 2 and3). By the spring of 2014, N2O fluxes from the excrement patcheswere similar to the control plots except for two instances on theC4-dominated native rangeland (Fig. 3).
Soil WFPS and temperature were significant drivers of N2Oemissions from the excrement plots. Positive correlations betweenWFPS and N2O flux from the U and F plots were highly significant(P < 0.0001) for soils of both C4-dominated native rangeland andC3 pasture during the first year of the study (19 June 2012–18 June2013). During the second year of the study, lower positivecorrelations were observed between WFPS and N2O flux for theexcrement plots, all of which were significant except the U plots onthe C3 pasture (Table 3). The majority of N2O emissions occurredwhen WFPS was between 25 and 55% (data not shown).Correlations between soil temperature and N2O flux were negativefor all treatments during the first year of the study, with theexception of the F treatment on the C3 pasture. In the second year,significant positive correlations between soil temperature and N2O
flux were observed from the F plots on both plant communities andthe U plots on C3 pasture (Table 3).
3.4. CH4 Uptake/Emissions
Cumulative CH4 net production (kg CH4��C ha�1) was observedfrom the F plots on both plant communities over the first year (19June 2012–18 June 2013), while all other treatment plots (U, Cw,and Cb) exhibited a net uptake of CH4. However, during this periodCH4 uptake was significantly less (P < 0.10) from the U plotscompared to the control plots, Cw and Cb, on both plantcommunities (Table 2). Over the second year (19 June 2013–27 May 2014) of the study, cumulative CH4 net uptake occurredfrom all treatment plots, but was significantly less (P < 0.10) fromthe F compared to the control plots, with the exception of C4-dominated native rangeland � Cw (C3 pasture � Cw P = 0.02,C3 pasture � Cb P = 0.07, C4-dominated native rangeland � CwP = 0.22, and C4-dominated native rangeland � Cb P = 0.06). Inaddition, CH4 uptake from U plots was significantly less (P < 0.10)than that of the Cw plots (P = 0.08) on the C3 pasture (Table 2).
Methane production from the F treatment was observed forapproximately six days following treatment application (Fig. 4).Cumulative CH4 emissions from F plots during this period (19 June2012–24 June 2012) were 1.58 and 1.52 kg CH4��C ha�1 on C4-dominated native rangeland and C3 pasture, respectively.

Fig. 3. Average nitrous oxide (N2O; mg N2O��N m�2 h�1) fluxes � standard errors (n = 4) for each treatment, urine (U), feces (F), and control blank (Cb) from (a.) C4-dominatednative rangeland and (b.) C3 pasture soils and precipitation (mm) from 31 May 2013–27 May 2014.
110 K.L. Nichols et al. / Agriculture, Ecosystems and Environment 225 (2016) 104–115
Maximum CH4 emissions were observed four and eight hoursfollowing treatment application for C3 pasture and C4-dominatednative rangeland, respectively. Approximately a week aftertreatment application, net CH4 uptake resumed from the F plots(with the exceptions of 18 and 25 July 2012 on both plantcommunities), but at a significantly lesser rate than the other
Table 3Spearman’s correlation coefficients (r) with p-values for the relationship between soil waturine (U), feces (F), water (Cw), and blank (Cb), and year (Year 1, 19 June 2012–18 June 20pasture.
Plant Community/Treatment WFPS (%)
r (p-value)
Year 1 Ye
C4-dominated Native RangelandU 0.43 (<0.0001)* 0.3F 0.65 (<0.0001)* 0.2Cw 0.028 (0.7) 0.0Cb 0.017 (0.8) �0
C3 PastureU 0.57 (<0.0001)* 0.1F 0.64 (<0.0001)* 0.3Cw 0.11 (0.18) 0.3Cb 0.23 (0.006)* �0
* Indicates a significant difference (a = 0.10).
treatments. Methane uptake rates were still significantly less fromthe F plots compared to the Cb plots during the second year of thestudy (Fig. 5). During the entire study, net CH4 production from Uplots occurred only once on each system (0.47 � 1.28 on 15 August2012 for C4-dominated native rangeland and 0.97 � 3.33 mgCH4��C m�2 h�1 on 4 January 2013 for C3 pasture) (Fig. 4).
er-filled pore space (WFPS) and soil temperature ( �C) to N2O flux for each treatment,13; Year 2, 19 June 2013–27 May 2014) from C4-dominated native rangeland and C3
Soil Temperature (�C)
ar 2 Year 1 Year 2
1 (0.006)* �0.23 (0.008)* 0.11 (0.33)5 (0.03)* �0.023 (0.79) 0.24 (0.04)*
22 (0.87) �0.29 (0.0005)* 0.35 (0.008)*
.17 (0.16) �0.16 (0.05)* 0.12 (0.3)
4 (0.2) �0.009 (0.9) 0.20 (0.07)*
1 (0.005)* 0.22 (0.009)* 0.35 (0.001)*
0 (0.007)* �0.19 (0.02)* �0.27 (0.02)*
.00903 (0.9) �0.25 (0.003)* 0.10 (0.4)
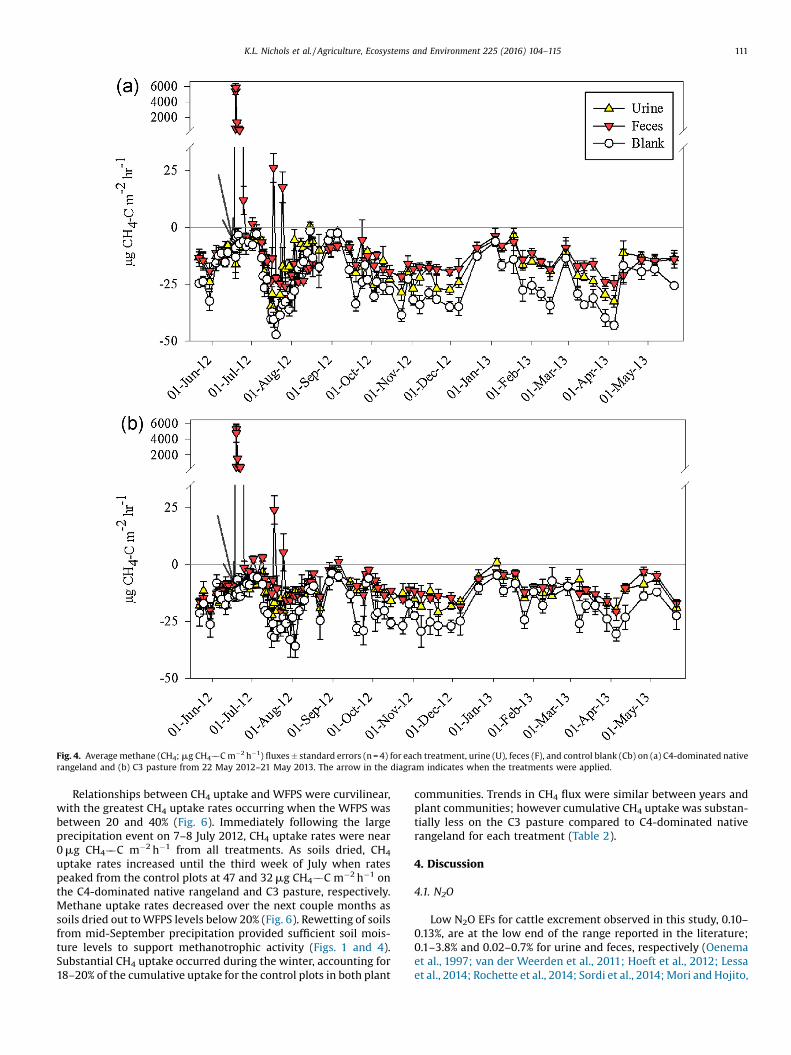
Fig. 4. Average methane (CH4; mg CH4��C m�2 h�1) fluxes � standard errors (n = 4) for each treatment, urine (U), feces (F), and control blank (Cb) on (a) C4-dominated nativerangeland and (b) C3 pasture from 22 May 2012–21 May 2013. The arrow in the diagram indicates when the treatments were applied.
K.L. Nichols et al. / Agriculture, Ecosystems and Environment 225 (2016) 104–115 111
Relationships between CH4 uptake and WFPS were curvilinear,with the greatest CH4 uptake rates occurring when the WFPS wasbetween 20 and 40% (Fig. 6). Immediately following the largeprecipitation event on 7–8 July 2012, CH4 uptake rates were near0 mg CH4��C m�2 h�1 from all treatments. As soils dried, CH4
uptake rates increased until the third week of July when ratespeaked from the control plots at 47 and 32 mg CH4��C m�2 h�1 onthe C4-dominated native rangeland and C3 pasture, respectively.Methane uptake rates decreased over the next couple months assoils dried out to WFPS levels below 20% (Fig. 6). Rewetting of soilsfrom mid-September precipitation provided sufficient soil mois-ture levels to support methanotrophic activity (Figs. 1 and 4).Substantial CH4 uptake occurred during the winter, accounting for18–20% of the cumulative uptake for the control plots in both plant
communities. Trends in CH4 flux were similar between years andplant communities; however cumulative CH4 uptake was substan-tially less on the C3 pasture compared to C4-dominated nativerangeland for each treatment (Table 2).
4. Discussion
4.1. N2O
Low N2O EFs for cattle excrement observed in this study, 0.10–0.13%, are at the low end of the range reported in the literature;0.1–3.8% and 0.02–0.7% for urine and feces, respectively (Oenemaet al., 1997; van der Weerden et al., 2011; Hoeft et al., 2012; Lessaet al., 2014; Rochette et al., 2014; Sordi et al., 2014; Mori and Hojito,
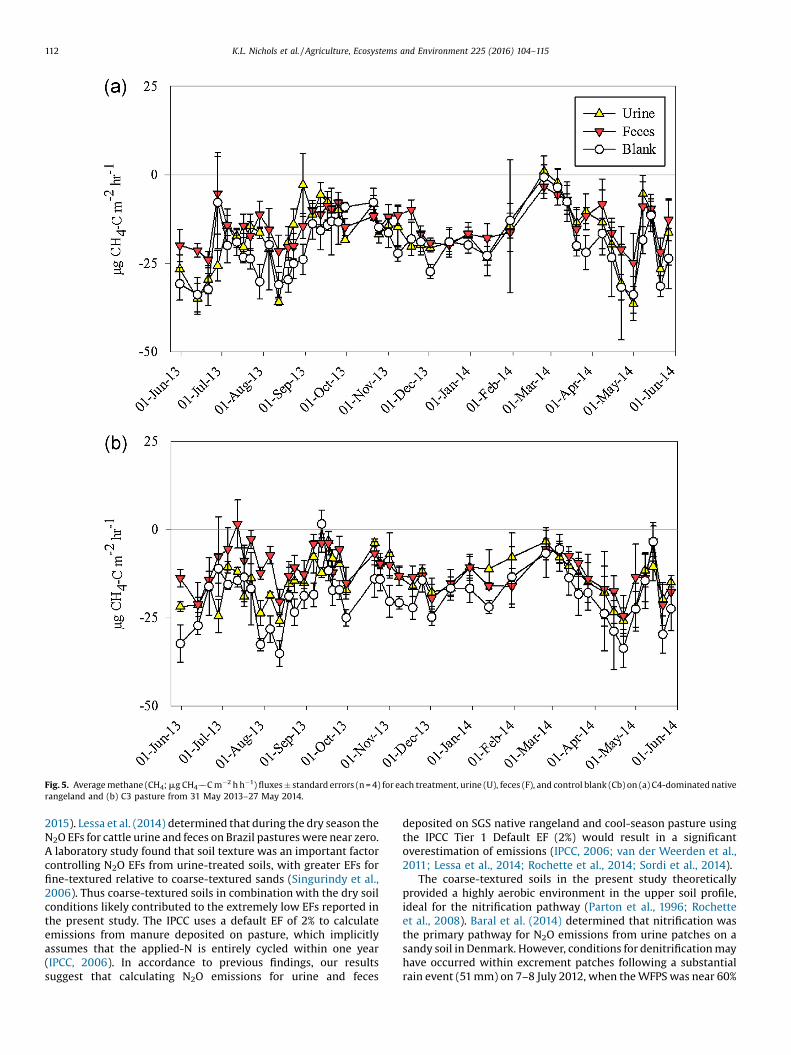
Fig. 5. Average methane (CH4; mg CH4��C m�2 h h�1) fluxes � standard errors (n = 4) for each treatment, urine (U), feces (F), and control blank (Cb) on (a) C4-dominated nativerangeland and (b) C3 pasture from 31 May 2013–27 May 2014.
112 K.L. Nichols et al. / Agriculture, Ecosystems and Environment 225 (2016) 104–115
2015). Lessa et al. (2014) determined that during the dry season theN2O EFs for cattle urine and feces on Brazil pastures were near zero.A laboratory study found that soil texture was an important factorcontrolling N2O EFs from urine-treated soils, with greater EFs forfine-textured relative to coarse-textured sands (Singurindy et al.,2006). Thus coarse-textured soils in combination with the dry soilconditions likely contributed to the extremely low EFs reported inthe present study. The IPCC uses a default EF of 2% to calculateemissions from manure deposited on pasture, which implicitlyassumes that the applied-N is entirely cycled within one year(IPCC, 2006). In accordance to previous findings, our resultssuggest that calculating N2O emissions for urine and feces
deposited on SGS native rangeland and cool-season pasture usingthe IPCC Tier 1 Default EF (2%) would result in a significantoverestimation of emissions (IPCC, 2006; van der Weerden et al.,2011; Lessa et al., 2014; Rochette et al., 2014; Sordi et al., 2014).
The coarse-textured soils in the present study theoreticallyprovided a highly aerobic environment in the upper soil profile,ideal for the nitrification pathway (Parton et al., 1996; Rochetteet al., 2008). Baral et al. (2014) determined that nitrification wasthe primary pathway for N2O emissions from urine patches on asandy soil in Denmark. However, conditions for denitrification mayhave occurred within excrement patches following a substantialrain event (51 mm) on 7–8 July 2012, when the WFPS was near 60%
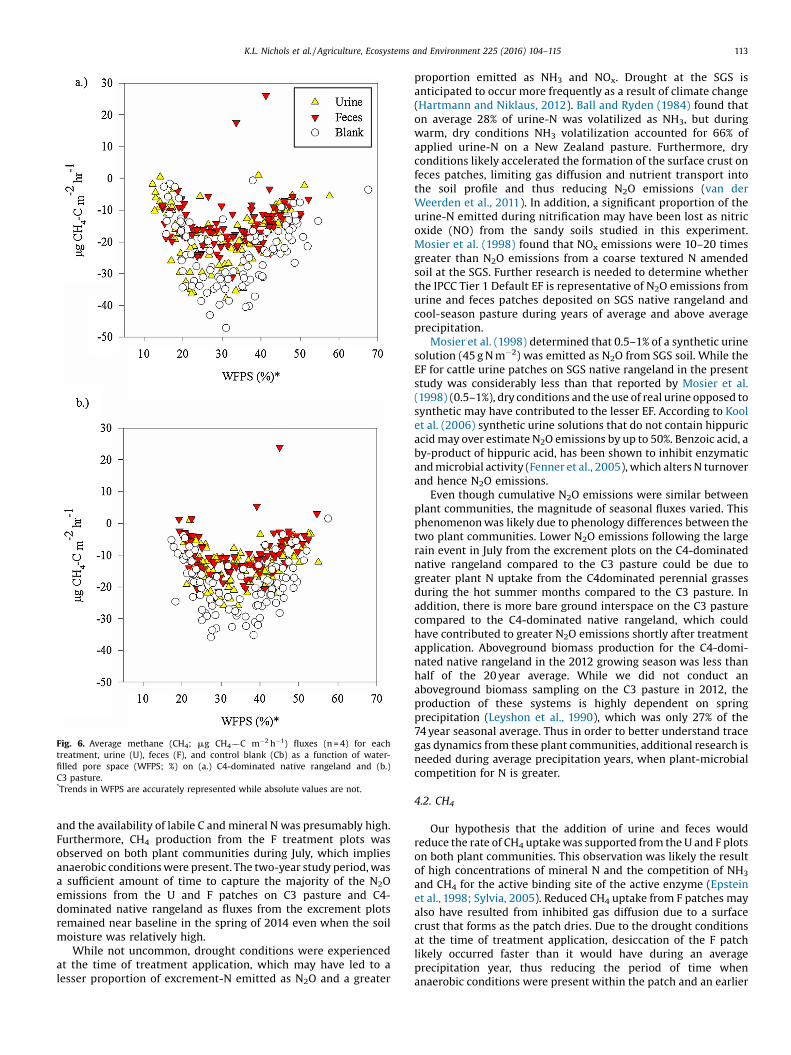
Fig. 6. Average methane (CH4; mg CH4��C m�2 h�1) fluxes (n = 4) for eachtreatment, urine (U), feces (F), and control blank (Cb) as a function of water-filled pore space (WFPS; %) on (a.) C4-dominated native rangeland and (b.)C3 pasture.*Trends in WFPS are accurately represented while absolute values are not.
K.L. Nichols et al. / Agriculture, Ecosystems and Environment 225 (2016) 104–115 113
and the availability of labile C and mineral N was presumably high.Furthermore, CH4 production from the F treatment plots wasobserved on both plant communities during July, which impliesanaerobic conditions were present. The two-year study period, wasa sufficient amount of time to capture the majority of the N2Oemissions from the U and F patches on C3 pasture and C4-dominated native rangeland as fluxes from the excrement plotsremained near baseline in the spring of 2014 even when the soilmoisture was relatively high.
While not uncommon, drought conditions were experiencedat the time of treatment application, which may have led to alesser proportion of excrement-N emitted as N2O and a greater
proportion emitted as NH3 and NOx. Drought at the SGS isanticipated to occur more frequently as a result of climate change(Hartmann and Niklaus, 2012). Ball and Ryden (1984) found thaton average 28% of urine-N was volatilized as NH3, but duringwarm, dry conditions NH3 volatilization accounted for 66% ofapplied urine-N on a New Zealand pasture. Furthermore, dryconditions likely accelerated the formation of the surface crust onfeces patches, limiting gas diffusion and nutrient transport intothe soil profile and thus reducing N2O emissions (van derWeerden et al., 2011). In addition, a significant proportion of theurine-N emitted during nitrification may have been lost as nitricoxide (NO) from the sandy soils studied in this experiment.Mosier et al. (1998) found that NOx emissions were 10–20 timesgreater than N2O emissions from a coarse textured N amendedsoil at the SGS. Further research is needed to determine whetherthe IPCC Tier 1 Default EF is representative of N2O emissions fromurine and feces patches deposited on SGS native rangeland andcool-season pasture during years of average and above averageprecipitation.
Mosier et al. (1998) determined that 0.5–1% of a synthetic urinesolution (45 g N m�2) was emitted as N2O from SGS soil. While theEF for cattle urine patches on SGS native rangeland in the presentstudy was considerably less than that reported by Mosier et al.(1998) (0.5–1%), dry conditions and the use of real urine opposed tosynthetic may have contributed to the lesser EF. According to Koolet al. (2006) synthetic urine solutions that do not contain hippuricacid may over estimate N2O emissions by up to 50%. Benzoic acid, aby-product of hippuric acid, has been shown to inhibit enzymaticand microbial activity (Fenner et al., 2005), which alters N turnoverand hence N2O emissions.
Even though cumulative N2O emissions were similar betweenplant communities, the magnitude of seasonal fluxes varied. Thisphenomenon was likely due to phenology differences between thetwo plant communities. Lower N2O emissions following the largerain event in July from the excrement plots on the C4-dominatednative rangeland compared to the C3 pasture could be due togreater plant N uptake from the C4dominated perennial grassesduring the hot summer months compared to the C3 pasture. Inaddition, there is more bare ground interspace on the C3 pasturecompared to the C4-dominated native rangeland, which couldhave contributed to greater N2O emissions shortly after treatmentapplication. Aboveground biomass production for the C4-domi-nated native rangeland in the 2012 growing season was less thanhalf of the 20 year average. While we did not conduct anaboveground biomass sampling on the C3 pasture in 2012, theproduction of these systems is highly dependent on springprecipitation (Leyshon et al., 1990), which was only 27% of the74 year seasonal average. Thus in order to better understand tracegas dynamics from these plant communities, additional research isneeded during average precipitation years, when plant-microbialcompetition for N is greater.
4.2. CH4
Our hypothesis that the addition of urine and feces wouldreduce the rate of CH4 uptake was supported from the U and F plotson both plant communities. This observation was likely the resultof high concentrations of mineral N and the competition of NH3
and CH4 for the active binding site of the active enzyme (Epsteinet al., 1998; Sylvia, 2005). Reduced CH4 uptake from F patches mayalso have resulted from inhibited gas diffusion due to a surfacecrust that forms as the patch dries. Due to the drought conditionsat the time of treatment application, desiccation of the F patchlikely occurred faster than it would have during an averageprecipitation year, thus reducing the period of time whenanaerobic conditions were present within the patch and an earlier
114 K.L. Nichols et al. / Agriculture, Ecosystems and Environment 225 (2016) 104–115
onset of the surface crust resulting in less CH4 production (Yamulkiet al., 1999). Cumulative CH4 uptake was less for all treatments onthe C3 pasture compared to the C4-dominated native rangelandduring the first year of the study, while CH4 uptake between plantcommunities was similar during the second year of the study. Thisphenomenon may have been due to greater sand content in the soilsurface layer on the C3 pasture relative to C4-dominated nativerangeland, leading to greater evaporation rates at the soil surfaceexacerbating biological limitation on CH4 uptake during dryconditions (Table 1) (Mosier et al., 1997).
Methane production from the F plots initially followingtreatment application was likely due to a large microbialpopulation, high concentration of C, and high water content ofthe added feces (75% water content). Yamulki et al. (1999) found80% of CH4 production occurred within the first week of feces patchestablishment and CH4 uptake rates from fecal patches returned tobaseline levels 15 days after treatment application on a perennialryegrass pasture. In contrast, significant differences in CH4 uptakebetween feces and control plots were still observed during thesecond year of the present study. Thus, a study period greater thantwo years is needed in order to determine the cumulative effects ofexcrement patches on CH4 uptake on C3 pasture and C4-dominated native rangeland.
The isolated CH4 production events on 18 and 25 July 2012 wereaccompanied by warm, moist soil conditions increasing thelikelihood of soil anaerobic microsites. In addition, noticeabledung beetle activity was documented on F plots during the firsthalf of July, which could have affected the CH4 flux dynamics. Dungbeetle activity can reduce the rate of CH4 production and increaseN2O emissions through the aeration of fecal patches (Penttila et al.,2013). Additional research is needed to better understand theinfluence that dung beetles have on GHG emissions under variousenvironmental and fecal patch conditions.
The highest rates of CH4 uptake for all the treatments occurredwhen WFPS was between 23 and 35% and 25–40% on C4-dominated native rangeland and C3 pasture, respectively. Theseresults do not correspond to earlier findings of Mosier et al. (1996)and Chen et al. (2010) who found that maximum CH4 uptake ratesoccurred with 13–23% WFPS levels. Differences in soil moisturesampling methodologies are likely responsible for this discrepan-cy. In the present study WFPS was calculated using soil volumetricwater content values from time-domain reflectrometry (TDR)probes for the 5–10 cm depth, Mosier et al. (1996) conductedgravimetric analysis of soil water content for the 0–15 cm depth,and Chen et al. (2010) used TDR probes for the 0–6 cm depth. Wefound that the TDR probes used in the present study accuratelycaptured trends in soil moisture, but overestimated absolutevalues.
5. Conclusion
Our results show that various land management and environ-mental factors interact to control N2O and CH4 fluxes. This suggeststhat models need to account for the legacy effects of disturbance,plant growth patterns, moisture, temperature, and heterogeneityof C and N resources across the landscape to accurately predictGHG fluxes. The potential to mitigate GHG emissions is limited asmanagement options for semi-arid rangeland primarily consist ofmodifying the stocking rate and the duration of the grazing season(Liebig et al., 2005). Future trace gas research on semi-aridgrasslands should focus on pasture areas where cattle tend tocongregate, such as pasture corners and areas near water tanks.These highly disturbed areas sustain high rates of C and Ndeposition (Augustine et al., 2013), soil compaction, and reducedvegetative cover, which may lead to greater N2O emissions andreduced CH4 uptake.
Acknowledgements
The authors would like to thank Mary Ashby, Amber Brandt,Robert D’Adamo, Chelsea Carson, Travis Delorean, Bradley Floyd,Philip Korejwo, Ryan Mathe, Matthew Mortenson, ElizabethPruessner, Melissa Reyes-Fox, Colin Pinney, Mary Smith, JeffThomas, Vitor Vargas, and Jordan Wieger for their technicalassistance. The present project is part of GRACEnet (GreenhouseGas Reduction through Agricultural Carbon Enhancement Net-work), a cross-location research effort that seeks to provideinformation on global warming potential of current agriculturalpractices and develop new management practices to reducegreenhouse gas emissions from soil.
The U.S. Department of Agriculture, Agricultural ResearchService is an equal opportunity/affirmative action employer andall agency services are available without discrimination. Mentionof commercial products and organizations in this manuscript issolely to provide specific information. It does not constituteendorsement by USDA-ARS over other products and organizationsnot mentioned.
References
Augustine, D.J., Milchunas, D.G., Derner, J.D., 2013. Spatial redistribution of nitrogenby cattle in semiarid rangeland. Rangel. Ecol. Manag. 66, 56–62.
Ball, P.R., Ryden, J.C., 1984. Nitrogen relationships in intensively managed temperategrasslands. Plant Soil 76, 23–33.
Baral, K.R., Thomsen, A.G., Olesen, J.E., Petersen, S.O., 2014. Controls of nitrous oxideemission after simulated cattle urine deposition. Agric. Ecosyst. Environ. 188,103–110.
Bouyoucos, G.J., 1962. Hydrometer method improved for making particle sizeanalyses of soils. Agron. J. 54, 464.
Chen, W.W., Wolf, B., Yao, Z.S., Bruggemann, N., Butterbach-Bahl, K., Liu, C.Y., Han, S.H., Han, X.G., Zheng, X.H., 2010. Annual methane uptake by typical semiaridsteppe in Inner Mongolia. J. Geophys. Res. Atmos. 115.
Derner, J.D., Hart, R.H., 2010. Livestock responses to complementary forages inshortgrass steppe. Great Plains Res. 20, 223–228.
Epstein, H.E., Burke, I.C., Mosier, A.R., Hutchinson, G.L., 1998. Plant functional typeeffects on trace gas fluxes in the shortgrass steppe. Biogeochemistry 42, 145–168.
Fenner, N., Freeman, C., Reynolds, B., 2005. Hydrological effects on the diversity ofphenolic degrading bacteria in a peatland: implications for carbon cycling. SoilBiol. Biochem. 37, 1277–1287.
Follett, R.F., Paul, E.A., Leavitt, S.W., Halvorson, A.D., Lyon, D., Peterson, G.A., 1997.Carbon isotope ratios of Great Plains soils and in wheat-fallow systems. Soil Sci.Soc. Am. J. 61, 1068–1077.
Follett, R.F., 2008. Transformation and transport processes of nitrogen inagricultural systems. In: Hatfield, J.L., Follett, R.F. (Eds.), Nitrogen in theEnvironment: Sources, Problems, and Management. Elsevier Inc., New York.
Hartmann, A.A., Niklaus, P.A., 2012. Effects of simulated drought and nitrogenfertilizer on plant productivity and nitrous oxide (N2O) emissions of twopastures. Plant Soil 361, 411–426.
Hoeft, I., Steude, K., Wrage, N., Veldkamp, E., 2012. Response of nitrogen oxideemissions to grazer species and plant species composition in temperateagricultural grassland. Agric. Ecosyst. Environ. 151, 34–43.
Holst, J., Liu, C., Yao, Z., Brueggemann, N., Zheng, X., Giese, M., Butterbach-Bahl, K.,2008. Fluxes of nitrous oxide, methane and carbon dioxide during freezing-thawing cycles in an Inner Mongolian steppe. Plant Soil 308, 105–117.
Hutchinson, G.L., Mosier, A.R., 1981. Improved soil cover method for fieldmeasurement of nitrous-oxide fluxes. Soil Sci. Soc. Am. J. 45, 311–316.
IPCC, 2006. 2006 IPCC guideline for national greenhouse gas inventories. In:Eggleston, S., Buendia, L., Miwa, K., Ngara, T., Tanabe, K. (Eds.),Intergovernmental Panel on Climate Change (IPCC) (2006). Inst. for GlobalEnviron. Strategies, Hayama, Japan.
Institute, S.A.S., 2013. The SAS System for Windows. SAS Institute, Cary, NC.Kool, D.M., Hoffland, E., Abrahamse, S.P.A., van Groenigen, J.W., 2006. What artificial
urine composition is adequate for simulating soil N2O fluxes and mineral Ndynamics? Soil Biol. Biochem. 38, 1757–1763.
Koponen, H.T., Martikainen, P.J., 2004. Soil water content and freezing temperatureaffect freeze-thaw related N2O production in organic soil. Nutr. Cycl.Agroecosyst. 69, 213–219.
Lauenroth, W.K., Burke, I.C., Morgan, J.A., 2008. The shortgrass steppe: the regionand research sites. In: Lauenroth, W.K., Burke, I.C. (Eds.), Ecology of theShortgrass Steppe: A Long-term Perspective. Oxford University Press, New York,pp. 3–13.
Laughlin, R.J., Stevens, R.J., 2003. Changes in composition of nitrogen-15-labeledgases during storage in septum-capped vials. Soil Sci. Soc. Am. J. 67, 540–543.
Lessa, A.C.R., Madari, B.E., Paredes, D.S., Boddey, R.M., Urquiaga, S., Jantalia, C.P.,Alves, B.J.R., 2014. Bovine urine and dung deposited on brazilian savannah

K.L. Nichols et al. / Agriculture, Ecosystems and Environment 225 (2016) 104–115 115
pastures contribute differently to direct and indirect soil nitrous oxideemissions. Agric. Ecosyst. Environ. 190, 104–111.
Leyshon, A.J., Cutforth, H., Waddington, J., Rymes, P.C., 1990. Effect of row spacing onbiomass production and aboveground harvestability of russian wildrye. Can. J.Plant Sci. 70, 555–558.
Liebig, M.A., Morgan, J.A., Reeder, J.D., Ellert, B.H., Gollany, H.T., Schuman, G.E., 2005.Greenhouse gas contributions and mitigation potential of agricultural practicesin northwestern USA and western canada. Soil Tillage Res. 83, 25–52.
Liebig, M., Varvel, G., Honeycutt, W., 2010. USDA-ARS GRACEnet Project Protocols.Chapter 1. Guidelines for Soil Description and Soil Sampling, Processing,Analysis, and Archiving. Available at http://www.ars.usda.gov/SP2UserFiles/Program/212/Chapter%201.%20GRACEnet%20Soil%20Sampling%20Protocols.pdf.
Maljanen, M., Martikkala, M., Koponen, H.T., Virkajarvi, P., Martikainen, P.J., 2007.Fluxes of nitrous oxide and nitric oxide from experimental excreta patches inboreal agricultural soil. Soil Biol. Biochem. 39, 914–920.
Milchunas, D.G., Parton, W.J., Bigelow, D.S., Schimel, D.S., 1988. Factors influencingammonia volatilization from urea in soils of the shortgrass steppe. J. Atmos.Chem. 6, 323–340.
Mori, A., Hojito, M., 2015. Methane and nitrous oxide emissions due to excretareturns from grazing cattle in nasu japan. Grassl. Sci. 61, 109–120.
Mosier, A.R., Stillwell, M., Parton, W.J., Woodmansee, R.G., 1981. Nitrous-oxideemissions from a native shortgrass prairie. Soil Sci. Soc. Am. J. 45, 617–619.
Mosier, A.R., Parton, W.J., Valentine, D.W., Ojima, D.S., Schimel, D.S., Delgado, J.A.,1996. CH4 and N2O fluxes in the Colorado shortgrass steppe. 1. Impact oflandscape and nitrogen addition. Glob. Biogeochem. Cycle 10, 387–399.
Mosier, A.R., Parton, W.J., Valentine, D.W., Ojima, D.S., Schimel, D.S., Heinemeyer, O.,1997. CH4 and N2O fluxes in the Colorado shortgrass steppe. 2. Long-termimpact of land use change. Glob. Biogeochem. Cycle 11, 29–42.
Mosier, A.R., Parton, W.J., Phongpan, S., 1998. Long-term large N and immediatesmall N addition effects on trace gas fluxes in the Colorado shortgrass steppe.Biol. Fertil. Soils 28, 44–50.
Mosier, A.R., Halvorson, A.D., Reule, C.A., Liu, X.J.J., 2006. Net global warmingpotential and greenhouse gas intensity in irrigated cropping systems innortheastern Colorado. J. Environ. Qual. 35, 1584–1598.
Oenema, O., Velthof, G.L., Yamulki, S., Jarvis, S.C., 1997. Nitrous oxide emissions fromgrazed grassland. Soil Use Manage. 13, 288–295.
Parkin, T.B., Venterea, R.T., Hargreaves, S.K., 2012. Calculating the detection limits ofchamber-based soil greenhouse gas flux measurements. J. Environ. Qual. 41,705–715.
Parton, W.J., Mosier, A.R., Ojima, D.S., Valentine, D.W., Schimel, D.S., Weier, K.,Kulmala, A.E., 1996. Generalized model for N-2 and N2O production fromnitrification and denitrification. Glob. Biogeochem. Cycle 10, 401–412.
Penttila, A., Slade, E.M., Simojoki, A., Riutta, T., Minkkinen, K., Roslin, T., 2013.Quantifying beetle-mediated effects on gas fluxes from dung pats. PLoS One 8.
Rochette, P., Angers, D.A., Chantigny, M.H., Gagnon, B., Bertrand, N., 2008. N2O fluxesin soils of contrasting textures fertilized with liquid and solid dairy cattlemanures. Can. J. Soil Sci 88, 175–187.
Rochette, P., Chantigny, M.H., Ziadi, N., Angers, D.A., Belanger, G., Charbonneau, E.,Pellerin, D., Liang, C., Bertrand, N., 2014. Soil nitrous oxide emissions afterdeposition of dairy cow excreta in eastern Canada. J. Environ. Qual 43, 829–841.
Schimel, D.S., Parton, W.J., Adamsen, F.J., Woodmansee, R.G., Senft, R.L., Stillwell, M.A., 1986. The role of cattle in the volatile loss of nitrogen from a shortgrasssteppe. Biogeochemistry 2, 39–52.
Singurindy, O., Richards, B.K., Molodovskaya, M., Steenhuis, T.S., 2006. Nitrous oxideand ammonia emissions from urine-treated soils. Texture effect. Vadose Zone J.5, 1236–1245.
Sordi, A., Dieckow, J., Bayer, C., Alburquerque, M.A., Piva, J.T., Zanatta, J.A., Tomazi, M.,da Rosa, C.M., de Moraes, A., 2014. Nitrous oxide emission factors for urine anddung patches in a subtropical brazilian pastureland. Agric. Ecosyst. Environ.190,94–103.
Principles and Applications of Soil Microbiology. In: Sylvia, D.M. (Ed.), PearsonPrentice Hall.
Topp, G.C., Davis, J.L., Annan, A.P.,1980. Electromagnetic determination of soil-watercontent—measurements in coaxial transmission-lines. Water Resour. Res. 16,574–582.
Wachendorf, C., Taube, F., Wachendorf, M., 2005. Nitrogen leaching from N-15 labelled cow urine and dung applied to grassland on a sandy soil. Nutr. Cycl.Agroecosyst. 73, 89–100.
Wachendorf, C., Lampe, C., Taube, F., Dittert, K., 2008. Nitrous oxide emissions anddynamics of soil nitrogen under N-15-labeled cow urine and dung patches on asandy grassland soil. J. Plant Nutr. Soil Sci.-Z. Pflanzenernahr. Bodenkd 171, 171–180.
Williams, D.L., Ineson, P., Coward, P.A., 1999. Temporal variations in nitrous oxidefluxes from urine-affected grassland. Soil Biol. Biochem. 31, 779–788.
Wu, H., Dannenmann, M., Wolf, B., Han, X.G., Zheng, X., Butterbach-Bahl, K., 2012.Seasonality of soil microbial nitrogen turnover in continental steppe soils ofInner Mongolia. Ecosphere 3.
Yamulki, S., Jarvis, S.C., Owen, P., 1998. Nitrous oxide emissions from excreta appliedin a simulated grazing pattern. Soil Biol. Biochem. 30, 491–500.
Yamulki, S., Jarvis, S.C., Owen, P., 1999. Methane emission and uptake from soils asinfluenced by excreta deposition from grazing animals. J. Environ. Qual. 28, 676–682.
Yao, Z.S., Wu, X., Wolf, B., Dannenmann, M., Butterbach-Bahl, K., Brueggemann, N.,Chen, W.W., Zheng, X.H., 2010. Soil-atmosphere exchange potential of NO and N(2)O in different land use types of Inner Mongolia as affected by soiltemperature, soil moisture, freeze-thaw, and drying-wetting events. J. Geophys.Res. Atmos. 115.
de Klein, C.A.M., Barton, L., Sherlock, R.R., Li, Z., Littlejohn, R.P., 2003. Estimating anitrous oxide emission factor for animal urine from some New Zealand pastoralsoils. Aust. J. Soil Res. 41, 381–399.
van der Weerden, T.J., Luo, J.F., de Klein, C.A.M., Hoogendoorn, C.J., Littlejohn, R.P.,Rys, G.J., 2011. Disaggregating nitrous oxide emission factors for ruminant urineand dung deposited onto pastoral soils. Agric. Ecosyst. Environ. 141, 426–436.
van der Weerden, T.J., Clough, T.J., Styles, T.M., 2013. Using near-continuousmeasurements of N2O emission from urine-affected soil to guide manual gassampling regimes. N. Z. J. Agric. Res. 56, 60–76.