agriculture 3.0: from consolidation to convergence 01, 2013 · my five topics today 1. ag 3.0...
TRANSCRIPT

Agriculture 3.0: From Consolidation to Convergence
Dr. Jim Budzynski, Managing Partner MacroGain Partners
www.macrogain.com
2014 FarmSmart Agricultural Conference University of Guelph
January 18th, 2014
Caveat Emptor
My goal is to stimulate thought about the future, not accurately predict it!

My Five Topics Today
1. Ag 3.0 Paradigm
2. Macro Ag Economy
3. Technology Evolution and Industry Structure
4. Changing Production Economics
5. Investing in Ag
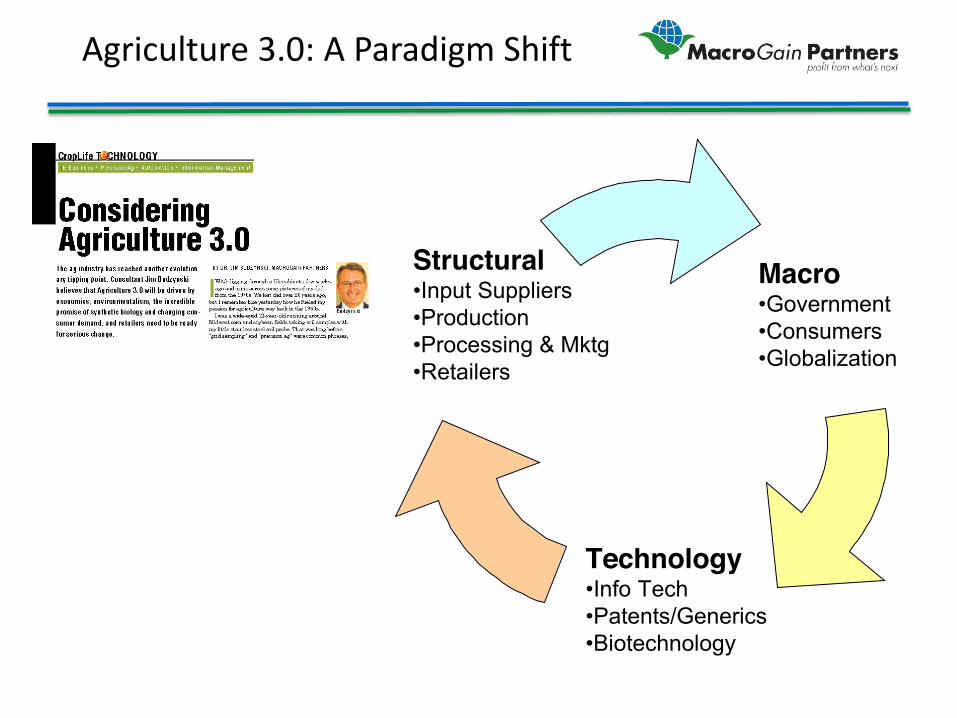
Agriculture 3.0: A Paradigm Shift
Macro •Government •Consumers •Globalization
Technology •Info Tech •Patents/Generics •Biotechnology
Structural •Input Suppliers •Production •Processing & Mktg •Retailers

Ag 3.0: Productivity
US Average Corn Yields, 1863 to 2002

Ag 3.0: U.S. Farm Consolidation Timeline
AG 1.0: Subsistence
Agriculture Was a Lifestyle, Not an
Investment
AG 2.0: Consolidation
• Farms • Chemical Companies • Seed Companies • Fertilizer Companies • Equipment Companies • Ag Retail Rollups
AG 3.0: Lean & Green
Decelerating Returns to Scale, Focus on
Sustainability and Value Creation

U.S. Farm Bifurcation
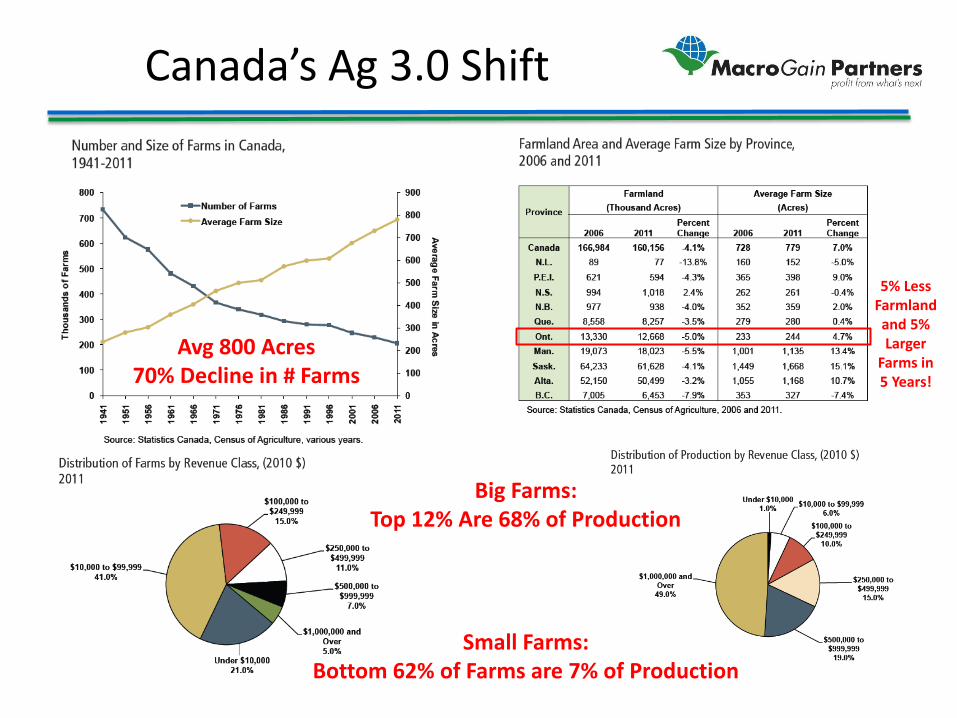
Canada’s Ag 3.0 Shift
Avg 800 Acres 70% Decline in # Farms
Big Farms: Top 12% Are 68% of Production
Small Farms: Bottom 62% of Farms are 7% of Production
5% Less Farmland and 5% Larger
Farms in 5 Years!

Ag 3.0 Changes

Ag 3.0: Lean & Green ”No Molecule Wasted”
Seeds Crop Protection
Crop Nutrition
Protein Production
Bioenergy
Food Processing & Retailing
Ag 3.0
• Optimize Rates • Broadcast to Targeted • Reduce Runoff, Volatilization • 4R Practices
• Preventative to As Needed • Broadcast to Targeted • Synthetics to Biopesticides
• Manure Management • Natural Production • No GPAs, Hormones • Reduced Feed Waste
• More Efficient Processes • Cheaper Feedstocks • More Valuable Outputs • Optimized Plant Size • Reduced Waste
• More Efficient Processes • Supply Chain Management • Enhanced Food Safety • Reduced Waste
• Best Seed • Right Time • Right Population • Right Placement
Precision Decisions
• Holistic Management • Metadata Management • Efficient Decisions

A Vision for Ag Productivity
1.0 2.0 3.0
Hard Manual Labor Big Farm Families
Hybridization Bulk Fertilizer Crop Chemicals Crude GMOs
Recycling Systems Control Systems Info Mining Refined GMOs Biologics “Hybrids”
Subsistence Scale Green &
Lean
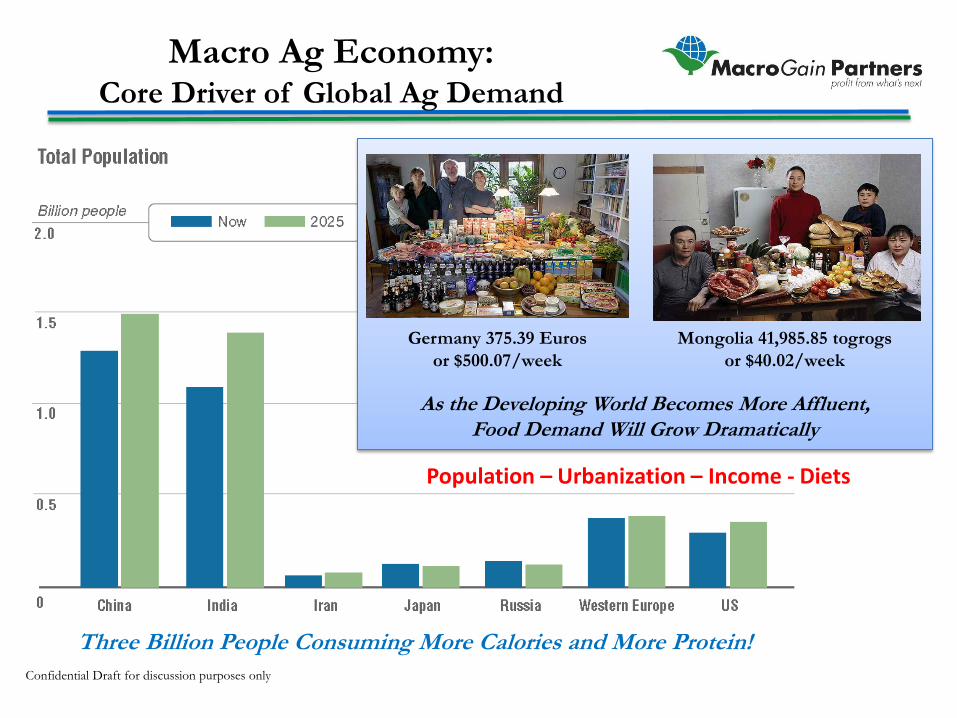
Macro Ag Economy: Core Driver of Global Ag Demand
Confidential Draft for discussion purposes only
As the Developing World Becomes More Affluent, Food Demand Will Grow Dramatically
Germany 375.39 Euros or $500.07/week
Mongolia 41,985.85 togrogs or $40.02/week
Three Billion People Consuming More Calories and More Protein!
Population – Urbanization – Income - Diets

Historical Commodity Prices November 1997 to October 2012
CORN
SOYBEANS
WHEAT
1998 1999 2000 2001 2002 2003 2004 2005 2006 2007 2008 2009 2010 2011 2012
Commodity Prices Fit Into Two Broad Periods 1. BEB&FC: Before
Ethanol Boom and Financial Crisis
2. AEB&FC: After Ethanol Boom and Financial Crisis
BEB&FC AEB&FC
Prices Are Higher and Much More Volatile
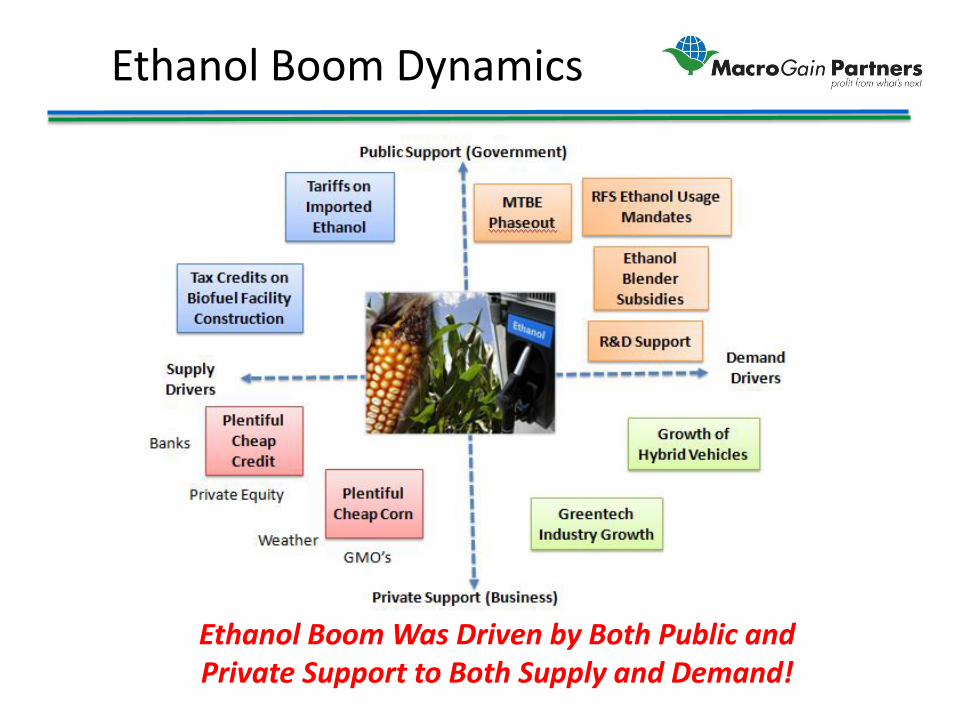
Ethanol Boom Dynamics
Ethanol Boom Was Driven by Both Public and Private Support to Both Supply and Demand!
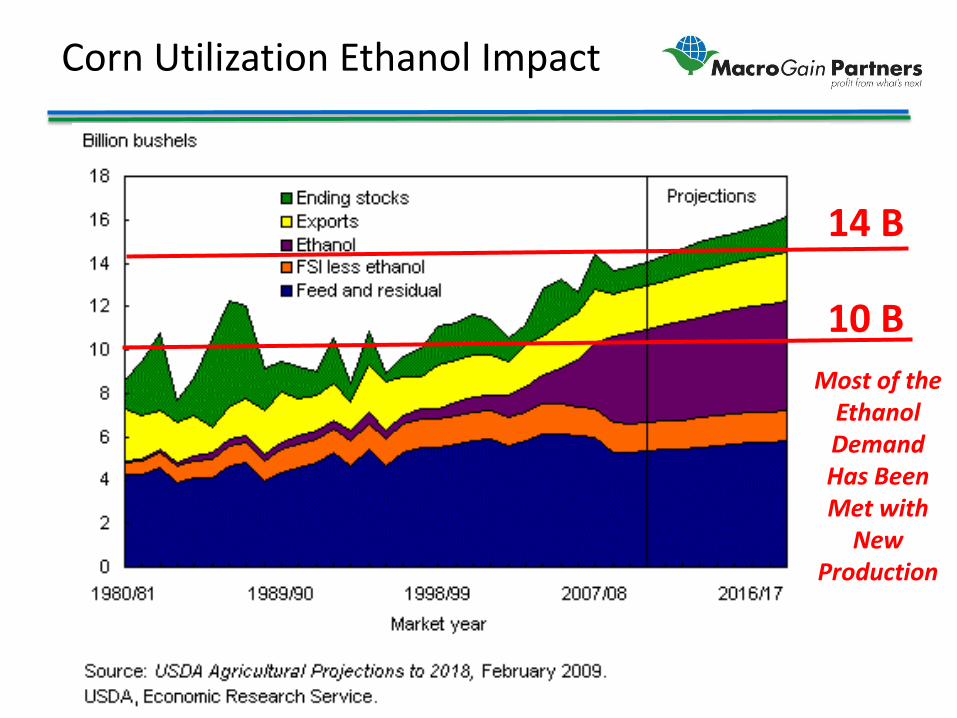
Corn Utilization Ethanol Impact
Most of the Ethanol Demand Has Been Met with
New Production
14 B
10 B
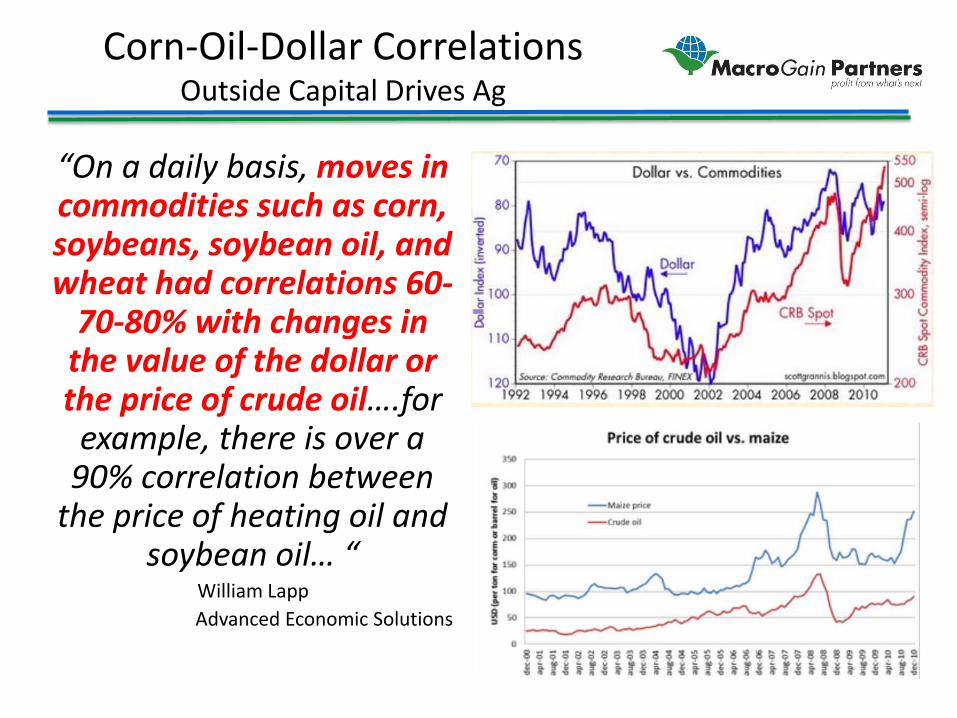
Corn-Oil-Dollar Correlations Outside Capital Drives Ag
“On a daily basis, moves in commodities such as corn, soybeans, soybean oil, and wheat had correlations 60-
70-80% with changes in the value of the dollar or the price of crude oil….for
example, there is over a 90% correlation between
the price of heating oil and soybean oil… “
William Lapp Advanced Economic Solutions

Federal Reserve Moral Hazard Run Amok
S&L Crisis Dotcom
Meltdown Housing Bubble
& Crash
Too Low Too Long
Each Successive Overstimulation (at Lower Rates) Creates a Bigger Bubble – Govt Manipulation of the Supply and Cost of Money Was a Major Cause of the Crisis!
Fed Funds Rate in Greenspan/Bernanke Era
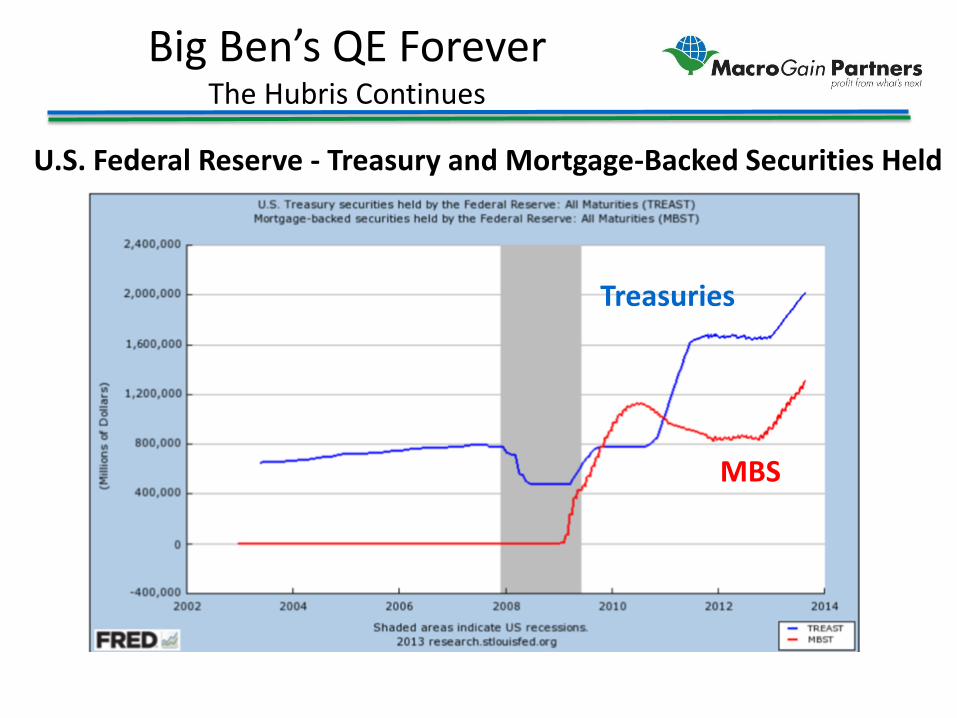
Big Ben’s QE Forever The Hubris Continues
MBS
Treasuries
U.S. Federal Reserve - Treasury and Mortgage-Backed Securities Held

Impacts of Ultra Low Interest Rates and Quantitative Easing
1. Asset Inflation – Stocks, Bonds – Housing
2. Speculative Bubbles – Pushing Out the Risk Curve at 40 BPS – Investment in PE, VC
3. Ponzi Finance – Dependence on Continual Asset Inflation to
Sustain Investments
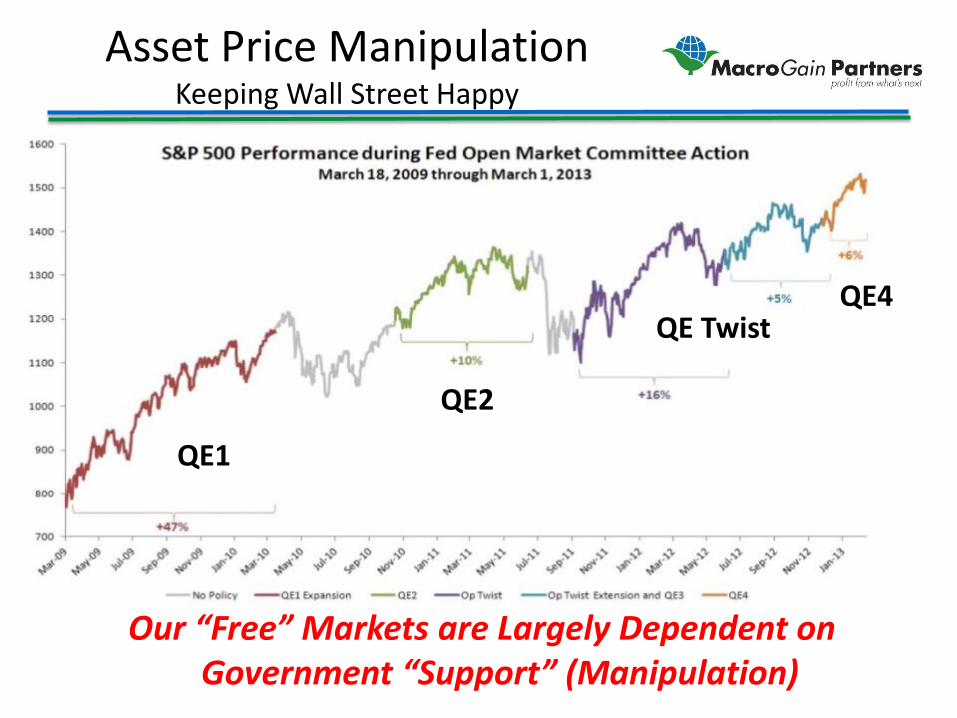
Asset Price Manipulation Keeping Wall Street Happy
Our “Free” Markets are Largely Dependent on Government “Support” (Manipulation)
QE1
QE2
QE4 QE Twist
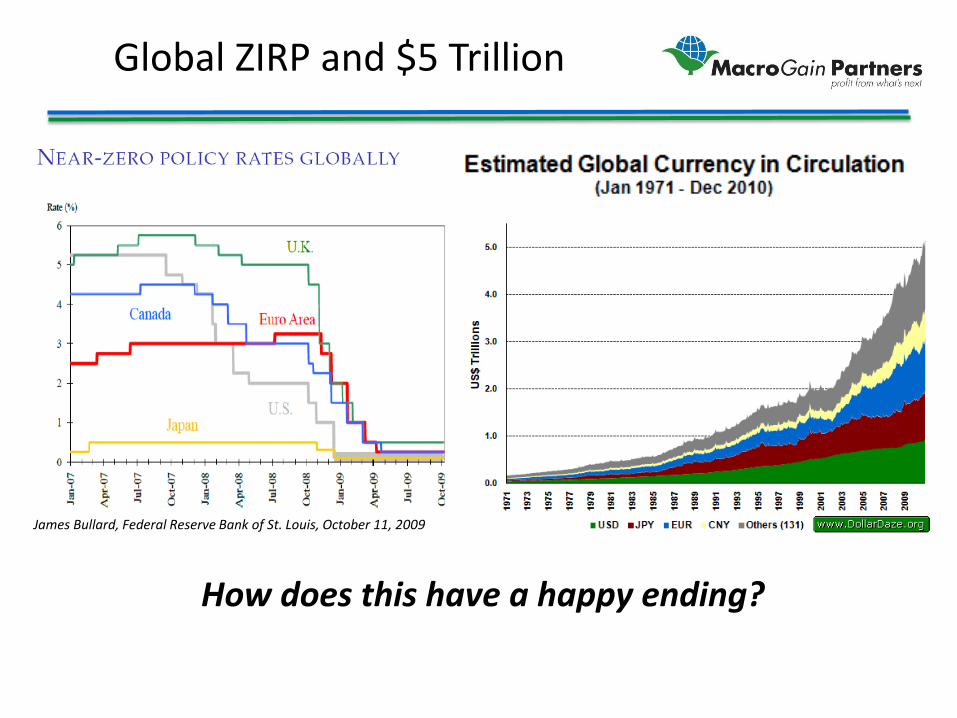
Global ZIRP and $5 Trillion
James Bullard, Federal Reserve Bank of St. Louis, October 11, 2009
How does this have a happy ending?
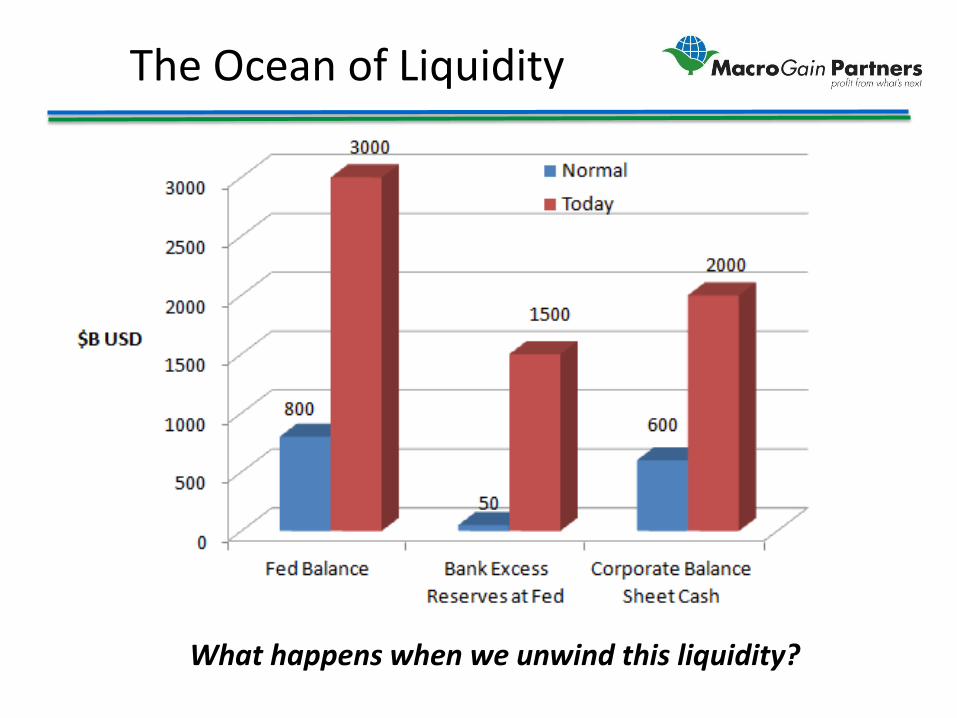
The Ocean of Liquidity
What happens when we unwind this liquidity?
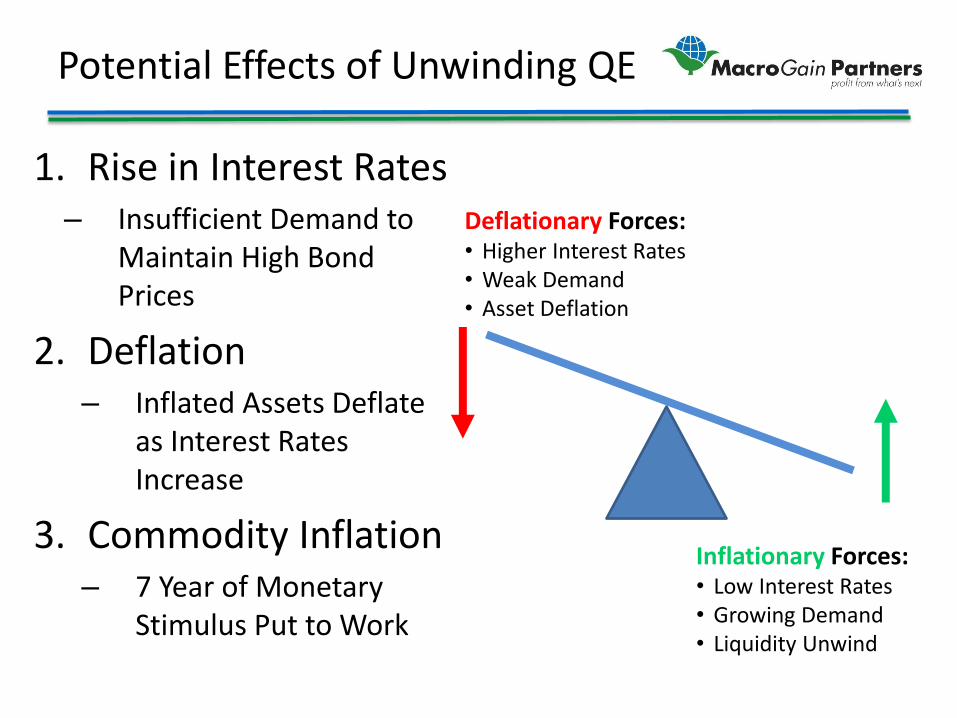
Potential Effects of Unwinding QE
1. Rise in Interest Rates – Insufficient Demand to
Maintain High Bond Prices
2. Deflation – Inflated Assets Deflate
as Interest Rates Increase
3. Commodity Inflation – 7 Year of Monetary
Stimulus Put to Work
Deflationary Forces: • Higher Interest Rates • Weak Demand • Asset Deflation
Inflationary Forces: • Low Interest Rates • Growing Demand • Liquidity Unwind

What is the effect of high prices?
1. Induces New Technology into Agriculture 2. Induces New Land into Production 3. Rations Demand Among Existing Users 4. Increases Farm Income 5. Drives Input Sales – Seed, Chem, Equipment 6. Increases Ag Asset Prices 7. Stimulates Outside Investment n Agriculture
These Impacts Create Short Term Euphoria But Ultimately Distort Prices and Valuations
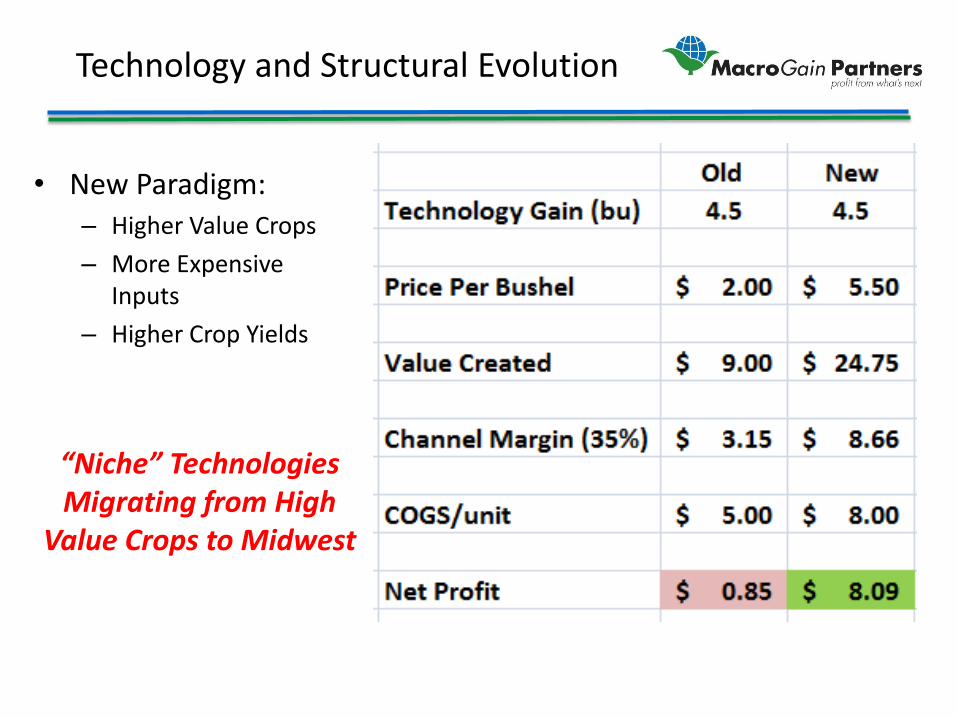
Technology and Structural Evolution
• New Paradigm: – Higher Value Crops – More Expensive
Inputs – Higher Crop Yields
“Niche” Technologies Migrating from High
Value Crops to Midwest

Yield Maximization Hierarchy
Maximizing Genetic Potential Seeds
Establishing Strong Stand of Targeted Plants
• Seed Treatments • Selective Herbicides • Starter Fertilizers
Maximizing Real Time Nutrition & Reproductive
Efficiency
• Macro Fertilizers • Micro Fertilizers • PGRS • Foliar Feeds
Managing Diseases and Insects
• Insecticides • Fungicides • SAR Enhancers
Biologicals
Maximizing Harvestability
• Harvest Aids • PGRs
Water Management Quality Management GPS/Precision Ag Scouting Soil Analysis Data Mgmt
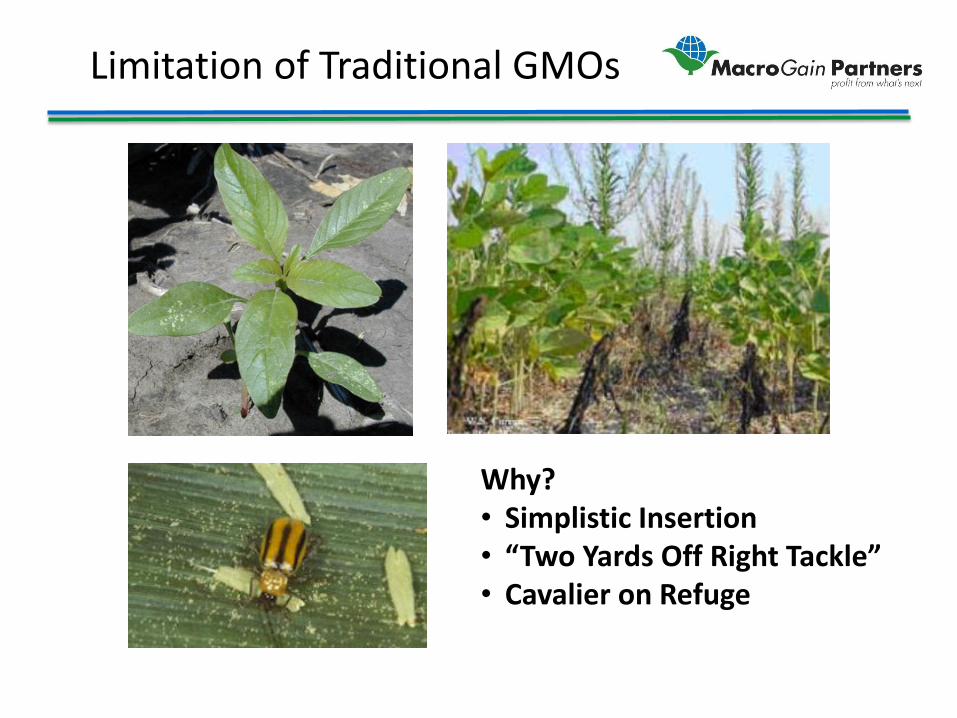
Limitation of Traditional GMOs
Why? • Simplistic Insertion • “Two Yards Off Right Tackle” • Cavalier on Refuge
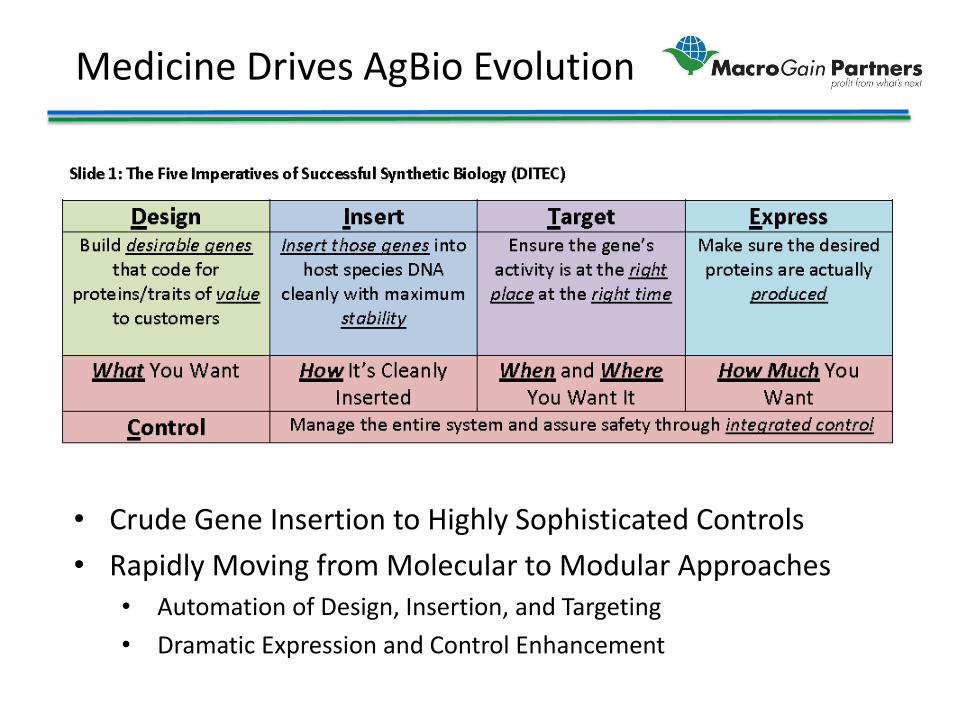
Medicine Drives AgBio Evolution
• Crude Gene Insertion to Highly Sophisticated Controls • Rapidly Moving from Molecular to Modular Approaches
• Automation of Design, Insertion, and Targeting • Dramatic Expression and Control Enhancement

Migration of Corn Belt
• Corn Belt is Moving North and West

Macronutrient Tonnage Flat in U.S.
0
5000
10000
15000
20000
25000
1960
1963
1966
1969
1972
1975
1978
1981
1984
1987
1990
1993
1996
1999
2002
2005
2008
KPN
How can yields continuously increase with flat nutrient tonnage?
K Short Tons
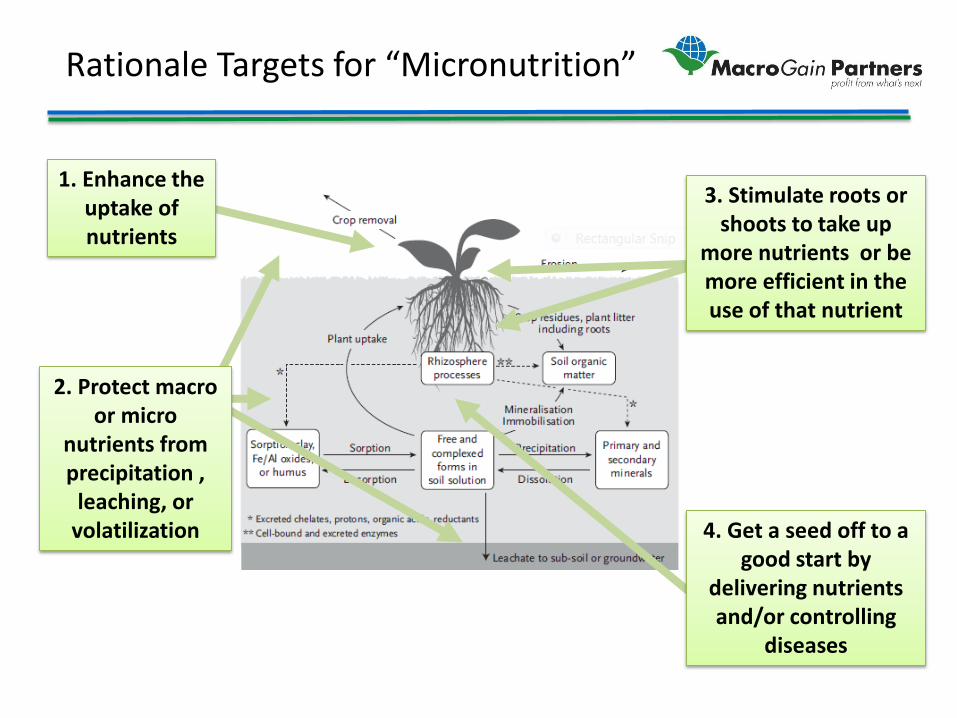
Rationale Targets for “Micronutrition”
1. Enhance the uptake of nutrients
2. Protect macro or micro
nutrients from precipitation ,
leaching, or volatilization
3. Stimulate roots or shoots to take up
more nutrients or be more efficient in the use of that nutrient
4. Get a seed off to a good start by
delivering nutrients and/or controlling
diseases
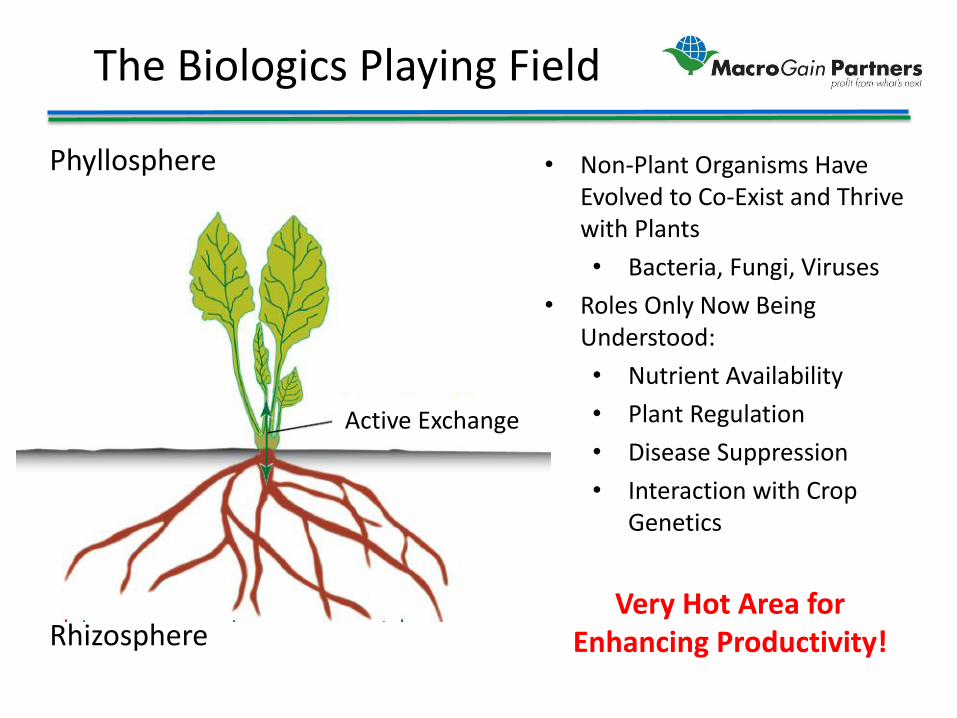
The Biologics Playing Field
Active Exchange
Phyllosphere
Rhizosphere
• Non-Plant Organisms Have Evolved to Co-Exist and Thrive with Plants • Bacteria, Fungi, Viruses
• Roles Only Now Being Understood: • Nutrient Availability • Plant Regulation • Disease Suppression • Interaction with Crop
Genetics
Very Hot Area for Enhancing Productivity!
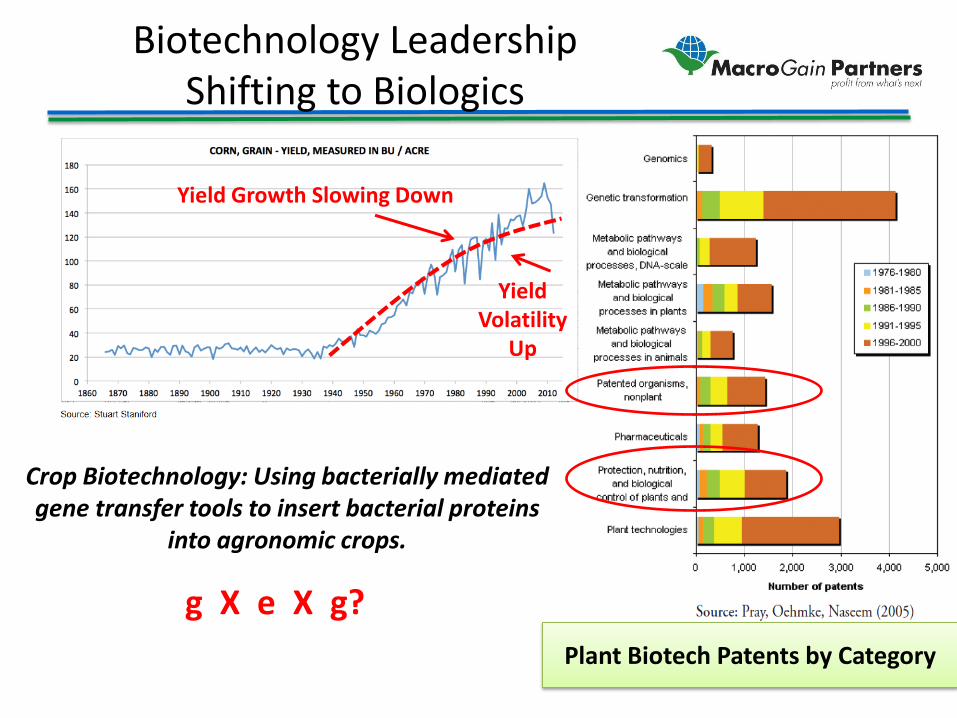
Biotechnology Leadership Shifting to Biologics
Plant Biotech Patents by Category
Yield Growth Slowing Down
Yield Volatility
Up
Crop Biotechnology: Using bacterially mediated gene transfer tools to insert bacterial proteins
into agronomic crops.
g X e X g?
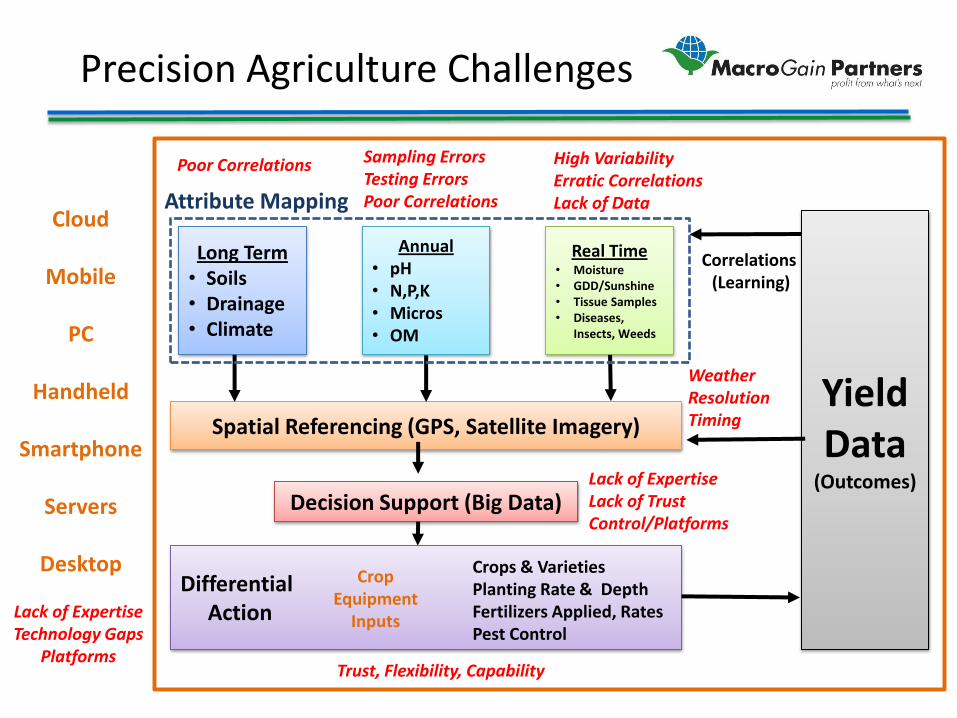
Precision Agriculture Challenges
Long Term • Soils • Drainage • Climate
Real Time • Moisture • GDD/Sunshine • Tissue Samples • Diseases,
Insects, Weeds
Annual • pH • N,P,K • Micros • OM
Yield Data
(Outcomes)
Spatial Referencing (GPS, Satellite Imagery)
Decision Support (Big Data)
Differential Action
Crops & Varieties Planting Rate & Depth Fertilizers Applied, Rates Pest Control
Crop Equipment
Inputs
Cloud
Mobile
PC
Handheld
Smartphone
Servers
Desktop
Attribute Mapping
Correlations (Learning)
Poor Correlations Sampling Errors Testing Errors Poor Correlations
High Variability Erratic Correlations Lack of Data
Lack of Expertise Lack of Trust Control/Platforms
Trust, Flexibility, Capability
Lack of Expertise Technology Gaps
Platforms
Weather Resolution Timing
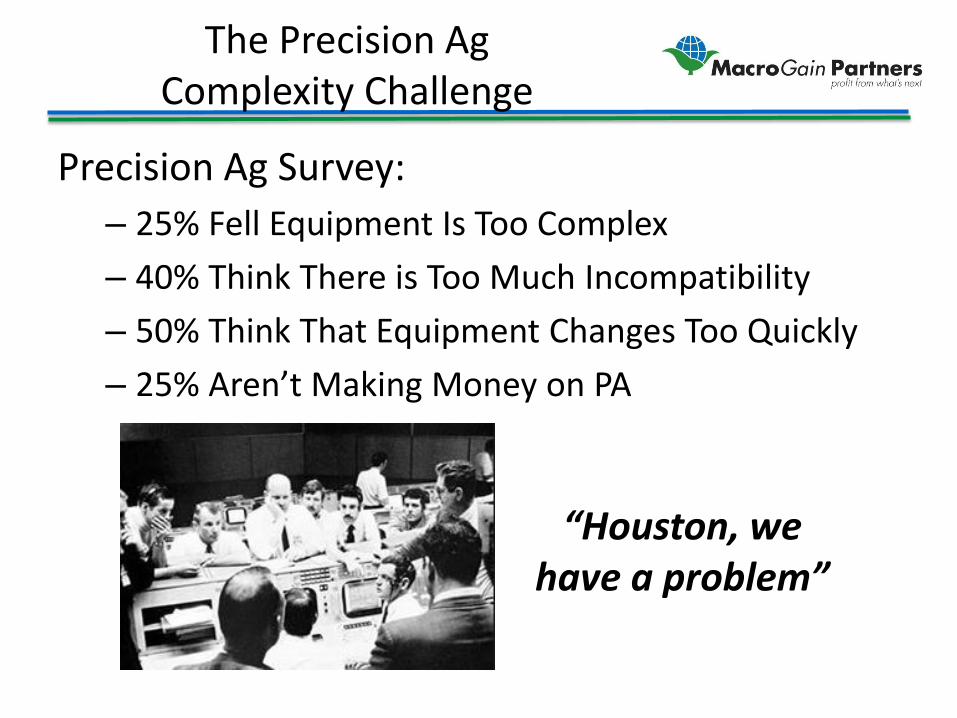
The Precision Ag Complexity Challenge
Precision Ag Survey: – 25% Fell Equipment Is Too Complex – 40% Think There is Too Much Incompatibility – 50% Think That Equipment Changes Too Quickly – 25% Aren’t Making Money on PA
“Houston, we have a problem”

The Seven Precision Ag “Systems”
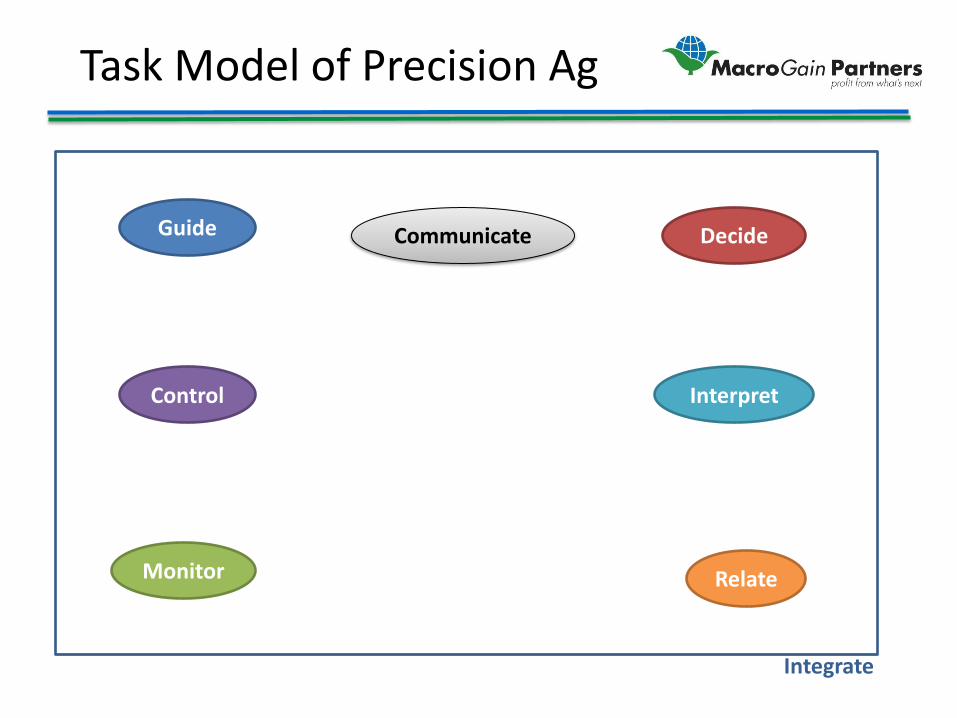
Task Model of Precision Ag
Guide Communicate Decide
Interpret
Relate
Control
Monitor
Integrate
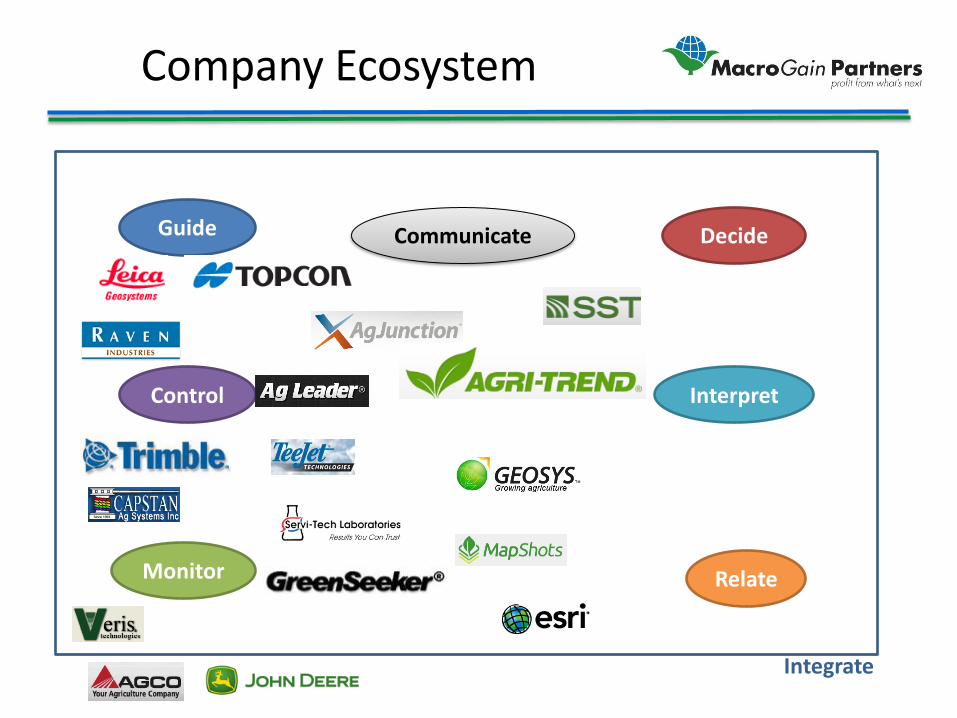
Company Ecosystem
Guide Communicate Decide
Interpret
Relate
Control
Monitor
Integrate

Precision Ag Flow Chart
Guide Communicate Decide
Interpret
Relate
Control
Monitor
Integrate
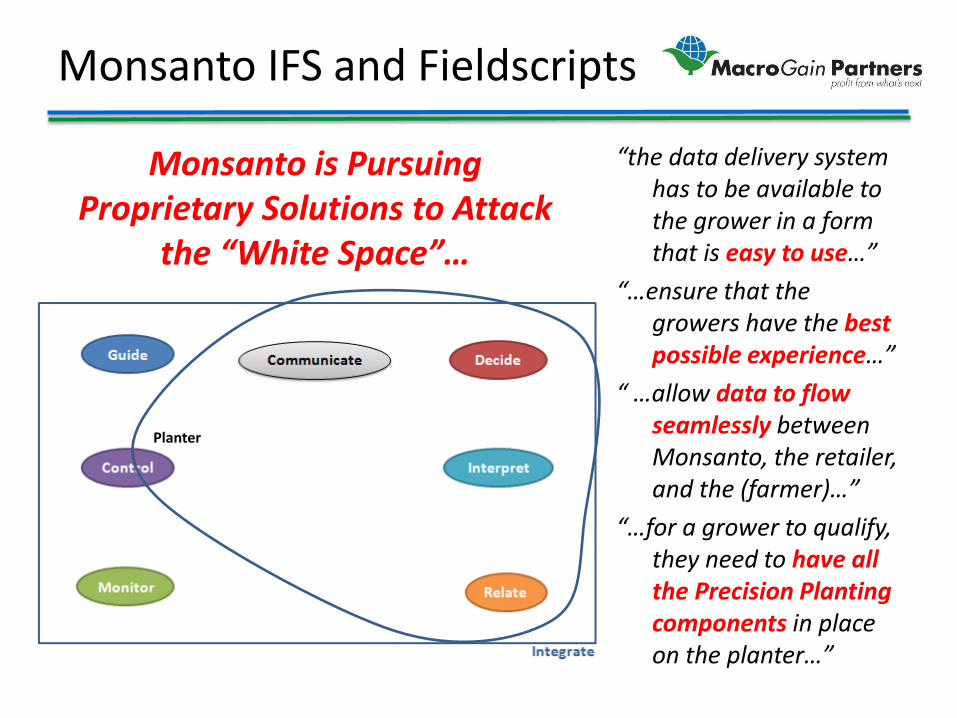
Monsanto IFS and Fieldscripts
“the data delivery system has to be available to the grower in a form that is easy to use…”
“…ensure that the growers have the best possible experience…”
“ …allow data to flow seamlessly between Monsanto, the retailer, and the (farmer)…”
“…for a grower to qualify, they need to have all the Precision Planting components in place on the planter…”
Planter
Monsanto is Pursuing Proprietary Solutions to Attack
the “White Space”…
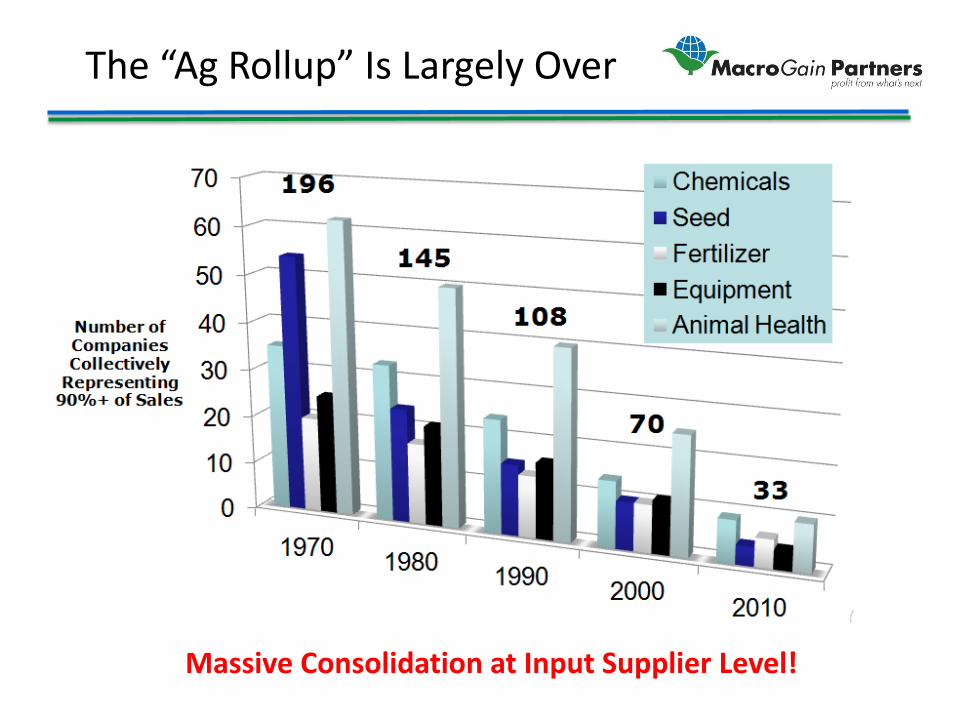
The “Ag Rollup” Is Largely Over
Massive Consolidation at Input Supplier Level!
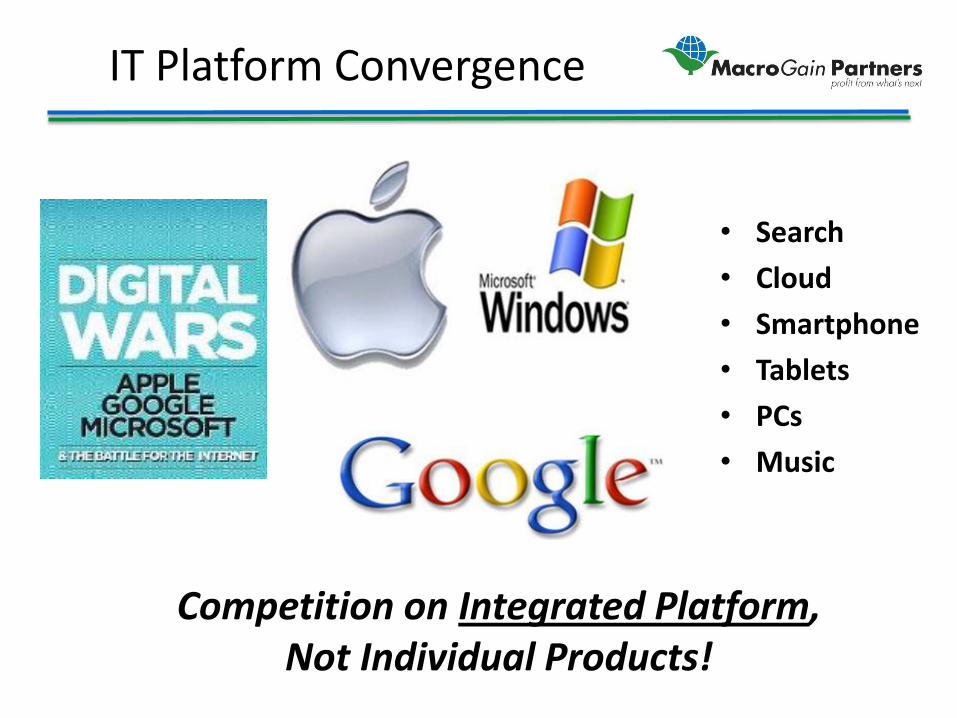
IT Platform Convergence
• Search • Cloud • Smartphone • Tablets • PCs • Music
Competition on Integrated Platform, Not Individual Products!
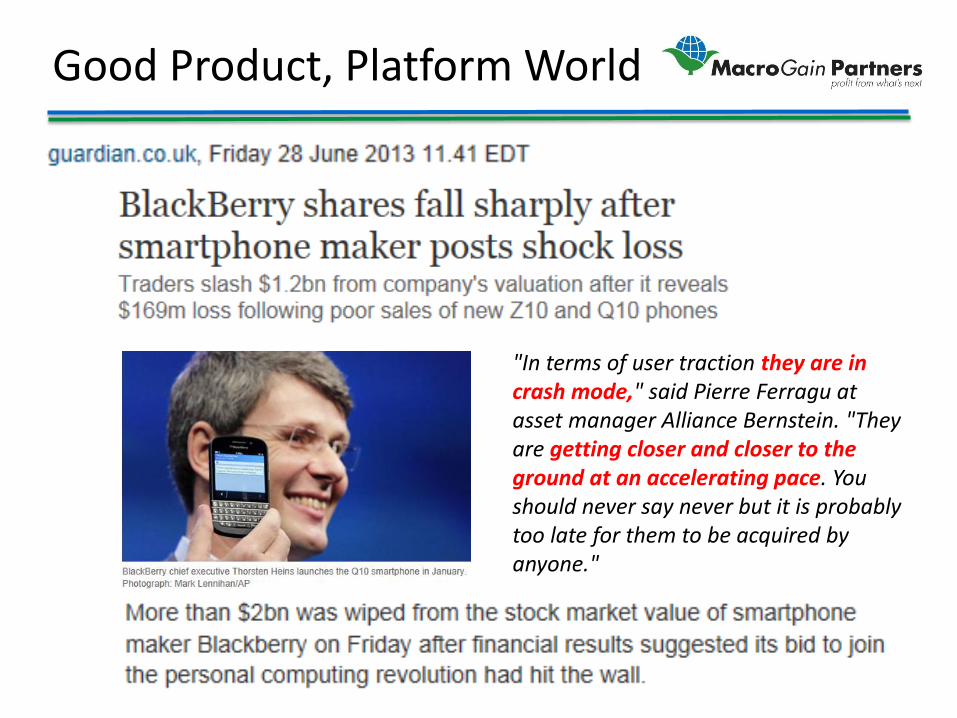
Good Product, Platform World
"In terms of user traction they are in crash mode," said Pierre Ferragu at asset manager Alliance Bernstein. "They are getting closer and closer to the ground at an accelerating pace. You should never say never but it is probably too late for them to be acquired by anyone."
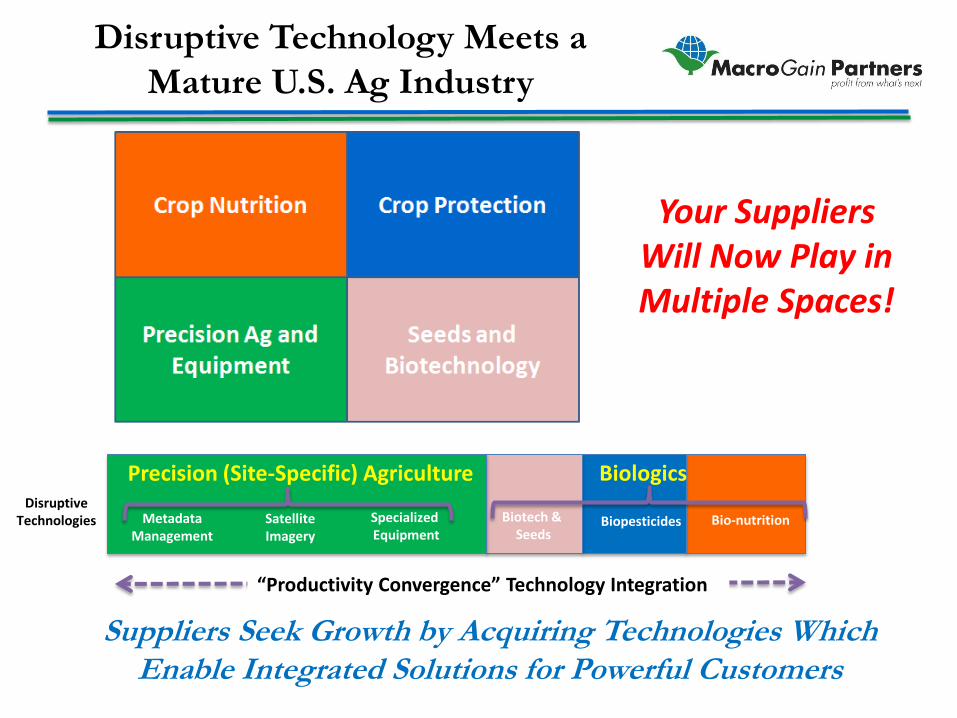
Disruptive Technology Meets a Mature U.S. Ag Industry
Suppliers Seek Growth by Acquiring Technologies Which Enable Integrated Solutions for Powerful Customers
Disruptive Technologies
Precision (Site-Specific) Agriculture Biologics
Metadata Management
Satellite Imagery
Specialized Equipment
Biotech & Seeds
Biopesticides Bio-nutrition
“Productivity Convergence” Technology Integration
Your Suppliers Will Now Play in Multiple Spaces!
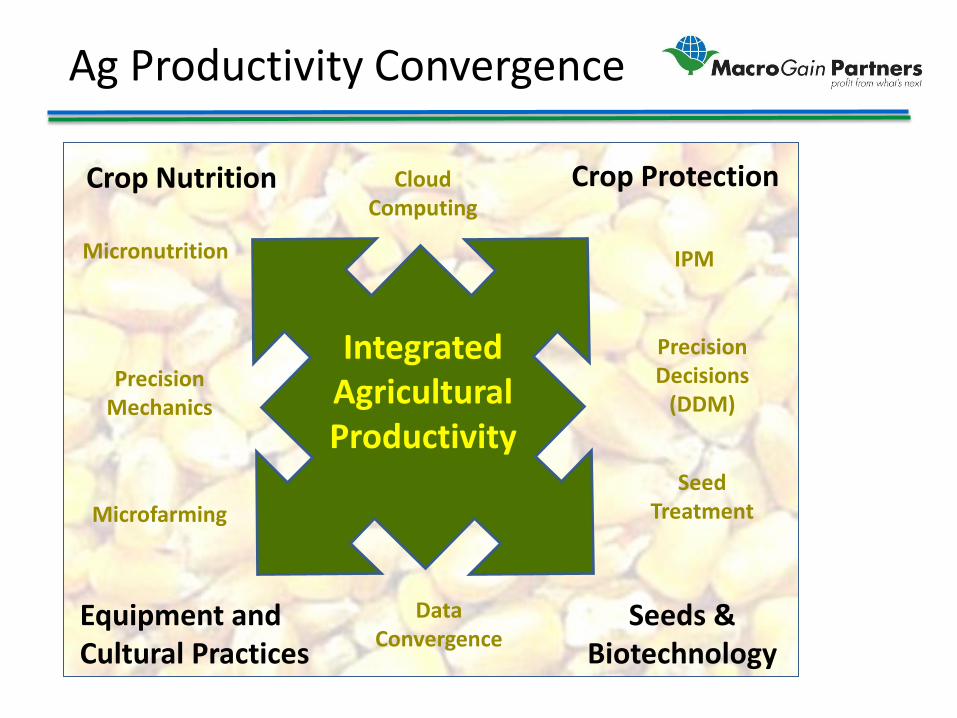
Ag Productivity Convergence
Crop Nutrition Crop Protection
Equipment and Cultural Practices
Seeds & Biotechnology
Integrated Agricultural Productivity
Precision Mechanics
Micronutrition
Microfarming
IPM
Precision Decisions
(DDM)
Seed Treatment
Cloud Computing
Data Convergence

Changing Production Economics: Historical Net Farm Income
Farm Income
Well Above
Historical Norms!
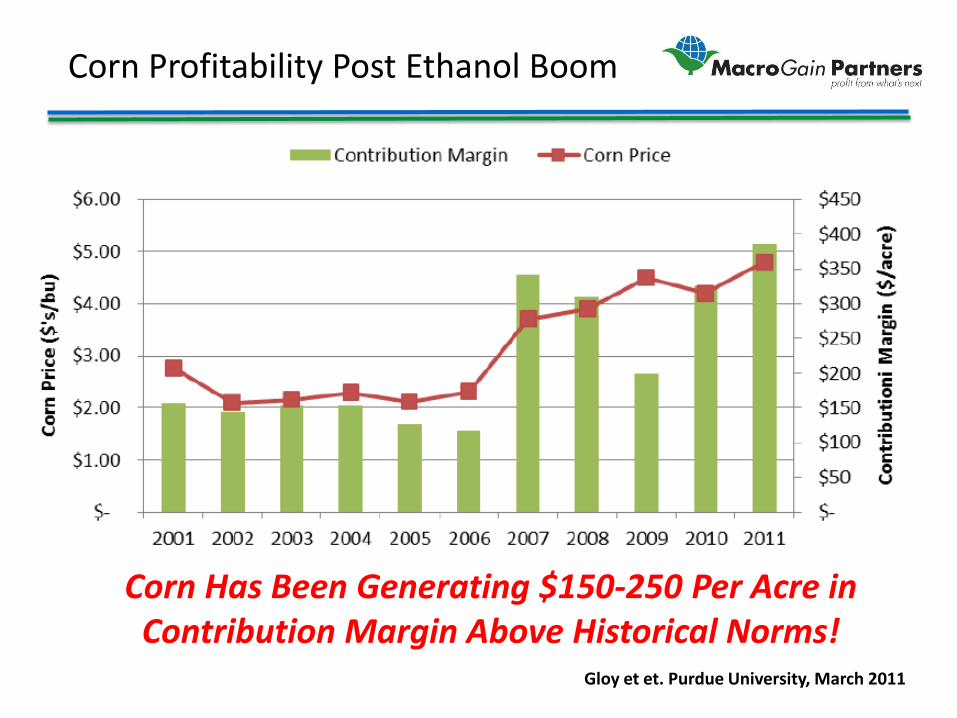
Corn Profitability Post Ethanol Boom
Gloy et et. Purdue University, March 2011
Corn Has Been Generating $150-250 Per Acre in Contribution Margin Above Historical Norms!
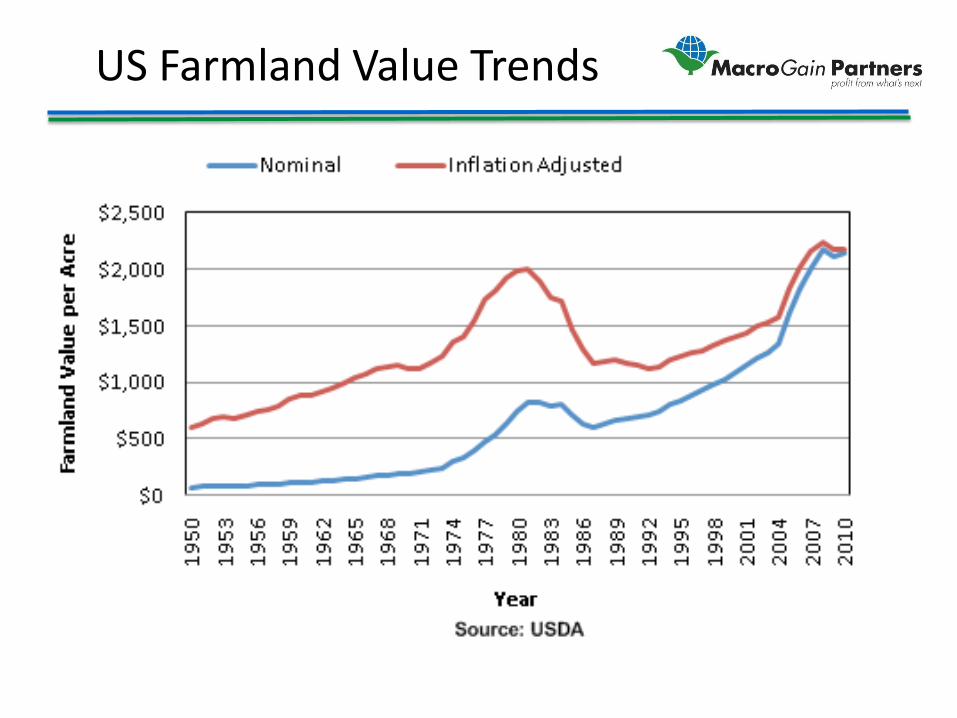
US Farmland Value Trends
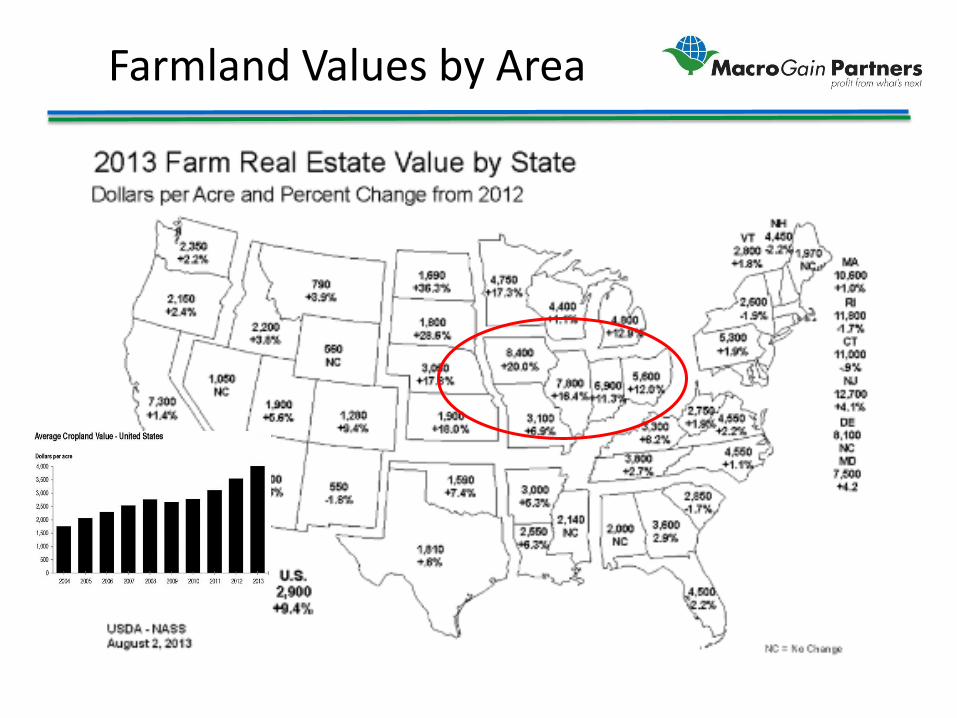
Farmland Values by Area
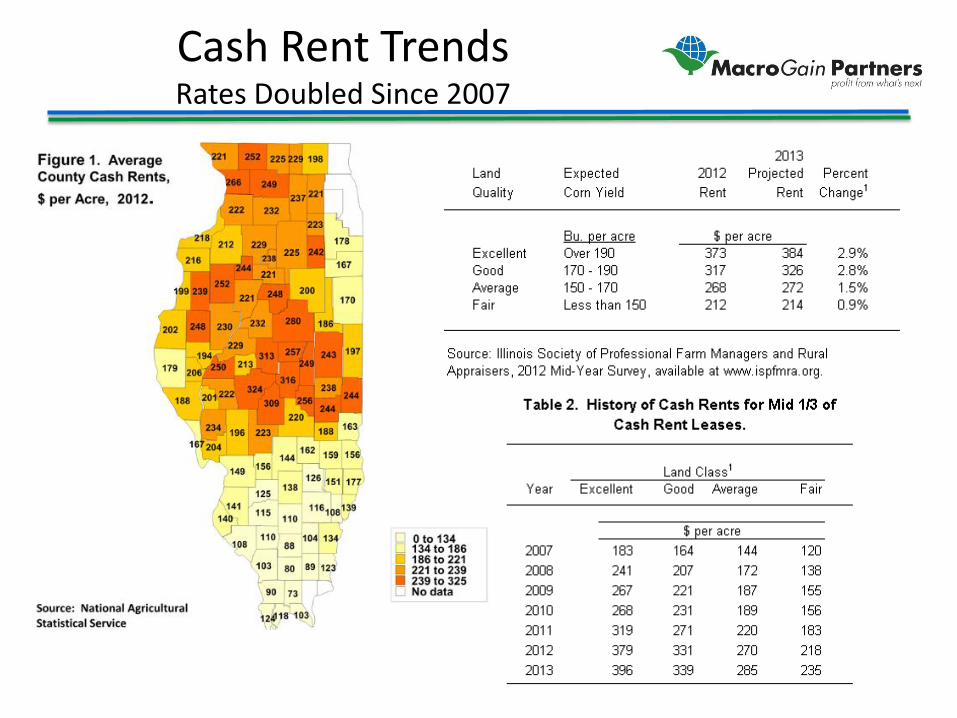
Cash Rent Trends Rates Doubled Since 2007
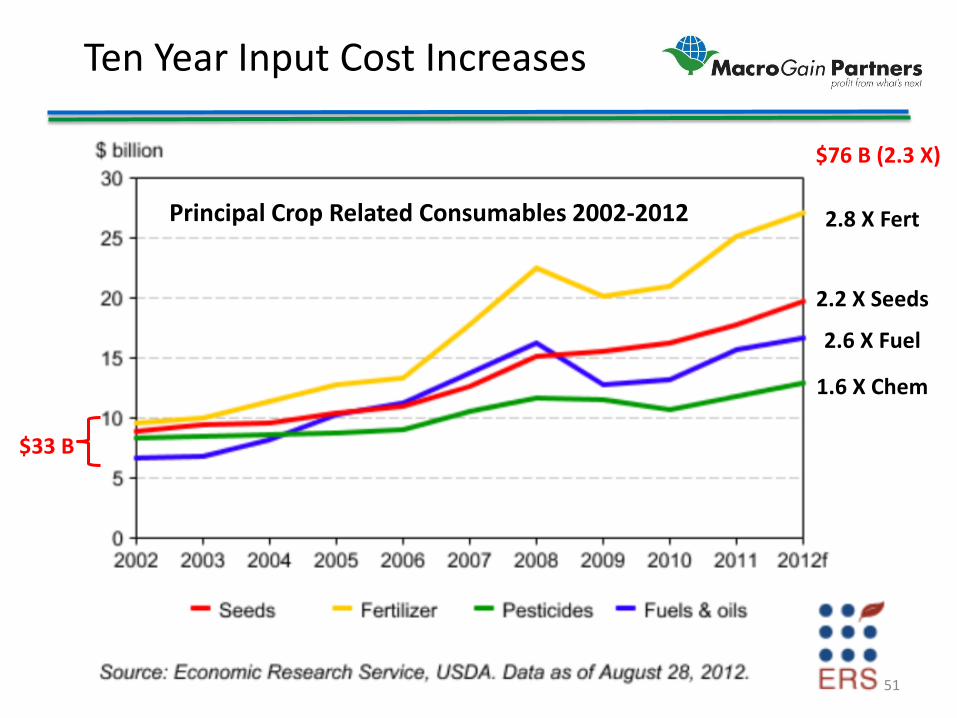
Ten Year Input Cost Increases
Principal Crop Related Consumables 2002-2012 2.8 X Fert
2.2 X Seeds
2.6 X Fuel
1.6 X Chem
$33 B
$76 B (2.3 X)
51
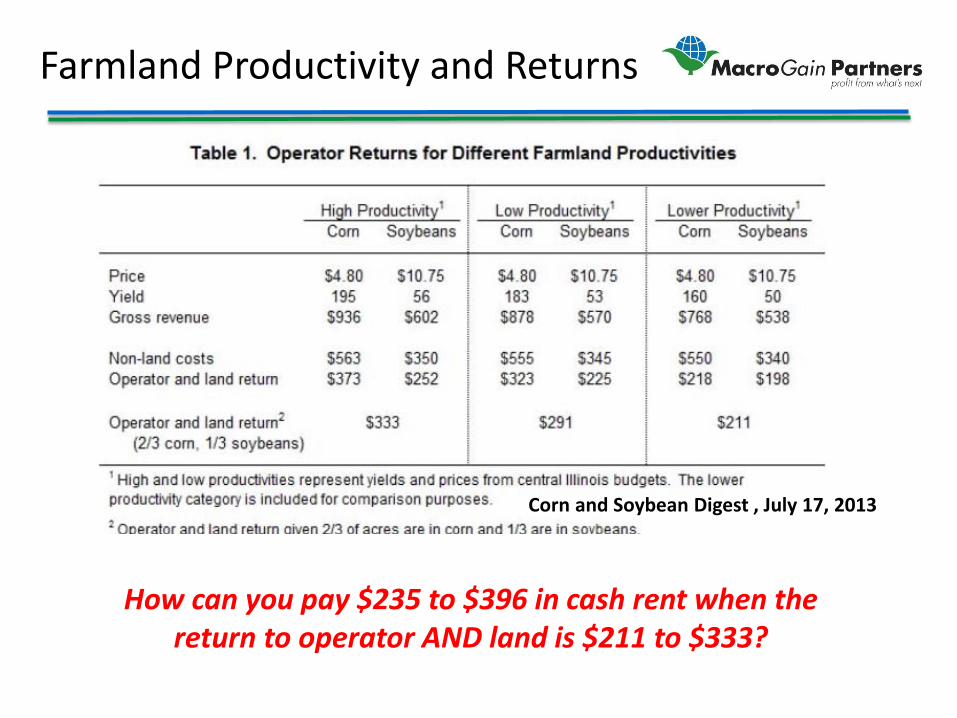
Farmland Productivity and Returns
Corn and Soybean Digest , July 17, 2013
How can you pay $235 to $396 in cash rent when the return to operator AND land is $211 to $333?
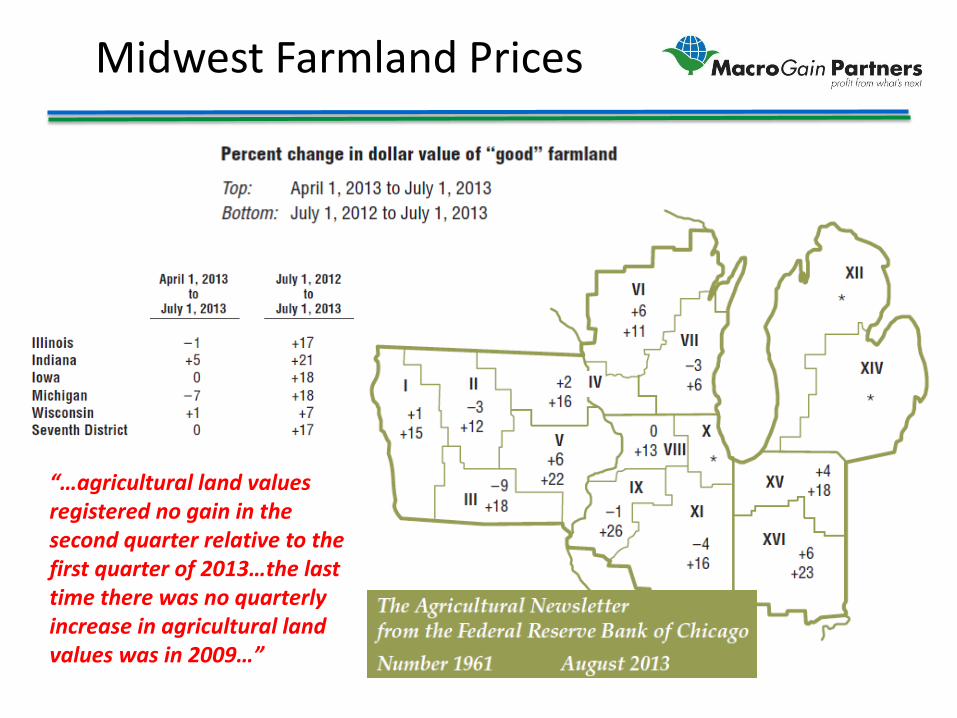
Midwest Farmland Prices
“…agricultural land values registered no gain in the second quarter relative to the first quarter of 2013…the last time there was no quarterly increase in agricultural land values was in 2009…”

Farm Debt
Highest Debt
Levels Since the
1980s!

Institutional Farmland Ownership Iowa
…..62% of Iowa farmland is now
owned by farmland investors and other
non-farmers, up from 60 percent in the 2007 survey and 55 percent in 2002, constituting
over a 10% fall in farmer ownership
over the last decade…
2012 Iowa Farmland Ownership Survey
1982 1992 2002 2007 2012 "Farmers can batten down the hatches, cut their spending and get by in hard times," Berg said. "If investors have paid $8,000 to $10,000 an acre for land that's not earning a decent return, how long will they hang in there before they move to greener pastures?”
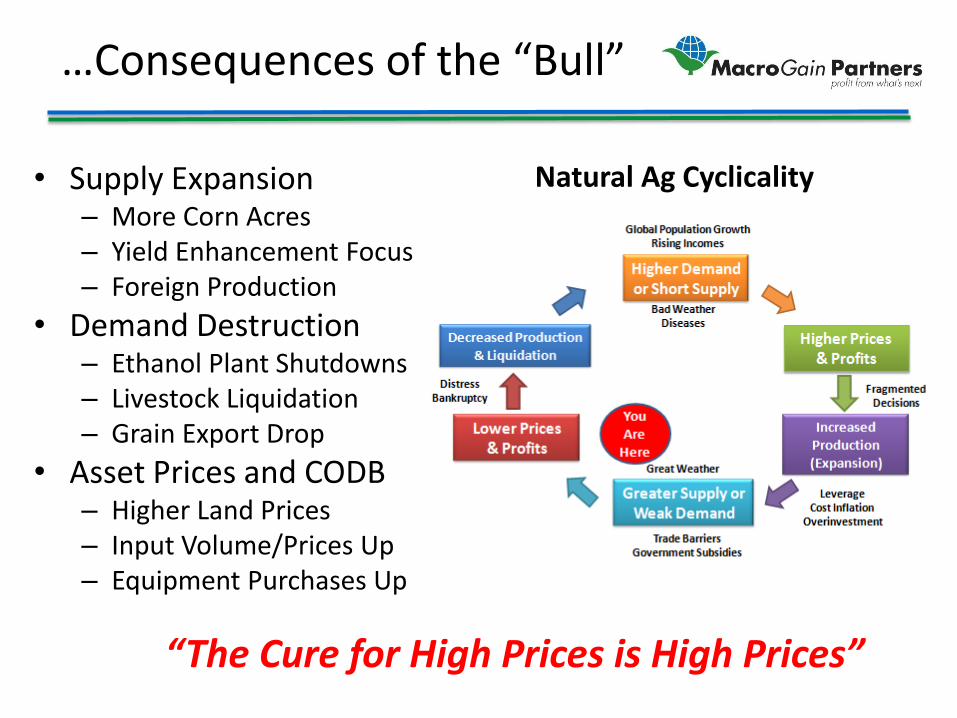
…Consequences of the “Bull”
• Supply Expansion – More Corn Acres – Yield Enhancement Focus – Foreign Production
• Demand Destruction – Ethanol Plant Shutdowns – Livestock Liquidation – Grain Export Drop
• Asset Prices and CODB – Higher Land Prices – Input Volume/Prices Up – Equipment Purchases Up
“The Cure for High Prices is High Prices”
Natural Ag Cyclicality
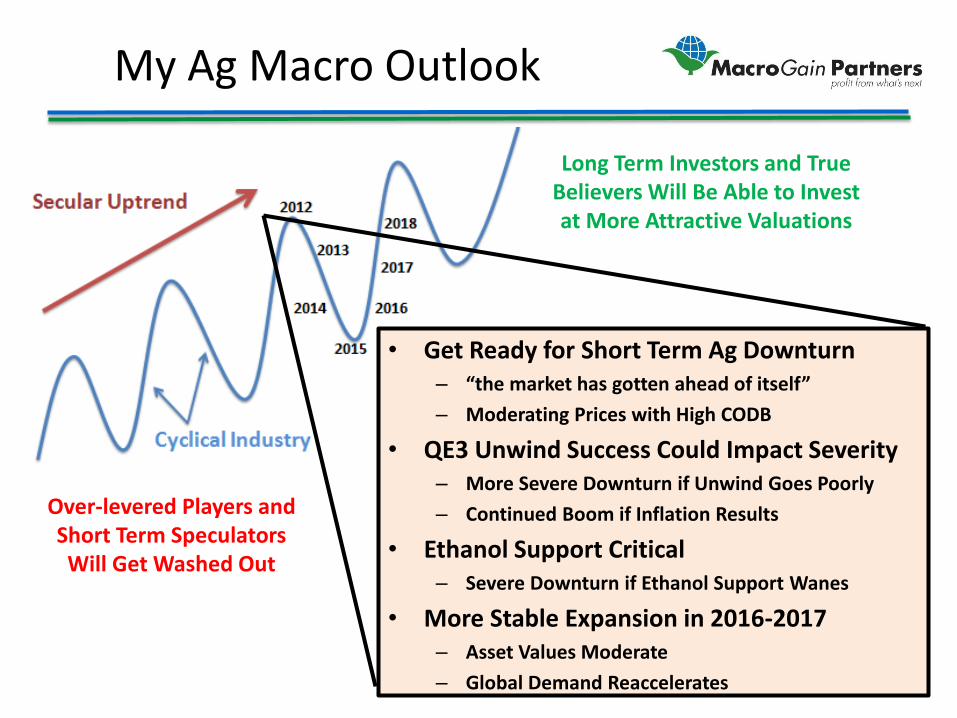
My Ag Macro Outlook
• Get Ready for Short Term Ag Downturn – “the market has gotten ahead of itself” – Moderating Prices with High CODB
• QE3 Unwind Success Could Impact Severity – More Severe Downturn if Unwind Goes Poorly – Continued Boom if Inflation Results
• Ethanol Support Critical – Severe Downturn if Ethanol Support Wanes
• More Stable Expansion in 2016-2017 – Asset Values Moderate – Global Demand Reaccelerates
Over-levered Players and Short Term Speculators Will Get Washed Out
Long Term Investors and True Believers Will Be Able to Invest at More Attractive Valuations
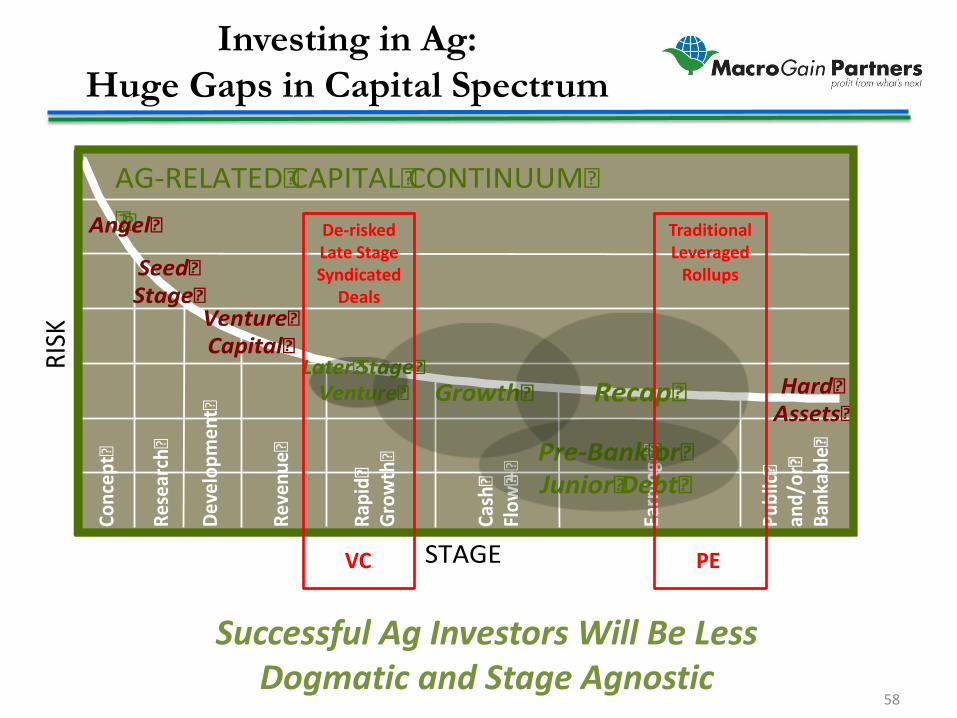
Investing in Ag: Huge Gaps in Capital Spectrum
58
STAGE�
RISK�
Public�
and/or�
Ban
kable�
Earnings�
Cash�
Flow�+�
Rap
id�
Growth�
Reven
ue�
Developmen
t�
Research�
Concept�
Later�Stage�Venture�
Pre-Bank�or�Junior�Debt�
Growth� Recap�
AG-RELATED�CAPITAL�CONTINUUM���Angel�
Venture�Capital�
Seed�Stage�
Hard�Assets�
VC PE
De-risked Late Stage Syndicated
Deals
Traditional Leveraged
Rollups
Successful Ag Investors Will Be Less Dogmatic and Stage Agnostic

MacroGain Partners and Open Prairie Ventures Process and Focus
Private Equity $25-200 mm
Private Equity $10-25 mm
Private Equity $3-10 mm
Venture Capital
$1-5 mm
Angel Investors
$0.2-2.0 mm
Capital Sources
Sector Rollups
Family Transitions
Growth Capital Recaps
Shareholder Realignment
Orphan Products
Minority Investments
Strategic Partnerships
Advantaged Startups
Emerging Technology
Ag Business Need “Deal Sponsor”
• Strategize on Needs • Assemble Financial Model • Build Investment Story • Identify Capital Sources • Help Sift Through Options • Assist on Diligence • Post Closing Support
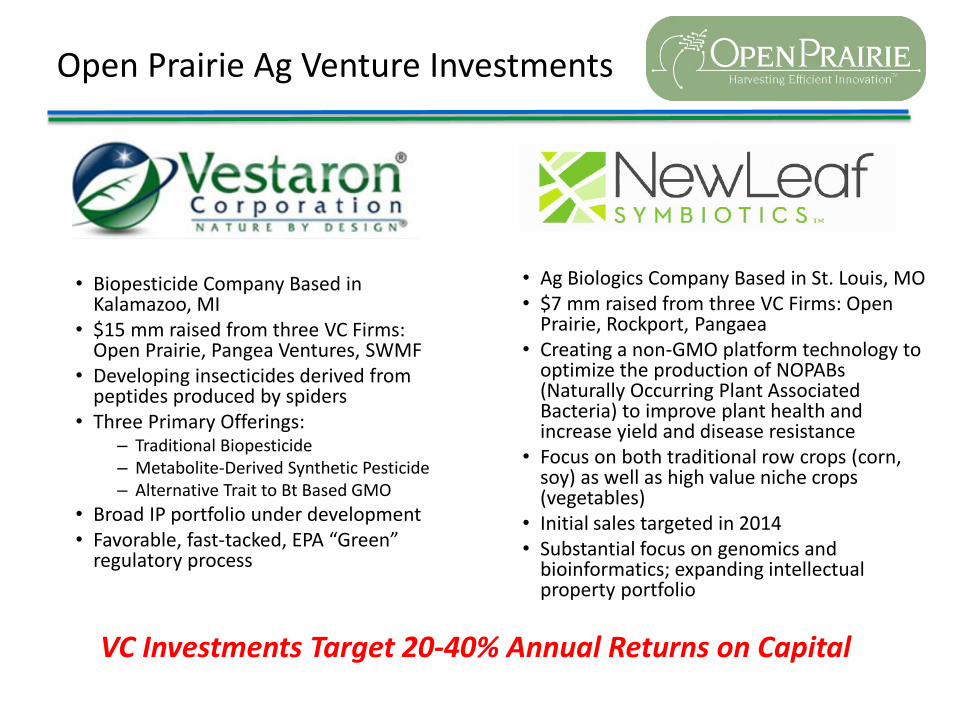
Open Prairie Ag Venture Investments
• Biopesticide Company Based in Kalamazoo, MI
• $15 mm raised from three VC Firms: Open Prairie, Pangea Ventures, SWMF
• Developing insecticides derived from peptides produced by spiders
• Three Primary Offerings: – Traditional Biopesticide – Metabolite-Derived Synthetic Pesticide – Alternative Trait to Bt Based GMO
• Broad IP portfolio under development • Favorable, fast-tacked, EPA “Green”
regulatory process
• Ag Biologics Company Based in St. Louis, MO • $7 mm raised from three VC Firms: Open
Prairie, Rockport, Pangaea • Creating a non-GMO platform technology to
optimize the production of NOPABs (Naturally Occurring Plant Associated Bacteria) to improve plant health and increase yield and disease resistance
• Focus on both traditional row crops (corn, soy) as well as high value niche crops (vegetables)
• Initial sales targeted in 2014 • Substantial focus on genomics and
bioinformatics; expanding intellectual property portfolio
VC Investments Target 20-40% Annual Returns on Capital
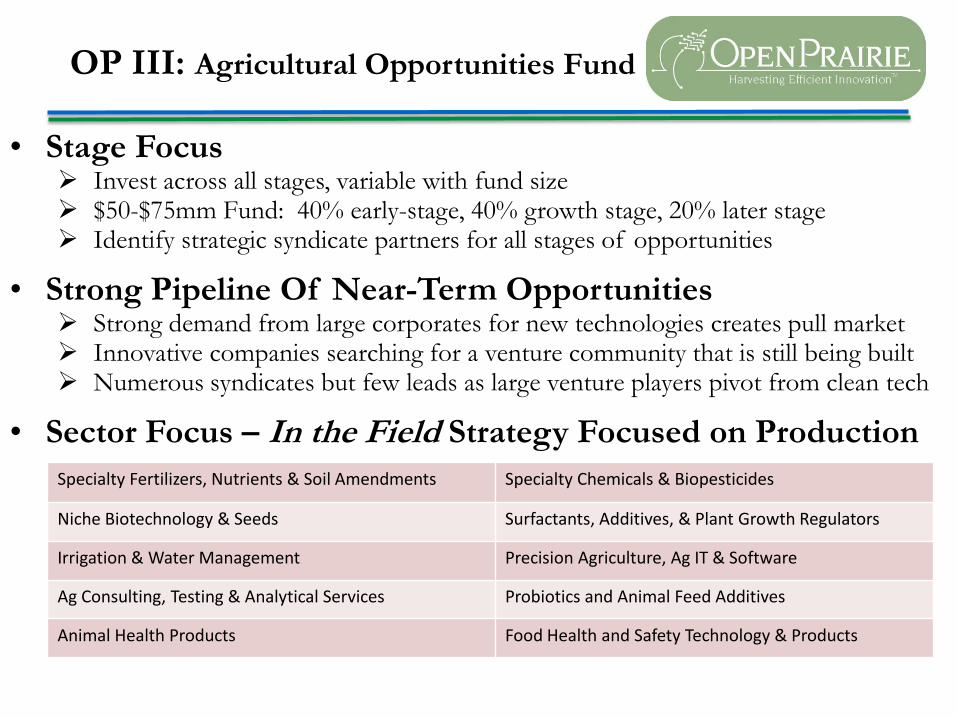
OP III: Agricultural Opportunities Fund
• Stage Focus ¾ Invest across all stages, variable with fund size ¾ $50-$75mm Fund: 40% early-stage, 40% growth stage, 20% later stage ¾ Identify strategic syndicate partners for all stages of opportunities
• Strong Pipeline Of Near-Term Opportunities ¾ Strong demand from large corporates for new technologies creates pull market ¾ Innovative companies searching for a venture community that is still being built ¾ Numerous syndicates but few leads as large venture players pivot from clean tech
• Sector Focus – In the Field Strategy Focused on Production
Specialty Fertilizers, Nutrients & Soil Amendments Specialty Chemicals & Biopesticides
Niche Biotechnology & Seeds Surfactants, Additives, & Plant Growth Regulators
Irrigation & Water Management Precision Agriculture, Ag IT & Software
Ag Consulting, Testing & Analytical Services Probiotics and Animal Feed Additives
Animal Health Products Food Health and Safety Technology & Products
Agrifood’s Future is Bright!
Thanks!
Please Contact Me If: 1. You Are Seeking a
Capital Partner for a Project or Deal
2. You Have an Interest in Investing in Ag Deals
3. You Are Interested in Testing New Technologies