agricultural policy indicators - oecd.org · e-mail: [email protected] abstract this paper outlines a...
TRANSCRIPT
Agricultural Policy Indicators
Timothy E. Josling and Alberto Valdés
ESA Working Paper No. 04-04
January 2004
www.fao.org/es/esa
Agricultural and Development Economics Division
The Food and Agriculture Organization of the United Nations
ESA Working Paper No. 04-04
www.fao.org/es/esa
Agricultural Policy Indicators
January 2004
Timothy E. Josling
Professor and Senior Fellow Stanford University
e-mail: [email protected]
Alberto Valdés
Senior Economic Adviser Food and Agriculture Organization
e-mail: [email protected]
Abstract This paper outlines a methodological approach for use by FAO to collect, analyze and monitor agricultural policy indicators (API) for developing countries. The aim is to establish a consistent and comparable set of policy indicators, allowing analysts to examine whether agriculture in particular countries is being stimulated or retarded by the set of policies employed. The API should also be useful in the context of quantitative models of policy impacts and market projections. Ideally, the indicators should function as building blocks for the more comprehensive policy measurement. This paper is presented in four parts. Part I gives an overview of the rationale for monitoring, the relationship between policy monitoring, quantitative modeling and evaluation, and the basic menu of choices of indicators. Part II provides a brief review of the studies that have calculated the extent of agricultural support in developed countries since 1973 and of the comparable exercises that have focused on developing countries, mainly published since 1990. In light of the apparent "success" or "failure" of the studies mentioned above, and of the authors' experience with many of them, Part III identifies several areas that in our opinion deserve special attention in the planning of the FAO-sponsored studies. We attempt to provide insights into methodological, computational and logistical problems that might be faced by FAO. Part IV suggests a methodological approach for FAO, elaborating on the suggested coverage, definitions, classification criteria and methods of calculation. Key Words: Q11, Q17, Q18, O10, O19 JEL: Agricultural policy, trade and development, policy indicators, domestic support The Authors would like to thank participants in the Agricultural Policy Analysis Consortium Workshop, held at FAO, Rome, Oct. 23, 2003, for their helpful comments at the workshop and the suggestions subsequently received. This paper has also been issued as FAO Commodity and Trade Policy Research Working Paper No. 4. The designations employed and the presentation of material in this information product do not imply the expression of any opinion whatsoever on the part of the Food and Agriculture Organization of the United Nations concerning the legal status of any country, territory, city or area or of its authorities, or concerning the delimitation of its frontiers or boundaries.

ii
CONTENTS
1 INTRODUCTION........................................................................................................................... 1 2 THE CHOICE OF INDICATORS FOR POLICY ANALYSIS ..................................................... 1 3 PREVIOUS POLICY MONITORING ATTEMPTS...................................................................... 4
3.1 Developed country studies ..................................................................................................... 5 3.2 Developing country studies.................................................................................................... 7
4 METHODOLOGICAL ISSUES AND LOGISTICAL PROBLEMS ............................................. 9 4.1 Methodological Issues ......................................................................................................... 10 4.2 Logistical issues ................................................................................................................... 14
5 SUGGESTED METHODOLOGY FOR TIER I COUNTRIES ................................................... 15 6 CONCLUSION ............................................................................................................................. 18
REFERENCES.................................................................................................................................. 20 ANNEX - TERMS OF REFERENCE .................................................................................................. 22 Figure 1: Schema for reporting of domestic support commitments ...................................................... 24 TABLES................................................................................................................................................ 25

1
1 INTRODUCTION The Food and Agriculture Organization (FAO), the World Bank (WB), the International Food Policy Research Institute (IFPRI)) and the Organization for Economic Co-operation and Development (OECD) are establishing a Consortium to develop, coordinate and undertake the measurement of agricultural policy indicators for developing countries. To allow flexibility, a “two-tiered” approach to agricultural policy reviews is envisaged, involving an initial quantification of agricultural policies for a wider group of countries (Tier I), and a more comprehensive country review involving PSE/CSE calculations for a smaller group of selected countries (Tier II). This paper is intended to help to define the contribution of the FAO to the Consortium as it relates to the monitoring of Tier I countries. (See attached Terms of Reference for details about the Consortium and the objectives of the study). The objective of this paper is to suggest a methodological approach that can be adopted by FAO to collect and analyze a set of agricultural policy indicators (API) that will be of use in evaluating policy change. These policy indicators would need to fulfil certain requirements and constraints. They should be comprehensible, transparent, be capable of straightforward interpretation and be based on a data collection system that is directed by FAO on an on-going basis, either from local sources or collected by local consultants. An additional objective would be to provide a framework for assessing the needs of FAO for other data series that might be complementary to the agricultural policy indicators. At the least the policy indicators should be able to tell whether agriculture in particular countries is being stimulated or retarded by the set of policies employed. Such indicators should also be useful in the context of quantitative models of policy impacts and market projections. But ideally the indicators should also function as building blocks for the more comprehensive policy measurement intended for the Tier II countries. Thus the modular approach we take is designed for flexibility to respond to the needs of policy analysis and advice and to differences in data availability and reliability. This paper is presented in four parts. Section 2 gives an overview of the rationale for monitoring, the relationship between policy monitoring, quantitative modelling and evaluation, and the basic menu of choices of indicators. Section 3 provides a brief review of the studies that have calculated the extent of agricultural support in developed countries since 1973 and of the comparable exercises that have focused on developing countries, mainly published since 1990. For each study we mention the purpose and objectives of the studies, the indicators developed, and the commodity, country and policy coverage. Emphasis is given to comparative studies across countries that follow a common methodology at the project (study) level: there are, of course, numerous estimates of protection indicators for individual countries, but these are not reviewed here. In light of the apparent “success” or “failure” of the studies mentioned above, and of the authors’ experience with many of them, Section 4 identifies several areas that in our opinion deserve special attention in the planning of the FAO-sponsored studies. We attempt to provide insights into methodological, computational and logistical problems that might be faced by FAO. Section 5 presents a possible methodological approach that might be used by FAO for the development of agricultural policy indicators for the Tier I countries, and elaborates on the suggested coverage, definitions, classification criteria and methods of calculation. This last section is intended to take into account the varied interests of Consortium members and particularly the needs of the FAO Economic and Social Department.
2 THE CHOICE OF INDICATORS FOR POLICY ANALYSIS What is policy monitoring? Why should agricultural polices in developing countries be subject to monitoring? What aspects of those policies should be monitored? What indicators are available to be used? And how should one proceed to develop those indicators in a constructive and transparent manner? These questions are central to the theme of this paper, and so some basic definitions and propositions are useful at the outset.

2
In this paper we define the process of monitoring a policy or set of policies as assembling quantitative (and in some cases qualitative) indicators that can be traced over time and compared across countries. The indicators themselves are inputs into the distinct processes of quantitative modelling of market and trade effects of policies and the assessment of how well the policies are achieving their objectives. Thus for monitoring to be useful it should provide a framework for the regular collection of data and have as its output indicators that can be used directly in further analytical work. But it is important that the indicators be distinguished from the results of that further analysis: the most common problem with policy monitoring is the tendency of the casual user to read more significance than warranted into the reported level of the indicator. Such policy indicators should be thought of as necessary building blocks for models and evaluations, not as an end in themselves. The reason to monitor policies is likely to vary by country. For developed countries, much of the interest surrounding policy monitoring has focused on the impacts on trade. For developing countries, the key issues are more likely to be on domestic performance of the agricultural sector. The main questions that such a monitoring system would address would be the extent to which the polices of the country concerned are influencing, in a positive or a negative way, the performance of the sector. Subsequent uses of the quantitative indicators derived in the study could include the trade impacts of policy change or the impacts on producers and consumers in the country of trade policy changes. But the main objective of the monitoring exercise itself is to benchmark the set of policies currently in place. The definition of monitoring used here implies that the answer to the question “what should one monitor” is itself crucially dependent on the end-use of the indicators. For present purposes we assume that the objective of FAO (and the Consortium) is to provide countries with information that will be useful in their attempts to improve agricultural policies. This suggests that the policies that are the target of the monitoring are clearly identified and that these policies are under the control of the government concerned. Specifically this means that a “policy” is considered as a conscious act of legislation as opposed to a circumstance or economic condition.1 How should one monitor such governmental actions? The method that seems to best to provide the input into decision making is to measure the effect of the policy on the incentives of the actors in the sector concerned and on their capacity to react to those incentives.2 It is convenient to translate those incentives into a quantitative indicator in the price dimension, as a rate of protection, a rate of assistance or a subsidy equivalent. 3 The appropriate measure for capacity is more likely to be investment or spending on capacity increases rather than being represented in the per unit (price) dimension. Other policies operate at the macroeconomic level and will be expressed in terms of overall taxes or subsidies to the sector through the operation of the price system. Regulations also reflect policies and their impact must be considered in any full analysis of the incentives to the agricultural sector. A variety of indicators are available for the purposes of monitoring in a price dimension the incentive effect of agricultural policies. Six of the most usual measures are shown in Table 1. The most
1 An example may make this clear. If the agricultural sector in a developing country is inadequately served by roads to connect with urban markets, we do not identify the under-provision of roads as a “policy”. In this case the policy is the investment in roads, and would be monitored as such. The indicator may show that this investment is low by various standards, and quantitative analysis may suggest the benefits from increasing such investment. By the same token, if a country chose to have no protection or intervention in a market this would be monitored as “no policy” rather than a policy to allow market forces to determine prices and trade. 2 Of the alternative methods of monitoring, a purely qualitative description of polices has limited use in policy analysis and in cross-country (or even over time) comparison. Indeed, quantitative monitoring takes as its premise that qualitative information about policies is inadequate in itself, though it is often a useful complement to qualitative monitoring. 3 Some policies would be easier to handle in the volume dimension (quotas, acreage restrictions, etc.) but then these policies would need to be converted to a price measure to be aggregated into convenient indicators.

3
straightforward measure is based on the standard analysis of a tariff: the nominal rate of protection (NPR) is given as the increase in the revenue per unit (producer price) in the presence of the policy relative to that which would be obtained in the base (no-policy) state. The adjusted nominal rate of protection (ANR), also found in tariff studies, measures the change in net income per unit, taking into account any taxes and subsidies on purchased inputs, relative to income per unit in the no-policy state. The effective rate of protection (ERP) takes into account the change in value added per unit of output but relates it to the no-policy value added. The added information gained by tracking changes to value added rather than revenue per unit (adjusted or not for input taxes) comes at a cost in terms of more data: all non-factor inputs have to be accounted for regardless as to whether their prices are affected by the policies under study. The choice is therefore governed by available resources and data and by the set of policies whose effects are being measured. In agricultural policy, as discussed below, an additional set of indicators not so focused on border tariffs has become useful. As countries have moved from price protection (at the border or through subsidies on outputs or inputs) to income protection, it has been necessary to include direct payments and other forms of non-price subsidy. Particularly in the situation of developed countries, it became evident that the analysis of agricultural support would be incomplete without consideration of the influence of government outlays on farmers’ returns in the form of capital grants, input subsidies, and various other transfers involving government expenditures. Thus the nominal rate of assistance (NRA) was developed to record the change in income as a result of both price and direct income support as a proportion of income in the no-policy situation. The effective rate of assistance (ERA) measures the same change relative to value added in the no-policy case. Finally, the producer subsidy equivalent (PSE) measures the transfers through price and non-price policies as a proportion of with-policy income.4 If tariffs are the only protective measure used, and there is complete price transmission from border to domestic prices, the NPR is a good approximation of the impact of protection on domestic producer prices. Principal data sources in this case would be the tariff schedules of the countries concerned, and the specific policy information needed would be minimal.5 Where non-tariff barriers to trade such as import quotas, or export subsidies are in operation, then the tariff-equivalent measure of both tariffs and non-tariff barriers is more appropriate. Thus, even when border measures predominate, an important decision has to be made as to whether to rely on explicit border measures (e.g. tariff schedules), or alternatively to estimate the tariff equivalent of tariffs and non-tariff barriers by a direct price comparison approach.6 However, it is important to note that the NPR measure takes no account of the possible effects of protection for major tradable inputs used in a particular product or production process. Resources move between alternative activities not according to the gross revenue from the sector but in accordance with the return to factors employed in that sector. Thus, even when protection is given mainly at the border, a measure of protection that involves value-added, such as ERP, is useful.
4 The fact that the PSE, in contrast to the other measures, uses the policy-inclusive base as the denominator, is not a significant difference. The transformation to no-policy base can easily be made if this is problematic. It was chosen originally to allow the intuitive interpretation “x percent of income comes from support”. Similarly, the ERA is often calculated with the policy-inclusive value-added as the denominator to avoid having to work with a small or often negative non-policy value-added. 5 This is not always straightforward, however, as there is often a difference between bound and applied tariff rates and different rates for imports coming from different sources. These issues will be taken up later. 6 Based on the identification of the point in the marketing channel from which domestic producer prices and corresponding border-price equivalents can be contrasted, such as the price paid at the buying agency for wheat (usually the flour mill), or at the slaughterhouse for pigs, or at the milk processing plant. It is seldom the farm gate price. After the border price has been transformed into domestic currency, all costs relating to transport, storage, loading and marketing, as well as taxes and subsidies to trade in the commodity in question, must be subtracted from/added to the border price up to the point in the marketing channel where domestic and border prices can be compared.
4
The more inclusive measures of protection were developed in large part because the protection given to agriculture at the border is only one part of the impact of policies. The concepts of NRA, ERA and PSE were developed in an attempt to measure in one integral measure the effect of both price and non-price related interventions on farmers’ income. The exchange rate is explicitly involved in the calculation of both NPRs and ERPs in so far as it is used in comparing domestic to border prices. Therefore a misalignment of the exchange rate can significantly affect the measures of the protection given to agricultural goods. It was concern about the possible exchange rate misalignment in developing countries that induced economists in the 1980s to incorporate some measure of this exchange rate phenomenon in the measures of agricultural protection, and to calculate what is often referred to as the “indirect” rate of protection. 7 Moreover, the “domestic” measures that aim to include the effects of policies inside the border are also impacted by exchange rate misalignment. So long as any of the goods purchased by the farm sector are “tradable” their price will tend to reflect exchange rate conditions.8 In practice, the calculation of NRA, ERA and PSE does make use of border price comparisons, and so the exchange rate is crucial to the estimation process. Less easy to categorize are the possible measures of structural policy, factor market conditions, and regulations regarding health and safety. Conditions in the factor markets are important to agriculture, and the provision of infrastructure is an important aspect of government policy. In practice, limited quantitative evidence is likely to be available on the impact of structural policies. However, as discussed below, some indications of the possible effects of these policies on the farm sector should be available. In most developing countries an important role of government is to identify the main bottlenecks in infrastructure, marketing, regulations on health and standards, water markets, and other factors that affect the competitiveness of agriculture and to design appropriate interventions for their removal. However, making such calculations necessitates investigating the whole production and marketing chains to perform such analysis. As a consequence, it is rarely done in cross-country studies. We suggest below that such a systematic analysis of the food chain be a part of the policy monitoring only in those cases where reliable information, or the means to collect it, is available. The following discussion illustrates the way in which this menu of measures has been employed in agricultural policy monitoring.
3 PREVIOUS POLICY MONITORING ATTEMPTS The first systematic attempt at monitoring agricultural policies was undertaken by FAO thirty years ago. The genesis of the efforts to monitor agricultural policies in the 1970s was the necessity to understand and quantify the impact of agricultural protection in developed countries on world markets and hence on agriculture in developing countries. It had been recognized since the 1950s that developed country price support policies generated surpluses and restricted import markets to the detriment of world trade in farm products. GATT reports had called for the development of quantitative indicators to facilitate international negotiations, but these had not been forthcoming (GATT, 1958 and 1962). Some quantitative modelling had been attempted, but this suffered from the lack of information about the nature of the policies themselves and about their quantitative dimensions (see for instance the model by UNCTAD).
7 Strictly speaking, indirect protection at least in the Krueger, Schiff and Valdés approach is not confined to exchange rate misalignment alone; it attempts to capture also both the influence of industrial protection and of macroeconomic variables (specifically, the “excess” deficit in the current account) on relative prices from an economy-wide perspective. 8 Conceptually, the return to factors producing exclusively non-traded goods and purchasing no traded inputs (as might happen in low-income subsistence agriculture) is not influenced by the exchange rate, but the purchasing power of those factor incomes will still be influenced by the traded goods sector. In practice, it may make sense to concentrate on tradable goods, as the impact of policies in such a case would be much more direct.
5
3.1 Developed country studies All the early studies on agricultural protection in developed countries had a “trade distortion” focus, though some had as an objective the improvement of domestic efficiency as well as the reduction of externalities. This implied an emphasis on policies specific to particular commodities, on price as opposed to non-price policies, and on short- and medium-term policies rather than long-term structural and technology policies. All took into account policies that directly impacted on prices, but all ignored factor markets. Most of the studies also ignored exchange rate misalignments, though it was understood that exchange rate changes were significant in agricultural markets. All were “partial” in nature, ignoring the impact of non-agricultural policies on the agricultural sector. Four attempts to measure agricultural protection in developed countries will be discussed below. These include the FAO International Agricultural Adjustment (IAA) work, initiated in 1973 and updated and expanded through 1985, which introduced Producer and Consumer Subsidy Equivalents (PSEs and CSEs); the OECD PSEs, published regularly from 1986 until the present; the USDA PSEs, calculated for a different group of countries and published from 1985 to 1992; and the WTO AMS notifications, made by every member that entered domestic support commitments in their schedules (mostly developed countries) from 1995 to the present date. FAO International Agricultural Adjustment The first systematic attempt to monitor developed country farm policies was undertaken in the context of a study on international agricultural adjustment, the way in which the agricultural economy of the world adjusted as countries interacted with each other through trade and aid and influenced each other through their domestic policies (FAO, 1973, 1975). The project was motivated by the realization that these policies were having a profound impact on world markets for agricultural goods. The 1973 paper lays out the rationale for monitoring such policies and the links with the issues of trade liberalization in the GATT. Two main indicators were developed: the Producer Subsidy Equivalent (PSE), and the Consumer Tax Equivalent (CTE).9 Several measures were developed as potentially useful for trade talks, including the tariff equivalent (TE, calculated as a weighted average of PSE and CSE) and the Foreign Exchange Displacement (FE) of the policies, designed to indicate the magnitude of the external impact of a country’s agricultural policies.10 The estimates developed in this paper, as an illustration of the method, were for five countries (Canada, France, Germany, the United States and the United Kingdom) and five commodities (wheat, barley, maize, milk and sugar). The time period for the data was 1968-70, and policy detail was from published sources. The report was presented to the FAO Conference in 1973 as a part of the plans for a regular monitoring of IAA. The 1975 paper revised the method and terminology somewhat, and developed the link with trade negotiations. The consumer indicator was re-labelled the Consumer Subsidy Equivalent (CSE) and its sign changed. PSEs and CSEs were calculated for six countries (adding Australia and Japan and considering the EEC as one unit) and six commodities (including rice), over the period 1968-74. The longer time period gave an opportunity to judge the usefulness of the indicators at a time of variable world prices. The international impact of these policies was monitored by means of the Trade Volume Effect (TVE), calculated, as in 1973, from information on elasticities of supply and demand and the PSEs and CSEs.
9 These measures were expressed in both per unit and percentage terms. In addition, the actual values of the transfers were calculated as the Producer Subsidy Value (PSV) and the Consumer Burden (CB), along with the Exchequer Cost (EC) and the effective protection. These were grouped as “domestic performance measures”. 10 Two further indicators were also presented in that report, one the ratio of the TE to the PSE represented the extent to which the transfers captured in the PSE are trade distorting, and the other the ratio of the FE to the PSV reflecting the external impact per unit of transfer.
6
Regular reports on the process of international agricultural adjustment were given to governments at the FAO Conference in 1977, 1979, 1981, 1983 and 1985. In each of these reports the PSE and CSE was presented as evidence of the evolution of their agricultural policies in the context of the IAA Guidelines.11 As the interest in the IAA guidelines waned, the quantitative monitoring proved less urgent for FAO: by the Seventh IAA Progress Report in 1991 the OECD PSE estimates (see below) had replaced those from the FAO in the monitoring of the developed country policy guideline. OECD trade mandate The Organisation for Economic Cooperation and Development (OECD) has a long-standing interest in agricultural policies, but reports on the topic tended to be qualitative and descriptive. In 1982 the OECD Ministerial Council committed itself to the task of tackling the problems of agricultural policies and their effects on trade (Legg, 2003). Ministers approved a Mandate that required the Secretariat to analyze “approaches and methods for a balanced and gradual reduction in protection for agriculture and the fuller integration of agriculture within the open multilateral trading system”. In doing so they were to conduct an examination of national policies that have a significant impact on international trade. The 1987 report (National Policies and International Trade) was the result of this endeavour (OECD, 1987). Modelled on the FAO PSEs, but with important differences, the OECD began to monitor domestic agricultural policies of its members and calculate subsidy equivalents for the major commodities. The focus of the OECD work was on the need to reform domestic policies in part to avoid trade impacts but also to improve domestic policy targeting. The OECD methodology, as it has developed over time, now comprises a three-part classification of policy measures. The PSE itself is made up of Market Price Support (MPS) and Budgetary Payments; the General Services Support Estimate (GSSE), including research and development, infrastructure, marketing and promotion payments and inspection services; and any transfers from taxpayers to consumers (see Table 2). The total of these three items is known as the Total Support Estimate (TSE). This is equivalent to the sum of transfers to consumers and producers less any budget revenues, such as from import tariffs. The OECD PSEs represent the most ambitious attempt to date in monitoring agricultural policies. The PSE data set is both the longest series of quantitative policy indicators (in any sector) and the most inclusive in terms of countries and commodities.12 It is also unique in that government officials and statisticians tackle part in the oversight of the estimates, giving the resulting estimates an implicit degree of approval. As a result it has widespread acceptance among governments and the media, and is the most frequently used measure for modelling policies and constructing models with policy variables.
11 The IAA reports were grouped around eleven guidelines endorsed by governments at the 1975 Conference. The FAO Director–General was required to report progress toward meeting the objectives of the programmes Guideline 3 stated that: “National policies of developing countries should provide appropriate incentives for farmers to expand production and to promote the adaptation of structures within farming both to permit optimum use of available and suitable technology, and to promote social equity and fuller integration of the rural population into the national economy; national policies of developed countries should aim at the most rational use of their resources, having regard to the special needs and interests of developing countries and taking into account the need to ensure world food security.” The policies of developing countries were not systematically monitored, but the PSEs gave an indication of the trends in the levels of support afforded to developed country producers. 12 In 1999 the OECD changed the label from Producer (Consumer) Subsidy Equivalent to Producer (Consumer) Support Estimate, thus retaining the acronym. Several member states of the OECD had been unhappy with the implication that all measured programmes were “subsidies” and preferred the more neutral term “support”. Of course the phrase “support equivalent” never did imply that the transfers were themselves in the nature of subsidies.
7
USDA PSE and CSEs The United States government showed an early interest in the monitoring of domestic farm policies in the OECD countries, but decided to calculate its own PSEs (USDA, 1987; 1988).13 The work was undertaken by the Economic Research Service of the United Stats Department of Agriculture (USDA), and continued for a number of years. Although the United States was included in the ERS-calculated subsidy equivalents, they were primarily devised to indicate extent of protection in other countries, and hence be useful in support of United States objectives for trade liberalization in the Uruguay Round.14 The countries included in the study were those of significance as markets or potential export competitors. As a result, several developing countries were included in the USDA estimates, in contrast to the OECD PSEs that were being developed at the same time. The results indicated the extent of subsidy and tax implied by the policies included in the study, a similar range of policies to that chosen by the OECD (see Table 3). WTO AMS Notifications The World Trade Organization also monitors agricultural policies of member countries. The Uruguay Round Agreement on Agriculture included the provision for monitoring compliance with commitments to reduce domestic support that was deemed to be trade distorting. The commitments were expressed as an Aggregate Measure of Support (AMS), known popularly as the amber box (WTO document WT/AG/NG/S/1, 2000). Though based loosely on the OECD PSEs, the concept of the amber box is somewhat different from the PSE, as it is based largely on budgetary payments and the implied transfer of administered domestic prices relative to a fixed reference price. Thus it includes some support that would otherwise be captured in the price effects of border measures (in effect double counting this support, as it is also monitored in market access and export subsidy commitments) but it excludes many elements of subsidy that are included in the PSE. Thus, total domestic support as measured by the WTO includes transfers in the green and blue boxes, the special and differential treatment category for developing countries, a de minimis exemption and the Aggregate Measure of Support (AMS), in turn comprised of market price support and budgetary payments. The relation between these measures is illustrated in Figure 1. 3.2 Developing country studies Measurement of protection levels in developing countries lagged behind that in developed countries, though protection indicators were measured for individual developing countries in the 1970s and 1980s. 15 However, primarily through several studies organized by the World Bank, a small number of cross-country support and protection estimates emerged in the 1990s. Other institutions followed up
13 Among the reasons for an alternative set of estimates was the fact that the United States had an interest in protection in non-OECD countries; the convenience of being able to choose commodity and policy sets for particular purposes; and the fact that there was a long lag before the OECD countries authorized the release of the PSE calculations. 14 The United States proposed the use of the OECD PSEs as a negotiating mechanism in the Uruguay Round. This was broadly agreeable to the Cairns Group but initially rejected by the EU. However, the EU itself proposed a “support measurement unit” based on fixed reference prices. The eventual Aggregate Measure of Support was variant on these measures, including administered prices and subsidies but not the impact of border measures. 15 To our knowledge the first comparative studies measuring protection in several developing countries were the study commissioned by the OECD: Little, Scitovsky and Scott “Industry and Trade in Some Developing Countries”, Oxford University Press, 1970, and by B. Balassa, “The Structure of Protection in Developing Countries” J. Hopkins University Press, 1971” Although focused on the industrial sector, both studies discuss the potential bias against agriculture created by the protection of industry. Both studies use the Effective Protection framework.

8
on this work, particularly the International Food Policy Research Institute (IFPRI) and FAO. This section reviews experience with a number of these studies.16 World Bank The World Bank has been the leading proponent of the monitoring of developing country policy in the agricultural sector. The earliest and most comprehensive study in this area was a large cross-country analysis of the political economy of agricultural pricing policy (Krueger, Schiff and Valdés, 1988, and Krueger, Schiff and Valdés, 1992). The study covered 18 developing countries during the period 1960-1985. It reports the NPR for the major import-competing and export activities distinguishing between “direct” and “indirect” effects of sectoral and economy-wide policies. NPR estimates follow a direct price comparison approach. The direct price comparison between border and farm prices adjusted for transport costs to or from producer and consumer locations, storage costs, quality differences, and other elements in the marketing margins, at the prevailing nominal exchange rate. The “indirect” nominal protection rate was measured as the proportional difference between the domestic agricultural price in relation to a price index of the nonagricultural sector, on the one hand, and the value of the relative price when measured at the equilibrium exchange rate and in the absence of industrial trade interventions, on the other hand. There are three major elements on the calculation of the indirect effects. First the depreciation of the real exchange rate required for the elimination of the non-sustainable part of the current account deficit; second, the depreciation of the real exchange rate due to the removal of trade interventions; and third, the increase in the price of agricultural tradable products relative to non-agricultural tradables due to a removal of industrial policy interventions. The first two are changes in the price of tradable relative to non-tradables; the third is a change of prices within the tradable category. On average, the net effect of direct and indirect interventions has been an enormous income transfer out of agriculture – averaging 64 percent of agricultural gross domestic product a year during the period 1996-84. Indirect effects were the main source of this implicit and explicit taxation of agriculture. More recently the World Bank undertook a surveillance of agricultural price and trade policies in Latin America during major policy reforms (World Bank, 1996). This study covers eight countries during the period 1984-1994. The study examined how agricultural protection had changed since the initiation of economic reforms in these countries, what happened to real farm prices, and what was the current status (at the time) regarding tariffs and quantitative restrictions in the various countries. Using a direct price comparison approach, the study reported NPRs, ERPs, PSEs, and ERAs for the major agricultural import-competing and export activities. This analysis did not adjust for a possible misalignment of the exchange rate. The study presented a “decomposition analysis” to examine the relative effect of fluctuations in the real exchange rate, border prices and domestic trade policy on the evolution of domestic real farm prices. An analysis of the evolution of producer prices shows that between 1986 and 1995, in seven out of eight countries, all major agricultural producer prices declined in real terms. For most countries, the decline for both importables and exportables was larger during the reform period than in the previous years. The main factor explaining the decline in real domestic farm prices was the exchange rate appreciation observed during the early 1990s, a phenomenon that was amplified by tariff reductions and, in some cases, by a fall in border prices. This fall in real farm prices led to increased political pressure by farmers for protection of import-competing sub-sectors. A further study by the World Bank monitored agricultural support policies in transition economies (World Bank, 2000). This study covers six transition economies during the period 1994-97. Using a direct price comparison approach, the study presents various estimates of agricultural support policies,
16 There are several quantitative models that make use of protection estimates for developing countries. Some are general equilibrium and some are partial equilibrium. These include the GTAP model (T. Hertel et. al.) and those employed by the ERS/USDA, the OECD model, the IFPRI model (Rosegrant), the IMF model, Capri, the Australian ABARE model, and the FAO-UNCTAD model. These models rely on WTO-provided estimates of the actual tariffs (often through the TRAINS database) for developing countries, as PSEs are not available except for the very few which are OECD members (Mexico, Turkey, Korea, Poland).
9
including trade and price policy interventions and government non-price related subsidies on production incentives and on net farm income. The study examined to what extent the economic environment prevailing in 1994-97 provided an appropriate and sound basis for adjustment towards a more internationally competitive agricultural sector. Based on a common methodology for all countries, the study reports estimates of NPRs, ERPs, and ERAs for the major agricultural import-competing and export activities. The report presents a synthesis of the various indicators for all the countries included, which is followed by individual country agricultural policy notes describing the salient features of agricultural policies at the time. This study does not adjust for a possible misalignment of the exchange rate, though it does present a “decomposition analysis” to examine the relative effect of fluctuations in the real exchange rate, border prices and domestic trade policy on the evolution of domestic real farm prices. EU North Africa In addition to the World Bank studies mentioned above, other institutions with an interest in developing country policy have begun to be active in the area of monitoring. A cross-country comparative study on agricultural policies in North Africa has been undertaken on the initiative of the University of Montpellier, in France, with funding from the European Union. This study, entitled Le soutien aux produits agricoles et aux filières agro-alimentaires reports estimates of agricultural support measures for Egypt, Morocco, Turkey, and Tunisia for the period between 1994 and 1999. The study is directed by Petit and Allaya at Montpellier, and the project commissioned the studies to local economists in these countries. The study estimates NPRs and ERPs by direct price comparison at the prevailing nominal exchange rate. The terms of reference for the project follow the approach used in the World Bank studies on Eastern Europe and Latin America described above. It is a partial equilibrium study, with no adjustment for the “indirect effects” that were included in Krueger/Schiff/Valdés. On product coverage, for example, the study on Morocco covers wheat (soft and hard wheat, and rain-fed and irrigated as separate activities), sugar (sugar beet), milk, all import-competing activities, and on exportables covers oranges and tomatoes. The treatment of water pricing for irrigation is of particular interest in these countries and it is discussed in these studies. There was a considerable delay in the submission of the final reports, due primarily to “mobilisation des équipes nationales”. FAO/ROA and IFPRI South Asia Studies In addition to those studies mentioned above, two other projects should be mentioned. The on-going FAO study on the Roles of Agriculture (ROA) includes a component on agricultural support measures. This study includes a total of 11 countries in Asia, sub-Saharan Africa, North Africa and Latin America. This analysis presents estimates of nominal and effective rates of protection for the late 1990s, for the major agricultural import-competing and export activities (approximately six activities in total). Preliminary results of this study were presented at an FAO workshop in October 2003. Work at IFPRI is underway on protection in South Asian agriculture, directed by Ashok Gulati. A study on agricultural protection in India has been published (Gulati and Narayanan, 2003) building on earlier work by Gulati and Purcell for the World Bank. The World Bank study followed the Krueger/Valdés/Schiff approach. The latter book emphasises the offsetting impacts on Indian agriculture of taxes on inputs and subsidies on outputs, leading to net negative protection for several crops. As this work is not yet cross-country in scope it will not be reviewed further here, As this work is not yet cross-country in scope it will not be reviewed further here, but IFPRI’s planned studies will be complementary to any FAO work.
4 METHODOLOGICAL ISSUES AND LOGISTICAL PROBLEMS In this section we identify several methodological, computational and logistical issues that in our opinion deserve special attention at the planning stage of the project. The choice of indicator depends
10
in part on the availability of data, but the data should not drive the design of the study. More important is the intended use of the indicators and the predominance of particular policies in the Tier I countries. The methodological soundness of the framework for collecting and analyzing the policy data is a necessary if not sufficient condition for a convincing outcome. Computational considerations can sometimes influence the choice of indicators and logistical issues will also play a part in study design. 4.1 Methodological Issues The key methodological issues are well illustrated by the range of studies discussed above. They include the range of commodity indicators to be included; the need to incorporate economy-wide impacts; the issue of inadequate marketing infrastructure and the impact of this on protection measures; the difficulties in adequately measuring government spending; and the problems of assigning public goods where pricing methods are not in place. The selection of indicators of agricultural incentives The methodological basis for the majority of the monitoring studies is that there are essentially two types of direct incentive policies widely employed by governments in the agricultural sector: agricultural price interventions and direct government subsidies. Market price support operates directly through price-related interventions of outputs and purchased inputs. This support derives from domestic price interventions (for example minimum-price policy) supported by foreign trade barriers such as tariffs and quantitative restrictions on both imports and exports. Most of the studies listed above for developing countries have used NPRs and ERPs to capture the domestic price interventions, by direct price comparison between border and domestic farm prices adjusted for margins and quality differences. ERPs are relevant because most countries do have interventions affecting tradable inputs and the share of such inputs in the unit cost is significant for several activities. Analysis based on NPRs only would generally understate true protection, and considering government outlays on tradable inputs misses the effect of trade barriers on import-competing inputs. This analysis has been complemented in some studies by ERAs and PSEs so as to capture government expenditures by direct price comparison. The modelling studies generally used actual tariffs as reported in the WTO, or PSEs in the case of OECD members. The debate on agricultural support in some regions traditionally focused on the evolution of domestic terms of trade (prices received relative to prices paid) relative to a base period. This is the case for example in transition economies. However, relative prices such as these fail to capture the misalignment of policies and incentives in the base period. Moreover, the cornerstone of agricultural policy today is that prices paid by farmers for inputs and the prices paid for their products should be similar to the real value of those goods to the economy as a whole. That is for products that can be traded internationally, they should pay and receive prices that are close to international prices. For this reason, we suggest the indicators should focus on the effect of prevailing policies in any given year relative to world prices of output and tradable inputs for that year, which is what was used in most of the studies listed above. Accounting for economy-wide intervention Previous analysis has shown that for some countries, the so-called Indirect Effects in the have been significant, in fact overwhelming the effect of sector-specific policies on agricultural incentives.17 We believe that the magnitude of these Indirect Effects has probably diminished somewhat during the late 1990s and early 2000s, partly due to the reduction in industrial protection in many countries, and due also to better macroeconomic policies. Thus, for example the magnitude of the exchange rate misalignment could be lower today than it was 10-20 years ago. But the issue remains for several countries. A major issue in the domestic debate is the influence of changes in the real exchange rate as
17 The issue is discussed in detail in Schiff and Valdés (2002).
11
it affects the competitiveness of the tradable agricultural sector. Even in some countries such as Chile, with a low current account deficit (relative to GDP), ample foreign exchange reserves, a floating nominal exchange rate regime and few exchange restrictions, the real rate has experienced considerable variations. The extent of misalignment is becoming a more complex analytical issue today vis-à-vis the 1980s, considering in particular the implications of a more open capital account. The computation of Indirect Effects for every country might be too complex an undertaking for all countries covered in the FAO project. We suggest that this adjustment be limited to a subset of countries, those with better data and more experience in the analysis of economy-wide effects. However, at the very least, for all countries we would suggest documenting the evolution of the real exchange rate through time, so as to assess the possible impact on private returns in agriculture.18 This would not capture whether there is misalignment as such. Choosing how to handle the monitoring of exchange rate disequilibria is a difficult decision. On the one hand, there is ample evidence of the strong influence that the exchange regime has had on the competitiveness of the tradable sector of agriculture for many developing countries in the past (Schiff and Valdés, 2002). But the study of the exchange rate phenomenon has become increasingly more complex in a world of more open capital accounts where one would expect changes in the “equilibrium” exchange rate unrelated to relative inflation rates or trade balances. Beyond the case of a clearly unsustainable nominal exchange rate, policy prescriptions to correct misalignment are neither obvious nor unambiguous. Thus, what would be practical guidelines for the whole set of countries? In our view, all countries should report the evolution of the real exchange rate (price of tradables to non-tradables), but the analysis in depth of the nature and magnitude of the exchange rate misalignment using the Krueger/Schiff/Valdés methodology should be restricted to those countries with the necessary data and expertise in this topic. What is practical and simple enough for other countries is open to doubt. The purchasing power parity (PPP) exchange rate is simple to compute, and useful to have, but does not capture exchange rate misalignment. Structural impediments and marketing margins The application of the direct price comparison approach raises some methodological issues when distinguishing between explicit trade and price policies and the presence of structural impediments. One issue is whether to adjust for excessive margins in marketing. A high producer price/border price margin could be due to poor physical and institutional infrastructure, an uncompetitive processing industry, or the high intermediate transaction cost for traders due to erratic policy changes regarding QRs on imports and exports. Although they do not result from explicit government policies on agriculture, these high margins indirectly tax farmers by raising the cost of moving and processing domestic production. This indirect taxation could be interpreted as a policy failure that weakens competitiveness in upstream and downstream activities. Thus, it is important to distinguish between trade and price policies (which can be corrected quickly) and structural flaws in the market (which take longer to correct).19 Measuring government outlays There are several issues to be considered in the measurement of government outlays on farm programmes. One is what items to include, and the selection depends on the indicators and objective of the FAO programmes. Josling and Tangermann (1989) present a discussion in the context of the
18 For many developing countries the Central Bank computes the real exchange rate, in most cases defined as the ratio of the price of tradables to non-tradables relevant for the country in question. Furthermore, in their country specific analysis both the IMF and the World Bank usually report estimates of the real exchange rate. 19 A relevant example is the case of Mexico, where the observed negative NPRs were largely attributed to “excessively” high domestic marketing margins, the result of uncompetitive structure in transport and local markets (Ch. 15, World Bank, Mexico 2001).
12
PSE measures. If one wants to measure income transfers associated with government expenditures the list of budgetary items can become very long. For example in the study on transition economies (Valdés, 2000), the section on Turkey contains a table with a detailed description and corresponding values of more than 40 items through different government agencies to be included as government expenditures for agriculture during 1993 (Valdés, 2000, Table 5, p. 118). Another issue is that the data on government expenditures is usually available only at the sector level, not at the commodity level. The allocation of government expenditures to commodity production systems is either arbitrary or requires extensive further analysis. The OECD solution is to have a category of support labelled “general support expenditures” that are not allocated by commodity. Similarly, the WTO monitoring of domestic support included a category for “non-product specific” support. Unless government payments are specifically tied to commodity production, this approach is probably the most satisfactory. A further consideration arises from using the central government budget as a source for tracking down government expenditures on agriculture presents many challenges. For example in Russia and Brazil, reported federal government outlays do not include state and municipal outlays. This is also likely to be particularly important in other countries with a federal system. Hence it is best to collect information on state outlays in addition to federal outlays in the case of “federal” countries. Municipal outlays on agriculture, however, are probably less important in most countries. In addition to these problems, actual expenditures (ex-post) could differ from budgeted outlays, though it is the former that is more relevant. But actual expenditures are often more difficult to collect, and available only with a lag. However, in principle one should ask consultants to try to get the actual outlays, instead of simply reporting budgeted outlays. Finally, government figures on support to agriculture can vary according to which governmental source one used. For example in Russia budgetary support to the credit in kind programmes appeared as a reduction in revenue, rather than an item on expenditure. Furthermore, there were extra-budgetary funds for agriculture from a tax on gross revenues of enterprise in all sectors of the economy. In addition, a portion of government support also takes the form of mutual clearing of obligations. One implication of this is that the figures reported by the Ministry of Agriculture on government support to agriculture differ from figures from the Ministry of Finance and the National Statistical Committee (Valdés, 2000). Public goods in the absence of pricing One problem of allocating the benefits of subsidies over agricultural enterprises is that of assigning values for public goods. The case of water rights and the scale of charges for the use of water is an illustration of this problem. Subsidized water charges for irrigation are a common feature in many developing and some developed countries. For example this is the case in India and Pakistan, most of North Africa and the Near East, and many other countries. Adjusting for the implicit subsidy on water charges in ERP estimates has been attempted in a few studies, such as for Egypt (Word Bank Agro Export Strategy Report – 2000) and for India (Gulati, Ashok and G. Pursell, Liberalizing Indian Agriculture: An Agenda for Reform, Trade Policy Research Department Working Paper 1172, Washington D.C.: The World Bank - 1993), but it is difficult due to the absence of a reference price due to the lack of an open market for water rights in many countries. The situation is different for countries that moved to tradable water rights (independent of land transactions) such as Australia, Chile and Mexico. The incidence of income transfers to agriculture Even when we have data on government outlays, often we are unable to differentiate whether these expenditures really represent income transfer to farmers, or if they in fact capture transfers to input suppliers, to the agro-processing industry, or simply reflect the cost of an excessive bureaucracy. As
13
an illustration, in the case of Turkey, according to official statistics on government outlays for agriculture (and in the OECD report for the country), fertilizer subsidies are listed as part of the transfer to farmers. However, imports of fertilizers (nitrogen) were taxed with a high tariff. Thus, doing the price comparison showed that the subsidy was only a partial compensation for the protection to the domestic fertilizer industry. The standard measure of government outlays overstated the true transfer to farmers. Commodity coverage of the study Choosing the appropriate commodity coverage is an important part of the design of the monitoring study. Should it include the major tradables only, or should it be extended to the whole sector? On the one hand we could get data on government outlays for agriculture as a whole, but it is difficult to get such data for specific activities. On the other hand, market related transfers usually cover only a sub-sector – albeit a representative and large component - of the tradable sector of agriculture, and including the non-tradable sector in the analysis of market related transfers would not be relevant. Drawing the line between tradables and non-tradables can sometimes raise many questions. Is the share of trade in total consumption of the product the right criterion? Or, instead, should one examine the process of price formation in domestic markets? The situation is pretty clear for several products in most countries, but there are sub-sectors where this distinction is fuzzy. Computational and interpretation issues related to Effective Protection (ERP) In addition to the task of obtaining the data for the border/domestic price comparison for tradable inputs, the computation of the ERP forces the analyst to consider the relevance and impact on the following issues: the definition of non-tradables, choosing between the Corden and Balassa approaches; the validity of the usual assumption of fixed coefficient issue and the possible substitution between traded inputs; the degree of substitution between traded inputs and primary factors; and the interpretation of ERPs, in terms of either the ranking or relative scale of protection. These points will be discussed in turn. The difference between the Corden and Balassa methods of defining tradables can make a significant difference in estimating value added. Corden treats non-traded inputs in the same way as primary factor inputs, in other words it includes them in value added. The Balassa method assumes that non-tradable inputs have a zero level of nominal tariff and places them with traded inputs. Most of the empirical work on ERP estimates in developing countries have used the Corden method, which is probably the best solution. With respect to the degree of substitution between tradable inputs, the usual conclusion is that ERPs calculated from fixed (post-protection) input-output coefficients will bias the estimated ERPs (if σ = 0). The extent of the bias will depend on what can be considered an empirically reasonable range of values for the substitution elasticity (σ) associated with a particular industry. Unfortunately, there are few empirical estimates for agricultural activities in developing countries. The common practice of estimating ERPs has been to assume that the underlying production function is a “fixed proportions function in which the elasticities of substitution are zero. However, in a situation in which input prices are more distorted than product prices the coefficient measuring the proportion of the total cost spent on importable inputs will be understated and the implicit tariff will be underestimated.20 In many cases, traded inputs could substitute primary factors (non-traded inputs), such as for example cereals (import-competing) and forage (non-tradable) in beef and dairy production. A large increase in the price of cereals could induce farmers to expand the area devoted to forage. How this would show up in the calculation of an ERP would depend on whether forage was included as a primary input or
20 A. Valdés (1973), “Trade Policy and its Effects on the External Agricultural Trade in Chile”, Amer. J. Agri. Econ. 55(2), see pp. 159.
14
not. This in turn depends on the answer to the question: Who are the producers: the owners of the firm, or the owners of the factors of production? The common assumption is that the majority of farmers own their land and the capital attached to the land, and that they provide the bulk of the labour input. In the example above, the forage would be a primary input, and hence be a part of the value added. The interpretation of the ERP can either be as a comparison across time or countries or across sectors within a country. The second is the more useful. From the point of view of policy evaluation, one of the most useful results in the ERP computation is to obtain a profile of relative effective protection rates across and within sectors. This forces the policy maker to address the question about why some sectors benefit from an ERP that is substantially higher/lower than other activities, depending on how important are imported inputs into the production process and how they are taxed. The only sure way to guarantee against wide variations in rates of effective protection even when nominal rates are relatively low is to make the rate of nominal protection uniform across all products. When all nominal rates are equal, all effective rates are equal to this nominal rate. 4.2 Logistical issues We would highlight the following logistical and managerial issues as among those that need to be considered: There are considerable advantages to following a common methodology across countries. This emphasizes the need to provide clear guidelines on the methodology before starting the country studies. On the other hand, some flexibility must be given to analysts where there are unique circumstances in a particular country that would make too rigid an application of the common method misleading. Such deviations should be documented and approved by the FAO Task Manager. In our experience, most studies of agricultural policy and protection levels haven taken longer than initially planned. Perhaps the main reason is that the local consultants are over- committed and the project leaders have not been able to put together a team that can proceed within the timing agreed on. This suggests that a realistic timetable be established to prevent frustration and adequate intermediate deadlines and draft reporting schedules be inserted to avoid long periods of low-intensity work by the consultants. The question as to whom to hire as a local consultant is another critical issue. From our experience, we would be inclined to do these studies outside government agencies and with individuals rather than through a contract with an institution. This is due to uncertainties as to the continued employment of the relevant staff, and to difficulties in identifying a person/team within the government agency that could implement the study in time and with rigor. Individuals in universities, or in think-tanks, or independent consultants are, in most developing countries, in a better position to deliver. However, it is also true that local consultants can be over-committed and their jobs can change.Moreover, how the question of country ownership of this work is dealt with is probably important to consider, and at least in some countries it could imply more direct involvement of a government agency in the data compilation and analysis. Some fall-back position needs to be devised so that data and expertise is not lost through consultant non-performance. There is also a need to have a small core of researchers either employed at FAO, or reporting directly to FAO. This team would include the Task Manager of the study, a professional who would able to get involved in the substance of the work and in the preparation and revision of the publication of the results, and some research assistance to monitor periodically the work in progress and check all estimates. This would also facilitate the development of a database for the project at the level of the central team, to include the statistics used by all the countries involved and all the relevant information used to compute the Indicators. Finally, we would like to emphasize the importance of institutional support from FAO, which would be essential for continued effectiveness of such a monitoring programme.

15
5 SUGGESTED METHODOLOGY FOR TIER I COUNTRIES The fundamental problem faced by a policy monitoring study such as discussed here is what data to collect and how to assemble it in a way that is useful for policy analysis and understanding. A secondary problem of how to present and interpret the results is also important but not addressed here, although the range of possible uses and the ease of interpretation must obviously be considered in the design of the data. Our suggestion is to develop a set of measures collectively called Agricultural Policy Indicators (API). These would provide a framework for indicating the magnitude of the incentives given to producers by agricultural policies and the investment in productive capacity in the agricultural sector by the developing country governments. The full set of API would also allow detailed analysis of the effects of national policies on the agricultural sector. The aim is to allow for the tracing of policy developments over time and to be able to establish, through further analysis, the link between incentives and economic performance and policy effectiveness. The API would itself be organized under five “modules.” Specific indicators would be included in each module, but the modules themselves would be separable. They could be collected by different members of the same team or assembled from different consultants. They could also be undertaken by different institutions. But they are deliberately additive, starting with basis information and extending to more subtle and information-intensive indicators. These API Modules are described below. Commodity Market Module The key module that would be included for all countries focuses on commodity markets, including both outputs from the farm sector and purchased inputs (fertilizer, seed, fuel, machinery, water, etc.). Separate calculations would be made for:
• Output market policies (price supports on internal market, direct payments tied to production, etc.). Indicators would include RNPRs calculated by commodity, but these would be able to be linked with the MPS in OECD PSEs for comparability with Tier II countries. The main question to be answered would be: What incentives do producers get from the set of market price policies and other direct support for the major commodities?
• Input market policies (input subsidies and taxes). Indicators would measure incentive/disincentive impacts of input policies, and combined with output policies to give adjusted nominal protection and ERP using a matrix of inputs by commodity. The main question to be answered would be: What is the impact on producer incentives of policies toward input markets?
• Actual applied tariff rates for the major imported goods and the traded inputs, so as to bring out clearly the possible difference between the tariff equivalents resulting from the applied rates and those from the bound tariff rates. Such differences could be associated with the importation of goods from other members of a regional trade agreement. In some cases, actual tariffs or their equivalents may be higher than bound rates, if safeguard or other contingent actions have been taken. Border policies (tariffs and non-tariff barriers, applied rates qualified by preferential access provisions). Indicators calculated as tariff equivalents and reconciled with NPR and MPS measures to give the relationship between border protection and additional protection from domestic supports.21 The main question to be answered would be “How do border policies contribute to the level of incentives afforded by other price policies?”
21 Agricultural protection could also differ from tariffs for products in which a country is autarchic and thus the domestic price fluctuates between the c.i.f. and the f.o.b. price. Measurement problems are more complicated when the imported good is a differentiated product, as the price comparison may require detailed local knowledge.
16
The basic methodology for the commodity market module would be the estimation of the price relationship between the import (or export) price, the domestic producer price and the domestic consumer price. For each commodity, the price gap between import price and domestic price would be disaggregated into border and domestic policy components. Any direct payments and input taxes/subsidies would be included to give a coefficient of the net incentive and net income effects of domestic price policy. Structural Module The second module, important for developing countries, would include measures of structural policy, including both factor market policy and expenditure on infrastructure. Specifically, calculations would be made for the effect of:
• Labour market policies (wage rate policies, training policies). Indicators of net subsidy or tax arising from labour market policies calculated from studies of labour market or estimated by short-cut methods. The main question to be answered would be: Does the government influence the signals coming from the labour market in a way that taxes or subsidizes agriculture?
• Capital market (credit policies). Indicators include capital subsidies calculated from data on lending policies of credit institutions. The main question to be answered would be: Does the government stimulate investment in the agricultural sector by making capital available at a concessionary rate?
• Land market policies (property rights, rental markets). Indicators include qualitative evidence of impediments in the land market as well as indications of the effectiveness of rental markets. The main question to be answered would be: Does the land market inhibit agriculture and if so does government policy address such inhibitions?
• Infrastructure (government investment in rural infrastructure). Indicators include absolute investment levels, levels per hectare or livestock unit, and investment relative to share of rural to national economic activity. The main question to be answered would be: Does government policy provide adequate roads, electricity, water and other infrastructure in rural areas?
• Marketing (policy towards marketing boards and other agencies). Indicators based on analysis of marketing margins and price gradients and contours. The main question to be answered would be: What share of the consumer or export receipts reaches the farm sector, and how does policy affect that share?
The incentives from the structural module would be additive to those from the commodity market module to give the total direct impact of agriculture-specific policy. Macro Environment Module The macroeconomic module is important in most developing countries as the effect of distortions in the economy as a whole can have a significant impact on the agricultural sector. These non-agricultural policies include:
• Macroeconomic environment (exchange rate policy). The indicators would measure the indirect effect of exchange rate disequilibrium, as was done in Krueger, Schiff and Valdés. Alternatively, if the data were inadequate to make such calculations, estimates of PPP exchange rates would be used. The main question to be answered would be: Is there a bias against tradable goods such as agriculture in the misalignment of exchange rates?
• Trade policy environment (non-agricultural tariffs and non-tariffs measures). Indicators would measure the indirect tax/subsidy on the farm sector as a result of the general price level impact of non-agricultural tariffs. The main question to be answered would be How much does the

17
level of protection in the non-agricultural sector influence the profitability of agricultural enterprises?
• Price level and price stability (inflation and general price policies). Indicators of these policies would include levels of inflation, relative prices between farm and non-farm sectors and measures of price instability. The main question to be answered would be: Does the policy toward inflation and price stability encourage or discourage the farm sector?”
The incentives and disincentives given to the farm sector through macro-economic policies would be added to the direct incentive impacts measured by commodity to give a total direct and indirect policy incentive. Regulatory Environment Module Important to the farm sector but more difficult to reduce to quantitative indicators is the regulatory environment in which the sector operates. Increasingly, issues of food quality and safety have come to determine the price that farmers get in world and domestic markets. The main regulatory policies include:
• Food quality (implementation of both product and processing standards). Indicators would mainly be qualitative, classifying such policies along lines of instruments and policy scope. The main question to be answered would be: Does the government have in place regulations to promote appropriate quality control and ways of helping farmers to meet the standards demanded by the market?
• Plant and animal health (sanitary and phytosanitary standards). Indicators would be mainly qualitative, but include outbreaks of plant and animal disease as these influence markets and farm income. The main question to be answered would be: Does the government have in place adequate SPS measures for farmers to participate in international trade as well as protect domestic producers?
• Food safety. Indicators would be mainly qualitative, but include incidence of food-borne disease from local production. The main question to be answered would be: Does the government have in place adequate food safety measures for farmers to participate in international trade as well as protect domestic consumers?
• Environmental regulations. Indicators would be mainly qualitative, but include evidence of environmental problems that influence farm practices. The main question to be answered would be: Does the government have in place adequate environmental measures for farmers to run their enterprises in a way that does not despoil the environment?
The regulatory module would be used as a qualitative supplement to the direct and indirect policy indicators. But it is useful as an indication of longer-run sustainability and participation in markets. Evidence could be collected on a cross-section basis from specialist agencies or divisions in FAO. Research and the deployment of technology Rounding out the set of policy modules would be indicators that dealt with issues of research and technology. This module may not be estimated for all Tier I countries, though it would be useful to have some basic information to complement the other policy indicators.
• Research (government research and government sponsored private research). Major indicators would include spending on research for agricultural and food production. Such spending could be related to output levels and hectarage to indicate imbalances. The main question to be answered would be: Has the government a set of research policies that are geared towards the needs of domestic agriculture?

18
• Advisory Services (government advisory services). Major indicators would include spending on advisory services for agricultural and food production. Such spending could be related to output levels and hectarage to indicate imbalances. The main question to be answered would be: Has the government a set of advisory service policies that are geared towards the needs of domestic agriculture?
• Technology (government policy toward the uptake of new technology). Indicators would include regulations governing the spread of technology, patent and other protection of property rights, plant breeders’ rights and farmer incentives to adopt technology. The main question to be answered would be: Has the government a set of technology policies that are geared towards the needs of domestic agriculture?
As with the regulatory module, many of the indicators will be qualitative or at best classificatory. They cannot be incorporated directly with the incentive indicators in the first three modules. Nevertheless they are useful as complementary information for evaluation of policy needs and directions.
6 CONCLUSION We are proposing that FAO and Consortium partners agree to the development of a limited number of agricultural policy indicators (API) that would be useful in monitoring the current state and the development over time of polices directed toward the agricultural sector in selected developing countries. The API would be grouped into separable modules of different complexity and not all modules would be completed for all Tier I countries. Thus, beyond a core content common for all countries, the API project would allow for a different coverage and depth in the analysis of different countries according to the availability of data and of experienced analysts to contribute to the more complex modules. The most fundamental of the modules would be the set of indicators that measure the incentive effect on farmers through the direct policies that impact on output and input markets. This would be complemented by the structural and (where possible) the macroeconomic modules that reflect structural and factor market policies and the measure the impact of macroeconomic distortions and non-agricultural trade policies. Given that the structural and macroeconomic distortion modules are more complex to deal with, in the first phase of the project they might only be undertaken in a few countries on a pilot basis – with those countries selected because of the availability of previous analysis and good data on these topics. Modules that assemble systematically the regulatory and research and technology policies would provide more qualitative evidence of the policy environment for countries for which such data is available. The modus operandi for collecting and collating the data for these indicators would be to select country teams for a limited set of Tier I countries. The choice of countries would be a matter of discussion within the Consortium, but would ultimately depend on the interest of FAO in the policy issues of that country. 22 It would seem desirable to have countries that had different types of agricultural policy environment, including those for whom food security is a pressing issue as well as those whose problems include finding overseas markets for commodities. In addition, it would be good to include smaller as well as larger economies, as their problems might differ in important respects. Some regional dispersion would be advisable to avoid the identification of the program with just a subset of policy issues. On the other hand, including countries in the same region would strengthen any comparative conclusions. The relevant government would be informed of the choice of country, though, unlike the Tier II countries, it would not be necessary for the government to become involved in the data and analysis components of the study.
22 The question arises as to whether the ROA study could be a starting point for choosing the countries and providing some analysis for the broader API project. We think that this could be a constructive first step in the project as country analysts and consultants are already in part identified.
19
Each team would collect and would conduct a preliminary analysis of the data for the policy indicators using the common methodology suggested above. The task of completing the analysis of the data would be undertaken in FAO on the basis of data submitted, and preliminary results would be sent back to the field for checking. Team leaders would meet together to critique each other’s country results, and a compilation of those results would then be made by FAO. Though government would not need to agree with all the calculations up to this stage, the initial compilation would be circulated to them for comment before publication or distribution. One way to make best use of scarce country-based professional capacity could be to establish regional networks of researchers working on different countries within the region. The researchers could be located in a single institution, a regional university with strong ties to academics in neighboring countries for instance, or could agree to communicate on a regular basis. This relates to the issue of country coverage, as it suggests that covering perhaps three countries in a region may give the element of comparability discussed above. The development of the API would be of significant interest to developing country governments and to international organizations and donor agencies and of help in trade negotiations. But an important benefit would also accrue to the agency collecting and analyzing the data, as it would act as a framework for accumulating knowledge about a set of countries and ensure that follow-up work on policy analysis could be done more efficiently. An important organizational issue is how the results obtained from these studies will be stored and disseminated, an area in which FAO has ample experience. An important side-effect of the API programme would be the opportunity for capacity building in developing countries, and hence it would be desirable to make a link between the monitoring programmes and training and policy analysis activities in the public sector and in developing country institutions.
20
REFERENCES Balassa, B. 1971. The Structure of Protection in Developing Countries. Johns Hopkins University Press. FAO (1973). Agricultural Protection: Domestic Policy and International Trade, C 73/LIM 9, November. FAO (1975). Agricultural Protection and Stabilization Policies: A Framework of Measurement in the Context of Agricultural Adjustment, C 75/LIM 2, October. FAO (1977). Progress of International Agricultural Adjustment, C 77/20, October. FAO (1979). International Agricultural Adjustment: Second Progress Report, C 79/20, August. FAO (1981). International Agricultural Adjustment: Third Progress Report, C 81/24, July. FAO (1983). International Agricultural Adjustment: Fourth Progress Report, C 83/21, August. FAO (1985). International Agricultural Adjustment: Fifth Progress Report, C 85/21, August. GATT (1958). Trends in Agricultural Trade: Report by a Panel of Experts (The Haberler Report), Geneva. GATT (1962). “GATT Program for Expansion of International Trade: Trade in Agricultural Products,” Second and Third Reports of Committee II, Geneva. Giugale, M., Lafourcade, O., and Nguyen, V. (eds) (2001). “Mexico: A Comprehensive Agenda for the New Era”, World Bank, 2001, Ch 15 Gulati, Ashok and Sudha Narayanan (2003). Subsidy Syndrome in Indian Agriculture, Oxford University Press Gulati, Ashok and G. Pursell, (1993) Liberalizing Indian Agriculture: An Agenda for Reform, Trade Policy Research Department Working Paper 1172, Washington D.C.: The World Bank. Josling, Timothy and Stefan Tangermann (1989). “Measuring Levels of Protection in Agriculture: A Survey of Approaches and Results”, in Alan Maunder and Alberto Valdés (ed.) Agriculture and Governments in an Interdependent World: Proceedings of the Twentieth International Conference of Agricultural Economists, Dartmouth Publishing Company for the IAAE. Josling, Tim (2003). “Domestic Farm Policies and the WTO Negotiations on Domestic Support”, paper presented to the Conference on “Agricultural Policy Reform and the WTO: Where are we heading?” held at Capri (Italy), June 23-26. Krueger, A., Schiff, M. and Valdés A. (1988).“ Agricultural Incentives in Developing Countries: Measuring the Effect of Sectoral and Economywide Policies’”, World Bank Economic Review, Sept 1988, Vol. 2, No 3, September. Krueger, A., Schiff, M. and Valdés, A. (1992) The Political Economy of Agricultural Pricing Policy, Vols 1 – 5, published for the World Bank by the Johns Hopkins University Press Legg, Wilfred (2003). “Agricultural Subsidies: Measurement and Use in Policy Evaluation”, Presidential Address, Agricultural Economics Society (UK), April. Little, I., Scitovsky, T. & Scott, M. 1970. Industry and Trade in Some Developing Countries, Oxford University Press. OECD (1987). National Policies and Agricultural Trade, OECD, Paris. OECD (1988). Monitoring and Outlook of Agricultural Policies, Markets and Trade, OECD, Paris. Schiff, M and A. Valdés (2002). “Agriculture and the Macroeconomy with Emphasis on Developing Countries”, in B. Gardner and G. Rausser (eds.), Handbook of Agricultural Economics, Vol. 2A, North – Holland/Elsevier. Valdés, Alberto (1996). Surveillance of Agricultural Price and Trade Policy in Latin America During Major Policy Reform, (World Bank Discussion Paper No. 349, 1996)

21
Valdés, Alberto (ed.) (2000). Agricultural Support Policies in Transition Economies, World Bank Technical Paper No. 470 USDA (1987). Government Intervention in Agriculture: Measurement, Evaluation and Implications for Trade Negotiations, IED/NED, Economic Research Service, USDA, January. USDA (1988). Estimates of Producer and Consumer Subsidy Equivalents: Government Intervention in Agriculture, 1982-86, ATAD, Economic Research Service, USDA, April. WTO (2000). Domestic Support: Background Paper by the Secretariat, Committee on Agriculture, G/AG/NG/S/1, 13 April.
22
ANNEX - TERMS OF REFERENCE The Food and Agriculture Organization (FAO), the World Bank (WB), the International Food Policy Research Institute (IFPRI)) and the Organisation for Economic Co-operation and Development (OECD) are establishing a Consortium to develop, coordinate and undertake agricultural policy indicator measurement techniques for developing countries. The objective of the Consortium is to use the PSE/CSE framework as the common conceptual basis for policy indicator work across a number of countries, with flexibility to allow for a range of approaches and indicators of interest to the countries under review, donor agencies and Consortium partners. To allow flexibility, a “two-tiered” approach to agricultural policy reviews is envisaged, involving an initial quantification of agricultural policies for a wider group of countries, and a more comprehensive country review and PSE/CSE calculation for a smaller group of selected countries. Tier I: Quantification of agriculture policies Much of the usefulness of measuring agricultural support and policy distortions lies in the process itself. The inventory of policies (agricultural, macroeconomic and those directed at other sectors), the classification, description and understanding of the policy measures applied, and the careful scrutiny of the existing price, production and consumption data are as important as the actual estimates of support. The first Tier country studies involve establishing an information base and quantification of support, examining such indicators as world/domestic price differentials, domestic levels of support, border measures and related policies, institutional and regulatory regimes. The work on Tier I countries could be designed as a stand alone study or as a preliminary assessment leading to a more comprehensive Tier II review at some time in the future. At a minimum, the analysis should identify whether producers are effectively taxed or subsidized but there would be sufficient flexibility to incorporate dimensions beyond agriculture policy analysis (e.g., macroeconomic situation, trade/development policies, structural adjustment, infrastructure, value-added processing, rural development, poverty alleviation, food security, and environmental issues) according to available resources and the particular demands of the country under review, donor agencies and Consortium partners. The overall duties of the consultants are to assist and guide FAO to:
a) establish a methodology for measuring support to agriculture for the Tier I countries, in light of known constraints concerning data availability and quality;
b) present that methodology to the Consortium for review and discussion; c) develop a set of guidelines for the individual country studies for collecting data, analyzing
data, and presenting reports; d) develop a long term strategy for carrying out policy indicator; and e) suggest national capacity building plans for policy measurement training and work.
In particular, the consultants are requested to:
a) provide an overview of ongoing and past attempts to measure support to agriculture in both OECD and developing countries
(i) what has been done; (ii) the purpose and objectives of the studies; (iii) the commodity, country and policy coverage; and (iv) any insights into problems encountered (methodological and logistical).

23
b) present a methodological approach for the coverage, definitions, criteria of classification and methods for calculating policy indicators based on:
(v) the consultants’ knowledge and expertise in the issues; (vi) the range of work on policy indicators (ongoing and completed); (vii) the consultants’ knowledge of the Consortium members; and (viii) the specific needs of FAO’s Economic and Social Department, including ESA, ESC
and ESS.
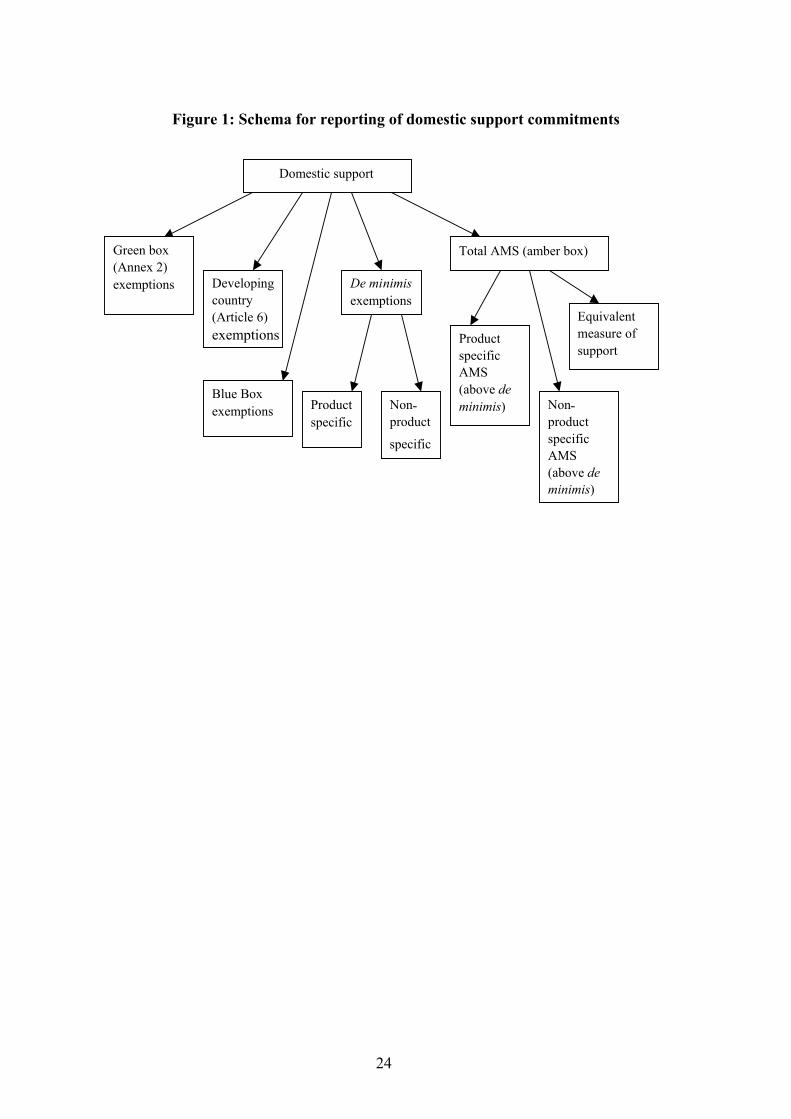
24
Figure 1: Schema for reporting of domestic support commitments
Domestic support
Green box (Annex 2) exemptions Developing
country (Article 6) exemptions
De minimis exemptions
Total AMS (amber box)
Product specific
Non-product
specific
Product specific AMS (above de minimis) Non -
product specific AMS (above de minimis)
Equivalent measure of support
Blue Box exemptions
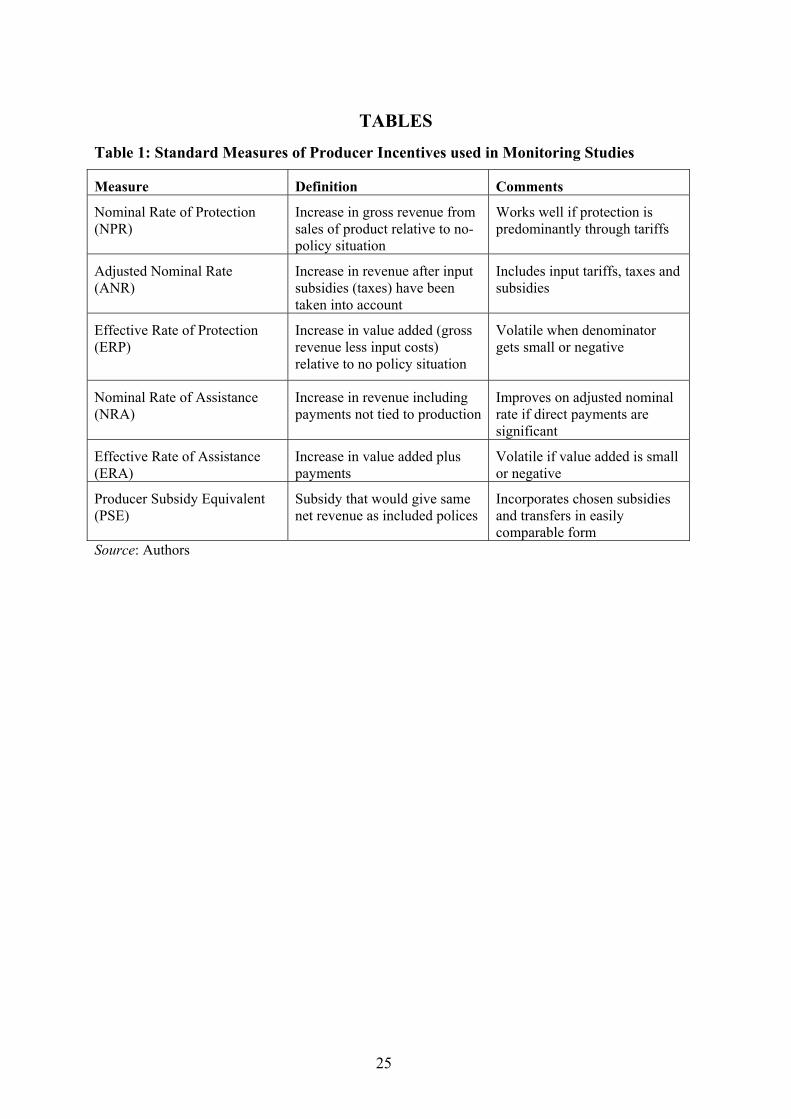
25
TABLES
Table 1: Standard Measures of Producer Incentives used in Monitoring Studies
Measure Definition Comments
Nominal Rate of Protection (NPR)
Increase in gross revenue from sales of product relative to no-policy situation
Works well if protection is predominantly through tariffs
Adjusted Nominal Rate (ANR)
Increase in revenue after input subsidies (taxes) have been taken into account
Includes input tariffs, taxes and subsidies
Effective Rate of Protection (ERP)
Increase in value added (gross revenue less input costs) relative to no policy situation
Volatile when denominator gets small or negative
Nominal Rate of Assistance (NRA)
Increase in revenue including payments not tied to production
Improves on adjusted nominal rate if direct payments are significant
Effective Rate of Assistance (ERA)
Increase in value added plus payments
Volatile if value added is small or negative
Producer Subsidy Equivalent (PSE)
Subsidy that would give same net revenue as included polices
Incorporates chosen subsidies and transfers in easily comparable form
Source: Authors
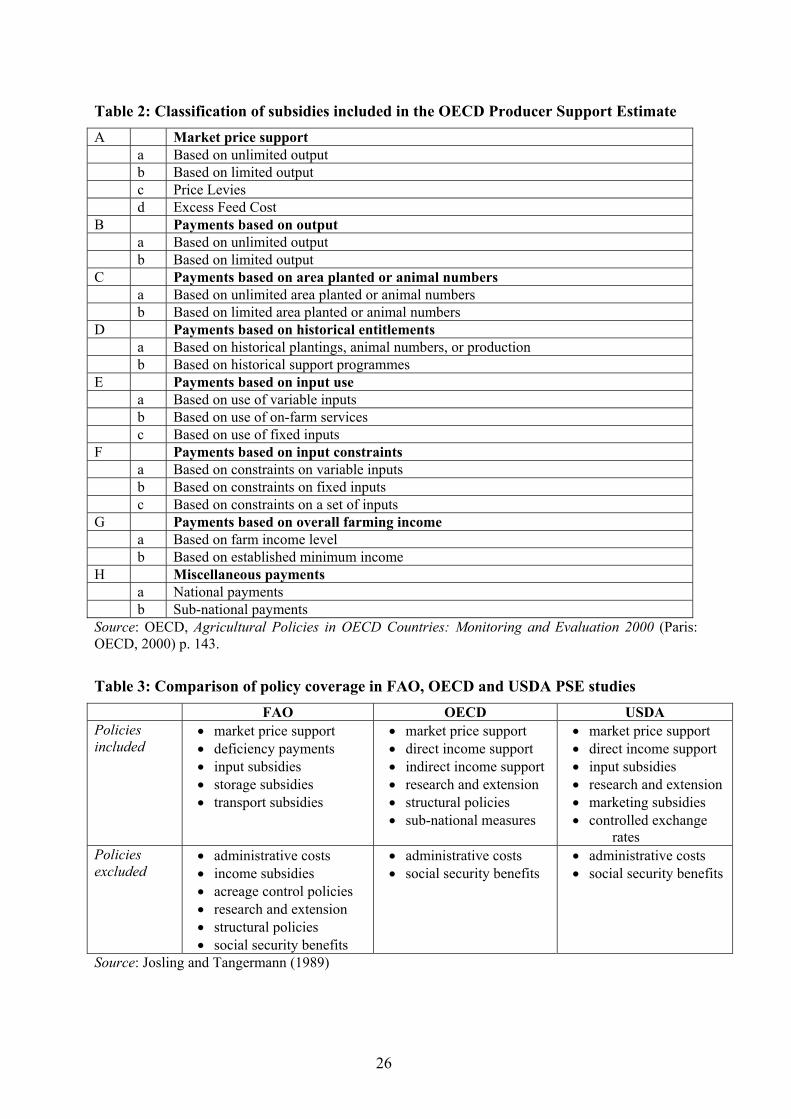
26
Table 2: Classification of subsidies included in the OECD Producer Support Estimate A Market price support a Based on unlimited output b Based on limited output c Price Levies d Excess Feed Cost B Payments based on output a Based on unlimited output b Based on limited output C Payments based on area planted or animal numbers a Based on unlimited area planted or animal numbers b Based on limited area planted or animal numbers D Payments based on historical entitlements a Based on historical plantings, animal numbers, or production b Based on historical support programmes E Payments based on input use a Based on use of variable inputs b Based on use of on-farm services c Based on use of fixed inputs F Payments based on input constraints a Based on constraints on variable inputs b Based on constraints on fixed inputs c Based on constraints on a set of inputs G Payments based on overall farming income a Based on farm income level b Based on established minimum income H Miscellaneous payments a National payments b Sub-national payments Source: OECD, Agricultural Policies in OECD Countries: Monitoring and Evaluation 2000 (Paris: OECD, 2000) p. 143.
Table 3: Comparison of policy coverage in FAO, OECD and USDA PSE studies FAO OECD USDA Policies included
• market price support • deficiency payments • input subsidies • storage subsidies • transport subsidies
• market price support • direct income support • indirect income support • research and extension • structural policies • sub-national measures
• market price support • direct income support • input subsidies • research and extension • marketing subsidies • controlled exchange
rates Policies excluded
• administrative costs • income subsidies • acreage control policies • research and extension • structural policies • social security benefits
• administrative costs • social security benefits
• administrative costs • social security benefits
Source: Josling and Tangermann (1989)

FAO COMMODITY AND TRADE POLICY RESEARCH WORKING
PAPERS 2004 4 Agricultural Policy Indicators Timothy Josling and Alberto Valdés (also issued as an ESA Working Paper) 2003 3 Quantifying appropriate levels of the WTO bound tariffs on basic food products in the context of the Development Box proposals Ramesh Sharma 2 The WTO and environmental and social standards, certification and labelling in agriculture. Cora Dankers 1 The Brazilian ethanol programme: impacts on world ethanol and sugar markets Tatsuji Koizumi

ESA Working Papers
WORKING PAPERS The ESA Working Papers are produced by the Agriculture and Economic Development Analysis Division (ESA) of the Economic and Social Department of the United Nations Food and Agriculture Organization (FAO). The series presents ESA’s ongoing research. Working papers are circulated to stimulate discussion and comments. They are made available to the public through the Division’s website. The analysis and conclusions are those of the authors and do not indicate concurrence by FAO. ESA The Agriculture and Economic Development Analysis Division (ESA) is FAO’s focal point for economic research and policy analysis on issues relating to world food security and sustainable development. ESA contributes to the generation of knowledge and evolution of scientific thought on hunger and poverty alleviation through its economic studies publications which include this working paper series as well as periodic and occasional publications.
Agricultural and Development Economics Division The Food and Agriculture Organization
Viale delle Terme di Caracalla 00100 Rome
Italy
Contact: Office of the Director
Telephone: +39 06 57054358 Facsimile: + 39 06 57055522 Website: www.fao.org/es/esa
e-mail: [email protected]