agricultural intensification and the collapse of europe's farmland bird populations
TRANSCRIPT

Agricultural Intensification and the Collapse of Europe's Farmland Bird PopulationsAuthor(s): P. F. Donald, R. E. Green and M. F. HeathSource: Proceedings: Biological Sciences, Vol. 268, No. 1462 (Jan. 7, 2001), pp. 25-29Published by: The Royal SocietyStable URL: http://www.jstor.org/stable/3067728 .
Accessed: 12/06/2014 19:26
Your use of the JSTOR archive indicates your acceptance of the Terms & Conditions of Use, available at .http://www.jstor.org/page/info/about/policies/terms.jsp
.JSTOR is a not-for-profit service that helps scholars, researchers, and students discover, use, and build upon a wide range ofcontent in a trusted digital archive. We use information technology and tools to increase productivity and facilitate new formsof scholarship. For more information about JSTOR, please contact [email protected].
.
The Royal Society is collaborating with JSTOR to digitize, preserve and extend access to Proceedings:Biological Sciences.
http://www.jstor.org
This content downloaded from 62.122.79.90 on Thu, 12 Jun 2014 19:26:50 PMAll use subject to JSTOR Terms and Conditions
doi 10.1098/rspb.2000.1325
1. INTRODUCTION
The populations of many farmland birds declined severely across much of Europe during the last quarter of the 20th century (e.g. Tucker & Heath 1994; Pain & Pien- kowski 1997). This is of international concern since millennia of agricultural expansion have resulted in much of the remaining terrestrial biodiversity surviving on land dedicated to food production (Krebs et al. 1999). Lowland farmland provides a breeding or wintering habitat for nearly 120 bird Species of European Conservation Concern, the largest number of such species supported by any habitat (Tucker & Heath 1994; Tucker 1997). Birds are thought to be good indicators of overall farmland biodiversity and their recent declines are recognized by the UK Government, among others, as being of public as well as scientific concern (Gregory et al. 2000). A recent review ( Campbell et al. 1997) of detailed ecological studies conducted primarily in the UK suggested that agricultural intensification (defined as increased produc- tion of agricultural commodities per unit area) was at least partly responsible for declines in farmland bird populations, though the underlying ecological and demo- graphic mechanisms differed between species. Here, we assess whether rates of bird population decline are related to variation in the intensity of agriculture on a pan- European scale. Much of the considerable variation in agricultural intensity across Europe has arisen because of differences in political systems. In the European Union (EU), agricultural intensity tends to be higher, because of price-support policies such as the Common Agricultural Policy ( Pain & Pienkowski 1997), than in eastern European countries, where food production per hectare is generally lower and has fallen since the collapse of communism.
*Author for correspondence (paul.donald(rspb.org.uk).
Proc. R. Soc. Lond. B (2001) 268, 25-29 25 Receizued 12 June 2000 Accepted 25 September 2000
2. METHODS
(a) Agricultural intensity We assessed variation in agricultural intensity between
European countries by calculating a number of indices likely to reflect intensity in both arable and pastoral systems. These indices were drawn from data extracted from the FAOSTAT database of the UN Food and Agriculture Organization and are described in table 1. The data used were from 1993, the first year that such statistics were available for many countries. A data- reduction technique (principal components analysis, PCA) was used to identify clusters of countries with similar agricultural intensity and to assess whether the political system had an influ- ence. Each country was assigned to one of three groups based upon political and economic differences. These were (i) the 12 countries that joined the EU before 1990 (EU12), although in the analyses agricultural statistics for Belgium and Luxembourg are merged and the two treated as one country, (ii) other Western countries with capitalist or mixed economies that are not in the EU or joined after 1990, and (iii) former communist countries (eastern Europe).
(b) Bird population and range changes Bird population trends and range changes during the period
1970-1990 were obtained from the BirdLife International/ European Birds Census Council European Bird database (EBD) (Tucker & Heath 1994) for bird species whose populations were identified by an independent assessment (appendix 4 of Tucker & Evans 1997) as being potentially influenced by changes in agriculture. We excluded species for which population trends were available for fewer than ten countries and large raptors, whose distributions and population trends are influenced by human persecution (Newton 1979). This left 52 species eligible for analysis across 30 European countries. The EBD places the trend of each species' population or range change in each country into one of five classes (-2, > 50% decline; -1, 25- 49% decline; 0, stable; + 1, 25-49% increase; +2, > 50% increase) and assigns it a data quality code (one, no quantitative
<) 2001 The Royal Society
>THE ROYAL 5 SOC I ETY
Agricultural intensification and the collapse of Europe's farmiand bird populations P. F. Donaldl*, R. E. Greenl 2 and M. F. Heath3 lRoyal Societyfor the Protection of Birds, The Lodge, Sandy, Bedfordshire SGI9 2DL, UK 2Conservation Biology Group, Department of Zoology, University of Cambridge, Downing Street, Cambridge CB2 3Ejf, UK 3BirdLife International, Wellbrook Court, Girton Road, Cambridge CB3 OXA, UK
The populations of farmland birds in Europe declined markedly during the last quarter of the 20th century, representing a severe threat to biodiversity. Here, we assess whether declines in the populations and ranges of farmland birds across Europe reflect differences in agricultural intensity, which arise largely through differences in political history. Population and range changes were modelled in terms of a number of indices of agricultural intensity. Population declines and range contractions were significantly greater in countries with more intensive agriculture, and significantly higher in the European Union (EU) than in former communist countries. Cereal yield alone explained over 30% of the variation in population trends. The results suggest that recent trends in agriculture have had deleterious and measur- able effects on bird populations on a continental scale. We predict that the introduction of EU agricultural policies into former communist countries hoping to accede to the EU in the near future will result in significant declines in the important bird populations there.
Keywords: agriculture; birds; population declines; range contractions; politics
This content downloaded from 62.122.79.90 on Thu, 12 Jun 2014 19:26:50 PMAll use subject to JSTOR Terms and Conditions

26 P. F. Donald and others Impact of agricultural intensiJ2cation onfarmland birdpopulations
Table 1. The seven indices of agricultural intensity used in the analyses (All agricultural data were drawn from the FAOSTAT database of the UN Food and Agriculture Organization. No data were available on pesticide usage.)
1, agricultural population density: total agricultural population divided by total farmland area
2, milk yield: litres of milk produced per dairy cow 3, density of cattle: total head of cattle (beefand dairy) per
hectare of pasture 4, fertilizer use: total fertilizer consumption divided by total
farmed area 5, cereal yield: tonnes per hectare (all cereal types combined) 6, number of tractors per economically active agricultural worker 7, number of harvesters per economically active agricultural
worker
6.0
_1
'e
cq
o
.
'e
c)
2400
.g 2200 / ct s ct _
O 2000 /
X 1800 / 8 > s
b _N/ w _ s @
c 1600 | / t # \
.: 8 s
r 1400 | , w
i 1200^J
1000 i - - - - 1961 1966 1971 1976 1981 1986 1991
year
Figure 2. Differences between the EU 15 (solid line) and Eastern Europe (dashed line) in (a) cereal yield per unit area and (b) milk production, expressed as litres of milk produced per unit area of pasture. The introduction of milk quotas in 1984 is apparent from a stabilization of milk production in the EU. Data from the FAOSTAT database of the UN Food and Agriculture Organization.
used as a weight. In multiple-regression models, the degrees of latitude and longitude of each capital city were entered into the models to correct for climatic or geographic effiects on bird population trends. The minimal adequate model (MAM) was identified by a backward-selection procedure (Crawley 1993). Once the MAM had been identified, a two-level factorial vari- able defining EU12 and non-EU12 countries was added to assess whether, after agricultural factors had been incorporated, there remained unmeasured diffierences between EU12 and non-EU12 countries that explained significant additional variation in bird population and range trends.
3. RESULTS
(a) Agricultural intensity In both EU Member States and in non-EU eastern
European countries there was a considerable increase in overall agricultural productivity between 1961 and 1999
t 8 H- l *= 9o / , |
= i / } \ - 48 ' ° 80 ,//J V
m to 1 B 7os *r
_
*C r 60
50 1961 1966 1971 1976 1981 1986 1991 1996
year
Figure 1. Changes in an index of overall agricultural productivity in Member States of the EU15 (solid line) and eastern Europe (dashed line) from 1961 to 1999. The index is calculated such that values for 1989-1991 average 100, so the indices cannot be used to compare absolute differences in agricultural output between the two country groupings. The indices are based on the sums of price-weighted quantities of different agricultural products produced after deductions of quantities used as seed and feed weighted in a similar manner. Data from the FAOSTAT database of the UN Food and Agriculture Organization (FAO 1994).
data; two, incomplete quantitative data; three, reliable quantita- tive data).
(c) Modelling population and range changes in terms of agricultural intensiffication
Not all species occur in each country, so we used two-way ANOVA (country by species), weighted by the data quality scores, to estimate a mean population trend or range change score for each country that allows for missing species and corrects for variation in estimate quality. Relationships between the resulting country trend scores and the indices of agricultural intensity listed in table 1 were then assessed by univariate and multiple least-squares linear regression, with the reciprocal of the square of the standard error of each country score being
Proc. R. Soc. Lond. B (2001)
This content downloaded from 62.122.79.90 on Thu, 12 Jun 2014 19:26:50 PMAll use subject to JSTOR Terms and Conditions
Impact of agricultural intensification onfarmland birdpopulations P. F. Donald and others 27
l (l * l l l l A
*D Cz Hu a ,_ Ro Po
3.0 -
Ne
Se 2.0 -
1.0 -
Cr
Sz Ge
It * UK * *
- Be
Fr
P1 Gr
Au v.v - Lu
Bu
-1.0 J
-2.0 X X -1.5 -1. o.o
Br
Sp
No De Mo Ur
:1 EIEs La Li
a sw F.
1
.o 4.s 0.5 1.0 1.5 2.0
PCA1
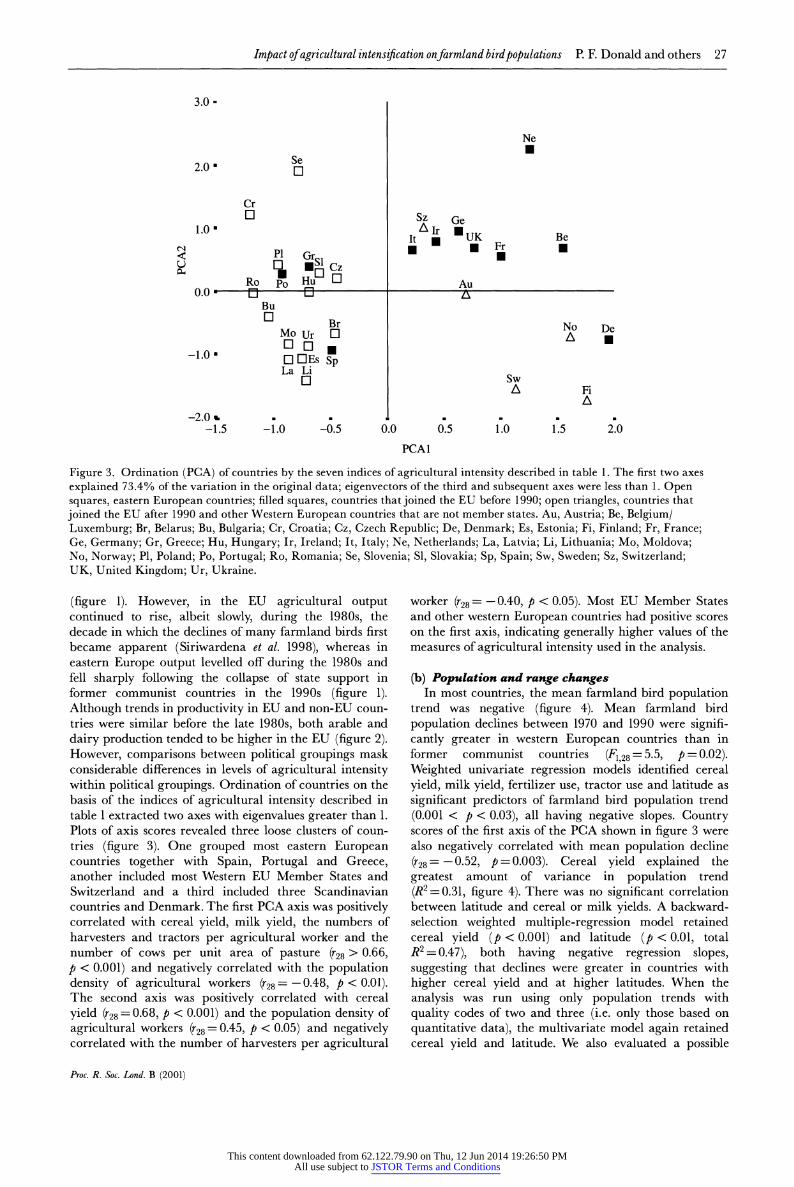
Figure 3. Ordination (PCA) of countries by the seven indices of agricultural intensity described in table 1. The first two axes explained 73.4% of the variation in the original data; eigenvectors of the third and subsequent axes were less than 1. Open squares, eastern European countries; filled squares, countries that joined the EU before 1990; open triangles, countries that joined the EU after 1990 and other Western European countries that are not member states. Au, Austria; Be, Belgium/ Luxemburg; Br, Belarus; Bu, Bulgaria; Cr, Croatia; Cz, Czech Republic; De, Denmark; Es, Estonia; Fi, Finland; Fr, France; Ge, Germany; Gr, Greece; Hu, Hungary; Ir, Ireland; It, Italy; Ne, Netherlands; La, Latvia; Li, Lithuania; Mo, Moldova; No, Norway; P1, Poland; Po, Portugal; Ro, Romania; Se, Slovenia; S1, Slovakia; Sp, Spain; Sw, Sweden; Sz, Switzerland; UK, United Kingdom; Ur, Ukraine.
(figure 1). However, in the EU agricultural output continued to rise, albeit slowly, during the 1980s, the decade in which the declines of many farmland birds first became apparent (Siriwardena et al. 1998), whereas in eastern Europe output levelled of during the 1980s and fell sharply following the collapse of state support in former communist countries in the 1990s (figure 1). Although trends in productivity in EU and non-EU coun- tries were similar before the late 1980s, both arable and dairy production tended to be higher in the EU (figure 2). However, comparisons between political groupings mask considerable differences in levels of agricultural intensity within political groupings. Ordination of countries on the basis of the indices of agricultural intensity described in table 1 extracted two axes with eigenvalues greater than 1. Plots of axis scores revealed three loose clusters of coun- tries (figure 3). One grouped most eastern European countries together with Spain, Portugal and Greece, another included most Western EU Member States and Switzerland and a third included three Scandinavian countries and Denmark. The first PCA axis was positively correlated with cereal yield, milk yield, the numbers of harvesters and tractors per agricultural worker and the number of cows per unit area of pasture (r28 > 0.66, p < 0.001) and negatively correlated with the population density of agricultural workers (r28=-0.48, p < 0.01). The second axis was positively correlated with cereal yield (r28 = 0.68, p < 0.001) and the population density of agricultural workers (r28 = 0.45, p < 0.05) and negatively correlated with the number of harvesters per agricultural
worker (r28 =-0.40, p < 0.05). Most EU Member States and other western European countries had positive scores on the first axis, indicating generally higher values of the measures of agricultural intensity used in the analysis.
(b) Population and range changes In most countries, the mean farmland bird population
trend was negative (figure 4). Mean farmland bird population declines between 1970 and 1990 were signifi- cantly greater in western European countries than in former communist countries (F1 28 = 5.5, p = 0.02). Weighted univariate regression models identified cereal yield, milk yield, fertilizer use, tractor use and latitude as significant predictors of farmland bird population trend (0.001 < p < 0.03), all having negative slopes. Country scores of the first axis of the PCA shown in figure 3 were also negatively correlated with mean population decline (r28 =-0.52, p = 0.003). Cereal yield explained the greatest amount of variance in population trend (R2=0.31, figure 4). There was no significant correlation between latitude and cereal or milk yields. A backward- selection weighted multiple-regression model retained cereal yield (p < 0.001) and latitude (p < 0.01, total R2 = 0.47), both having negative regression slopes, suggesting that declines were greater in countries with higher cereal yield and at higher latitudes. When the analysis was run using only population trends with quality codes of two and three (i.e. only those based on quantitative data), the multivariate model again retained cereal yield and latitude. We also evaluated a possible
Proc. R. Soc. Lond. B (2001)
This content downloaded from 62.122.79.90 on Thu, 12 Jun 2014 19:26:50 PMAll use subject to JSTOR Terms and Conditions

28 P. F. Donald and others Impact of agricultural intensiMication onfarmland birdpopulations
2e . . . . . . .
0.2
0.0z
(a)
Cr HuO
Br Bu Ro ° °SP ° O
° * Ur P1 ° NOGr O a S a a Sol
It
o
o
-0.2
4.4
-0.6
-0.8
o Es I] O O
Se Fr o
Ir
De S Be Ne
a
Ge * UK
.
cz o
-l.ol
.L -1.
(b)
No a
0.2 P1
Fr
o.o De * Ge
. Se o a 4.2'
Ur o
S1 o . X sz
a aIr . -0.4 Ne
Be
2 3 4 5 cereal yield (tonnes ha 1)
Figure 4. Scatter plots of (a) weighted mean population and (b) range trends offarmland birds, 1970-1990, on cereal yield in 1993. Open squares, eastern European countries; filled squares, countries that joined the EU before 1990; open triangles, countries that joined the EU after 1990 and other western European countries that are not member states. Key to country codes given in caption to figure 3. (a) r28 =-0.54, p = 0.002; (b) r27 =-0 49, P-0.007 .
source of bias that could have resulted in spurious corre- lations of this type. We considered it plausible that ornithologists in a country where a bird population trend was imperfectly known might erroneously record it as stable (zero trend score), even though it was really increasing or declining. If the true mean score was similar and negative in all countries and this bias was more frequent in countries with agriculture of relatively low intensity, it could result in a spurious negative corre- lation of trend score with measures of agricultural inten- sity. We therefore repeated the analyses after excluding all zero population trend scores except those accompanied by the highest data quality code. The conclusions drawn from the original analyses were unaffiected and the same explanatory variables were identified by multiple regres- sion. The results, therefore, appear to be robust in relation to the exact analytical methods and the quality of the data used. In no case did the addition of the binary vari- able representing membership of the EU significantly improve the fit of the model, suggesting that agricultural variables were sufficient to explain the greater declines in EU member states.
As with population trends, changes in geographic distribution were most strongly related to cereal yield (figure 4), as might be expected from the positive relation- ship between range change and population change (r28=0.51, p=0.05).
4. DISCUSSION
The most parsimonious interpretation of these results is that cereal yield is an indicator of an intercorrelated suite of changes in crop- and livestock-husbandry practices (cereal yield was positively correlated with milk yield, fertilizer use and the number of tractors per agricultural worker; p < 0.005) that have reduced the suitability of habitats and the availability of food for birds. Therefore, our findings provide geographically broad, multi-species support for fine-scale, intensive studies of single species that have indicated that agricul- tural intensification has had deleterious and measurable effects on farmland bird populations. Our results suggest that such effects are detectable at a continental level, making them comparable in scale with deforestation and
Proc. R. Soc. Lond. B (2001)
o
Br Ro Hu ° O O
Lk>Sg Po Bu Gra It O * O Cz
Fi O
Es o A
ULa o o
This content downloaded from 62.122.79.90 on Thu, 12 Jun 2014 19:26:50 PMAll use subject to JSTOR Terms and Conditions

Impact of agricultural intensif cation onfarmland birdpopulations P. F. Donald and others 29
global climate change as major anthropogenic threats to biodiversity. Rapid progress is required in adapting EU agricultural policy to permit coexistence of viable farming with biodiversity. Otherwise we can expect to see continuing declines in populations of farmland birds and other taxa within the countries of the present EU and a rapid acceleration of biodiversity loss in those central and eastern European countries that will accede to the EU in the near future.
We thank Mark Avery, David Gibbons, Debbie Pain, Geoff Hilton, Giovanna Pisano, Andrew Balmford, Matt Rayment and Peter Vickery for useful discussions. Agricultural statistics were drawn from the FAOSTAT database of the UN Food and Agriculture Organization.
REFERENCES Campbell, L. H., Avery, M. I., Donald, P. F., Evans, A. D.,
Green, R. E. & Wilson, J. D. 1997 A review of the indirect efects of pesticides on birds. Joint Nature Conservation Committee Report 227. Peterborough, UK: Joint Nature Conservation Committee.
Crawley, M. J. 1993 GLIMfor ecologists. Oxford, UK: Blackwell
-
belence.
FAO 1994 fAe state of food and agriculture. Rome: Food and
Agriculture Organization of the UN. Data available at www.fao.org.
Gregory, R. D., Noble, D. G., Campbell, L. H. & Gibbons, D. W. 2000 The state of the UK's birds. Sandy, Bedfordshire: Royal Society for the Protection of Birds and British Trust for Ornithology.
Krebs,J. R.,Wilson,J. D., Bradbury, R. B. & Siriwardena, G. M. 1999 The second silent spring? JWature 400, 611-612.
Newton, I. 1979 Population ecology of raptors. Berkhamstead, UK: Poyser.
Pain, D. J. & Pienkowski, M. W. (eds) 1997 Farming and birds in Europe. fAe common agricultural policy and its implications for bird conservation. London: Academic Press.
Siriwardena, G. M., Baillie, S. R., Buckland, S. T., Fewster, R. M., Marchant, J. H. & Wilson, J. D. 1998 Trends in the abun- dance of farmland birds: a quantitative comparison of smoothed Common Birds Census indices. 7. Appl. Ecol. 35, 2F43.
Tucker, G. 1997 Priorities for bird conservation in Europe: the importance of the farmed landscape. In Farming and birds in Europe. fAe common agricultural policy and its implications for bird conservation (ed. D. J. Pain & M. W. Pienkowski), pp. 79-116. London: Academic Press.
Tucker, G. M. & Evans, M. I. 1997 Habitatsfor birds in Europe: a conservation strategy for the wider environment. Cambridge, UK: BirdLife International.
Tucker, G. M. & Heath, M. F. 1994 Birds in Europe: their conserva- tion status. Cambridge, UK: BirdLife International.
Proc. R. Soc. Lond. B (2001)
This content downloaded from 62.122.79.90 on Thu, 12 Jun 2014 19:26:50 PMAll use subject to JSTOR Terms and Conditions