agricultural economics society annual conference · 2019-01-03 · 1 agricultural economics society...
TRANSCRIPT
1
Agricultural Economics Society Annual Conference
University of Plymouth, Seale Hayne Campus
PRESIDENTIAL ADDRESS
12 April 2003
AGRICULTURAL SUBSIDIES: MEASUREMENT AND USE IN POLICY EVALUATION
Wilfrid Legg1
(Draft of 12 March 2003)
1. Head of Policies and Environment Division, Agriculture Directorate, Organisation for Economic Co-operation and Development, Paris. The author has benefited from comments of past and present colleagues. Particular thanks to Jonathan Brooks, David Blandford, Dimitris Diakosavvas, Paul Dymock, Olga Melyukhina, Luis Portugal, Ronald Steenblik and Gérard Viatte. However, the author remains responsible for all errors and omissions. The views expressed are the author’s and are not necessarily those of the OECD or its Member countries. Comments are welcome. E-mail: [email protected] Website: www.oecd.org/agr

2
WILFRID LEGG is Head of the Policies and Environment Division in the OECD Agriculture Directorate, where he has worked since 1981, following a period of teaching and research in the UK, including a fellowship in Sussex University, co-authoring New Limits on European Agriculture (1985). His main areas of interest are agricultural and environmental policy analysis and in measuring and evaluating agricultural policy developments, using the Producer and Consumer Support Estimates. Born in Hampshire, he was educated at Brockenhurst Grammar School, and studied political economy at the Universities of London (UCL), Leicester and Reading. He is a member of the Advisory Board of Choices and on the Steering Group of Eurochoices magazines and, in collaboration with the authors, is currently translating and adapting Politique Agricole: Un Modèle Européen, by Louis-Pascal Mahé and François Ortalo-Magné, which is planned for publication in English by Cambridge University Press in 2004.

3
AGRICULTURAL SUBSIDIES1: MEASUREMENT AND USE IN POLICY EVALUATION
One of the lesser known roles of the OECD2 is to provide a bridge between academics and policy makers, and the excellent working relations with agricultural economists in the research community has been a significant factor in advancing work on agricultural policy issues in the OECD. The links with the United Kingdom profession go back a long way and the Agricultural Economics Society conferences offer valuable opportunities to keep in touch with policy relevant research. It is therefore an honour and privilege for an official of the OECD to be invited to be the Society’s President for 2003-4.3
My address focuses on agricultural support, an area of work on which I have been engaged in one way or another since I joined the Organisation in 1981.4 The measurement of support and its use in monitoring and evaluating policies is the most widely known and cited activity of OECD work on agriculture. Moreover, the issue is of enduring topicality, both domestically and internationally. With the conclusion of the Uruguay Round of GATT multilateral trade negotiations in 1994, the launch of the WTO Doha Development Agenda in 2001, the approval of new farm legislation in the US in 2002, the current review of agricultural policy in the European Union, the forthcoming enlargement of the EU and the transition to a market economy in countries where agriculture often predominates, it is timely to take stock of measuring and using indicators of agricultural support.
Good analysis does not necessarily translate into good policy – not least it must address the right issues at the right time in responding to a policy need. But without sound, empirically-based research the likelihood of implementing good policy is seriously impeded. In this regard, there are strong arguments for agricultural economics research to take a “political economy” approach in an historical perspective, which is arguably more credible and carry weight by those in position to take policy decisions. Indeed, as an applied discipline, and with its traditionally close interaction with policy, agricultural economics is well suited to this task. I hope this address will not only be useful in giving an overview of agricultural support, but also stimulate ideas for the research community to undertake further work to help the policy debate.
1. A BRIEF HISTORICAL BACKGROUND
Plus ça change, plus c’est la même chose (Alphonse Karr, Les Guêpes, 1849)
Government intervention in agriculture is the rule rather than the exception. Nearly everywhere – and not only in OECD countries – intervention goes back a considerable period of time, often defended on grounds of food security. Ensuring a minimum supply of safe, affordable food for the population, together with the defence of its citizens from external invasion, maintenance of public order and sound management of the economy, are among the fundamental objectives that societies demand of their governments. Policy objectives to maintain the level and reducing the variability of farm incomes and improve the economic performance of agriculture largely date from the 1930s and 1940s. Issues related to the whole agri-food chain, rural development, the environment and animal welfare are of more recent policy concern.
Uncertainty in the production of some agricultural commodities associated with the vagaries of nature, coupled with human-generated interruptions to supplies of imported food (or inputs to produce food domestically), have been strong driving forces used to justify policies to protect agriculture.5 Even when
4
there has been no direct threat to food supply, a precautionary approach has often been adopted, which has resulted in higher domestic supply higher – and a thinner world market – than would otherwise be the case.
The widespread policy goal to produce more food following the deprivations of the Second World War very soon led to increasing concern about the effects of agricultural policies on trading relations and the cost of policies. Combined with rapid technical progress and structural changes, trade barriers and domestic production support measures led to a build up of surpluses of farm goods, which were stocked or exported with subsidies. World prices for temperate commodities were driven down. The costs of stock holding and export subsidies placed heavy burdens on government budgets, consumers in countries with protected markets faced higher food bills, and competitive producers in other countries were penalised by restrictions on access to those markets.6
A Role for the OECD
By the beginning of the 1980s, a number of OECD countries realised that action was urgently needed. The then Prime Minister of New Zealand, Robert Muldoon, facing severe economic pressures at home and decreasing revenue from agricultural exports, was instrumental in persuading the OECD Ministerial Council in 1982 that Member countries should commit themselves to tackling the problems of international agricultural trade. At that meeting, Ministers also asked the OECD to analyse the “approaches and methods for a balanced and gradual reduction of protection for agriculture and the fuller integration of agriculture within the open multilateral trading system”; an examination of national policies that have a significant impact on international trade; and an analysis of the most appropriate methods to improve the functioning of the world agricultural market.
This resulted in a major OECD study, National Policies and Agricultural Trade, published in 1987, which led to Ministers agreeing in that same year to a set of actions and principles for the reform of agricultural policies. Countries agreed to progressively reduce agricultural subsidies, allow for a greater influence of market signals in guiding production decisions, while recognising that countries might also need to take non-economic objectives into account. Forging consensus among countries on the sensitive issue of agricultural policy reform in an international context is a painstaking process. The agreement to cut subsidies coupled with, the powerful signal to increase the “market orientation” of agriculture was qualified by the very elastic catch-all of the option to take “non-economic objectives”7 into account.
The political reform process was initiated in the OECD Council of Ministers, while the OECD Secretariat was charged with undertaking the analytical work: to develop a consistent and comparable way to measure agricultural subsidies, model agricultural trade and policy reform, and undertake detailed studies of agricultural policies in OECD countries. The 1987 report frankly recognised the linkages between domestic and trade policies so that improving the trading environment required actions on both trade barriers and domestic policies. Economists would find such a linkage rather obvious, but that was by no means the case among some agricultural policy makers. The resistance may have reflected the implications of such linkages for policy. The priority driving the reform process in the 1980s was almost exclusively to deal with trade problems. Traditional trade issues still remain predominant, but other societal concerns have since assumed a higher profile in the agricultural policy reform and trade liberalisation agendas.
It is instructive to reflect a little more on the significance of what happened in the 1980s. There are lessons here for policy makers and the research community. First, in the early 1980s there was a return to agricultural surpluses and downward pressure on world prices that generated a political commitment for reform at the highest level driven by New Zealand, a country with a very strong interest in ensuring that concrete action was taken. Second, there was an international institution (OECD), the members of which accounted for most agricultural trade, provided most of the subsidies, and met regularly at Ministerial level

5
to discuss issues of common concern, while agricultural trade disciplines were all but excluded from negotiations in the international trade body, the General Agreement on Tariffs and Trade (GATT). Third, in 1987 OECD Ministers adopted principles for policy reform. But it should be noted that the political commitment in both 1982 and 1987 was taken by OECD Ministers responsible for Economics, Trade and Foreign Affairs and not Ministers of Agriculture.8 The OECD, as a trusted international organisation with an integrated approach in addressing sectoral and economy-wide policy issues, was a natural venue in which to make this commitment. And finally, the intellectual ground had been prepared by the pioneering work of Max Corden on trade protection, taken up by Tim Josling who developed the methodology and applied it to the empirical measurement of agricultural subsidies – which could also be undertaken at increasingly lower cost and greater accuracy due to progress in computer modelling techniques.
The Uruguay Round and Wider Policy Agenda
In brief, the confluence of these factors provided the window of opportunity to make real progress in agricultural policy and trade reform. The major concrete expression of this was the agreement by the signatories to the GATT, in September 1986 at Punta del Este in Uruguay, to launch a round of multilateral trade negotiations.9 The Uruguay Round was concluded with the Marrakech agreement in 1994, and came into effect in 1995, setting up the WTO and – for the first time – making agriculture subject to multilateral trade disciplines. Member countries of the WTO agreed to reduce export subsidies on agricultural goods, improve market access, and reduce trade-distorting domestic agricultural policies over a 5-year period (longer for the developing countries). Every OECD Ministerial Council since 1988 has stressed the need for more progress in multilateral trade liberalisation, including agriculture. A meeting of OECD Agriculture Ministers in 199810 reiterated the commitment from the 1987 OECD Ministerial meeting, the need for further domestic policy reform and trade liberalisation, while recognising the need to address other societal concerns, including the environment.11
But the recognition that the Uruguay Round was only the first (albeit crucial) step in the process of agricultural trade liberalisation was one of the driving forces that led to the agreement in November 2001 to launch the WTO Doha Development Agenda, following the unsuccessful attempt in Seattle in late 1999. Doha gives much more emphasis to the needs of developing countries and to non-trade concerns in the process of trade liberalisation. This wider agenda was reinforced in September 2002, at the World Summit on Sustainable Development in Johannesburg, which took stock of progress and attempted to provide further impetus to achieving sustainable development. As agriculture is the major user of the world’s land and water resources – and in many non-OECD countries is the primary economic activity – ensuring that those resources are marshalled to meet the food and fibre demands of a larger and richer global population in the future, is intrinsically tied up with agricultural and trade policy. The linkages between development, sustainability and agricultural subsidies are increasingly highlighted in international discussions.
During the last 15 years the agricultural policy debate – whether in the OECD, WTO, FAO or in individual countries – has been dominated by an overarching question: how can countries best achieve a wide and differing range of societal goals with least production and trade distortion? In addressing this question, governments tend to think in terms of targeting, tailoring and transparency of policies (with varying degrees of enthusiasm and concrete action). “Decoupling” and “multifunctionality” is the currently fashionable terminology characterising the debate. In reality, concerns with income distribution, fairness and budgetary costs figure rather more in governmental domestic calculations than economic efficiency – which nonetheless importantly enters the debate via the international trade route. Economists in the OECD and in the research community have been playing their part underpinning the policy debate by applying some basic techniques and tools: cost-benefit and risk analysis; the concepts of public goods and market failure; and the building blocks of measuring support and modelling its impacts.

6
But despite formidable research efforts and strong political statements of commitment to agricultural policy reform and trade liberalisation, the rhetoric of reform is ahead of the reality. The slow progress of policy reform and the Doha negotiations – so far so disappointingly reminiscent of the Uruguay Round – might well justify the comment that, despite a lot of activity, little seems to change. Or, perhaps more optimistically, agricultural policy reform is like an iceberg – there is lot going on that is not obvious and, as with a super tanker, it takes a long time to notice the effect of taking action to change direction12.
2. DEFINING AND MEASURING AGRICULTURAL SUBSIDIES
There is no art which one government sooner learns of another than that of draining money from the pockets of the people (Adam Smith, Wealth of Nations, 1776)
Government policies generate transfers that influence incentives facing producers, consumers and citizens, leading to outcomes that would otherwise be different. Those who are the intended beneficiaries of policies may or may not be explicitly identified, but policies can have unintended side (or indirect) effects elsewhere, both within and outside the country concerned.13 Sector policies, together with electoral cycles – and this is not unique to agriculture – build up a domestic constituency for their continuation among the few winners (who each gain a lot), but rarely the converse among the many losers (who each pay a little).
The notion of a subsidy has as long a history as public policy has been influencing the allocation of resources and the distribution of income and wealth within society. Frequently farming subsidies are viewed solely in budgetary terms as transfers from taxpayers to producers or consumers, whether those transfers are explicit budgetary payments (as in national accounts) or cost-reducing transfers provided through preferential interest rates or tax breaks.14 But where policies influence markets through trade measures, then a subsidy also arises from the price gap created between and world markets. André de Moor’s general definition of subsidies succinctly captures the scope15:
Subsidies comprise all measures that keep prices for consumers below market level or keep prices for producers above market level or that reduce costs for consumers and producers by giving direct or indirect support.
Let me recall that the purpose of measuring agricultural subsidies in the OECD is to develop indicators for monitoring and evaluating policies to contribute to policy reform and trade liberalisation. Such measurement is a necessary input for evaluating policies through modelling. While the foundation material (the database) is common for both “monitoring” and “evaluation”, the requirements differ in emphasis. For monitoring, the emphasis tends to be for summary indicators that permit comparisons across countries and time, reflecting policy change, and are acceptable to governments and trade negotiators. For evaluation, the need is to provide sufficient detail and classification of policy measures amenable to modelling. In both cases the indicators must be analytically robust (firmly grounded in economics and consistent with national accounting practices). This means adopting a method of calculating indicators that is16:
• comprehensive and comparable over time, across commodities, policies and countries;
• analytically sound, easily understood and interpreted by policy makers; and
• easily measured, replicable, regularly updated and reasonably accurate.

7
The Producer Subsidy Equivalent
In 1982 the OECD Secretariat, after reflecting on the options available, decided on using the Producer Subsidy Equivalent (PSE) concept as its measure of agricultural subsidies17. The PSE was first applied to agriculture by Tim Josling to measure agricultural subsidies in work for the FAO in the early 1970s18. The PSE was defined by the OECD in 1987 as the payment that would be required to compensate farmers for the loss of income resulting from the removal of a given policy measure19 and was initially calculated for use in the Ministerial Trade Mandate Model for modelling, in particular, the effects on world commodity prices of a small (10%) reduction in agricultural subsidies.20 But the PSE was also an integral element in the analysis of national agricultural policies: prior to the development of the PSE there was a lack of a consistent or comparative evaluation of agricultural policies in the OECD.
The notion of subsidy and tax equivalents of policy measures derives from the economic theory of protection, designed to evaluate the effects of tariffs in the 1960s. According to this theory, the producer subsidy equivalent of a tariff is the payment per unit of output that a government would have to pay producers to generate the same production effect as the tariff. Similarly, the consumer tax equivalent of a tariff is the per unit tax that a government would have to impose on consumers to yield the same reduction in consumption as the tariff.21
An import tariff and a unit payment that both raise the price received by producers of a commodity by $10/tonne, for example, will have the same impacts on production, revenue and income. Thus, converting a tariff to a producer subsidy equivalent or a payment to a producer tariff equivalent are two ways of expressing the same production and protection effect. More generally then, the producer subsidy equivalent of a policy measure (e.g. import tariff, export subsidy, payment per tonne or per hectare) is the amount of the payment per unit of output a government would have to pay to producers to create the same impact on production as the amount of the payment provided under that policy measure. Likewise, the consumer tax equivalent of a policy measure is the per unit tax that a government would have to impose to create the same effect on current consumption or consumer expenditure as that policy measure22.
The “producer” and “consumer” designation of these subsidy and tax equivalents indicates who initially receives and who finances the subsidy. They could also be denominated as production subsidy and consumption tax equivalents because they are defined relative to their impacts on the levels of production and consumption respectively. However, subsidy/tax equivalents of a tariff or any other policy measure can also be defined in terms of the impacts on trade, revenue, income or the environment.23 As such they could be termed trade, revenue, income and environment subsidy equivalents respectively.
But while policy measures providing the same amount of monetary transfers to producers have the same revenue subsidy-equivalent, they may have different production and income subsidy-equivalents, which depend on the way measures are implemented (per unit of output or per hectare of land producing the same output, for example). From early on in the calculation of PSEs the OECD was aware that the “income compensation” definition did not match what was actually being measured. One of the first critiques in this regard was offered by the late George Peters in 1988, where he noted inter alia that the PSE was a measurement of revenue transfer.24
8
The OECD PSE has been defined, since 1990, as:
An indicator of the annual monetary value of gross transfers from consumers and taxpayers to agricultural producers, measured at the farm-gate level, arising from policy measures that support agriculture, regardless of their nature, objectives or impacts on farm production or income.
I would highlight some key characteristics of this definition. The PSE is a measure of the cost for consumers and taxpayers25, and a $ of transfer arising from a given policy measure is considered as revenue equivalent to a $ of transfer arising from another policy measure. However, part of the transfer may be passed by farmers to other economic groups through higher input or land prices, for example. I mention this to stress that the PSE is not a direct measure of economic distortion, production or environmental impact but, as policies in the PSE are classified as to how they are implemented, it has been used to rank policy measures according to the potential impacts. The use of PSE data in modelling allows for a quantitative analysis of the impacts of policy measures on production, trade and farm incomes.
It is not always appreciated that the starting point in calculating PSEs was to understand how agricultural policies work in terms of the directions and magnitudes of the flows of transfers between economic agents as a result of policy. PSEs are not calculated in a mechanical, rigid or unchanging way. In-depth studies of the agricultural policies of individual OECD countries26 were undertaken from the mid-1980s and into the 1990s, the evaluation of which largely depended on the PSE indicators calculated as a result of understanding the policies in place. This has been a dynamic process, as new countries joining the OECD meant that the policy environment raised different challenges (such as exchange rate or consumer support policies in Mexico and in the central and eastern European countries). The update of policy developments are reported and evaluated in the annual Agricultural Policies in OECD Countries: Monitoring and Evaluation, while the calculation of PSEs for selected non-OECD countries is regularly reported in Agricultural Policies in Emerging and Transition Economies and other country-specific studies.
The measurement of support is essentially based on the notion of opportunity cost – the set of prices or revenues that would obtain in the absence of the policy measure in place. If a policy measure is removed, a sequence of dynamic consequences follow – changes in world and domestic prices; production, consumption and trade; structures and technology, and so on. However, establishing such a “free trade” scenario as a benchmark for calculating PSEs is fraught with difficulty and would hardly command agreement among policy makers, let alone researchers27. Of course, modelling the effects on world prices and trade arising from a reduction in or removal of support is an extremely worthwhile activity!
The PSE is measured in a static context, using data obtaining in a given year. For example, a policy that gives rise to domestic commodity prices higher than the export price of the same commodity is measured as the unit price difference between observed domestic producer and border prices for the commodity in question at the farm gate level, the overall market price support being that unit price gap multiplied by the domestic production28. Using border prices for commodities that are as close as possible to those produced or consumed domestically in a given country avoided the contentious issue of defining “a world price” for the commodity in question. Similarly, deficiency payments that raise prices for producers above the domestic market and export prices are measured by the relevant price differences or by the budgetary costs incurred. Policies that deliver payments to farmers (such as area or headage schemes, emergency payments, or income support) or payments to finance collective services to agriculture as a whole (such as for research, information, training and inspection) are also measured by the budgetary costs. In all cases, it is necessary to identify the relevant reference value, define the scope of the agricultural sector and policy measures in question, and avoid double-counting in measuring subsidies (including adjustment of livestock PSEs for the extra cost of animal feed as a consequence of cereal support policies).

9
The Producer Support Estimate
The PSE has evolved over the years. In 1999 the “Producer (Consumer) Subsidy Equivalent” was renamed the “Producer (Consumer) Support Estimate”. This was significant in recognising two important, related facts. Firstly, the PSE/CSE measures the transfers associated with a wide range of diverse policies, which have different “subsidy equivalents”. Secondly, arguments were advanced that some of the transfers were for the provision of “public goods”. While it is not always clear where the dividing line is drawn in practice between private and public goods, using the more neutral term “support” acknowledges that a monetary transfer is involved, but no distinction is made as to whether it is for the provision of private goods (of which some could be supplied in the absence of the transfer) or public goods (of which some would not be supplied in the absence of that transfer).
Initially, the focus of the PSE was the overall level of support for each OECD country and the OECD as a whole, without paying so much attention to the contribution of each type of measure to the overall level. This was then supplemented by explaining the causes of the changes in support, using a statistical decomposition technique29. Given the importance of market price support, identifying the contribution of domestic price policy changes relative to world price and exchange rate changes are crucial to illuminating a key aspect of the policy reform debate. With the increasing variety and complexity of policy measures more attention was paid to the classification of policy measures within the overall level of support. Distinguishing between the support provided collectively to the agricultural sector through “general services” and the overall support to producers provided on an individual basis (PSE), as well as classifying policy measures according to how they are implemented is an essential step in undertaking analysis of the impacts of different types of policy measure through the work within the Policy Evaluation Matrix (PEM) – in particular the effect of different policy measures on decoupling from production and trade, and their efficiency in transferring income to farmers.
To summarise: the PSE is an indicator of the annual monetary value of gross transfers from consumers (resulting from policies that keep domestic prices above those at the border) and from taxpayers (resulting from budgetary financed policies) to agricultural producers. The percentage PSE expresses producer support as a percentage of gross farm receipts valued at domestic prices. The TSE is an indicator of the annual monetary value of all gross transfers from taxpayers and consumers arising from policy measures that support agriculture. It includes transfers to producers (PSE) and general services provided to agriculture (GSSE). The nominal protection and assistance coefficients express producer support in relation to gross farm receipts valued at border prices. The complete set of definitions is given in Box 1.

10
Box 1. OECD Indicators of Support
Producer Support Estimate (PSE): the annual monetary value of gross transfers from consumers and taxpayers to agricultural producers, measured at the farm-gate level, arising from policy measures that support agriculture, regardless of their nature, objectives or impacts on farm production or income. It includes market price support and budgetary payments, i.e. gross transfers from taxpayers to agricultural producers arising from policy measures based on: current output, area planted/animal numbers, historical entitlements, input use, input constraints, and overall farming income. The %PSE measures the transfers as a share of gross farm receipts.
Market Price Support (MPS): the annual monetary value of gross transfers from consumers and taxpayers to agricultural producers arising from policy measures that create a gap between domestic market prices and border prices of a specific agricultural commodity, measured at the farm-gate level.
Producer Nominal Protection Coefficient (NPCp): the ratio between the average price received by producers (at farm gate), including payments per tonne of current output, and the border price (measured at farm gate).
Producer Nominal Assistance Coefficient (NACp): the ratio between the value of gross farm receipts including support and gross farm receipts valued at border prices.
Consumer Support Estimate (CSE): the annual monetary value of gross transfers to (from) consumers of agricultural commodities, measured at the farm-gate level, arising from policy measures that support agriculture, regardless of their nature, objectives or impacts on consumption of farm products. If negative, the CSE measures the burden on consumers by agricultural policies, from higher prices and consumer charges or subsidies that lower prices to consumers. The %CSE measures the implicit tax (or subsidy, if CSE is positive) on consumers as a share of consumption expenditure at the farm gate.
Consumer Nominal Protection Coefficient (NPCc): the ratio between the average price paid by consumers (at farm gate) and the border price (measured at farm gate).
Consumer Nominal Assistance Coefficient (NACc): the ratio between the value of consumption expenditure on agricultural commodities (at farm gate) and that valued at border prices.
General Services Support Estimate (GSSE): the annual monetary value of gross transfers to general services provided to agriculture collectively, arising from policy measures that support agriculture regardless of their nature, objectives and impacts on farm production, income, or consumption of farm products.
Total Support Estimate (TSE) the annual monetary value of all gross transfers from taxpayers and consumers arising from policy measures that support agriculture, net of the associated budgetary receipts, regardless of their objectives and impacts on farm production and income, or consumption of farm products. The %TSE measures the overall transfers from agricultural policy as a percentage of GDP.
Source: OECD (2002), Methodology for Measurement of Support and Use in Policy Evaluation. http://www.OECD.org/agr/policy.

11
A more detailed system of PSE classification was developed in the mid-1990s, and all PSE data back to 1986 are now classified under the system shown in Box 2.
Box 2. Classification of policy measures included in the OECD indicators of support
I. Producer Support Estimate (PSE) [Total of A - H] A. Market Price Support B. Payments based on output C. Payments based on area planted/animal numbers D. Payments based on historical entitlements E. Payments based on input use F. Payments based on input constraints G. Payments based on overall farming income H. Miscellaneous payments
II. General Services Support Estimate (GSSE) [Total of I - O] I. Research and development J. Agricultural schools K. Inspection services L. Infrastructure M. Marketing and promotion N. Public stockholding O. Miscellaneous
III. Consumer Support Estimate (CSE) [Total of P - S] P. Transfers to producers from consumers Q. Other transfers from consumers R. Transfers to consumers from taxpayers S. Excess Feed Cost
IV. Total Support Estimate (TSE) [I + II + III R] T. Transfers from consumers U. Transfers from taxpayers V. Budget revenues
Source: OECD (2002), Methodology for Measurement of Support and Use in Policy Evaluation. http://www.OECD.org/agr/policy.
3. RESULTS
The truth is rarely pure, and never simple (Oscar Wilde, The Importance of Being Earnest, 1895)
The OECD has been annually estimating support due to agricultural policies for two decades. The data series30 on a comparative basis dates back to 1986, and the average for 1986-88 is the reference period as it includes the 1987 OECD Ministerial principles for policy reform. Market price support is measured for commodities that account for about two-thirds of total OECD agricultural output on average.
I discuss the results of the work in terms of the outputs (quantitative indicators) and outcomes (influence in policy reform and trade liberalisation, and use in policy analysis). As with many statistics, the indicators of agricultural support have been variously used, misused and abused. Increasing efforts are being made to present them clearly and in ways that are easy to interpret, but it is not a trivial task31!

12
Outputs
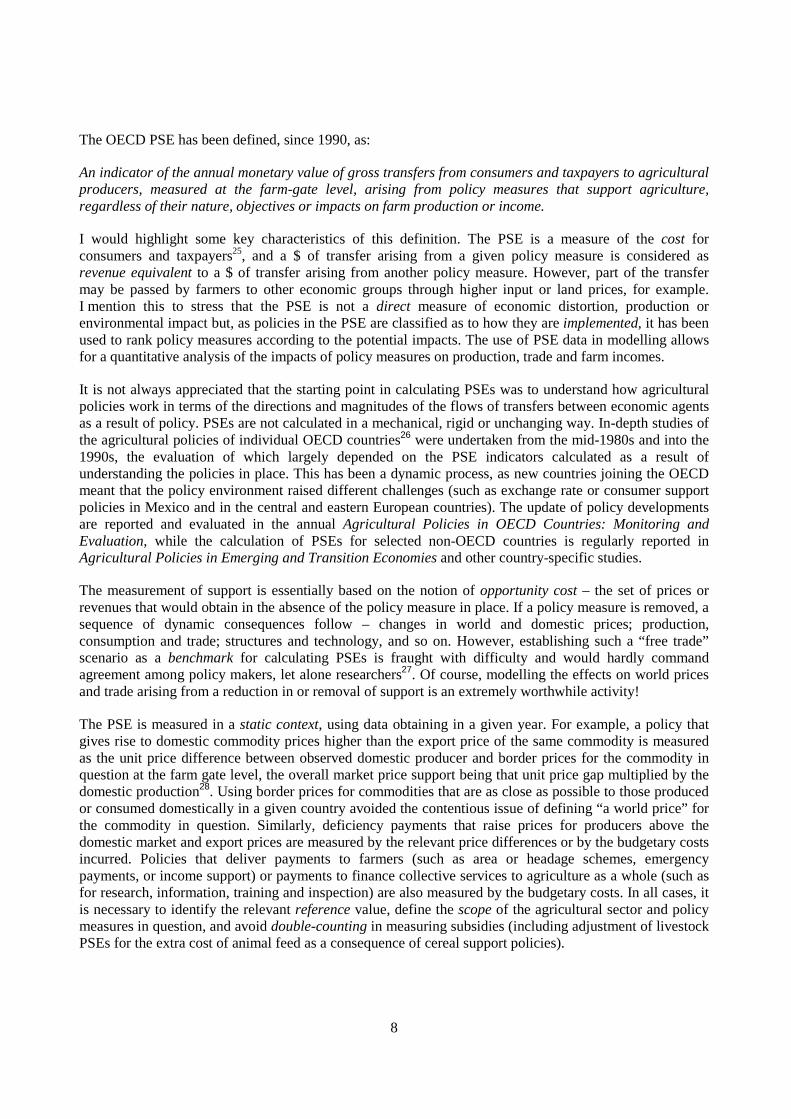
Table 1 and Graph 1 provide an overview of the main indicators of support since the mid-1980s. All the indicators show a modest downward trend, but with year-on-year fluctuations. The most significant change has been the near halving of the gap between world and domestic producer prices. At 57% higher on average at the beginning of the period, as measured by the Nominal Protection Coefficient, it was 35% by the early 2000s. That gap has narrowed somewhat more for consumers.
Table 1. OECD Indicators of Support to Agriculture1
Indicator 1986-88 1993-95 1999-01 PSE Billion $ 239 276 248 Percentage PSE 38 33 33 CSE Percentage CSE -33 -29 -26 NPC (producer) 1.57 1.40 1.35 TSE Billion $ 302 373 330 Percentage TSE in GDP 2.3 1.8 1.3
1 All 30 OECD countries; data for 2002 will be included in due course.
Note: The average OECD PSE in 1979-81 for the then 24 countries of the OECD was 29% and the TSE was $ 150 billion. Care needs to be taken in making comparisons with later years as the method of calculation was different. Source: Agricultural Policies in OECD Countries: Monitoring and Evaluation.
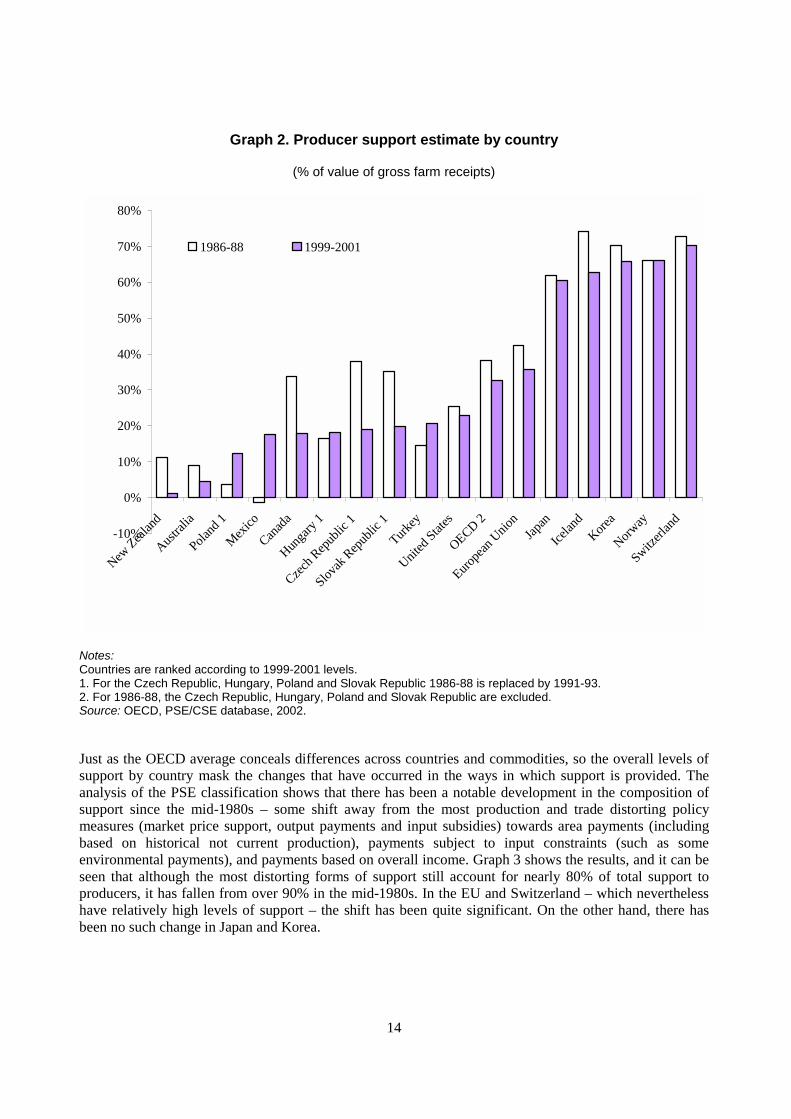
But while those averages reveal progress, they conceal an enormous range of values across countries and commodities. Graph 2 shows PSE data for each OECD country for which estimates are made. Australia and New Zealand currently record very low levels of support (under 10%), while the converse is the case for Iceland, Japan, Korea, Norway and Switzerland (around or over 60%), with the EU (35%) close to the OECD average of 31% (the EU accounts for around 40% of the OECD PSE) and Canada, United States, Mexico, Turkey and the OECD EU accession countries around or below 20%. As to commodities, the more industrialised sectors of pigs and poultry consistently record low levels of support (below 20%), while the so-called “rice pudding” commodities – rice, milk and sugar – are consistently higher (upwards of 45%), with grains and oilseeds in the 20-40% range and red meats around the low 30%. It should be noted that little reduction in support has occurred in the high support countries (and the EU accession countries have moved up towards EU support levels), or in the “rice pudding” commodities. The ranking of countries in terms of the %PSE has hardly changed since the mid-1980s.
13
Graph 1. Evolution of Producer Support Estimate (% PSE), Producer Nominal Protection Coefficient (NPCp) and Producer Nominal Assistance Coefficient (NACp)
(OECD, 1986-2001)
25
27
29
31
33
35
37
39
41
43
1986 1987 1988 1989 1990 1991 1992 1993 1994 1995 1996 1997 1998 1999 2000 2001 2002p1.00
1.10
1.20
1.30
1.40
1.50
1.60
1.70
1.80% PSE NPCp NACp
% PSE NPC/NAC
Source: OECD, PSE/CSE database, 2002.
14
Graph 2. Producer support estimate by country
(% of value of gross farm receipts)
-10%
0%
10%
20%
30%
40%
50%
60%
70%
80%
New Z
ealan
d
Austra
lia
Poland
1
Mex
ico
Canad
a
Hunga
ry 1
Czech
Rep
ublic
1
Slovak
Rep
ublic
1
Turke
y
United
Stat
es
OECD 2
Europ
ean U
nion
Japa
n
Icelan
dKor
ea
Norway
Switzerl
and
1986-88 1999-2001
Notes: Countries are ranked according to 1999-2001 levels. 1. For the Czech Republic, Hungary, Poland and Slovak Republic 1986-88 is replaced by 1991-93. 2. For 1986-88, the Czech Republic, Hungary, Poland and Slovak Republic are excluded. Source: OECD, PSE/CSE database, 2002.
Just as the OECD average conceals differences across countries and commodities, so the overall levels of support by country mask the changes that have occurred in the ways in which support is provided. The analysis of the PSE classification shows that there has been a notable development in the composition of support since the mid-1980s – some shift away from the most production and trade distorting policy measures (market price support, output payments and input subsidies) towards area payments (including based on historical not current production), payments subject to input constraints (such as some environmental payments), and payments based on overall income. Graph 3 shows the results, and it can be seen that although the most distorting forms of support still account for nearly 80% of total support to producers, it has fallen from over 90% in the mid-1980s. In the EU and Switzerland – which nevertheless have relatively high levels of support – the shift has been quite significant. On the other hand, there has been no such change in Japan and Korea.

15
Graph 3. Composition of producer support estimate by country
1986-88 and 1999-2001 (Percentage share in PSE)
0
10
20
30
40
50
60
70
80
90
100
Slov
ak R
epub
lic 1
Cana
da
Switz
erlan
d
Unite
d Stat
es
Euro
pean
Uni
on
Czec
h Rep
ublic
1
Austr
alia
Mex
ico
Norw
ay
OECD
2
Icela
nd
Hung
ary 1
Turk
ey
Japa
n
Kore
a
Polan
d 1
New
Zeala
nd
Payments based on input constraints, overall farm income and miscellaneous payments
Payments based on historical entitlements
Payments based on area planted/animal numbers
Market Price Support, payments based on output, payments based on input use
Notes: Countries are ranked according to the 1999-2001 share of market price support, payments based on output and payments based on input use in the PSE. 1. For the Czech Republic, Hungary, Poland and Slovak Republic 1986-88 is replaced by 1991-93. 2. For 1986-88, the Czech Republic, Hungary, Poland and Slovak Republic are excluded. Source: OECD, PSE/CSE database, 2002.
The OECD “PSE decomposition” explains the factors that contribute to the overall year-on-year change in the percentage PSE for each country. It does not currently lend itself to long-term analysis, but it does reveal two important insights. Firstly, given the predominance of market price support policies in most OECD countries, changes in world prices and exchange rates not transmitted to the domestic market exert a significant effect on the PSE, in particular for countries that have experienced high variability in rates of inflation and exchange rates. Secondly, this also demonstrates – contrary to popular commentary – the seemingly paradoxical result that it is policies that insulate the domestic market and not exchange rate changes that cause changes in the PSE when world prices and exchange rates change.
Consider a stylized example of a country in which there are two tradable sectors, “agriculture” and “manufacturing”. Border protection ensures a certain guaranteed level of domestic prices for agriculture, manufacturing being subject to domestic and world market developments. In the case of manufacturing, domestic prices will vary according to border price and exchange rate movements, while domestic agricultural prices are insulated from border price and exchange rate changes. In the case of manufacturing,

16
domestic and export prices of a given product are the same, support is zero but domestic prices fluctuate together with export prices. In the case of agriculture, domestic prices of a given commodity remain unchanged and differ from export prices, but support will fluctuate together with export prices. These fluctuations in support result from border protection policy measures that prevent domestic prices responding to changes in world prices and exchange rates change, but not from changes in world prices and exchange rates themselves. Similar reasoning applies to changes in deficiency payments that guarantee producer – but not domestic market prices – above those in the world market.
We can bring the main indicators together to assess the extent of policy reform in OECD countries, by tracking changes in the percentage PSE, the share of the most distorting policy measures, and the degree of variation in commodity prices. Graph 4 shows the change since 1986-88 in two of these variables in matrix form: producer support and the most distorting forms of support, both expressed as a share of gross farm receipts32. Countries in the lower left hand quadrant have both reduced support and shifted to less distorting forms of support, the two criteria for progress in policy reform. But it should be noted that some of those countries still have high levels of support, in particular Norway and Switzerland33.
Graph 4. Changes in %PSE and in the share of output and input support in gross farm receipts by country: 1986-88* to 1999-2001
(%PSE for 1999-2001 in brackets)
-100%
-80%
-60%
-40%
-20%
0%
20%
40%
60%
80%
100%
-100% -80% -60% -40% -20% 0% 20% 40% 60% 80% 100%
C hange in share of PSE in gross farm receipts
Cha
nge
in s
hare
of o
utpu
t and
inpu
t-lin
ked
supp
ort i
n gr
oss
farm
rec
eipt
s
C anada (18% )
E uropean U nion (36% )
O E C D (33% )
Japan (60% )
K orea (66% )
A ustralia (5% )
Sw itzerland (70% )
U nited S tates (23% )
Iceland (63% )
N orw ay (66% )
N ew Z ealand (1% )
C zech R epublic (19% )
Slovak R epublic (20% )
H ungary (18% ) M ore support
M ore output/ input linked support
Less support
Less output/input linked support
M exico (18% )
T urkey (21% )
* 1991-93 average for the C zech R epublic, H ungary, M exico, Poland and
S lovak R epublic.
B
D C
A
Note: The diagonal line represents constant shares of output/input linked support in the PSE over the period. Points above the line represent higher shares of output/input linked support in the PSE, and vice-versa, over the period. Source: OECD PSE/CSE database, 2002.
17
Outcomes
Policy Reform
Studies in the OECD and elsewhere have shown that a reduction in production-linked support and trade barriers will more closely align domestic and world markets for agricultural commodities, through a decrease in domestic prices in formerly protected markets and an increase in world prices. The main vehicle through which that closer alignment of prices has taken place – and we have seen progress in that regard – has been the multilateral trade agreements under the auspices of the GATT until 1994 and the WTO since 1995. Reaching a successful conclusion to the Uruguay Round required an agreement on agriculture, and that needed a measurable basis for the “request and offer” process in the negotiations. That basis was the Aggregate Measurement of Support (AMS), which was developed from the PSE.
The PSE is most often compared to the AMS. The PSE and AMS differ in as much as the former is used to monitor and evaluate policies according to OECD Ministerial principles, while the latter is used to monitor the implementation of WTO trade commitments.34 Thus, whereas the PSE is calculated with reference to prices pertaining in the year in question, the AMS is calculated with reference to world prices in a base year (1986-88). The essential similarities and differences in coverage of policy measures between the PSE, AMS, and other measures of support and protection are summarised in Table 2.35

18
Table 2. Coverage and classification of support measures by type of indicator
Policy measureNominal rate of
protection
Nominal rate of
assistance
Effective rate of
protection
Effective rate of
assistanceAMS PSE
Assistance to outputtariffs, import quotas, export taxes x x x x xdomestic pricing arrangements (e.g. two-price schemes) x x x x x x
price stabilisation (underwriting arrangements) x x x
government guarantees x x xexport incentives x x xexport inspection services x x acreage diversion payments x x xarea and headage payments x x xmarketing support x x
Assistance to inputsfertiliser subsidies x x xfuel tax exemptions x x xdisease controls x x x
Assistance to value-adding factorsconcessional credit x x xincome tax concessions x xinsurance subsidies x x xresearch x advisory and extension services x xdisaster relief x xfarm adjustment x x
Tariffs on inputs x x
Source: Inspired from Hazler and Parsons (1987), "The Price Adjustment Gap and World Agricultural Reform", Quarterly Review of the Rural Economy , Vol. 9, No. 2, Australian Bureau of Agricultural Resource Economics.
The process of calculating PSEs built up a climate of confidence between trade negotiators that rarely existed previously because of the inadequate tools available to understand the links between domestic and border measures. The trust built up enabled negotiators to use the AMS as the handy offspring of the PSE. But it was not only in the method to measure support that the OECD contributed to the Uruguay Round process. Since the late 1980s the OECD has analysed agricultural policy measures that decouple support from production decisions, as well as possibilities to harness economy-wide policies to serve agricultural policy objectives, and the creation of markets where none existed. The work contributed to the thinking that emerged in the URAA Agreement on Agriculture “green box.”36 Ongoing work in the broad area of decoupling, transfer efficiency, risk, multifunctionality, and the impacts of agriculture on the environment is intended to provide further guidance on developing “good policy practice”.
It is somewhat more difficult to establish a clear link between the measurement of agricultural support and specific policy actions in individual countries. There is no doubt that countries express a great interest in

19
seeing where they lie in “support league tables”. Many countries use the PSE data base in their own policy analysis and advice. Some countries include a target for reduction of support and a shift to more decoupled measures in their mission statements (e.g. the United Kingdom). There have been cases where the government needed ammunition in negotiations with their farmers (e.g. Austria). Governments and researchers in some non-OECD countries have co-operated with the OECD to develop their own PSEs (e.g. Argentina, China, South Africa, Morocco, Colombia - and Guernsey). The United States until the late 1990s calculated detailed PSEs for many countries, using a slightly different method than the OECD. Their PSE calculations were rigorously undertaken and produced excellent results, but were not perceived as being as “objective” and as credible as the OECD’s (not least because that work is linked with a comprehensive stocktaking of policy developments and an annual policy dialogue).
In this context it should be noted that there has been significant progress in the application of the PSE framework to the analysis of policies in transition (to a market economy) and developing countries. The OECD regularly monitors agricultural policies in the EU accession countries, as well as Russia and the Ukraine. Agricultural support in Brazil will be measured in the near future as part of a major study examining the impacts of farm household adjustment from trade liberalisation.
In most government, inter-governmental organisation (such as the World Bank, IMF and FAO) and media analyses and policy statements advocating agricultural policy reform and trade liberalisation the OECD indicators of support are drawn on. Perhaps the most significant contribution of measuring support is that while it may not have delivered much domestic policy reform directly, it has advanced it indirectly via the international trade agreement route. And it may have stiffened resistance by governments to sectoral producer interests and challenged countries to examine and justify their agricultural policies in a more transparent way than formerly.
Policy Analysis
The PSE and related indicators tell a compelling story about the transfer costs associated with agricultural policies. But there are other costs and governments and the public also want to know something about the benefits37. Have policies delivered the outcomes for which they were designed? And, in the same vein, what have been the unintended spillovers from these policies? These questions are especially posed in the context of the effects of policies (and reform) on agricultural production, trade, farm incomes, structural adjustment, technological development, environment – and the welfare of people in developing countries.
A comprehensive estimation of all forms of impacts (e.g. production, consumption and income) requires an estimation of the subsidy-equivalents of policy measures, classified according to the way in which they are implemented together with the measurement of the amount of the monetary transfers involved; and supply and demand elasticities. The OECD publishes revenue-based Producer Support Estimates (PSE) and Consumer Support Estimates (CSE)38, and has developed the PEM (Policy Evaluation Matrix)39 to estimate the production, consumption, trade and income impacts of agricultural policies in Member countries.40 The PEM analysis is essentially driven on the basis that policies create price wedges for outputs and inputs, between domestic and world markets, and between domestic agriculture and non-agricultural markets.
Three significant results have emerged from the impact analysis using the PSE indicators. Firstly, that the main policy measures used in OECD countries – market price support, output payments and input subsidies are inefficient at transferring income to farmers. The “transfer efficiency” of market price support measures is such that only around 25 cents of each $ of support is actually retained by farmers through higher prices. The remainder accrues variously in the form of efficiency losses, higher prices for inputs and the value of land (and quotas)41. Secondly, given that most support is linked to output, the distribution of

20
most support goes to the fewest but largest farmers – the roughly 20% that produce 80% of agricultural output. Thirdly, the policy measures that are most decoupled from production (such as payments based on overall farm income and, to a lesser extent area payments based on historical production) are the least trade distorting and the most efficient at transferring income to farmers. That result has not been lost on policy makers contemplating reform.
These results may be intuitively obvious and confirm what is anyway known by policy makers familiar with agriculture. But they do provide some ordering and quantitative magnitude to what would otherwise be based on anecdotal evidence. They also help to explain the frustration expressed by farmers who protest that trends in their incomes from farming are not commensurate with the amount of support. For example, data in the UK shows a long term general downward trend in income from farming, yet increasing wealth embodied in land. David Ricardo would have no doubt understood what has been happening in the economic surpluses ending up in land values!
4. CHALLENGES
The time has come, the Walrus said, “to talk of many things: Of shoes and ships and sealing wax. Of cabbages and kings” (Lewis Carroll, Through the Looking Glass, 1872).
An impressive amount of work related to the analysis of agricultural policies has emerged from the OECD, the majority of which relies to a greater or lesser extent on the measurement of support and the data on which it is based. But it is reasonable to ask – and certainly the government masters that fund the OECD want to be assured that they are getting value for money – if the measurement of agricultural support indicators is able to address questions of current and emerging public interest, and how they might be improved. I have noted that agricultural policy measures are becoming more complex (although all have the potential to be expressed in terms of price wedges). But as agriculture becomes more integrated into the domestic and international economy and is expected to deliver more than just food and fibre, a whole range of non-agricultural, economy-wide policies (for example on competition, taxation, environment, social welfare, spatial planning, and labour) impinge on and influence the agricultural sector. Which policies should be included in the measurement of support and how to interpret the results captures this challenge in general. I will deal with some of the specific aspects through highlighting three related questions:
• Is there still a need for the OECD to measure support to monitor agricultural policies, in particular given that the agricultural commitments in the WTO trade negotiations are monitored?
• Do the indicators of support provide useful data to measure the impacts of policy reform on structural adjustment, farm incomes, environmental performance, and on developing countries?
• Should the support indicators be adjusted so that they are calculated in net terms to take into account costs and benefits, especially those associated with environmental externalities?
Measuring support?
The measurement of support, as I have noted, to monitor WTO commitments serves a different (but closely related) purpose to the PSE. There is a continuing demand for indicators of support and the data on which they are founded not only for the trade agenda, but also to assess appropriate domestic policies, in

21
particular the degree of decoupling. And even if a case can be made to develop a more comprehensive indicator of economic efficiency distortion – an effective rate of assistance measure for example – there would be a need to collect the data used to calculate the PSE, as well as additional data relating to the protection or assistance for inputs used in agriculture42.
The PSE, as I have noted, has evolved. Improvements through better data availability, wider coverage of commodities and (non-OECD) countries are ongoing43. Explaining PSE results to policy makers and the public (who want simple “headline” results) as well as to experts (who want rigour, detail and all the caveats spelt out) is a balancing act for the OECD. One challenge is to improve the classification of support measures within the PSE, so as to accurately reflect the development of policies. There is no doubt that the characteristics of policies have become more complex over time: the conditions under which transfers are made has shifted from almost entirely “current prices and production” (market price support and deficiency payments) to mixtures of “current and past prices and production” based measures, often with constraints imposed on the conditions under which farmers are eligible for payments. Policies increasingly deliver transfers not on the basis of commodity production (whether past or present) or input use, but on other bases, such as area, environmental criteria, and overall farm income. This requires making a better distinction between support to commodities as such, to inputs used, to the farm as an entity, and to the agricultural sector as a whole44. In addition, more attention needs to be paid to better integrate the coverage of support (as measured by the PSE) into the system of national accounts.
But there is another challenge – which is most evident in extension of the PSE calculations to transition and developing countries – to distinguish between policy and non-policy sources of price distortion in markets. One of the underlying assumptions of the PSE method and the interpretation of the results is that in the absence of trade barriers there would be a high degree of transmission of price signals between world and domestic markets. In other words, markets function efficiently. But where markets are not fully developed, where there are large and relatively isolated subsistence farm sectors, and where macro-economic policies create large distortions (especially through exchange rate policy), measuring price gaps (“market price support” in PSE terminology) captures a range of market impediments. In a sense, trends in market price support are a tool to monitor the transformation of the agricultural sectors in these countries. There is another aspect to this problem: market price support is measured at the farm gate level in the agri-food chain and often adjustments need to be made to compare domestic and border prices at that level. There is a risk of under or over estimating market price support unless margins are correctly taken into account in the measurement of support.
Measuring impacts?
Analysing the impacts of support (and reform) on structural adjustment, farm incomes, environmental performance and developing countries present quite formidable challenges. The relationships between changes in support and commodity production are well established. The PEM model has already thrown light on the effects of different policy measures on production and the efficiency of income transfers. Agricultural policies alter the incentives facing farmers in terms of levels of production, the location of farming, the use of different resources and purchased inputs used, and the farm practices employed. Support tends to be capitalised into the value of land, a relatively fixed asset, which encourages its more intensive use. Support also makes it profitable to bring economically marginal and environmentally fragile land and other resources into production. These generate impacts on structures, incomes and increase environmental pressure on land and water resources. However, in some cases policies allow traditional agricultural production, which would otherwise not be profitable, to continue, providing landscapes and habitats that are environmentally beneficial. The analytical challenge is to distinguish between changes in environmental quality due to policies and due to other driving forces.

22
The effect of support on developing countries has been highlighted in recent years in the WTO Doha Development Agenda and the UN Johannesburg Summit. The IMF and World Bank as well as many researchers have extensively analysed the issue, mostly through general equilibrium modelling45. The general conclusion is that reforming agricultural policies in such a way that market access into OECD countries is enlarged, export subsidies are eliminated, and production enhancing domestic support is reduced will primarily benefit producers of competing agricultural exports from developing countries. The dynamic effects leading to greater economic growth due to trade liberalisation will be of wider benefit. Three notes of caution are warranted. First, much of the gain from reducing OECD country-support and trade liberalisation will be apportioned among OECD countries in so far as temperate commodities are concerned. Second, some of the elements in the overall transfers from agricultural policies (TSE) – those that are most decoupled from production decisions – do not have sizeable trade effects. Third, it is important that the debate on improving welfare in developing countries is not limited to the (very real) need to reduce OECD trade-distorting support – other necessary actions also need to be undertaken by developed and developing countries. Those include developing markets, infrastructures, property rights, institutions to enforce contracts, education and training and so on.
Adjusting for Externalities?
Evaluating the costs and benefits associated with support is probably the most challenging issue. However, it should be made clear at the outset that in the current definition of the PSE – a measure of consumer and taxpayer transfers to farmers from agricultural policies – it would be incorrect to make adjustments for such costs and benefits, including those associated with environmental externalities. The percentage PSE expresses those transfers as a share of gross farm receipts, and what would be the meaning of the PSE if it is adjusted for environmental externalities? There are formidable difficulties in calculating the value of non-internalised net externalities (a mixture of positive and negative environmental effects). Moreover, some governments justify some of the existing transfers on the grounds that they compensate for (positive) externalities not remunerated by the market, or to pay for the costs incurred by farmers for meeting environmental regulations (which may be inconsistent with the polluter pays principle). Adjustments, if made, would have to be done for both the transfers and the value of the associated costs and benefits.
But there is nevertheless a very real issue for policy in addressing environmental “free riders and free raiders”. The beneficiaries of environmental services from agriculture for which they do not pay, nor for which farmers receive payment are “free riders”46. Polluters who do not pay the cost of damage they cause elsewhere are “free raiders”. Welfare is improved if an unsatisfied demand for environmental services is provided that would not otherwise be forthcoming from agriculture, and if farmers are held to account for unpaid environmental damage as a consequence of agricultural activity. These environmental effects are linked to policy via the influence of policies on farm production and practices. The point is that while every effort needs to be taken to properly account for environmental externalities in so far as overall welfare is improved,47 this does not necessarily translate into the need to adjust the calculation of the PSE.
5. CONCLUDING COMMENTS
I started this address by pointing out that reform involves both reducing overall support and shifting to less production and trade distorting measures. Of the (limited) reform, most progress has been in shifting rather than reducing support. That implies some decoupling of income support from production decisions. Nevertheless, ongoing analysis promises to throw more light on the effect of different policy measures on the degree of decoupling, in particular in a dynamic and wider context (for example through looking at wealth and risk effects). On the reasonable assumption that governments will want to provide a safety net (and not a cushion) for farm incomes, and to ensure that farmers are rewarded for non-remunerated
23
environmental services desired by the population, the focus shifts to deciding the basis on which income support or environmental payments are provided (or coupled). This means paying more attention to defining policy objectives, targeting outcomes, and designing instruments that are efficient and effective. A key requirement in this process is transparency – provided by indicators of support so that there is public awareness of the aims of policies, the ways used to achieve them, and degrees of accountability.
An important observation from this discussion on the link between the measurement of support (PSE) and impacts on key societal concerns is that reducing support and trade liberalisation are necessary but not necessarily sufficient to improve welfare. Policy reform implies more than that. Complementary policies and market actions – infrastructure development, clear and enforceable property rights, workable institutions, and good governance are also needed.48 It is worth recalling in the context of looking for better policies and approaches that economic development means structural adjustment of the primary agricultural sector. Labour leaves agriculture relentlessly, year on year. As recently as 15 years ago, on average 10 per cent of the OECD civilian population worked in agriculture. Today it is under 8 per cent. Some agricultural policies may have marginally slowed down the exodus, but many will have accelerated the process. This provides a rich terrain for researchers to plough.
The PSE for agriculture was born in 1973, with a rather good pedigree. It was adopted in 1982 by the OECD. Under the parental guidance of the OECD the infant grew – not without difficulty in its teenage years – into a reasonably well-behaved and interesting adult. Although it was misunderstood when young, it resisted going off in all directions. Its adopted parents – under some pressure from its extended family – altered its name in its mid-20s, to reflect its true nature, but kept its initials to minimise confusion. Its natural father was somewhat surprised at the name change, but still keeps a watchful eye on its progress. It has lent its skills to other industries, although not with the kudos that its work for agriculture has conveyed.
The PSE has just celebrated its 30th birthday and is enjoying good health, is very busy finding new things to do, is invited to some of the best meetings around the world, has gained a certain celebrity status – and is a very good employer. Some people think it is a bit arrogant at times and gets involved in things that are not its business, but it does not really have a lot of competition. Nevertheless, its family is wondering if the time has come for it to have another make-over, although they are not envisaging a major career change. The PSE still has some years left but might benefit from working with a companion to do some of the new jobs that it is not best skilled to do. It has to pay attention to remain lean and fit to do its existing job, but is not expected to take early retirement. The PSE has got to that age when, as for any other youngish celebrity, it could expect to be the subject of a serious biography!

24
NOTES
1. The term “subsidies” in the title is in common usage, although in the context of the OECD work the term
“support” – which is a wider concept – is used. In fact, many terms are often used synonymously to denote “subsidies”, such as support, assistance, aid, and transfers.
2. The OECD is a 41-year old inter-governmental policy research organisation that brings together 30 of the world’s market economies broadly sharing a common set of values. It is a forum to discuss economic, social and environmental issues; share experiences; engage in forward thinking; and develop strategies for action both at the domestic and international levels on the basis of analysis and harmonised statistics largely undertaken by the Secretariat. The overall aim is to improve policy design and implementation. The OECD works through dialogue and consensus, and increasingly engages non-Member countries and civil society in its activities. Member countries finance the Organisation, determine the policy issues to be addressed, and take decisions on any policy recommendations. The Secretariat is charged with undertaking objective economic analysis of policy issues and, in so doing, draws on research outside the Secretariat.
3. This is not the first time that the AES has elected a President with close connections to the OECD: Michael Tracy, who was President in 1984-5, was Head of Agricultural Policies in the OECD until he moved to the EC Council Secretariat in 1973.
4. I was engaged for a short period as an OECD consultant in 1979-80, when I prepared a study on Food Policy (OECD, 1981), which looked at policy integration in the agri-food chain and dealt with links between agriculture, food, and health — all issues that are currently of topical interest.
5. It may be of interest to note that the term “protection” is largely used with a negative connotation when applied to domestic industries and trade, whereas in other domains and popular usage, it normally conveys a positive image.
6. One of the best analyses of agricultural trade problems during this period can be found in D. Gale Johnson (1973), World Agriculture in Disarray, Macmillan, London.
7. “Non-economic objectives” are also sometimes referred to as “non-trade concerns” and have close connections with the policy measures permitted in the URAA “green box”, and with the concept of “multifunctionality”. A critique of “non-economic” objectives can be found in Alan Winters (1989-90) The So-Called Non-Economic Objectives of Agricultural Policies in OECD Economic Studies, No. 13.
8. Economics ministries (suppliers) provide budgetary-financed subsidies, while Agriculture ministries (demanders) are the channel by which those subsidies are transferred to their “clients”, the agricultural industry. Foreign and Trade Ministries have to deal with the consequences of domestic subsidies on world markets and international trading relations (trade disputes) – thus an acceptable measure of support that could translate into a negotiating tool had the potential to provide a way forward in settling those disputes (equilibrium).
9. The Uruguay Round was the eighth in a series that started in Geneva in 1947, and the last to be undertaken within the GATT. It took 8 years to conclude, the longest of any of the other rounds.
10. While the OECD Council at Ministerial level meets annually, meetings of OECD Agriculture Ministers are not frequent events. Since 1987 they have only been held twice, in 1992 and 1998. Agriculture ministers agree to meet in the OECD when there are important policy and trade issues of common concern to address and to provide impetus to domestic and trade policy reform. However, from time to time high-level officials from Ministries of Agriculture meet in the OECD, the last occasion being in September 2001.

25
11. The Communiqué of the 1998 OECD Ministerial meeting also referred to the multifunctional character of
agriculture, arguing that while agricultural activity provides a range of other outputs in the process of producing food and fibre, the challenge is to find ways to do so that are compatible with trade liberalisation. The OECD has contributed significantly to the analysis of multifunctionality in recent years. The key issues concern the extent to which the non-commodity outputs are linked with agriculture, the existence of market failure, the valuation of non-market benefits, and the appropriate market and policy responses to ensure the least cost provision of multiple outputs. Multifunctionality was first mentioned in an OECD Agriculture Ministerial at the 1992 meeting in the intervention by the then Austrian Minister of Agriculture, Franz Fischler, but it was not referred in the Communiqué. The first reference of the multifunctionality of agriculture in a communiqué from an international meeting appears to have been in Agenda 21, emerging from the UN “Earth Summit” in Rio de Janeiro in 1992. An OECD workshop on The Environmental Benefits of Agriculture held in Helsinki in 1996 (OECD, 1997) looked at the policy implications of the linkages between agricultural activity and non-marketed environmental services, but did not use the term “multifunctionality”.
12. Policy reform depends on actual, expected or perceived benefits to outweigh the costs of inaction. Often the costs and benefits are unknown (and thus there is a role for empirical work); sometimes events (such as the BSE crisis or natural disasters) provide a catalyst to jolt reform, even when there may only be a weak connection with agricultural policy; and sometimes pressure from elsewhere in the economy or from multilateral agreements provide an impetus to reform that would otherwise be difficult to achieve.
13. Side or indirect effects may reduce or enhance welfare on other people. Adam Smith’s “invisible hand” is an example of a welfare-enhancing unintended effect: “It is not from the benevolence of the butcher, the brewer, or the baker, that we expect our dinner, but from regard to their own interest. We address ourselves not to their humanity, but their self love” (Wealth of Nations, 1776).
14. An OECD paper prepared by Ronald Steenblik on Subsidy Measurement and Classification: Developing a Common Framework for an OECD Workshop on Environmentally Harmful Subsidies (November 2002) provides an overview of subsidy concepts and definitions in a cross-sectoral and historical perspective. The case of agriculture is described in an OECD paper prepared by Luis Portugal, OECD Work on Defining and Measuring Subsidies in Agriculture, http://www.oecd.org/agr/ehsw
15. André de Moor (2001), Perverse Incentives, Earth Council Report, Institute for Research on Public Expenditure, The Hague, also cited in C van Beers and André de Moor, Public Subsidies and Policy Failures, Edward Elgar
16. Based on S. Tangermann, T. Josling and S. Pearson (1987) Multilateral Negotiations on Farm Support Levels, The World Economy, Vol. 10, No 3, pp 965-981
17. A considerable amount of discussion and debate, and review of alternative methodologies took place in the OECD Secretariat before deciding on the measure of support (PSE) and modelling approach.
18. T. Josling, (1973) Agricultural Protection: Domestic Policy and International Trade, c/73/LIM/9, FAO. The study was further developed in (1975) Agricultural Protection and Stabilisation Policies: A Framework of Measurement in the Context of Agricultural Adjustment, c/75/LIM/2, FAO. The impact of the initial measurement of agricultural PSEs for the FAO was muted. One significant reason was that the steep oil and food price rises in the early 1970s suggested that the problem was to produce more food rather than to reduce protection.
19. In National Policies and Agricultural Trade (OECD, 1987). The CSE — Consumer Subsidy Equivalent — was defined as “the implicit tax on consumption resulting from a given policy measure (market price support element of the PSE) and to any subsidies on consumption.”
20. OECD (1989-90), The Ministerial Trade Mandate Model, in OECD Economic Studies, No. 13, Winter.
26
21. W. M. Corden (1971), The Theory of Protection, Oxford University Press
22. The impact on production (consumption) or on farming income (consumption expenditure) is the same because such an impact is either a shift along the supply and/or demand curves, which raises (reduces) farming receipts (consumption expenditure), or a shift to the right of these two curves, which reduces farming costs (e.g. payment per hectare, and input subsidies) or consumption expenditure (e.g. food aid).
23. Revenue (receipts) is not the same as income, which is revenue less costs.
24. George Peters (1988), The Interpretation and Use of Producer Subsidy Equivalents, Oxford Agrarian Studies. Further critiques by George Peters were made in (unpublished) papers prepared for the Summer School on European Integration, held in the University of Sienna, Italy, in September 1989.
25. One of the lessons from using the PSE to measure agricultural support was the broad recognition that it is financed by both consumers and taxpayers – a fact that nevertheless has to be continually repeated.
26. The European Union is treated as one country for the purpose of PSE calculations, given the common policy for agriculture applied throughout the Union.
27. A recent critique of the OECD method of calculating milk PSEs by Maurice Doyon (Laval University, Quebec, Canada) in a paper, The Concept of Producer Subsidy Equivalents Challenge for the Dairy Sector? presented at the 26th International Dairy Federation World Dairy Congress, 24-27 September 2002 in Paris is based on the assumption that free trade dairy prices would be different from the actual border prices used in the OECD calculations. This is correct — but the PSE does not assume (or calculate) free trade prices as its border price benchmark.
28. A similar procedure is used for calculating the CSE, which is also measured at the farm gate level, and which is usually an implicit tax when domestic market prices are higher than those at the border.
29. The “decomposition” (or “PSE tree”) analysis was developed by staff in the OECD Secretariat, in particular by a former colleague Mathew Harley, to show the contribution of budgetary payments and market price support to the overall change in the PSE by country, and in particular the contribution of world prices, exchange rates and domestic prices to changes in market price support.
30. The main results are published annually in Agricultural Policies in OECD Countries: Monitoring and Evaluation. The detailed background data have been available on CD-ROM (to 2002) and (from mid-2003) on the OECD website.
31. The key results are presented in summary form in a short Highlights publication, based on the annual Agricultural Policies in OECD Countries: Monitoring and Evaluation. A concise account of the PSE methodology and PSE indicators can be found in W. Legg (2002) Trade in Milk and Dairy Products, International Standards: Subsidy Measures in Encyclopaedia of Dairy Sciences, Academic Press.
32. A summary of OECD work in this area is given in Jesús Antón and Darryl Jones, How Much Agricultural Policy Reform in OECD Countries? In Eurochoices, Winter 2002. The OECD is also developing “spidergrams” for each country to visually show the changes in: the %PSE; the composition of the PSE; and variations in commodity prices, between 1986-88 and 2000-02.
33. To adopt a culinary metaphor, agricultural policies are being cooked with new experimental recipes in many national kitchens, to satisfy different national tastes. If subsidies are to policy what fat is to cakes, then a healthy, nutritious and appealing policy cake would be low on total fat, but generous with the good sort and sparing with the bad. The countries that have adapted their recipes most in this healthy direction would find themselves located in the lowest part of the left-hand corner.

27
34. For a detailed discussion of the PSE and AMS see Dimitris Diakosavvas, How to Measure the Level of
Agricultural Support: Comparison of the Methodologies Applied by OECD and WTO, in China in the Global Economy: Agricultural Policies in China after WTO Accession (OECD 2002); and Tom Hertel (1989) PSEs and the Mix of Measures to Support Farm Incomes, The World Economy, Vol. 12, No.1
35. See also T. E. Josling and S. Tangermann (1989) Measuring Levels of Protection in Agriculture: a Survey of Approaches and Results in A. Maunder (ed) Agriculture in an Interdependent World, Proceedings of the 20th International Conference of Agricultural Economists, Gower, London, and J. Strak (1982) Measurement of Agricultural Protection, Macmillan, London.
36. Agricultural Policy Reform: New Approaches. The role of direct income payments (OECD, 1994)
37. A review of the costs and benefits of agricultural support can be found in Alan Winters (1987)) The Economic Consequences of Agricultural Support: A Survey, OECD Economic Studies, No.9, Autumn
38. Methodology for Measurement of Support and Use in Policy Evaluation (OECD, 2002)) http://www.oecd.org/agr/policy.
39. Market Effects of Crop Support Measures (OECD, 2001)
40. The “income transfer efficiency” and “income subsidy-equivalent” of a policy measure are two ways of expressing the same effect on income. The Incidence and Income Transfer Efficiency of Farm Support Measures. (OECD, 2002). A useful review of quantitative research on trade distortions can be found in Kym Anderson (2002) Measuring Effects of Trade Policy Distortions: How far have we come? Discussion Paper No. 0209 Centre for International Economic Studies, Adelaide University, Australia.
41. See J. Dewbre, J. Antón and W. Thompson (2001) The Transfer Efficiency and Trade Effects of Direct Payments, American Journal of Agricultural Economics, 83(5).
42. An early review of the PSE concept and comparisons with other measures of support can be found in Carmel Cahill and Wilfrid Legg (1989-90)) Estimation of agricultural assistance using producer and consumer subsidy equivalents: theory and practice, OECD Economic Studies, No. 13, Winter
43. PSEs are not calculated for the individual member states of the EU. With enlargement, countries for which PSEs are currently not calculated will be included in the EU PSE. The EU PSE will then determine the OECD average PSE even more than at present.
44. An OECD workshop will look at these issues in June 2003
45. See, for example, Tom Hertel, Recent Developments in Global Economic Modeling using GTAP, paper presented at the Third Annual Conference on Global Economic Analysis, 27-30 June 2000, Monash University, Australia.
46. As are farmers who receive support paid across-the-board for “environmental service” yet for which they do not provide such services.
47. The transactions costs of taking into account and apportioning the responsibility for environmental externalities may not justify the benefits. Le mieux est l’ennemi du bien (Voltaire, Contes, 1772)
48. To contribute to thinking on how countries can design appropriate policies, see the recent OECD report, Agricultural Policies in OECD Countries: A Positive Reform Agenda (OECD, 2002)

28