agri-food trade and food security
TRANSCRIPT
Peter Talks
Agricultural policies and institutions specialist
Agri-food Trade and Food
Security in the Southern and Eastern
Mediterranean Countries
Highlights
• The Southern and Eastern Mediterranean countries (SEMCs) 1 have significant and
increasing food import requirements, with an agricultural trade deficit of USD 32 billion in
2013.
• With grains, oilseeds and their derivatives representing over one-half of SEMC imports,
the countries are highly vulnerable to adverse movements in the price of grains and oilseeds.
• SEMC trade with the European Union (EU) has not been deepened by the Barcelona
Process – but it has ensured that SEMCs have maintained their share of EU imports.
• Fruit and vegetables, the main SEMC export products, are also the most sensitive for the
EU, with seasonal tariffs, minimum prices, tariff rate quotas (TRQs) and non-tariff barriers
(NTBs) affecting SEMC exports to the EU.
• Agricultural exports have risen considerably in recent years, with a substantial
reorientation of exports towards the Middle East and North Africa (MENA) region2 as the
relative importance of the EU as an export destination has declined from 59 percent in 2000 to
34 percent in 2013.
Policy relevance
• With transport costs up to four times more than international benchmarks, investment
in increased efficiency in import supply logistics would help SEMCs to reduce import costs,
especially if coupled with policies that encourage increased private sector involvement and
investment.
• A strategy of agricultural self-reliance – encouraging agricultural export revenues in
order to help cover food import costs – rather than food sovereignty would enhance food
security and minimise the disadvantage of limited natural resources.
• Improved trade facilitation, infrastructure and logistics would help to improve
integration with world markets and encourage exports, particularly when coupled with
domestic reforms to encourage investment and reduce non-tariff barriers to trade.
• In terms of any future EU-SEMC trade liberalisation, the removal of NTBs would provide
a more substantial boost to SEMC agricultural exports to the EU than full tariff liberalisation.
1 Algeria, Egypt, Jordan, Israel, Lebanon, Libya, Morocco, Syria, Tunisia, Turkey, the West Bank and Gaza. 2 The MENA region is composed of the SEMCs plus Bahrain, Kuwait, Iran, Iraq, Oman, Qatar, Saudi Arabia, UAE and Yemen.
Executive summary
Food security is a key challenge for many of the SEMCs. The critical social, economic and
political importance of addressing food security was underlined by the food price shocks since
2008.
The SEMCs have a significant and increasing need to import food from world markets.
Due to high population growth rates, increasing urbanisation, rising incomes, and resource
constraints, demand for food in the SEMCs over the past decades has surpassed domestic
production. With the exception of fruit and vegetables, all other major food commodity groups
have experienced a widening gap between consumption and domestic production. As a result,
the region has become increasingly dependent on the world market to meet its basic food needs.
Taken together, grains, oilseeds and their derivatives (oils and animal feed) represent
53 percent of the SEMCs imports. This implies that total SEMC agricultural import costs are
highly vulnerable to adverse movements in the prices of grains and oilseeds.
A key challenge for the SEMCs is to find the best ways to improve food security, whilst
recognising that there will be a continued and increasing dependence on imports. For all
the SEMCs except Morocco, the ratio of food imports to total merchandise exports deteriorated,
i.e. food imports rose as a proportion of total exports between 2008 and 2013.
Regional integration is a major feature of the trade policy strategies of all the SEMCs
With the aim of enhancing trade and economic integration, and ultimately stimulating the
region’s potential for growth and job creation, the SEMCs have signed a large number of free
trade agreements (FTAs) over the past 20 years, including amongst themselves, as well as with
the EU, Turkey and the United States. The Greater Arab Free Trade Area (GAFTA) created a free
trade area between 18 Arab countries in 1998, liberalising all trade over ten years including for
agricultural products. The Agadir Agreement fully liberalised trade between Egypt, Jordan,
Morocco and Tunisia in 2006.
The EU is the main trade partner for most of the SEMCs, most of which have some form of
FTA with the EU as a result of the Barcelona Process, launched in 1995, which included the
objective of promoting trade integration between the EU and Mediterranean countries with the
larger goal of reducing barriers to trade and investment. Turkey and EU have also signed a
customs union, a type of trade bloc that is a free trade area with a common external tariff.
However, in many of these agreements, a number of agricultural products are excluded from full
trade liberalisation. Since 2008, a subsequent round of agreements focused on agricultural trade
between some of the SEMCs and the EU, removing tariffs on most agricultural products apart
mainly from certain fruit and vegetables for which TRQs and (minimum) entry prices apply.
Since 2011, negotiations have begun between the EU and Egypt, Jordan, Morocco and Tunisia
for deep and comprehensive free trade areas (DCFTAs). One of the objectives of the DCFTA is
to bring SEMC legislation closer to EU legislation in trade-related areas by covering regulatory
issues such as technical barriers (TBT) and sanitary and phytosanitary (SPS) measures, either
by mutual recognition or aligning requirements. The EU DCFTAs aim to deepen market access
by reducing tariffs and, most importantly, by tackling non-tariff measures (NTMs), including
TRQs.
Net agri-food imports rising despite strong agricultural export growth
SEMC imports of agricultural products have increased from USD 25.6 billion in 2005 to
USD 66.2 billion in 2013, while exports have also increased from USD 16.5 billion to
USD 33.8 billion in the same time period. Net imports have increased from USD 7.7 billion in
2000 to USD 10.1 billion in 2005 and USD 32.4 billion in 2013, with all countries except Turkey
importing more agricultural products on balance.
While the imports from the EU have more than tripled in value since 2000, the emergence of
South America and the Black Sea region as important suppliers to the region means that the EU
share of SEMC imports slipped from 35 percent in 2000 to 29 percent in 2013, whilst 5 percent
of imports are from other SEMCs. The proportion of EU agricultural exports to the SEMCs has
remained unchanged over the past 15 years at 11 to 12 percent.
Cereals are the most significant import, accounting for roughly 25 percent of total agri-food
imports in the region (more than one-third for Tunisia and Egypt), including 29 million tonnes
(million tonnes) of wheat and 18 million tonnes maize in 2013. The value of cereal imports
more than tripled between 2000 and 2013: slightly more than one-quarter of the increase was
due to higher volumes, while the rest was due to higher world prices.
The value of SEMC agricultural exports has also increased rapidly since 2000, rising from
USD 6.7 billion in 2000 to USD 31.4 billion in 2013 -- although it should be noted that the
region’s agricultural trade deficit was still increasing during this time. Around one-half of the
region’s exports are from Turkey, a proportion that has remained stable over time. Egypt’s
exports grew substantially between 2000 and 2009, multiplying by 12 in value; but since 2009,
export values have remained at the same level, close to USD 5 billion.
Since 2000, the importance of the EU market has declined from taking 59 percent of SEMED
agricultural exports in 2013 to 34 percent, although the SEMCs have maintained a constant 6
percent share of EU agricultural imports. During the period 2000-2013, exports to the EU
increased by just one-third of the rate of total SEMC agricultural exports. This effect was most
pronounced for Egypt and Turkey; but even for Morocco, exports to the EU grew by 38 percent
less than total exports. Relative to EU total agricultural imports, Egypt and Lebanon maintained
their market share, whilst Israel, Morocco, Tunisia and Turkey lost market share.
Fruit, vegetables and preparations thereof are the most important regional export by value,
accounting for 44 percent of SEMC agricultural exports, rising to 50 percent for Morocco and
Egypt. This group also accounts for two-thirds of exports to the EU, USD 6.7 billion in 2013.
Exports in Tunisia are dominated by olive oil (44 percent) and in Algeria by sugar (70 percent).
Since 2000, there has been a substantial reorientation of exports towards the MENA
region, which now absorbs one-third of SEMC agricultural exports. Between 2005 and 2013,
SEMC total agricultural exports increased by 123 percent, with exports to the EU growing in
value terms by 33 percent and those to MENA by almost 300 percent. This shift is less
pronounced for Morocco and Tunisia, which are geographically farther from the key Gulf
markets.
A comparison of Moroccan and Egyptian tomato exports illustrates some of these trends.
Ninety percent of EU imports of fresh tomatoes are from SEMCs, with Morocco benefitting from
a 277 000 tonne zero duty TRQ in 2014/15 and a reduction in ad valorem tariffs for over quota
exports, and Egypt from unlimited zero duty access3. More than 90 percent of Moroccan tomato
3 Although exports from both countries are still subject to specific tariffs from the EU (minimum) entry price system. Additionally, until October 2014, Morocco benefitted from generous conditions under the
exports are to the EU, which more than fill the TRQ: 366 000 tonnes (2012-14 average), most of
which are exported during the TRQ “season” from October to May. In contrast, Egypt’s main
export markets are Saudi Arabia, Iraq, Libya and Syria, with 9 percent going to the EU.
Impact of the FTAs
The economic benefits of intra-regional integration resulting from, for example, to the GAFTA,
have been limited to date by exceptions to liberalisation for sensitive products, NTBs and trade
constrained by poor infrastructure, transportation services and customs delays.
Globally, the Barcelona Process has not deepened EU-SEMC trade. The progress in expanding
trade, fostering investment in the region, and accelerating the convergence in living standards
was limited and did not live up to the expectations the initiative raised when it was launched in
1995. The World Bank (2010) argues that that FTAs signed by the SEMCs with the United States
and the EU have not had an additional positive effect on total merchandise exports, and imports
also rose more than exports, noting that there is no evidence that these FTAs have contributed
to investment flows in the region.
The positive impact of the EU-SEMC agreements has been recognised as helping governments to
focus on domestic reforms, as was the case in Egypt, where the Association Agreement helped
shift the government focus to trade facilitation and reform of SPS issues.
Garcia-Alvarez-Coque and Marti-Selva (2006) note that SEMC exports of fruit and vegetables are
higher with an Association Agreement than without it based on a gravity model, although they
are still substantially less than their potential level if there were no barriers to trade. High EU
agricultural tariffs, TRQs and NTBs have been cited as factors in the agreements restricting
intra-Mediterranean integration, as well as the sometimes poor logistical performance found in
parts of the region.
Concerning the more recent agricultural trade liberalisation, it is difficult to draw any clear
conclusions for Egypt since 2010: the average export level of 2008-09 increased 32 percent by
2014 for both total agricultural exports and agricultural exports to MENA countries, whilst EU
exports increased by 17 percent. However, for Morocco since October 2012: both total
agricultural exports and agricultural exports to the EU increased by 50 percent between the
2009-11 average and 2014.
Turkey has maintained a significant trade surplus in agricultural trade with the EU. Eighty-
five percent of Turkish agricultural products were exported to the EU at zero duty during the
period 2008-10; however, barriers to Turkish exports to the EU remain, particularly SPS.
Turkey has seen its share of EU imports of “Mediterranean” products (fruit and vegetables, olive
oil and wine) decline by 15 percent between 2000 and 2011. The export behaviour of Turkey
seems to show a reallocation of agricultural exports towards other markets, such as the Russian
Federation and other eastern European countries (Lopez et al., 2013).
Scope for increased future SEMC exports to the EU with full liberalisation and removal of NTBs
In the long run, the SEMCs as a whole are expected to continue to be substantial net food
importers given the high rate of population growth and limited natural resources to expand
EU entry price system for fruit and vegetables that effectively meant tomatoes entered the EU with minimal tariffs. The new entry price rules may impact on future over-quota exports.
agricultural production. It has been estimated that food imports could rise by between 50 to 75
percent by 2030.
In terms of the possible evolution of intra-regional trade, the result is particularly sensitive to
the modelling approach adopted. Gravity models tend to suggest that the level of trade
integration is below expectations and thus has scope to increase, particularly when barriers to
integration are eased or removed. Approaches based on trade intensity indices and simple
shares suggest that intra-SEMC trade is not particularly low and is expanding. Martin (2010)
uses a gravity model to argue that SEMC exports to the EU have already practically reached their
potential given the current level of trade preferences, although there may be scope for increased
exports from the Mashreq countries4.
The European Commission (2013) modelled the impact of agricultural trade liberalisation
between the EU and the Euro-Med countries, estimating that EU agricultural imports from the
Euro-Med countries would double to USD 3.7 billion under a scenario of tariff liberalisation and
more than triple to USD 11.5 billion if tariffs are liberalised and all NTBs are removed. Full
agricultural trade liberalisation between the EU and SEMCs is also predicted to reduce food
costs in the SEMCs but would increase the proportion of food that is imported.
How can trade be mobilised to improve food security?
Many of the SEMCs face food security risks due to their significant and growing net agricultural
imports.
With cereals accounting for over one-quarter of imports, there is scope for the SEMCs to import
it in a more reliable and cost effective manner, with investment in increased efficiency in
import supply chain logistics and enhanced procurement policy supplemented by well-
designed strategic reserve policies. The cost of moving grain from port to mill is up to four times
higher in some SEMCs than international standards, with additional costs due to slow vessel
turnaround times, storage costs, high product losses (USD 480 million for the MENA region in
2009) and lack of competitive inland transportation services.
SEMC governments would benefit from designing policies and creating the conditions to
encourage increased private sector involvement and attract investment in the grain import
supply chain. A more detailed and comprehensive analysis of bottlenecks in import supply
chains, their causes and possible solutions, would help to identify those segments of the supply
chain which can deliver the largest improvements for the lowest investment costs.
Ahmed et al. argue that in the MENA region there is a positive impact in terms of food security
and prices from reducing the role of the state in the grain import chain and encouraging the
development of private sector operators to replace them.
The high opportunity cost of using limited natural resources for the production of a low-value
crop such as wheat suggests that the SEMCs should consider alternative combinations of
policies to increase food security, including pursuing a strategy of agricultural self-reliance
(encouraging agricultural export revenues in order to help to cover food import costs) rather
than food sovereignty (domestic self-sufficiency).
SEMCs have a comparative advantage in producing fruit and vegetables, which gives them the
potential to become highly competitive for both export and domestic markets. Increased levels
4 The Mashreq countries are Egypt, Jordan, Lebanon and Syria.
of exports would help to mitigate the effects of world food price inflation and provide a source
of foreign exchange.
Improved trade facilitation, infrastructure and logistics would help to reinforce integration
with world markets and encourage exports, coupled with domestic reforms to encourage
investment and reduce NTBs. To achieve this, both hard infrastructure investments and the
policy environment need to be addressed. It is estimated that trade costs constitute 20 to 40
percent of the final delivered price of MENA non-oil exports, double those of the EU, with
agricultural trade most affected, given the bulk nature of commodities and their often time-
sensitive nature.
When negotiating the DCFTAs with the EU, it should be recalled that exports would benefit from
improved agricultural market access, including through reducing NTBs. Investment in
upgrading SPS standards could also boost exports.
1. Introduction
Food security is a key challenge for many of the SEMCs as well as the broader MENA region,
particularly for those countries that are not major oil producers. The critical political, economic
and social importance of addressing food security was underlined by the food price shocks since
2008.
Due to high population growth rates, increasing urbanisation, rising incomes, and resource
constraints, demand for food in SEMCs over the past decades has surpassed domestic
production. With the exception of fruit and vegetables, all other major food commodity groups
have experienced a widening gap between consumption and domestic production. As a result,
the region has become increasingly dependent on the world market to meet its basic food needs.
Cereals are the main food import item, accounting for about 40 percent of the region’s total food imports5. From 2006-10, the MENA region imported one-half its cereal needs, 60 percent of
sugar and nearly three-quarters of vegetable oil. A key challenge for the SEMCs is to find the
best ways to improve food security, whilst recognising that there will be a continued and
increasing dependence on imports6.
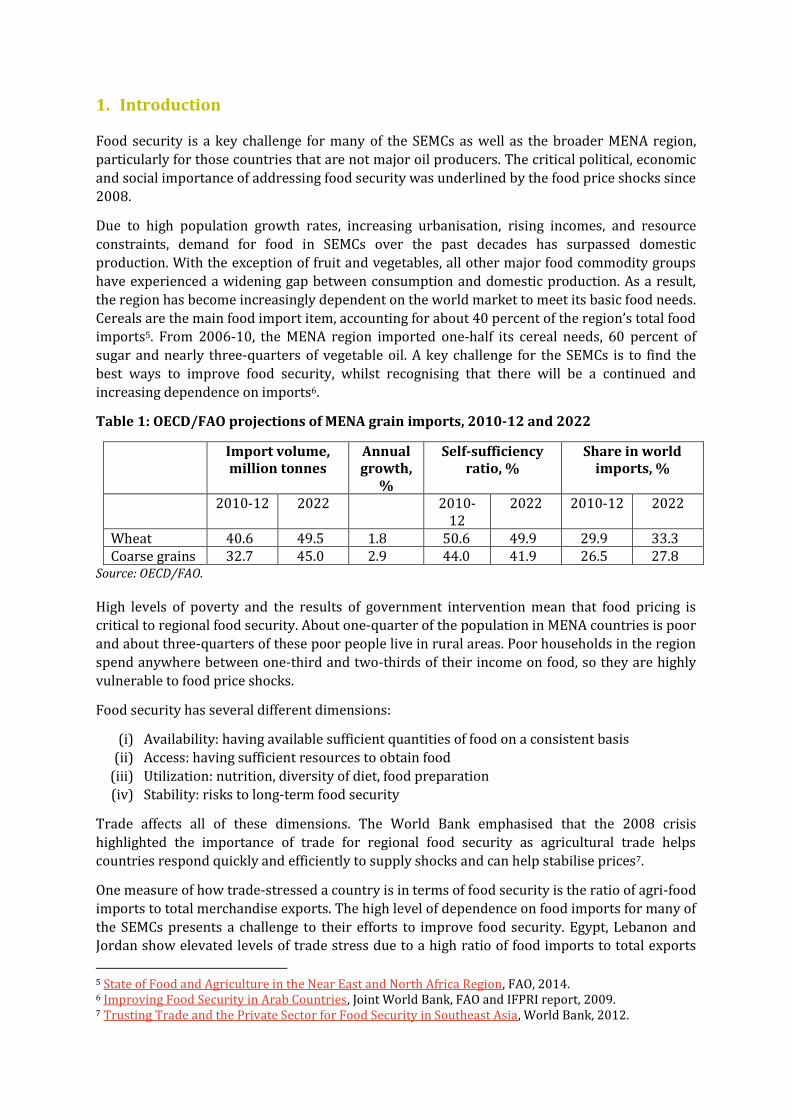
Table 1: OECD/FAO projections of MENA grain imports, 2010-12 and 2022
Import volume, million tonnes
Annual growth,
%
Self-sufficiency ratio, %
Share in world imports, %
2010-12 2022 2010-12
2022 2010-12 2022
Wheat 40.6 49.5 1.8 50.6 49.9 29.9 33.3 Coarse grains 32.7 45.0 2.9 44.0 41.9 26.5 27.8
Source: OECD/FAO.
High levels of poverty and the results of government intervention mean that food pricing is critical to regional food security. About one-quarter of the population in MENA countries is poor
and about three-quarters of these poor people live in rural areas. Poor households in the region
spend anywhere between one-third and two-thirds of their income on food, so they are highly
vulnerable to food price shocks.
Food security has several different dimensions:
(i) Availability: having available sufficient quantities of food on a consistent basis
(ii) Access: having sufficient resources to obtain food
(iii) Utilization: nutrition, diversity of diet, food preparation
(iv) Stability: risks to long-term food security
Trade affects all of these dimensions. The World Bank emphasised that the 2008 crisis
highlighted the importance of trade for regional food security as agricultural trade helps
countries respond quickly and efficiently to supply shocks and can help stabilise prices7.
One measure of how trade-stressed a country is in terms of food security is the ratio of agri-food
imports to total merchandise exports. The high level of dependence on food imports for many of
the SEMCs presents a challenge to their efforts to improve food security. Egypt, Lebanon and Jordan show elevated levels of trade stress due to a high ratio of food imports to total exports
5 State of Food and Agriculture in the Near East and North Africa Region, FAO, 2014. 6 Improving Food Security in Arab Countries, Joint World Bank, FAO and IFPRI report, 2009. 7 Trusting Trade and the Private Sector for Food Security in Southeast Asia, World Bank, 2012.
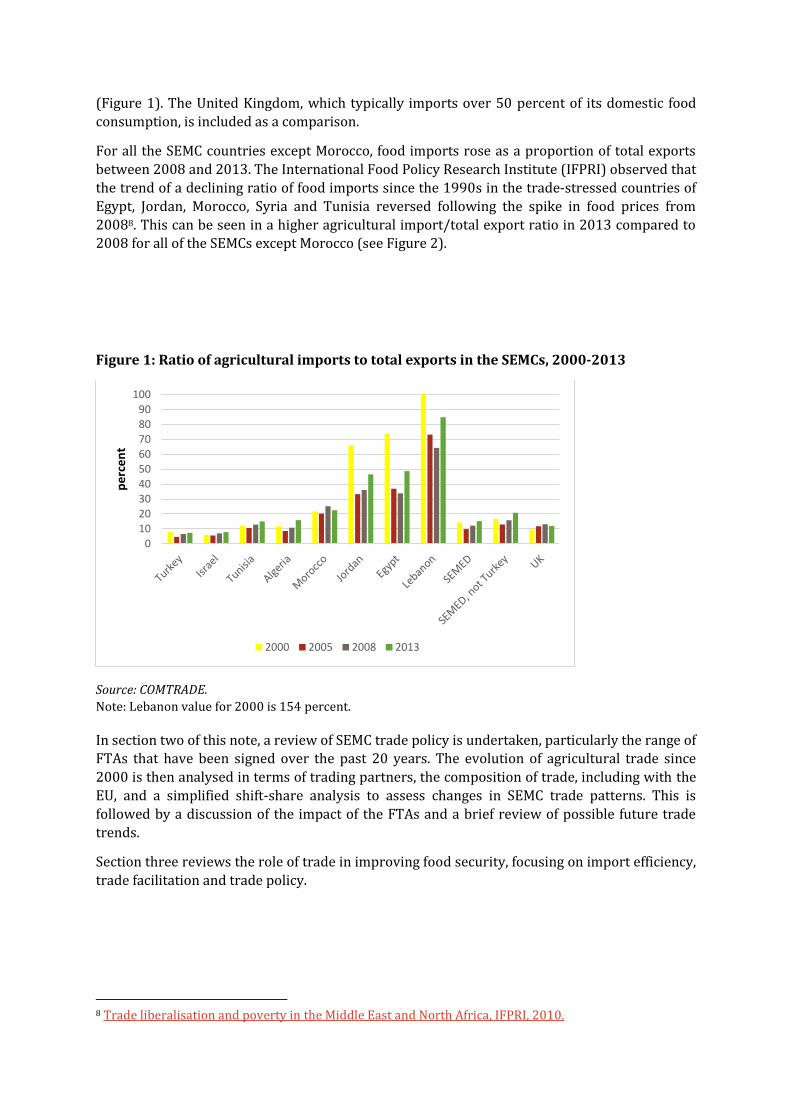
(Figure 1). The United Kingdom, which typically imports over 50 percent of its domestic food
consumption, is included as a comparison.
For all the SEMC countries except Morocco, food imports rose as a proportion of total exports
between 2008 and 2013. The International Food Policy Research Institute (IFPRI) observed that
the trend of a declining ratio of food imports since the 1990s in the trade-stressed countries of
Egypt, Jordan, Morocco, Syria and Tunisia reversed following the spike in food prices from
20088. This can be seen in a higher agricultural import/total export ratio in 2013 compared to
2008 for all of the SEMCs except Morocco (see Figure 2).
Figure 1: Ratio of agricultural imports to total exports in the SEMCs, 2000-2013
Source: COMTRADE.
Note: Lebanon value for 2000 is 154 percent.
In section two of this note, a review of SEMC trade policy is undertaken, particularly the range of
FTAs that have been signed over the past 20 years. The evolution of agricultural trade since
2000 is then analysed in terms of trading partners, the composition of trade, including with the
EU, and a simplified shift-share analysis to assess changes in SEMC trade patterns. This is
followed by a discussion of the impact of the FTAs and a brief review of possible future trade
trends.
Section three reviews the role of trade in improving food security, focusing on import efficiency,
trade facilitation and trade policy.
8 Trade liberalisation and poverty in the Middle East and North Africa, IFPRI, 2010.
0102030405060708090
100
pe
rce
nt
2000 2005 2008 2013
2. Regional integration and trade
Trade policy
Regional integration is a major feature of the trade policy strategies of all countries in the SEMC
and MENA regions9, with countries having signed a series of multilateral, regional, and bilateral
trade agreements over the last 20 years. These cover both trade amongst themselves as well as
with other trade blocks and countries, including with the EU, United States and Turkey, with the
aim of enhancing trade and economic integration and ultimately stimulating the region’s
potential for growth and job creation. The World Bank (2012) has described the network of
FTAs as a being like a “spaghetti bowl”.
The role that regional integration can play in improving food security has been recognised by
the United Nations’ Updated Comprehensive Framework for Action (UCFA) stresses the need to
“[e]ncourage better functioning food markets through improved regional political and economic
integration and better functioning environments for trade generally and in particular food”.
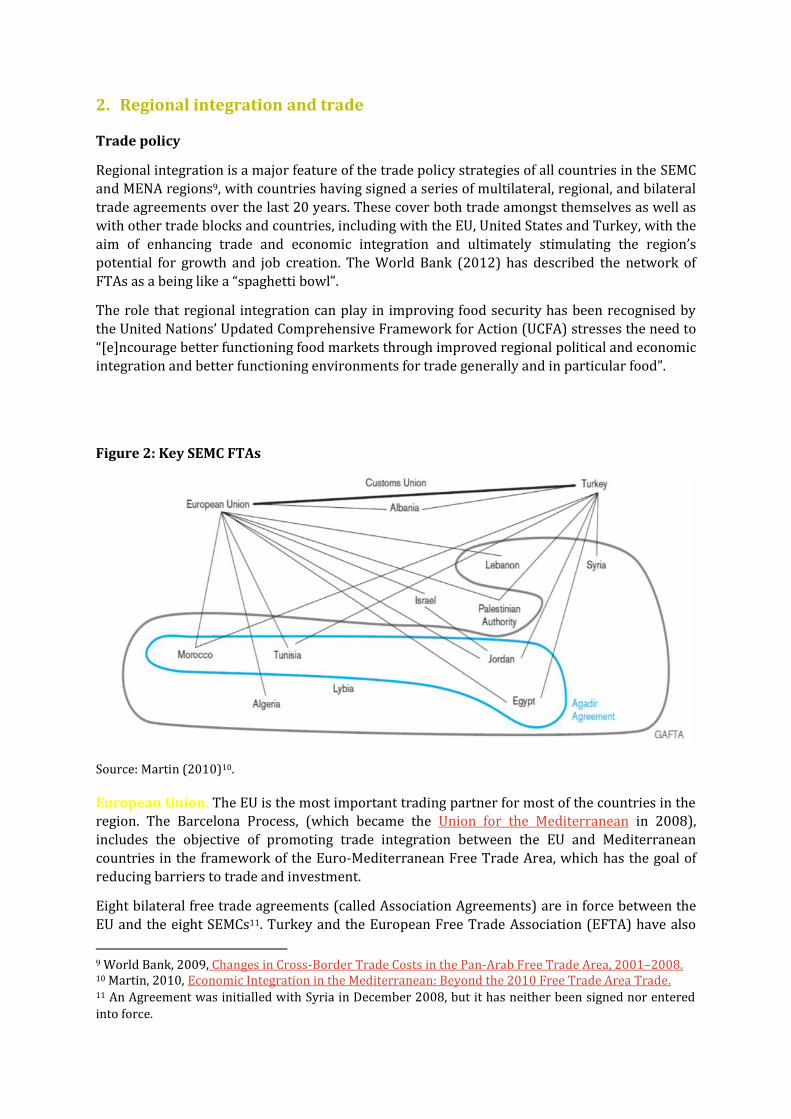
Figure 2: Key SEMC FTAs
Source: Martin (2010)10.
European Union. The EU is the most important trading partner for most of the countries in the region. The Barcelona Process, (which became the Union for the Mediterranean in 2008),
includes the objective of promoting trade integration between the EU and Mediterranean
countries in the framework of the Euro-Mediterranean Free Trade Area, which has the goal of
reducing barriers to trade and investment.
Eight bilateral free trade agreements (called Association Agreements) are in force between the
EU and the eight SEMCs11. Turkey and the European Free Trade Association (EFTA) have also
9 World Bank, 2009, Changes in Cross-Border Trade Costs in the Pan-Arab Free Trade Area, 2001–2008. 10 Martin, 2010, Economic Integration in the Mediterranean: Beyond the 2010 Free Trade Area Trade. 11 An Agreement was initialled with Syria in December 2008, but it has neither been signed nor entered
into force.
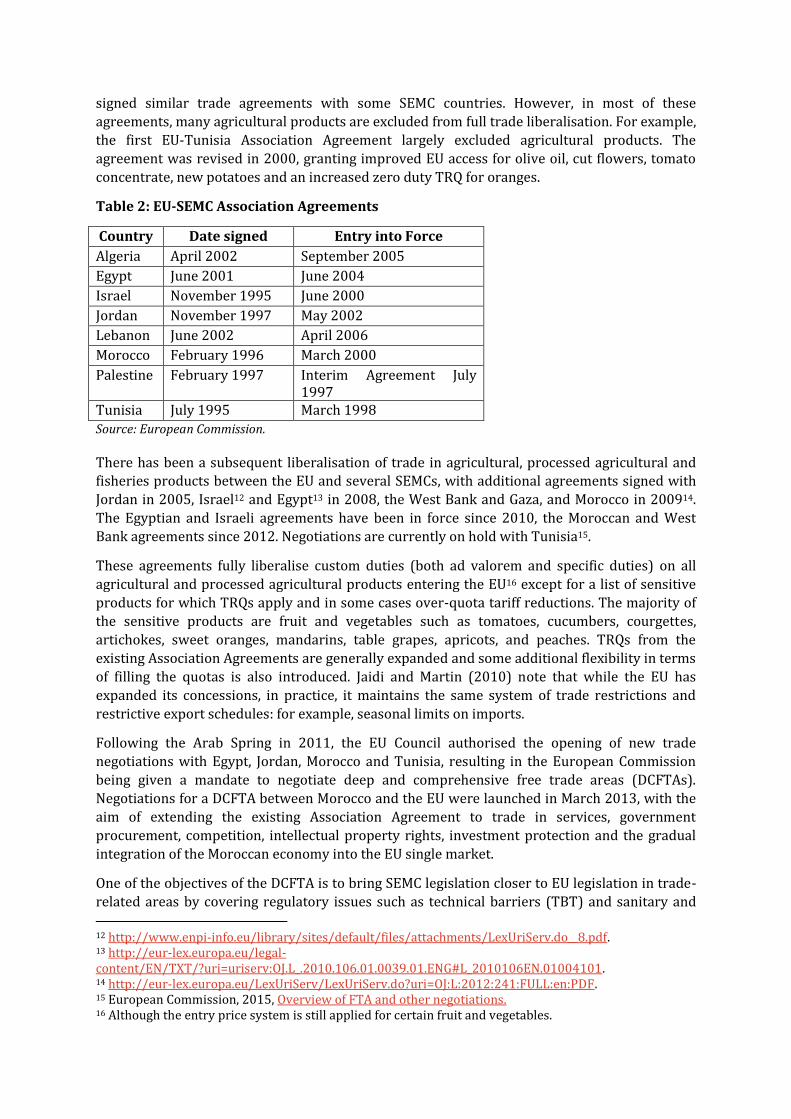
signed similar trade agreements with some SEMC countries. However, in most of these
agreements, many agricultural products are excluded from full trade liberalisation. For example,
the first EU-Tunisia Association Agreement largely excluded agricultural products. The
agreement was revised in 2000, granting improved EU access for olive oil, cut flowers, tomato
concentrate, new potatoes and an increased zero duty TRQ for oranges.
Table 2: EU-SEMC Association Agreements
Country Date signed Entry into Force
Algeria April 2002 September 2005
Egypt June 2001 June 2004
Israel November 1995 June 2000
Jordan November 1997 May 2002
Lebanon June 2002 April 2006
Morocco February 1996 March 2000
Palestine February 1997 Interim Agreement July 1997
Tunisia July 1995 March 1998
Source: European Commission.
There has been a subsequent liberalisation of trade in agricultural, processed agricultural and fisheries products between the EU and several SEMCs, with additional agreements signed with
Jordan in 2005, Israel12 and Egypt13 in 2008, the West Bank and Gaza, and Morocco in 200914.
The Egyptian and Israeli agreements have been in force since 2010, the Moroccan and West
Bank agreements since 2012. Negotiations are currently on hold with Tunisia15.
These agreements fully liberalise custom duties (both ad valorem and specific duties) on all
agricultural and processed agricultural products entering the EU16 except for a list of sensitive
products for which TRQs apply and in some cases over-quota tariff reductions. The majority of
the sensitive products are fruit and vegetables such as tomatoes, cucumbers, courgettes,
artichokes, sweet oranges, mandarins, table grapes, apricots, and peaches. TRQs from the
existing Association Agreements are generally expanded and some additional flexibility in terms
of filling the quotas is also introduced. Jaidi and Martin (2010) note that while the EU has
expanded its concessions, in practice, it maintains the same system of trade restrictions and
restrictive export schedules: for example, seasonal limits on imports.
Following the Arab Spring in 2011, the EU Council authorised the opening of new trade
negotiations with Egypt, Jordan, Morocco and Tunisia, resulting in the European Commission
being given a mandate to negotiate deep and comprehensive free trade areas (DCFTAs).
Negotiations for a DCFTA between Morocco and the EU were launched in March 2013, with the
aim of extending the existing Association Agreement to trade in services, government
procurement, competition, intellectual property rights, investment protection and the gradual
integration of the Moroccan economy into the EU single market.
One of the objectives of the DCFTA is to bring SEMC legislation closer to EU legislation in trade-
related areas by covering regulatory issues such as technical barriers (TBT) and sanitary and
12 http://www.enpi-info.eu/library/sites/default/files/attachments/LexUriServ.do__8.pdf. 13 http://eur-lex.europa.eu/legal-content/EN/TXT/?uri=uriserv:OJ.L_.2010.106.01.0039.01.ENG#L_2010106EN.01004101. 14 http://eur-lex.europa.eu/LexUriServ/LexUriServ.do?uri=OJ:L:2012:241:FULL:en:PDF. 15 European Commission, 2015, Overview of FTA and other negotiations. 16 Although the entry price system is still applied for certain fruit and vegetables.
phytosanitary (SPS) measures, either by mutual recognition or aligning requirements. The EU
DCFTAs aim to deepen market access by reducing tariffs and most importantly by tackling
NTMs, including TRQs.
The EU and Turkey signed a Customs Union Agreement in March 1995, which entered into force
at the end of 1995, with agricultural products largely left out (Martin, 2010). Concessions for
agricultural products were expanded in 199817 and revised in 2006 to take into account the
impact of EU enlargement to central and eastern Europe.
The initial Customs Union Agreement granted TRQs to Turkish exports of raw tobacco, raisins,
dried figs and hazelnuts, while the subsequent revisions to the agreement in 1998 expanded
TRQs and seasonal tariff concessions for tomato paste, sheep and goat meat, olive oil, cheese,
certain fruit and vegetables, hazelnuts, marmalade and jams. Due to these and most-favoured
nation (MFN) zero duty tariffs for some agricultural products, for the period 2008-10, 85
percent of Turkish agricultural products were exported to the EU at zero duty (World Bank,
2014).
Other FTAs. Other trade agreements include FTAs between the United States and Morocco and
Jordan, between Canada and Israel, between Israel and Mexico and between Jordan and
Singapore. In 2010, Egypt signed a free trade agreement with Mercosur18, but it has not yet
entered into force. Egypt and Libya are also members of the Common Market for Eastern and
Southern Africa (COMESA), a free trade area between 21 African countries.
Turkey has also signed FTAs with several SEMC countries: Tunisia (2005), West Bank and Gaza
(2005), Morocco (2006), Syria (2007) and Egypt (2007).
Intra-regional agreements. The GAFTA, also known as the Pan-Arab Free Trade Area (PAFTA),
created a free trade area between 18 Arab countries in 1998, with customs duties and tariffs
progressively eliminated over ten years for both industrial and agricultural goods.
In parallel, a free trade agreement between Egypt, Jordan, Morocco and Tunisia, the Agadir
Agreement, entered into force in 2006, fully liberalising trade in industrial and agricultural
products between these countries. Other MENA regional trade agreements include the Gulf Co-
operation Council, a customs union between six Persian Gulf states.
For both GAFTA and the Agadir Agreement, it has been argued that their effectiveness has been
limited by the structural similarities of SEMC economies, the prevalence of significant non-tariff
barriers, and the granting of exceptions for sensitive products. GAFTA has not yet achieved its
objectives mainly due to problems with the rules of origin, lack of mechanisms to solve disputes,
high transport costs and significant non-tariff barriers (Peridy, 2005).
Trade Evolution
With the exception of Turkey, the SEMCs are net food importers whose net imports have been
growing steadily over time.
SEMC imports of agricultural products19 have increased from USD 25.6 billion in 2005 to
USD 66.2 billion in 2013. Exports have also increased from USD 16.5 billion in 2005 to
17 Decision No 1/98 of the EU-Turkey Association Council of 25.02.1998. 18 Mercosur is a sub-regional bloc composed of Argentina, Brazil, Paraguay, Uruguay and Venezuela. 19 The WTO definition of agricultural products is used, which excludes fish products. It includes chapters 1-24 except for fish products (mostly chapter 03) of the harmonised system of trade nomenclature plus several product lines above chapter 24 such as cotton and raw hides. In the following sections on imports and exports, the definition of agricultural products is reduced to chapters 1-24 (except 03). This is in
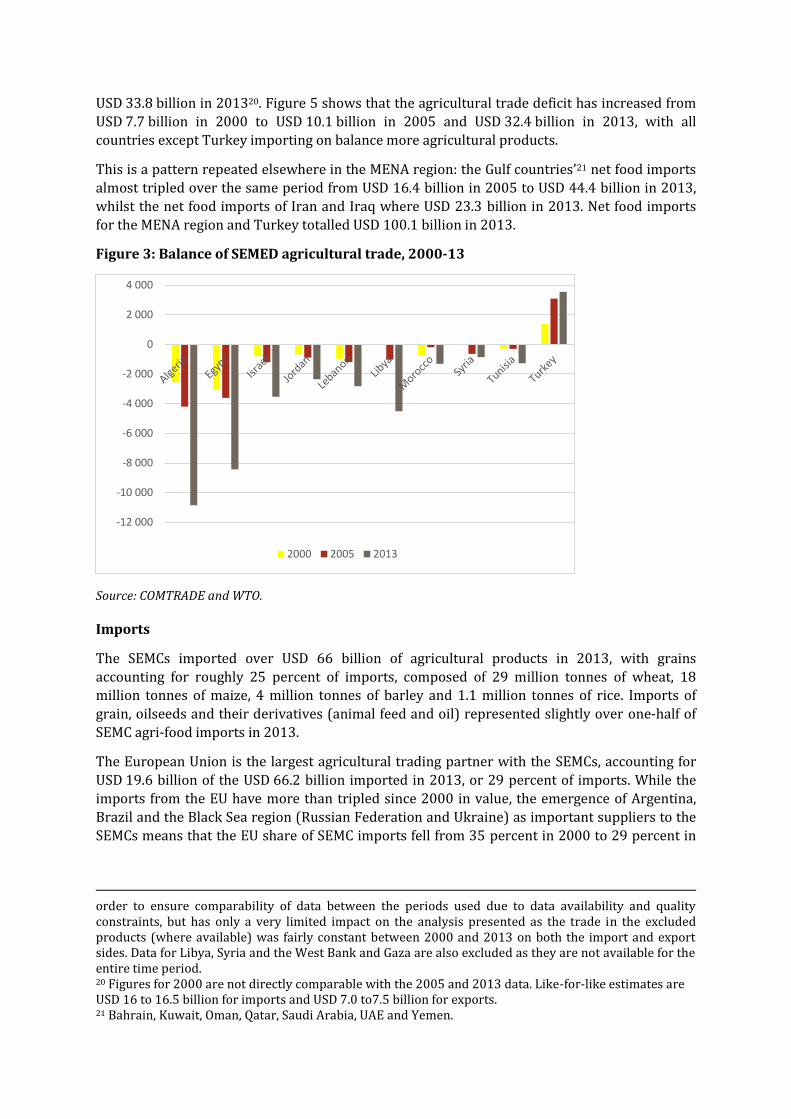
USD 33.8 billion in 201320. Figure 5 shows that the agricultural trade deficit has increased from
USD 7.7 billion in 2000 to USD 10.1 billion in 2005 and USD 32.4 billion in 2013, with all
countries except Turkey importing on balance more agricultural products.
This is a pattern repeated elsewhere in the MENA region: the Gulf countries’21 net food imports
almost tripled over the same period from USD 16.4 billion in 2005 to USD 44.4 billion in 2013,
whilst the net food imports of Iran and Iraq where USD 23.3 billion in 2013. Net food imports
for the MENA region and Turkey totalled USD 100.1 billion in 2013.
Figure 3: Balance of SEMED agricultural trade, 2000-13
Source: COMTRADE and WTO.
Imports
The SEMCs imported over USD 66 billion of agricultural products in 2013, with grains
accounting for roughly 25 percent of imports, composed of 29 million tonnes of wheat, 18 million tonnes of maize, 4 million tonnes of barley and 1.1 million tonnes of rice. Imports of
grain, oilseeds and their derivatives (animal feed and oil) represented slightly over one-half of
SEMC agri-food imports in 2013.
The European Union is the largest agricultural trading partner with the SEMCs, accounting for
USD 19.6 billion of the USD 66.2 billion imported in 2013, or 29 percent of imports. While the
imports from the EU have more than tripled since 2000 in value, the emergence of Argentina,
Brazil and the Black Sea region (Russian Federation and Ukraine) as important suppliers to the
SEMCs means that the EU share of SEMC imports fell from 35 percent in 2000 to 29 percent in
order to ensure comparability of data between the periods used due to data availability and quality constraints, but has only a very limited impact on the analysis presented as the trade in the excluded products (where available) was fairly constant between 2000 and 2013 on both the import and export sides. Data for Libya, Syria and the West Bank and Gaza are also excluded as they are not available for the entire time period. 20 Figures for 2000 are not directly comparable with the 2005 and 2013 data. Like-for-like estimates are USD 16 to 16.5 billion for imports and USD 7.0 to7.5 billion for exports. 21 Bahrain, Kuwait, Oman, Qatar, Saudi Arabia, UAE and Yemen.
-12 000
-10 000
-8 000
-6 000
-4 000
-2 000
0
2 000
4 000
2000 2005 2013

2013. Imports from other SEMCs grew faster than total imports, with their share of SEMC
imports expanding from 3.8 percent to 4.8 percent22.
Figure 4: Origin of SEMC agricultural imports, 2000-2013
Source: COMTRADE.
Table 3: Origin of SEMC agricultural imports, 2000-2013
2000 (USD
million)
2005 (USD
million)
2013 (USD
million)
Increase,`00-13,
% EU-28 4 966 6 681 16 165 226
Argentina and Brazil
1 050 3 446 9 751 828
Black Sea 358 1 490 6 440 1 700
United States 3 472 2 702 4 866 40
SEMC 553 1 029 2 629 375
Others 3 990 4 495 15 417 286
World 14 390 19 844 55 267 284
Source: COMTRADE.
Note: Libya, Syria and West Bank & Gaza and products above chapter 24 are excluded due to data not
being available for the entire period. The Black Sea is the Russian Federation and Ukraine.
As a comparison with the broader MENA region, IFPRI (2010) reported that in 2004, 42 percent
of MENA agricultural imports originated in developing countries, 26 percent from the EU, 13
percent from other MENA countries and 9 percent from the United States. The higher import
figure from MENA countries reflects exports from the SEMCs to the Gulf countries, Iran and Iraq
(see export section below for more details).
22 An analysis of imports into the Maghreb and Levant countries alone (i.e. the SEMCs excluding Turkey) reveals a similar picture overall, but the growth in share of imports from SEMC countries is higher, from 4.1 percent in 2000 to 5.6 percent in 2013.
35 34 29
7 17
18 2
8 12 24
14 9
3.8 5.2
4.8
28 23 28
0%
10%
20%
30%
40%
50%
60%
70%
80%
90%
100%
2000 2005 2013
EU-28 Argentina + Brazil Black Sea U.S. SEMC Others
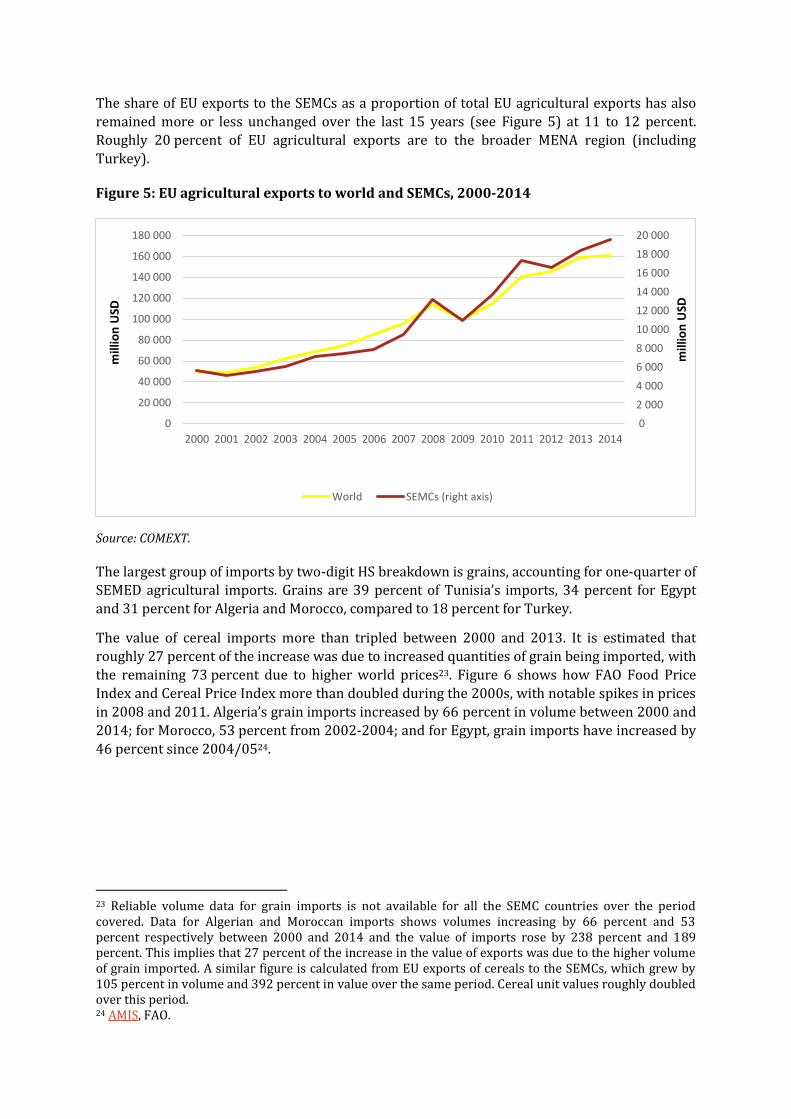
The share of EU exports to the SEMCs as a proportion of total EU agricultural exports has also
remained more or less unchanged over the last 15 years (see Figure 5) at 11 to 12 percent.
Roughly 20 percent of EU agricultural exports are to the broader MENA region (including
Turkey).
Figure 5: EU agricultural exports to world and SEMCs, 2000-2014
Source: COMEXT.
The largest group of imports by two-digit HS breakdown is grains, accounting for one-quarter of SEMED agricultural imports. Grains are 39 percent of Tunisia’s imports, 34 percent for Egypt
and 31 percent for Algeria and Morocco, compared to 18 percent for Turkey.
The value of cereal imports more than tripled between 2000 and 2013. It is estimated that
roughly 27 percent of the increase was due to increased quantities of grain being imported, with
the remaining 73 percent due to higher world prices23. Figure 6 shows how FAO Food Price
Index and Cereal Price Index more than doubled during the 2000s, with notable spikes in prices
in 2008 and 2011. Algeria’s grain imports increased by 66 percent in volume between 2000 and
2014; for Morocco, 53 percent from 2002-2004; and for Egypt, grain imports have increased by
46 percent since 2004/0524.
23 Reliable volume data for grain imports is not available for all the SEMC countries over the period covered. Data for Algerian and Moroccan imports shows volumes increasing by 66 percent and 53 percent respectively between 2000 and 2014 and the value of imports rose by 238 percent and 189 percent. This implies that 27 percent of the increase in the value of exports was due to the higher volume of grain imported. A similar figure is calculated from EU exports of cereals to the SEMCs, which grew by 105 percent in volume and 392 percent in value over the same period. Cereal unit values roughly doubled over this period. 24 AMIS, FAO.
0
2 000
4 000
6 000
8 000
10 000
12 000
14 000
16 000
18 000
20 000
0
20 000
40 000
60 000
80 000
100 000
120 000
140 000
160 000
180 000
2000 2001 2002 2003 2004 2005 2006 2007 2008 2009 2010 2011 2012 2013 2014
mill
ion
USD
mill
ion
USD
World SEMCs (right axis)
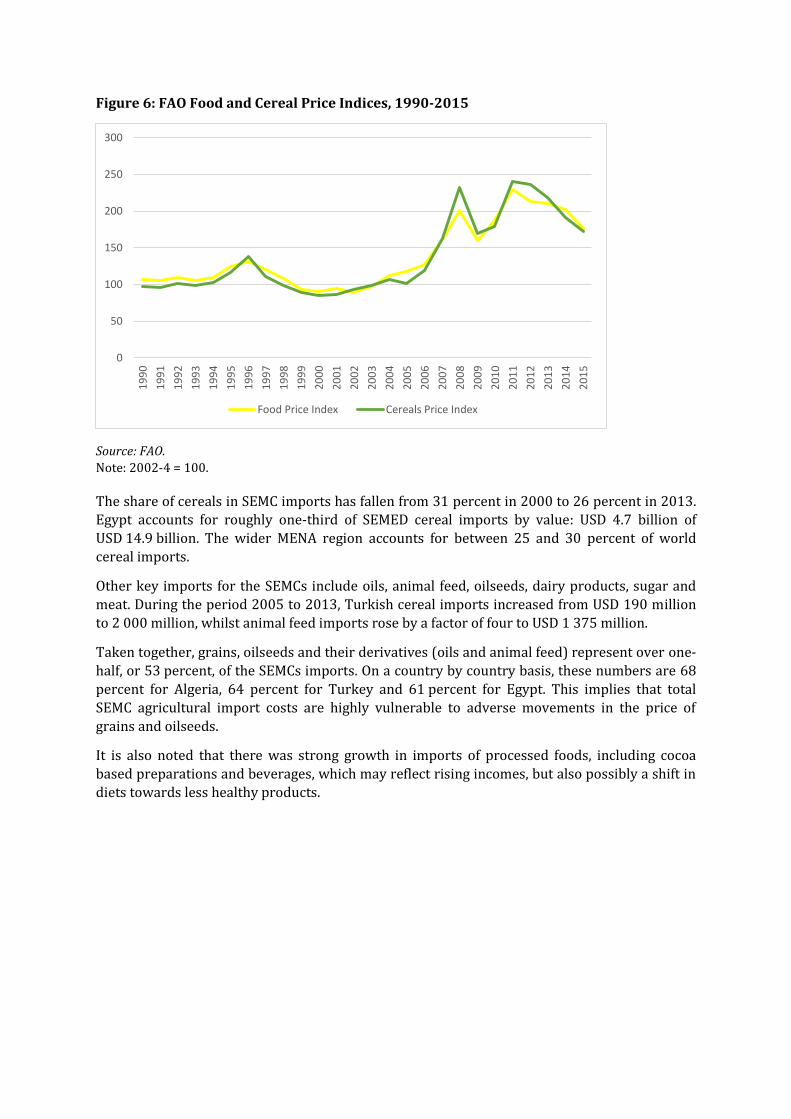
Figure 6: FAO Food and Cereal Price Indices, 1990-2015
Source: FAO.
Note: 2002-4 = 100.
The share of cereals in SEMC imports has fallen from 31 percent in 2000 to 26 percent in 2013.
Egypt accounts for roughly one-third of SEMED cereal imports by value: USD 4.7 billion of
USD 14.9 billion. The wider MENA region accounts for between 25 and 30 percent of world
cereal imports.
Other key imports for the SEMCs include oils, animal feed, oilseeds, dairy products, sugar and
meat. During the period 2005 to 2013, Turkish cereal imports increased from USD 190 million
to 2 000 million, whilst animal feed imports rose by a factor of four to USD 1 375 million.
Taken together, grains, oilseeds and their derivatives (oils and animal feed) represent over one-
half, or 53 percent, of the SEMCs imports. On a country by country basis, these numbers are 68
percent for Algeria, 64 percent for Turkey and 61 percent for Egypt. This implies that total
SEMC agricultural import costs are highly vulnerable to adverse movements in the price of
grains and oilseeds.
It is also noted that there was strong growth in imports of processed foods, including cocoa
based preparations and beverages, which may reflect rising incomes, but also possibly a shift in
diets towards less healthy products.
0
50
100
150
200
250
3001
99
0
19
91
19
92
19
93
19
94
19
95
19
96
19
97
19
98
19
99
20
00
20
01
20
02
20
03
20
04
20
05
20
06
20
07
20
08
20
09
20
10
20
11
20
12
20
13
20
14
20
15
Food Price Index Cereals Price Index
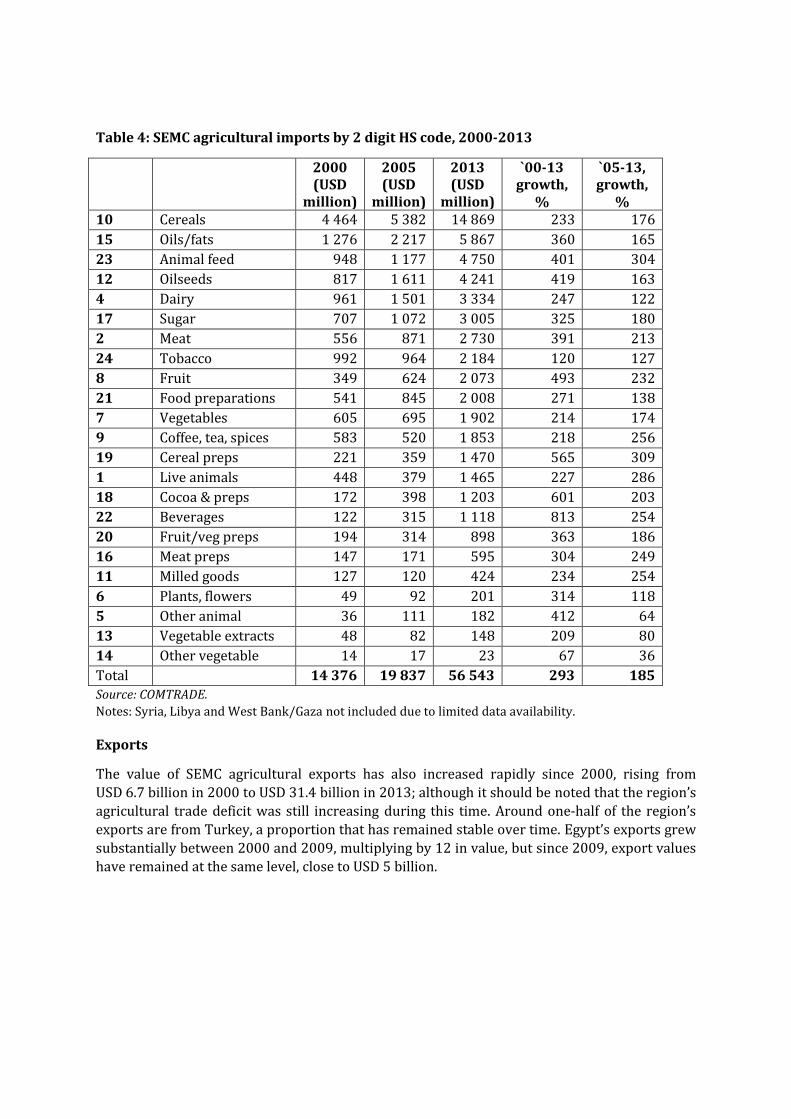
Table 4: SEMC agricultural imports by 2 digit HS code, 2000-2013
2000 (USD
million)
2005 (USD
million)
2013 (USD
million)
`00-13 growth,
%
`05-13, growth,
% 10 Cereals 4 464 5 382 14 869 233 176
15 Oils/fats 1 276 2 217 5 867 360 165
23 Animal feed 948 1 177 4 750 401 304
12 Oilseeds 817 1 611 4 241 419 163
4 Dairy 961 1 501 3 334 247 122
17 Sugar 707 1 072 3 005 325 180
2 Meat 556 871 2 730 391 213
24 Tobacco 992 964 2 184 120 127
8 Fruit 349 624 2 073 493 232
21 Food preparations 541 845 2 008 271 138
7 Vegetables 605 695 1 902 214 174
9 Coffee, tea, spices 583 520 1 853 218 256
19 Cereal preps 221 359 1 470 565 309
1 Live animals 448 379 1 465 227 286
18 Cocoa & preps 172 398 1 203 601 203
22 Beverages 122 315 1 118 813 254
20 Fruit/veg preps 194 314 898 363 186
16 Meat preps 147 171 595 304 249
11 Milled goods 127 120 424 234 254
6 Plants, flowers 49 92 201 314 118
5 Other animal 36 111 182 412 64
13 Vegetable extracts 48 82 148 209 80
14 Other vegetable 14 17 23 67 36
Total 14 376 19 837 56 543 293 185
Source: COMTRADE.
Notes: Syria, Libya and West Bank/Gaza not included due to limited data availability.
Exports
The value of SEMC agricultural exports has also increased rapidly since 2000, rising from
USD 6.7 billion in 2000 to USD 31.4 billion in 2013; although it should be noted that the region’s
agricultural trade deficit was still increasing during this time. Around one-half of the region’s
exports are from Turkey, a proportion that has remained stable over time. Egypt’s exports grew
substantially between 2000 and 2009, multiplying by 12 in value, but since 2009, export values
have remained at the same level, close to USD 5 billion.

Figure 7: SEMC agricultural exports. 2000-2013
Source: COMTRADE.
Table 5: SEMC agricultural exports, 2000-13
2000 (USD
million)
2005 (USD
million)
2013 (USD
million)
`00-13, %
Algeria 31 59 399 1 173
Egypt 404 979 4 912 1 115
Israel 1 082 1 628 2 517 133
Jordan 182 644 1 541 748
Lebanon 134 290 729 444
Morocco 896 1 870 3 303 269
Tunisia 429 963 1 548 261
Turkey 3 551 7 622 16 456 363
Total SEMC 6 708 14 054 31 405 368
SEMC, without Turkey
3 158 6 432 14 948 373
Source: COMTRADE.
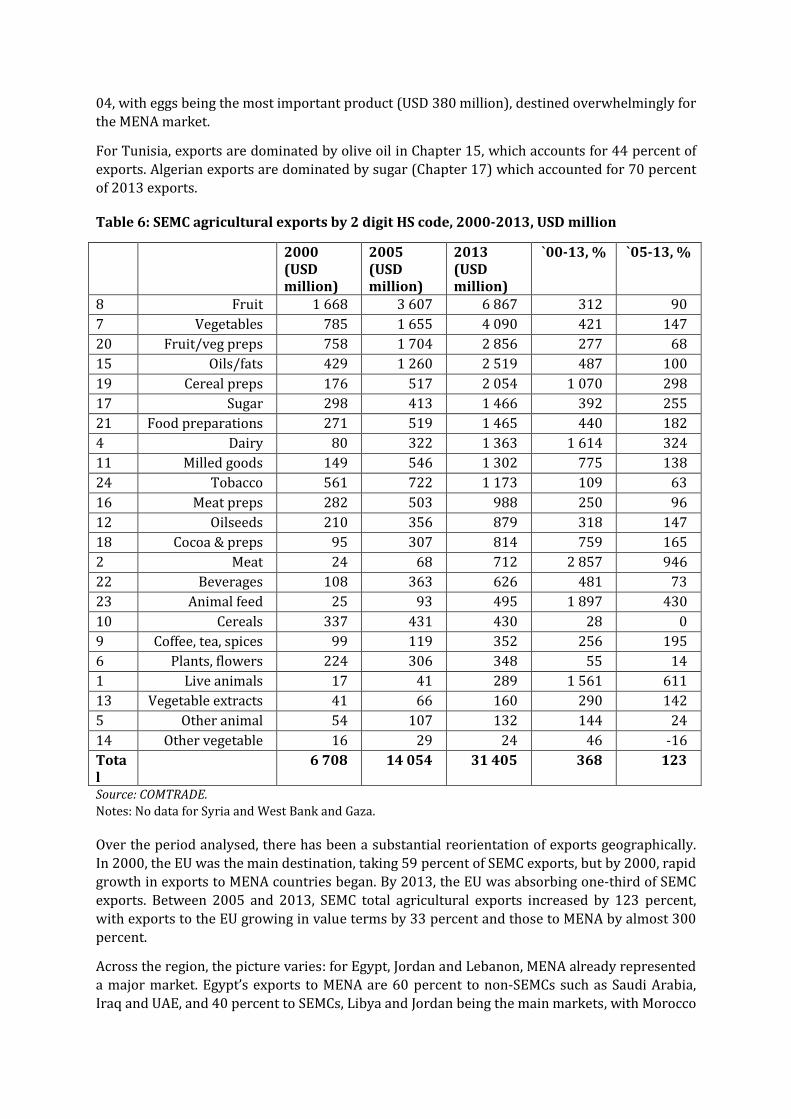
Fruit, vegetables and preparations thereof (Chapter 20) are the most important item, accounting for 44 percent of SEMC exports, a number that rises to 50 percent for Morocco and
Egypt. Meat exports are mostly from Turkey, accounting for USD 615 million in 2013, of which
99 percent was poultry meat exported predominantly to MENA countries such as Iraq. Egypt
and Turkey have also developed dairy exports: Egypt exported USD 415 million, most of which
was cheese (91 percent), to MENA countries. Turkey exported USD 662 million under Chapter
04, with eggs being the most important product (USD 380 million), destined overwhelmingly for
the MENA market.
For Tunisia, exports are dominated by olive oil in Chapter 15, which accounts for 44 percent of
exports. Algerian exports are dominated by sugar (Chapter 17) which accounted for 70 percent
of 2013 exports.
Table 6: SEMC agricultural exports by 2 digit HS code, 2000-2013, USD million
2000 (USD million)
2005 (USD million)
2013 (USD million)
`00-13, % `05-13, %
8 Fruit 1 668 3 607 6 867 312 90
7 Vegetables 785 1 655 4 090 421 147
20 Fruit/veg preps 758 1 704 2 856 277 68
15 Oils/fats 429 1 260 2 519 487 100
19 Cereal preps 176 517 2 054 1 070 298
17 Sugar 298 413 1 466 392 255
21 Food preparations 271 519 1 465 440 182
4 Dairy 80 322 1 363 1 614 324
11 Milled goods 149 546 1 302 775 138
24 Tobacco 561 722 1 173 109 63
16 Meat preps 282 503 988 250 96
12 Oilseeds 210 356 879 318 147
18 Cocoa & preps 95 307 814 759 165
2 Meat 24 68 712 2 857 946
22 Beverages 108 363 626 481 73
23 Animal feed 25 93 495 1 897 430
10 Cereals 337 431 430 28 0
9 Coffee, tea, spices 99 119 352 256 195
6 Plants, flowers 224 306 348 55 14
1 Live animals 17 41 289 1 561 611
13 Vegetable extracts 41 66 160 290 142
5 Other animal 54 107 132 144 24
14 Other vegetable 16 29 24 46 -16
Total
6 708 14 054 31 405 368 123
Source: COMTRADE.
Notes: No data for Syria and West Bank and Gaza.
Over the period analysed, there has been a substantial reorientation of exports geographically.
In 2000, the EU was the main destination, taking 59 percent of SEMC exports, but by 2000, rapid
growth in exports to MENA countries began. By 2013, the EU was absorbing one-third of SEMC
exports. Between 2005 and 2013, SEMC total agricultural exports increased by 123 percent,
with exports to the EU growing in value terms by 33 percent and those to MENA by almost 300
percent.
Across the region, the picture varies: for Egypt, Jordan and Lebanon, MENA already represented
a major market. Egypt’s exports to MENA are 60 percent to non-SEMCs such as Saudi Arabia,
Iraq and UAE, and 40 percent to SEMCs, Libya and Jordan being the main markets, with Morocco

and Lebanon being secondary markets. Morocco is somewhat distant from the key Gulf markets,
with only 2 percent of its agricultural exports to non-SEMC MENA destinations.
Figure 8: Direction of SEMC agricultural exports, 2000-2013
Source: COMTRADE.
Table 7: SEMC agricultural exports to the MENA region, 2000-13
MENA as a % of total ag. exports
2000 (USD
million)
2005 (USD
million)
2013 (USD
million)
2000 2013
Algeria 5 14 148 15 37 Egypt 214 397 2 501 53 51 Israel 8 8 51 1 2 Jordan 112 533 1201 61 78 Lebanon 65 152 453 48 62 Morocco 67 120 258 7 8 Tunisia 110 241 454 26 29 Turkey 562 1 374 6 160 16 37 Total SEMC 1 143 2 840 11 227 17 36 SEMC excl. Turkey
581 1 466 5 067 18 34
Source: COMTRADE.
Three chapters dominate SEMC exports to the EU: fruit, vegetables and preparations thereof (such as preserved olives and orange juice). In 2013, this group was worth USD 6.7 billion, or 65
percent of SEMC exports to the EU.
0
5 000
10 000
15 000
20 000
25 000
30 000
35 000
2000 2005 2013
mill
ion
USD
EU MENA Others
59 55
33
17 20
36
24 24 31
0%
10%
20%
30%
40%
50%
60%
70%
80%
90%
100%
2000 2005 2013
EU MENA Others
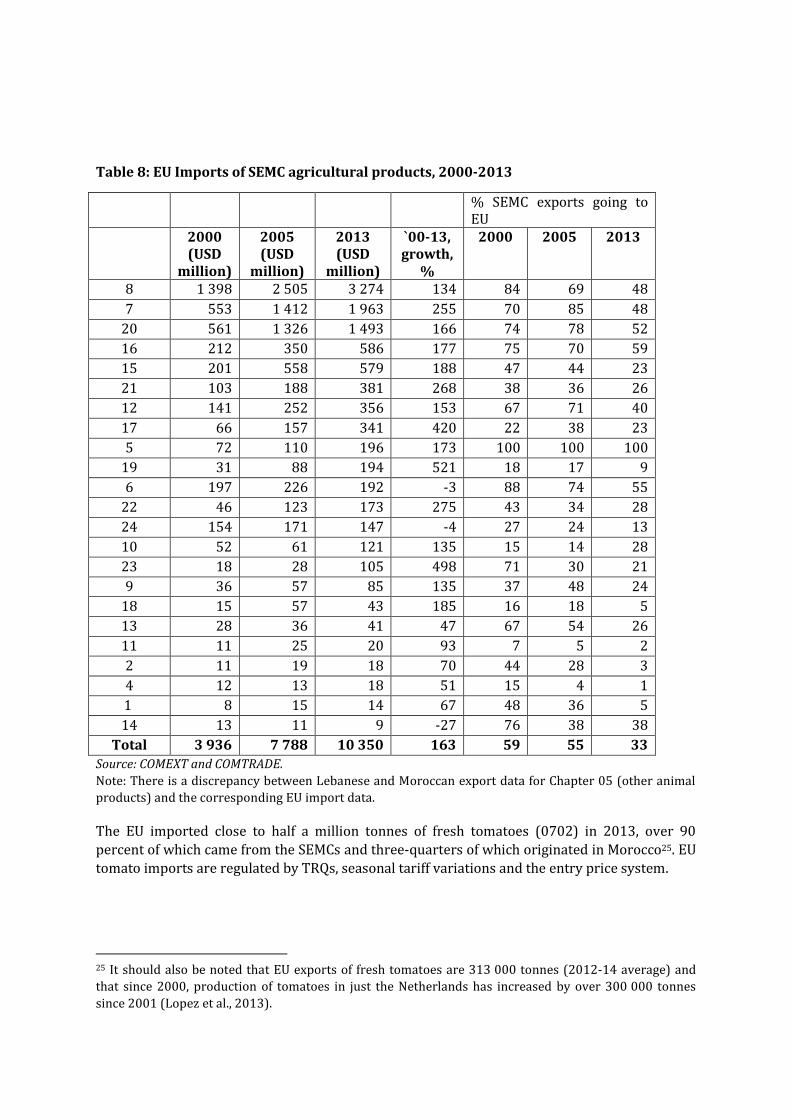
Table 8: EU Imports of SEMC agricultural products, 2000-2013
% SEMC exports going to EU
2000 (USD
million)
2005 (USD
million)
2013 (USD
million)
`00-13, growth,
%
2000 2005 2013
8 1 398 2 505 3 274 134 84 69 48
7 553 1 412 1 963 255 70 85 48
20 561 1 326 1 493 166 74 78 52
16 212 350 586 177 75 70 59
15 201 558 579 188 47 44 23
21 103 188 381 268 38 36 26
12 141 252 356 153 67 71 40
17 66 157 341 420 22 38 23
5 72 110 196 173 100 100 100
19 31 88 194 521 18 17 9
6 197 226 192 -3 88 74 55
22 46 123 173 275 43 34 28
24 154 171 147 -4 27 24 13
10 52 61 121 135 15 14 28
23 18 28 105 498 71 30 21
9 36 57 85 135 37 48 24
18 15 57 43 185 16 18 5
13 28 36 41 47 67 54 26
11 11 25 20 93 7 5 2
2 11 19 18 70 44 28 3
4 12 13 18 51 15 4 1
1 8 15 14 67 48 36 5
14 13 11 9 -27 76 38 38
Total 3 936 7 788 10 350 163 59 55 33
Source: COMEXT and COMTRADE.
Note: There is a discrepancy between Lebanese and Moroccan export data for Chapter 05 (other animal
products) and the corresponding EU import data.
The EU imported close to half a million tonnes of fresh tomatoes (0702) in 2013, over 90
percent of which came from the SEMCs and three-quarters of which originated in Morocco25. EU
tomato imports are regulated by TRQs, seasonal tariff variations and the entry price system.
25 It should also be noted that EU exports of fresh tomatoes are 313 000 tonnes (2012-14 average) and
that since 2000, production of tomatoes in just the Netherlands has increased by over 300 000 tonnes
since 2001 (Lopez et al., 2013).
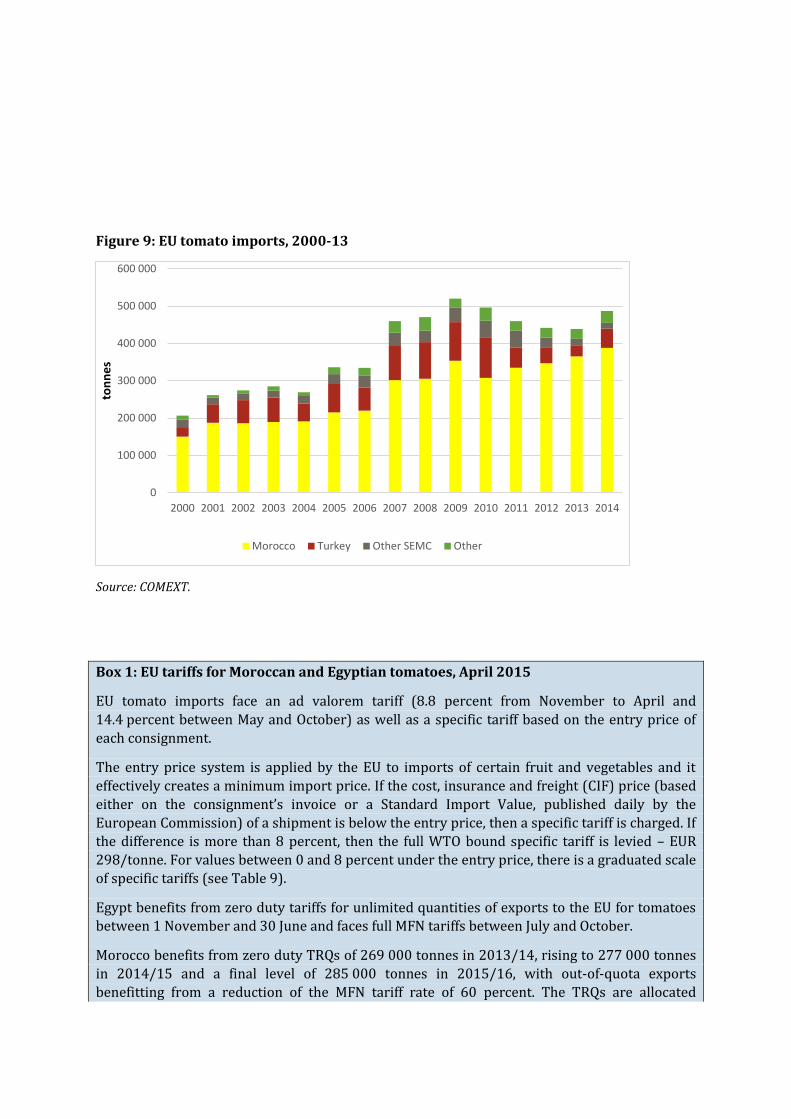
Figure 9: EU tomato imports, 2000-13
Source: COMEXT.
Box 1: EU tariffs for Moroccan and Egyptian tomatoes, April 2015
EU tomato imports face an ad valorem tariff (8.8 percent from November to April and
14.4 percent between May and October) as well as a specific tariff based on the entry price of
each consignment.
The entry price system is applied by the EU to imports of certain fruit and vegetables and it
effectively creates a minimum import price. If the cost, insurance and freight (CIF) price (based
either on the consignment’s invoice or a Standard Import Value, published daily by the
European Commission) of a shipment is below the entry price, then a specific tariff is charged. If
the difference is more than 8 percent, then the full WTO bound specific tariff is levied – EUR
298/tonne. For values between 0 and 8 percent under the entry price, there is a graduated scale
of specific tariffs (see Table 9).
Egypt benefits from zero duty tariffs for unlimited quantities of exports to the EU for tomatoes
between 1 November and 30 June and faces full MFN tariffs between July and October.
Morocco benefits from zero duty TRQs of 269 000 tonnes in 2013/14, rising to 277 000 tonnes
in 2014/15 and a final level of 285 000 tonnes in 2015/16, with out-of-quota exports
benefitting from a reduction of the MFN tariff rate of 60 percent. The TRQs are allocated
0
100 000
200 000
300 000
400 000
500 000
600 000
2000 2001 2002 2003 2004 2005 2006 2007 2008 2009 2010 2011 2012 2013 2014
ton
ne
s
Morocco Turkey Other SEMC Other
monthly between October and May, with an additional floating TRQ up to 30 percent of which
can be used in any of these months.
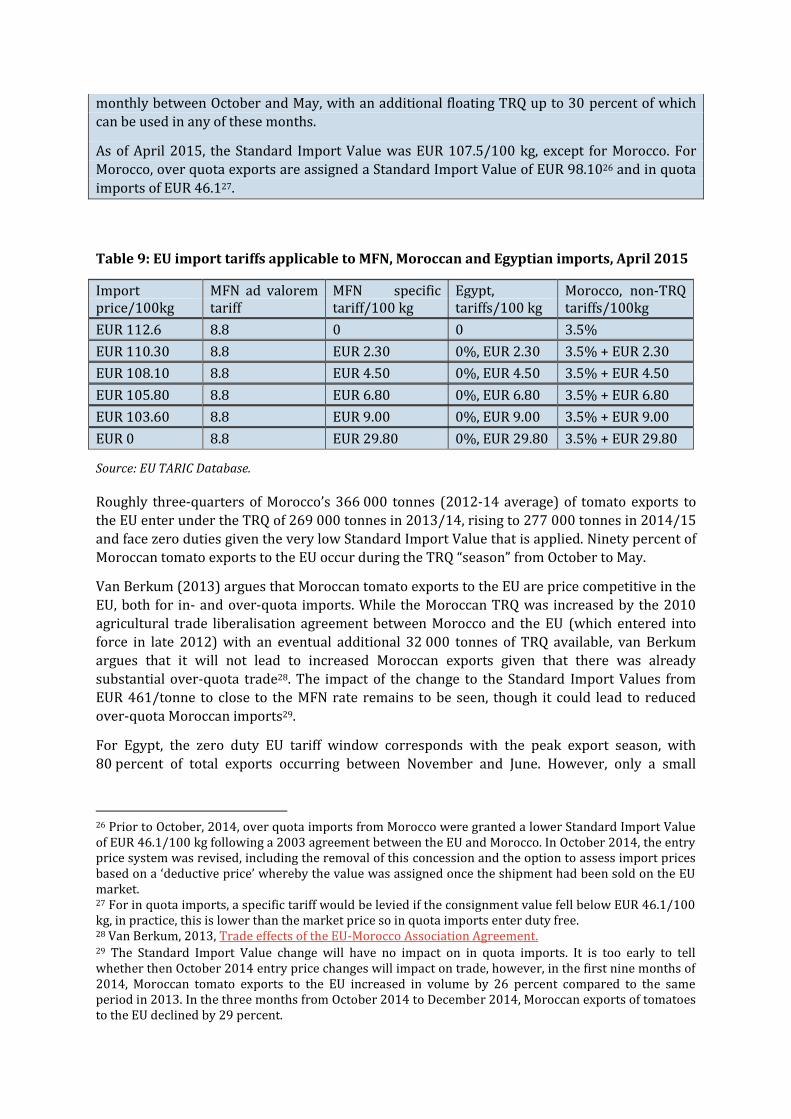
As of April 2015, the Standard Import Value was EUR 107.5/100 kg, except for Morocco. For
Morocco, over quota exports are assigned a Standard Import Value of EUR 98.1026 and in quota
imports of EUR 46.127.
Table 9: EU import tariffs applicable to MFN, Moroccan and Egyptian imports, April 2015
Import price/100kg
MFN ad valorem tariff
MFN specific tariff/100 kg
Egypt, tariffs/100 kg
Morocco, non-TRQ tariffs/100kg
EUR 112.6 8.8 0 0 3.5%
EUR 110.30 8.8 EUR 2.30 0%, EUR 2.30 3.5% + EUR 2.30
EUR 108.10 8.8 EUR 4.50 0%, EUR 4.50 3.5% + EUR 4.50
EUR 105.80 8.8 EUR 6.80 0%, EUR 6.80 3.5% + EUR 6.80
EUR 103.60 8.8 EUR 9.00 0%, EUR 9.00 3.5% + EUR 9.00
EUR 0 8.8 EUR 29.80 0%, EUR 29.80 3.5% + EUR 29.80
Source: EU TARIC Database.
Roughly three-quarters of Morocco’s 366 000 tonnes (2012-14 average) of tomato exports to
the EU enter under the TRQ of 269 000 tonnes in 2013/14, rising to 277 000 tonnes in 2014/15
and face zero duties given the very low Standard Import Value that is applied. Ninety percent of
Moroccan tomato exports to the EU occur during the TRQ “season” from October to May.
Van Berkum (2013) argues that Moroccan tomato exports to the EU are price competitive in the
EU, both for in- and over-quota imports. While the Moroccan TRQ was increased by the 2010
agricultural trade liberalisation agreement between Morocco and the EU (which entered into
force in late 2012) with an eventual additional 32 000 tonnes of TRQ available, van Berkum
argues that it will not lead to increased Moroccan exports given that there was already
substantial over-quota trade28. The impact of the change to the Standard Import Values from
EUR 461/tonne to close to the MFN rate remains to be seen, though it could lead to reduced
over-quota Moroccan imports29.
For Egypt, the zero duty EU tariff window corresponds with the peak export season, with
80 percent of total exports occurring between November and June. However, only a small
26 Prior to October, 2014, over quota imports from Morocco were granted a lower Standard Import Value of EUR 46.1/100 kg following a 2003 agreement between the EU and Morocco. In October 2014, the entry price system was revised, including the removal of this concession and the option to assess import prices based on a ‘deductive price’ whereby the value was assigned once the shipment had been sold on the EU market. 27 For in quota imports, a specific tariff would be levied if the consignment value fell below EUR 46.1/100 kg, in practice, this is lower than the market price so in quota imports enter duty free. 28 Van Berkum, 2013, Trade effects of the EU-Morocco Association Agreement. 29 The Standard Import Value change will have no impact on in quota imports. It is too early to tell whether then October 2014 entry price changes will impact on trade, however, in the first nine months of 2014, Moroccan tomato exports to the EU increased in volume by 26 percent compared to the same period in 2013. In the three months from October 2014 to December 2014, Moroccan exports of tomatoes to the EU declined by 29 percent.
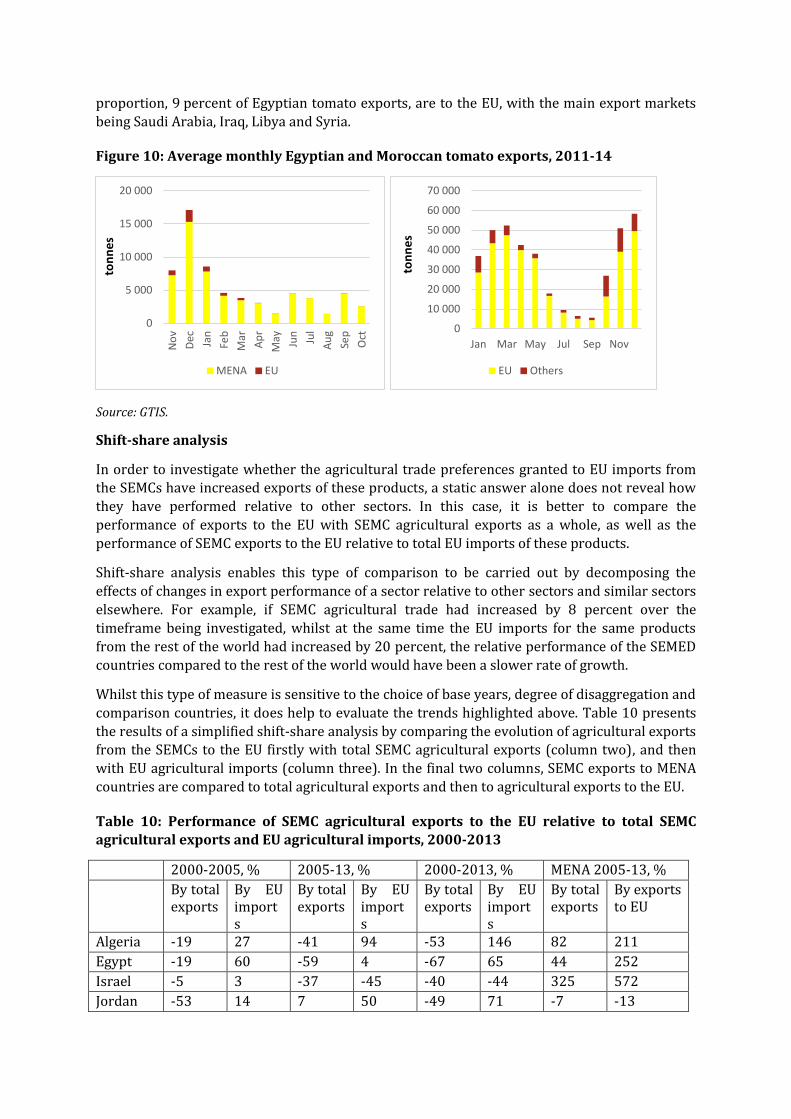
proportion, 9 percent of Egyptian tomato exports, are to the EU, with the main export markets
being Saudi Arabia, Iraq, Libya and Syria.
Figure 10: Average monthly Egyptian and Moroccan tomato exports, 2011-14
Source: GTIS.
Shift-share analysis
In order to investigate whether the agricultural trade preferences granted to EU imports from the SEMCs have increased exports of these products, a static answer alone does not reveal how
they have performed relative to other sectors. In this case, it is better to compare the
performance of exports to the EU with SEMC agricultural exports as a whole, as well as the
performance of SEMC exports to the EU relative to total EU imports of these products.
Shift-share analysis enables this type of comparison to be carried out by decomposing the
effects of changes in export performance of a sector relative to other sectors and similar sectors
elsewhere. For example, if SEMC agricultural trade had increased by 8 percent over the
timeframe being investigated, whilst at the same time the EU imports for the same products
from the rest of the world had increased by 20 percent, the relative performance of the SEMED
countries compared to the rest of the world would have been a slower rate of growth.
Whilst this type of measure is sensitive to the choice of base years, degree of disaggregation and
comparison countries, it does help to evaluate the trends highlighted above. Table 10 presents
the results of a simplified shift-share analysis by comparing the evolution of agricultural exports from the SEMCs to the EU firstly with total SEMC agricultural exports (column two), and then
with EU agricultural imports (column three). In the final two columns, SEMC exports to MENA
countries are compared to total agricultural exports and then to agricultural exports to the EU.
Table 10: Performance of SEMC agricultural exports to the EU relative to total SEMC agricultural exports and EU agricultural imports, 2000-2013
2000-2005, % 2005-13, % 2000-2013, % MENA 2005-13, %
By total exports
By EU imports
By total exports
By EU imports
By total exports
By EU imports
By total exports
By exports to EU
Algeria -19 27 -41 94 -53 146 82 211
Egypt -19 60 -59 4 -67 65 44 252
Israel -5 3 -37 -45 -40 -44 325 572
Jordan -53 14 7 50 -49 71 -7 -13
0
5 000
10 000
15 000
20 000
No
v
Dec Jan
Feb
Mar
Ap
r
May Jun
Jul
Au
g
Sep
Oct
ton
ne
s
MENA EU
0
10 000
20 000
30 000
40 000
50 000
60 000
70 000
Jan Mar May Jul Sep Nov
ton
ne
s
EU Others
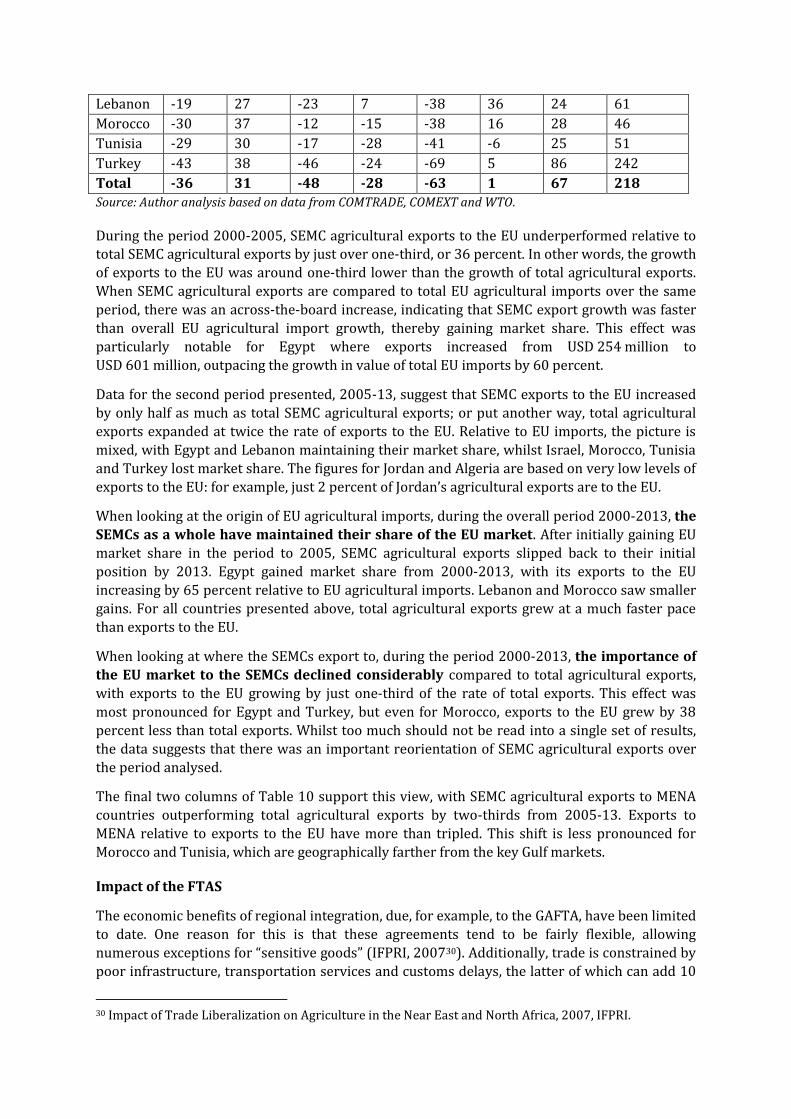
Lebanon -19 27 -23 7 -38 36 24 61
Morocco -30 37 -12 -15 -38 16 28 46
Tunisia -29 30 -17 -28 -41 -6 25 51
Turkey -43 38 -46 -24 -69 5 86 242
Total -36 31 -48 -28 -63 1 67 218
Source: Author analysis based on data from COMTRADE, COMEXT and WTO.
During the period 2000-2005, SEMC agricultural exports to the EU underperformed relative to total SEMC agricultural exports by just over one-third, or 36 percent. In other words, the growth
of exports to the EU was around one-third lower than the growth of total agricultural exports.
When SEMC agricultural exports are compared to total EU agricultural imports over the same
period, there was an across-the-board increase, indicating that SEMC export growth was faster
than overall EU agricultural import growth, thereby gaining market share. This effect was
particularly notable for Egypt where exports increased from USD 254 million to
USD 601 million, outpacing the growth in value of total EU imports by 60 percent.
Data for the second period presented, 2005-13, suggest that SEMC exports to the EU increased
by only half as much as total SEMC agricultural exports; or put another way, total agricultural
exports expanded at twice the rate of exports to the EU. Relative to EU imports, the picture is
mixed, with Egypt and Lebanon maintaining their market share, whilst Israel, Morocco, Tunisia
and Turkey lost market share. The figures for Jordan and Algeria are based on very low levels of
exports to the EU: for example, just 2 percent of Jordan’s agricultural exports are to the EU.
When looking at the origin of EU agricultural imports, during the overall period 2000-2013, the
SEMCs as a whole have maintained their share of the EU market. After initially gaining EU
market share in the period to 2005, SEMC agricultural exports slipped back to their initial
position by 2013. Egypt gained market share from 2000-2013, with its exports to the EU
increasing by 65 percent relative to EU agricultural imports. Lebanon and Morocco saw smaller
gains. For all countries presented above, total agricultural exports grew at a much faster pace
than exports to the EU.
When looking at where the SEMCs export to, during the period 2000-2013, the importance of
the EU market to the SEMCs declined considerably compared to total agricultural exports,
with exports to the EU growing by just one-third of the rate of total exports. This effect was
most pronounced for Egypt and Turkey, but even for Morocco, exports to the EU grew by 38
percent less than total exports. Whilst too much should not be read into a single set of results,
the data suggests that there was an important reorientation of SEMC agricultural exports over
the period analysed.
The final two columns of Table 10 support this view, with SEMC agricultural exports to MENA
countries outperforming total agricultural exports by two-thirds from 2005-13. Exports to
MENA relative to exports to the EU have more than tripled. This shift is less pronounced for
Morocco and Tunisia, which are geographically farther from the key Gulf markets.
Impact of the FTAS
The economic benefits of regional integration, due, for example, to the GAFTA, have been limited
to date. One reason for this is that these agreements tend to be fairly flexible, allowing
numerous exceptions for “sensitive goods” (IFPRI, 200730). Additionally, trade is constrained by
poor infrastructure, transportation services and customs delays, the latter of which can add 10
30 Impact of Trade Liberalization on Agriculture in the Near East and North Africa, 2007, IFPRI.
percent to trade costs alone (IFPRI, 2010). However, Hoekman and Zarrouck (2009) argue that
GAFTA has been beneficial in removing tariffs and improving customs clearance procedures,
which helped expand exports among members, albeit from a low base. In terms of agricultural
trade, the Agadir Agreement had a positive (but not significant) effect on increasing trade
between country partners (Lopez et al., 2013).
Martin (2004) highlights that the number of FTAs, and in particular the overlap between them,
creates confusion that hinders rather than facilitates trade. Trade between Morocco and Egypt
is covered at the same time by GAFTA, the Agadir Agreement, a bilateral FTA and the Pan-Euro-
Mediterranean Protocol on rules of origin, as well as WTO norms.
The World Bank (2010) argues that that FTAs signed by the SEMCs with the United States and
the EU have not had an additional positive effect on exports compared to FTAs in general.
Normally, an FTA leads on average to an increase in exports of 21 percent, but the World Bank
says that the effect has been negative for EU-SEMC FTAs (i.e. that they have not increased
exports by at least 21 percent), and furthermore, FTAs signed with both the EU and United
States have given rise to a more rapid increase in imports than exports. Additionally, the World
Bank notes that there is no evidence that FTAs have contributed to investment flows in the
region.
Chaffour and Maur (2011) find a positive impact of the EU-SEMC agreements in helping SEMC
governments to focus on domestic reforms, citing the example of Egypt, where the Association
Agreement helped to shift government focus to trade facilitation and reform of SPS type issues,
which has a positive spillover for exports.
Globally, the Barcelona Process has not deepened EU-SEMC trade. The progress in expanding
trade, fostering investment in the region, and accelerating the convergence in living standards
was limited and did not live up to the expectations the initiative raised when it was launched in
November 1995 (Lopez et al., 2013). Only the agreement with Turkey had economically and
statically significant positive effects on imports and exports.
Garcia-Alvarez-Coque and Marti-Selva (2006)31 say that SEMC exports of fruit and vegetables
are higher with an Association Agreement than without it based on a gravity model, but that
trade levels are still much lower than would be expected under completely free trade conditions
(for example, if Morocco was a member of the EU and did not face any restrictions trading with
other EU members).
For vegetables, Maghreb exports in 2004 are 38 percent of the expected (optimal) level
predicted by a gravity model compared to 23 percent in the absence of an Association
Agreement. In other words, the Association Agreements have helped the SEMC countries to
increase exports of fruit and vegetables to the EU, but export levels are substantially below their
potential levels.
Ben Zid (2014) argues that the Barcelona Process for intra-Mediterranean integration has not
been successful, noting that the average EU tariff level for agricultural products is 30 percent
and that the agreements typically use TRQs and keep EU seasonal tariffs for fruit and
vegetables, as well as minimum entry prices. NTBs are also cited, with Tunisian olive oil given as
an example: EU importers must have imported for at least two years (at higher duty) to be
eligible for zero duty TRQ allocations. In addition, monthly quotas (1 000 tonnes per month
from January to March, then 4 000 tonnes in April and May, and 8 000 tonnes from June to
31 A Gravity Approach to Assess the Effects of Association Agreements on Euromediterranean Trade of Fruits and Vegetables, 2006, Garcia-Alvarez-Coque and Marti-Selva.

September) mean that storage costs reduce the competitiveness of out of season exports,
particularly from April to September, despite recent advances in private sector storage capacity
in Tunisia.
Ben Zid notes that SEMC exports are limited by sometimes poor logistical performance found in
parts of the region, problems with meeting EU standards and the generally restrictive nature of
the EU TRQs even in the newer agricultural agreements such as those with Egypt and Morocco,
for which concessions for products in direct competition with southern European countries are
limited or excluded: tomatoes, cucumbers, artichokes, and strawberries for Egypt.
Egyptian agricultural exports to the EU were further liberalised in 2010, and in October 2012
for Morocco. For Egypt, the average export level of 2008-09 increased by 32 percent for both
total agricultural exports and agricultural exports to MENA countries, whilst EU exports
increased by 17 percent. Since 2009, as previously discussed, the SEMC region has become a
more important export destination than the EU.
Table 11: Recent evolution of Egyptian agricultural exports, 2008-2014, USD million
2008 2009 2010 2011 2012 2013 2014
World 3 234 4 515 5 278 5 273 4 660 5 142 5 127
EU 782 933 963 1 011 923 1 026 1 000
MENA 1 644 2 380 2 648 2 607 2 435 2 767 2 661
o.w. SEMC 679 1 025 1 119 1 026 1 039 1 130 1 112
Source: GTIS.
Note: Bolded numbers are from the entry into force of the Egypt-EU additional agricultural trade
liberalisation agreement.
However, for Morocco, both total agricultural exports and agricultural exports to the EU increased by 50 percent between the 2009-11 average and 2014, with exports to SEMC
countries increasing by 73 percent, albeit from a low base. It is also noted that at the same time,
Moroccan agricultural exports to several African countries (Mauritania, Nigeria, Angola, Senegal
and Guinea) increased from USD 118 million in 2009-11 to USD 269 million in 2014.
Table 12: Recent evolution of Moroccan agricultural exports, 2008-2014, USD million
2008 2009 2010 2011 2012 2013 2014
World 2 285 2 236 2 392 2 536 2 440 3 319 3 591
EU 1 321 1 325 1 399 1 584 1 397 1 964 2 161
MENA 187 216 216 185 234 269 285
o.w. SEMC 119 144 152 121 151 184 240
Source: GTIS.
A significant number of NTMs are in the European Commission’s impact assessment of the EU-Morocco agricultural trade liberalisation agreement of 201032.
Table 13: Top ten NTMs for EU fruit and vegetable imports
Number NTM Description 1325 Labelling requirements: Measures regulating the kind, colour and size of printing
on packages and labels and defining the information that should be provided to the 32 ECORYS for European Commission, 2013, Trade Sustainability Impact Assessment in support of negotiations of a DCFTA between the EU and Morocco.

consumer. Labelling is any written, electronic, or graphic communication on the packaging or on a separate but associated label, or on the product itself. It may include requirements on the official language to be used as well as technical information on the product, such as voltage, components, instruction on use, safety and security advice.
1147 Testing requirement: A requirement for products to be tested against a given regulation, such as performance level – includes sampling requirement.
491 Product - quality or - performance requirement: Conditions to be satisfied in terms of performance (e.g. durability, hardness) or quality (e.g. content of defined ingredients).
432 Certification requirement: Certification of conformity with a given regulation: required by the importing country but may be issued in the exporting or the importing country.
430 Inspection requirement: Requirement for product inspection in the importing country – may be performed by public or private entities. It is similar to testing, but does not include laboratory testing.
396 Seasonal quotas: Quotas of a permanent nature (i.e. they are applied every year, without a known date of termination of the measure), where the importation must take place during a given period of the year.
197 Import monitoring and surveillance requirements and other automatic licensing measures: Administrative measures which seek to monitor the import value or volume of specified products.
73 Prohibition for TBT reasons 40 Restricted use of certain substances: Restriction on the use of certain substances
as components or material to prevent the risks arising from their use. Source: WTO IDB Trains Database presented in ECORYS (2013).
At the product level, there is often a more complex explanation for the evolution of trade with
the EU. For example, both Morocco and Turkey have lost market share in EU imports of citrus
fruit.
In 2007, the Russian Federation overtook the EU as the main market for Turkey’s citrus fruit
with 50 percent of Turkish exports, while the EU share has declined from one-third in 2000 to
16 percent in 2014. Moroccan exports of citrus fruit show a similar pattern, with exports to the
Russian Federation exceeding those to the EU from 2006 to 2013 (but not in 2014), and
Moroccan TRQs for clementines and oranges exports to the EU are typically only half filled.
Lopez et al. (2013) attribute this to several factors: increasing competitiveness of EU
production, particularly Spain, whose exports are rising; difficulties with meeting increasingly
stringent EU standards; and incentives provided by the government to export to non-EU
countries.
Turkey has maintained a significant trade surplus in agricultural trade with the EU. In terms of
agricultural exports to the EU, due to zero duty TRQs and because two-thirds of EU agricultural
tariff lies have been liberalised for Turkish exports, 85 percent of Turkish agricultural products
were exported to the EU at zero duty during the period 2008-10. Barriers to Turkish exports to
the EU remain, however, particularly SPS. Turkey is not authorised to export products of animal
origin, though six dairy establishments have recently been approved for EU exports. There are
also EU concerns with aflatoxin controls for nuts and pesticide residue controls for fruit and
vegetables (World Bank, 2014)33.
33 World Bank, 2014, Evaluation of the EU-Turkey Customs Union.
Turkey has lost share in terms of the EU imports of “Mediterranean” products (fruit and
vegetables, olive oil and wine) between 2000 and 2011 (15 percent on average for the whole
period). At the level of individual products, the Turkish share of EU imports of strawberries,
cucumbers and apricots has increased, whilst for many other fruit and vegetables, such as
tomatoes, citrus fruit, melons, apples and green beans, it has declined. The export behaviour of
Turkey seems to show a reallocation of agricultural exports towards other markets, such as the
Russian Federation and other eastern European countries. (Lopez et al., 2013).
Future evolution
In the long run, the SEMCs as a whole are expected to continue to be substantial net food
importers given a high rate of population growth and limited natural resources to expand
agricultural production. Salem and Banks (2014) estimate that the population of the Arab
region could expand from 360 million in 2011 to 600 million by 2030, with a related rise on
food imports of 50 to 75 percent.34
In terms of the possible evolution of intra-regional trade, the result is particularly sensitive to
the modelling approach adopted. Gravity models tend to suggest that the level of trade
integration is below expectations and thus has scope to increase, particularly when barriers to integration are eased or removed. Approaches based on trade intensity indices and simple
shares suggest that intra-SEMC trade is not particularly low and is expanding (Hoekman and
Sekkat, 2009).
Martin (2010) uses a gravity model to argue that SEMC exports to the EU have already almost
reached their potential given the current level of trade preferences, although there may be
scope for increased exports from the Mashreq countries such as Egypt and Jordan. He argues
that significant export growth could only be expected if Euro-Med integration started to reach
the levels and instruments of the EU itself (in which case De Wulf and Maliszewska (2009)
estimate that exports could triple or quadruple).
The European Commission (2013) models the impact of agricultural trade liberalisation
between the EU the Euro-Med countries35. EU agricultural imports from the Euro-Med countries
are modelled to double to USD 3.7 billion under a scenario of tariff liberalisation and more than
triple to USD 11.5 billion if tariffs are liberalised and all NTBs are removed. EU NTBs are modelled as being equivalent to a 27 percent tariff.
Exports of oils, particularly olive oil from Tunisia, shows the strongest response to full
liberalisation, with exports to the EU increasing between two- and four-fold. Fruit and vegetable
exports from Morocco to the EU would also increase by 24 percent, with tariff liberalisation and
doubling once tariffs and NTBs are removed.
Euro-Med agri-food imports from the EU are also modelled to increase substantially in a trade
liberalisation scenario. Tariff liberalisation would see imports from the EU double to USD
4.7 billion and tariff and NTB liberalisation would result in imports tripling to USD 13.7 billion.
Euro-Med wheat imports from the EU would triple following tariff liberalisation and quintuple
once NTBs were also removed.
The European Commission (2013) highlights that the largest trade and GDP gains follow NTB
liberalisation, which also helps to deliver an efficiency boost. Full agricultural trade
34 Salem and Banks, 2014, Arab Food Security in 2030: projections, prospects and projects. 35 European Commission Joint Research Centre, 2013, Economic Growth in the Euro-Med Area through Trade Integration: Focus on Agriculture and Food.
liberalisation between the EU and SEMCs is also predicted to reduce food costs in the SEMCs but
would increase the proportion of food that is imported.
3. Mobilising trade to improve food security
This section presents a brief summary of approaches to addressing food security through trade
and integration and the key role of trade facilitation, logistics and trade policy.
Many of the SEMCs face food security risks due to their dependence on food imports. In the
trade section of this note, the growing and significant net agricultural imports for all the SEMCs,
except Turkey, was noted, with over one-half of imports being grains and oilseeds (and their
derivatives), rising to 68 percent for Algeria, 64 percent for Turkey and 61 percent for Egypt.
This implies that total SEMC agricultural import costs are highly vulnerable to adverse
movements and volatility in the price of grains and oilseeds.
Given the importance of cereals imports, there is scope for the SEMCs to import them in a more
reliable and cost effective manner to reduce risks. This could be done through investment in
increased efficiency in import supply chains and logistics, which could help to reduce
exposure to international market volatility and reduce the total cost of importing wheat by
encouraging smoother logistics, reducing the base cost of importing grains, improving food
security, improving the reliability of wheat supplies and reducing product losses36.
The cost of moving grain from port to mill is up to four times higher in some SEMCs than
international standards. In Arab countries, in 2009, the logistics costs of moving one tonne of
wheat from port to mill were on average USD 40 (with costs varying between USD 19 to 47),
compared to USD 11 in the Netherlands and USD 17 in South Korea. Transit times are also
slower than international norms: 78 days in Arab countries compared to 18 days in the
Netherlands and 47 days in South Korea37.
The costs of moving wheat from port to mill in Arab countries are 29 percent for port logistics,
12 percent for storage, 22 percent for transport and 36 percent for import supply management.
The average vessel turnaround time in port is 9.5 days, which makes up two-thirds of the port
logistics costs, or 20 percent of the overall port to mill costs. On average, vessels have to wait for
three days to discharge compared to less than one in the Netherlands. Reducing vessel waiting
times from three days to one day would reduce wheat import costs by roughly USD 3 per tonne.
While vessel turnaround times in Morocco and Jordan are comparable to those in South Korea,
with Lebanon being faster, there is considerable scope for improving this metric in Tunisia and
Egypt. Factors affecting vessel turnaround time include the speed of customs and inspection
procedures and limited berthing space.
Storage costs are essentially a function of the dwell time (how long the grain is held in port
before delivery to the end user). Given that dwell times are high in many Arab countries, this
adds in practice around 2 percent to the CFR (cost and freight) price of total wheat imports.
Inland transport costs vary across Arab countries, from 7 percent of import supply chain costs
in Tunisia, 12 percent in Morocco, 21 percent in Egypt to 42 percent in Jordan. Partly this is a
result of geography (transport costs in Bahrain and Qatar are a fraction of those in Yemen), but
poor roads, low levels of competition for trucking, underutilisation of rail and river networks
and poor handling can all contribute to raising transport costs. Levels of product loss (i.e. the
difference in quantity between wheat unloaded from the vessel and that delivered to the end
user) are also reported to be high in many Arab countries, which contributes to higher
36 Lampietti et al., 2011, Food Security Volume 3 Supplement 1, A Strategic Framework for Improving Food Security in Arab Countries. 37 World Bank and FAO, 2012, The Grain Chain: Food Security and Wheat Imports in Arab Countries.
management costs, estimated at USD 480 million for all Arab countries combined in 2009
(World Bank and FAO, 2012).
Ahmed et al. argue that in the MENA region, there is a positive impact in terms of food security
and prices from reducing the role of the state in the grain import chain and encouraging the
development of private sector operators to replace them38.
SEMC governments should design policies and create the conditions to encourage increased
private sector involvement and attract investment in the grain import supply chain. A more
detailed and comprehensive analysis of bottlenecks in import supply chains, their causes and
possible solutions, would help to identify those segments of the supply chain which can deliver
the largest improvements for the lowest investment costs.
The World Bank suggests that SEMC governments can also address food security concerns
through reserves and procurement policies39. In terms of reserves policy, they note that
counter-cyclical strategic wheat reserves to smooth global prices are more cost effective than
pro-cyclical targeted interventions to offset high prices.
For grain procurement, there are a range of options for governments in particular to explore,
including improving the quality of market information, upgrading the risk management tools
used, simplifying the tendering process, hedging strategies (such as long term supply contracts,
futures and forward purchases), improving regional cooperation40 and improving cooperation
with traders (partly to reduce counterparty risk).
In most of the SEMCs, land and water constraints mean that food sovereignty is neither feasible
nor a sensible allocation of resources. The high opportunity cost of using limited natural
resources for the production of a low-value crop such as wheat suggests that SEMCs should
consider alternative combinations of policies to increase food security, including pursuing a
strategy of agricultural self-reliance, rather than food sovereignty. Food sovereignty means
producing enough food domestically to meet domestic consumption, whereas agricultural self-
reliance concerns encouraging agricultural export revenues in order to help to cover food
import costs41.
There has also been significant growth in SEMC agricultural exports over the past ten years,
even if agri-food deficits have continued to widen. Fruit and vegetables and preparations
thereof, being the most important product group, accounted for 44 percent of 2013 exports.
SEMCs have a comparative advantage in producing fruit and vegetables and the potential to
become highly competitive for both export and domestic markets42, a finding highlighted by a
recent FAO study43. Higher levels of exports would help to provide a degree of protection from
world food price inflation and a source of foreign exchange. It is however recognised that some
38 Ahmed et al., 2014, Shifting governance structures in the wheat value chain: implications for food security in the Middle East and North Africa. 39 World Bank, 2015, Trade Policy and Food Security. 40 Examples include working with neighbouring countries to import wheat, for example, supply chain congestion in Jordan could be reduced by importing some wheat through Mediterranean ports such as Haifa, Tripoli or Beirut, or exploring the options for transhipment from large vessels in deep water ports to smaller vessels serving shallow water ports, using a hub and spoke distribution model (World Bank and FAO, 2012). 41 Magnan et al., 2011, Food Security: The Science, Sociology and Economics of Food Production and Access to Food, Modelling the limitations and implicit costs of cereal self-sufficiency: the case of Morocco. 42 Agriculture and Rural Development in MENA, World Bank, 2008. 43 FAO, “The agrifood sector in the Southern and Eastern Mediterranean: a collection of notes on key trends”
countries choose to support their own production of basic foods due to reduced confidence in
global food markets following the food price increases that have occurred since 2008.
Therefore, a more detailed analysis of the benefits and practicalities of boosting export-oriented
production relative to lower value crops such as wheat would be welcome.
The World Bank stresses that it is of critical importance to improve trade-related
infrastructure and strengthen trade facilitation activities. It is estimated that trade costs
constitute 20 to 40 percent of the final delivered price of MENA non-oil exports44. Trade costs
are on average double those in the EU, particularly for agricultural products, due to high
transportation costs, their time sensitive (perishable) nature and NTBs such as inefficient
border controls. The World Bank estimates that weaknesses in trade facilitation and transport
impediments impose greater losses than tariffs and quotas. A favourable investment climate,
streamlined customs procedures, lower nontariff barriers and competitive transportation
markets may promote trade as much as tariff reduction (IFPRI, 2010).
In the SEMCs, connectivity is generally good, but logistics and trade facilitation as measured by
the World Bank indices have considerable room for improvement. Logistics performance can be
broken down into three main components:
(i) Trade related infrastructure (ports, roads, etc.)
(ii) Customs and border procedures
(iii) Logistics services (trucking, warehousing, shipping services, etc.)
In order to improve the efficiency of supply chains linking domestic producers and buyers to
international partners, trade facilitation and logistics reforms should address both the hard
infrastructure investments and the policy environment (World Bank, 2013).
44 World Bank, 2013, Regional Economic Integration in the Middle East and North Africa.