agri-environmental indicator - nitrate pollution of water ... · river nitrate concentrations...
TRANSCRIPT

Agri-environmentalindicator - nitrate pollution
of water Statistics Explained
Source Statistics Explained (httpeceuropaeueurostatstatisticsexplained) - 28032018 1
Data from September 2012 Most recent data Further information Main tables and Database Plannedarticle update April 2018
This article provides a fact sheet of the European Union (EU) agri-environmental indicator water quality -nitrate pollution It consists of an overview of recent data complemented by all information on definitions measurement methods and context needed to interpret them correctly The water quality - nitrate pollutionarticle is part of a set of similar fact sheets providing a complete picture of the state of the agri-environmentalindicators in the EU
Table 1 Groundwater nitrate concentration classes (mg NO3l) and proportion of groundwatermonitoring stations in each class per country () 2009 EU-27 EFTA candidate and potentialcandidate countriesSource European Environment Agency
Figure 1 Groundwater nitrate concentration classes (mg NO3l) and share of groundwatermonitoring stations in each class by country () 2009 EU-27 EFTA candidate and potentialcandidate countriesSource European Environment Agency
Figure 2 Annual average nitrate concentration in groundwater aggregated to different geograph-ical regions of Europe (mg NO3l)(1992 - 2009)Source European Environment Agency
Agri-environmental indicator - nitrate pollution of water 2
Figure 3 National proportion of groundwater bodies in various trend categories for nitrateconcentration () (1992-2009)Source European Environment Agency
Map 1 Annual average river nitrate concentration averaged by National River Basin Districts(mg Nl) (2009) EU-27 and EFTASource European Environment Agency
Agri-environmental indicator - nitrate pollution of water 3
Figure 4 Annual average river nitrate concentrations aggregated to different geographical regionsof Europe (mg Nl) (1992 - 2009)Source European Environment Agency
Figure 5 National proportion of river monitoring stations in various trend categories for nitrateconcentration () (1992-2009)Source European Environment Agency
Agri-environmental indicator - nitrate pollution of water 4
Map 2 Annual diffuse agricultural emissions of nitrogen to freshwater (kg Nha of total landarea) (2009)Source Joint Research Centre European Commission
Nitrate pollution is indicated by current values and trends in nitrate concentrations in groundwater and riversexpressed in mg NO3l for groundwater and mg Nl for rivers
Main indicator
bull Rivers and groundwater with nitrate concentration above 50 mg NO3l (equivalent to 113 mg Nl) Riversand groundwater with nitrate concentration above 25 mg NO3l reflecting a threshold of concern
Supporting indicator
bull Time series of groundwater and rivers nitrate concentrations
Main statistical findingsKey messagesNitrates in groundwater
bull Nationally averaged nitrate concentrations are all well below the Nitrates Directive and Drinking WaterDirective limit of 50 mgl
bull National aggregation however masks considerable variation at the scale of groundwater monitoring sta-tions with approximately 13 of the stations across Europe in 2009 exceeding the 50 mgl limit
bull The highest proportion of exceedance in 2009 is observed in Belgium (30 ) Denmark (26 ) Spain(22 ) and Cyprus (19 ) but high levels are found also in Austria Germany Bulgaria Montenegroand Czech Republic (11-15 ) In addition five countries (Slovakia Luxembourg Slovenia France andSwitzerland) have a significant proportion (more than 20 ) of groundwater monitoring stations withconcentrations exceeding 25 mgl raising concern
bull In general terms groundwater nitrate concentrations have remained relatively stable since 1992 althoughthere is marked variation at the scale of individual groundwater bodies (GWB) More than 25 ofgroundwater bodies in Norway Lithuania Belgium Denmark Germany and Bulgaria exhibit statistically
Agri-environmental indicator - nitrate pollution of water 5
significant rising trends (Norway had 1 groundwater body only) although the latter three countries alsoexhibit a number of groundwater bodies with significant declining trends Countries which show thestrongest decline in groundwater nitrate concentrations are Portugal the Netherlands Austria Slovakiaand Slovenia (at least 40 of groundwater bodies showing significant declining trend)
Nitrates in rivers
bull River nitrate concentrations aggregated both nationally and at a river basin scale are below the 113 mgNl limit (equivalent to 50 mg NO3l) of the Nitrates and Drinking Water Directives
bull However current concentrations are often sufficient to promote eutrophication in many of Europersquos coastalwaters
bull Generally concentrations are lowest in Scandinavia and highest in Luxembourg France UK Germanyand Denmark (averaged by National River Basin Districts )
bull Significant decreases in river nitrate concentration are particularly evident in Denmark Germany CzechRepublic Slovakia Ireland Sweden Hungary Norway Belgium Bulgaria Poland United Kingdom andAustria over recent years However more than 30 of rivers in Spain and Switzerland exhibit a risingtrend Overall a statistically significant decrease in average nitrate concentrations is evident at 32 ofriver monitoring stations across Europe whilst in 14 a statistically significant increase has occurred
AssessmentGroundwater
Nationally averaged groundwater nitrate concentrations are all below the Nitrates and Drinking Water Di-rectives limit of 50 mg NO3l National aggregation however masks considerable variation at the scale of in-dividual groundwater monitoring stations with approximately 13 of groundwater monitoring stations acrossEurope in 2009 exceeding the 50 mg NO3l limit Between 1992 and 2009 this figure has remained relativelystable lying between 5 and 10 The highest proportion of exceedance is observed in the Belgium (30) Denmark (26 ) Spain (22 ) and Cyprus (19 ) but high levels are found also in Austria GermanyBulgaria Montenegro and Denmark Czech Republic (11-15 ) Twenty-two countries in 2009 had at least oneindividual groundwater monitoring station with an average concentration above the 50 mg NO3l limit (Figure1) In addition five countries (Luxembourg France Slovenia Switzerland and Slovakia) have a significantproportion (more than 20 ) of groundwater monitoring stations with concentrations exceeding 25 mg NO3lraising concern particularly at those sites where this concentration range is also combined with a rising trendGroundwater nitrate concentrations are lowest in Finland Iceland Liechtenstein Croatia Bosnia and Herze-govina and Albania with few groundwater monitoring stations (less than 10 ) exceeding 10 mg NO3l Broadaggregation to regional scale shows that concentrations are highest in the western and lowest in the northernregions of Europe (Figure 2)
In overall terms groundwater nitrate concentrations have remained relatively stable since 1992 (Figure 2)although there is marked variation at the scale of individual groundwater bodies More than 25 of ground-water bodies in Norway Lithuania Belgium Denmark Germany and Bulgaria exhibit statistically significantrising trends (Norway had 1 groundwater body only) although the latter three of these countries also exhibit anumber of groundwater bodies with significant declining trends (Figure 3) Countries which show the strongestdecline in groundwater nitrate concentrations are Portugal the Netherlands Austria Slovakia and Slovenia (atleast 40 of groundwater bodies showing significant declining trend) In Portugal all the four groundwaterbodies have a significant downward trend
In most cases in countries where both types of data are available the percentage of significant declining trendsis higher for rivers than for groundwater This is probably reflecting in part the lag times associated with thetransport of nitrate from soil layers to deeper groundwater (10 - 40 years) Declining trends in groundwaternitrate can typically be attributed to improvements in the management of agricultural land
Rivers
River nitrate concentrations aggregated both at a river basin scale (Map 1) and by European region (Fig-ure 4) are below the 113 mg Nl limit (equivalent to 50 mg NO3l) of the Nitrates and Drinking WaterDirectives Less than 1 of individual rivers across Europe exceed the limit However current concentrationsare often sufficient to promote eutrophication in many of Europersquos coastal waters ( EEA Indicator CSI023 )
Agri-environmental indicator - nitrate pollution of water 6
Generally concentrations are lowest in Scandinavia (below 08 mg Nl) and highest (some districts over 36mg Nl equivalent to over 16 mg NO3l) in Luxembourg France UK Germany and Denmark (averaged byNational River Basin Districts) For much of the rest of Europe average concentrations lie between 08 and36 mg Nl However such aggregated data at river basin scale mask very high concentrations in some areaswhich cause badmoderate status of waters and pose concerns in relation to drinking water supply
Significant decreases in river nitrate concentration are particularly evident (more than 25 rivers signifi-cant decline) in Denmark Germany Czech Republic Slovakia Ireland Sweden Hungary Norway BelgiumBulgaria Poland United Kingdom and Austria over recent years (Figure 5) However more than 30 of riversin Spain and Switzerland exhibit a rising trend Overall a statistically significant decrease in average nitrateconcentrations is evident at 32 of river monitoring stations across Europe whilst in 14 a statisticallysignificant increase has occurred
Declining trends in river nitrate are likely to reflect a number of factors including improved managementof agricultural land but also a reduced discharge of nitrogen from municipal wastewater treatment plants asdriven by implementation of the Urban Waste Water Directive
Main warnings
bull Whilst agriculture is in general terms the greatest contributor to nitrate in European freshwaters othersources are also of importance particularly discharges from urban wastewater treatment plants It is notpossible to apportion the contribution from each source from water quality data alone
bull River nitrate concentrations held in the WISE-SoE waterbase are not flow weighted and reflect inter-annual variations in hydrology Such variation does not however strongly impact the long-term trendsobserved
bull The sampling frequency and number of stations monitored varies between countries
bull Where a particular river crosses national boundaries the observed nitrate water quality at any point willreflect all sources upstream including those in other countries
bull The data provided via WISE-SoE Rivers and WISE-SoE Groundwater might be for the future combinedwith the data coming from the Nitrate Directive (which reflect more the impact of agriculture) DGEnvironment and EEA are together with Member States (MS) working on a streamlining of the differentMS reporting on water quality including coordination of WISE-SOE and Nitrate Directive reporting
Data sources and availabilityIndicator definitionNitrate pollution is indicated by current values and trends in nitrate concentrations in groundwater and rivers(expressed in mg NO3l for groundwater and mg Nl for rivers)
MeasurementsMain indicator
bull Rivers and groundwater with nitrate concentration above 50 mg NO3l (equivalent to 113 mg Nl) Riversand groundwater with nitrate concentration above 25 mg NO3l are considered to be of concern
Supporting indicator
bull Time series of groundwater and rivers nitrate concentrations
Links with other indicatorsThe indicator water quality - nitrate pollution is linked with following other indicators
bull AEI 05 - Mineral fertiliser consumption
Agri-environmental indicator - nitrate pollution of water 7
bull AEI 102 - Livestock patterns
bull AEI 111 - Soil cover
bull AEI 112 - Tillage practices
bull AEI 113 - Manure storage
bull AEI 15 - Gross nitrogen balance
bull EEA Indicator - CSI020
bull EEA Indicator - CSI023
Data used and methodologyAll analyses are based on annual average concentration data from single groundwater monitoring stations andgroundwater bodies or river monitoring stations reported to Eionet and drawn from the EEA Waterbase version11 (WISE-SoE) For groundwater groundwater monitoring station data are used for the current situation andgroundwater bodies for the time series and trend analysis All data are analysed by the European Topic Centreon Inland Coastal and Marine waters (ETCICM) For rivers total oxidised nitrogen data are used wherevernitrate data are missing or for the time series analysis if data are available for more years for total oxidisednitrogen Concentrations are expressed in mg NO3l for groundwater and mg Nl for rivers Data availabilityis not evenly spread in space and time but has increased rapidly in recent years For time series and trendanalyses only data series that are complete for the whole period 1992 - 2009 after interextrapolation havebeen used (375 groundwater bodies time series and 1668 river station series) The data showing the currentsituation (Figures 1 and 4) include all the most recent data (12 938 groundwater monitoring stations and 5 463river monitoring stations)
When interpreting the data some factors should be kept in mind
bull The nitrate in groundwater and rivers does not just derive from agriculture but also from other sourcesin particular waste water (even though the large majority comes from agriculture)
bull Inter-annual variation in hydrology gives rise to variation in river nitrate concentrations but this does notaffect long-term trends
bull Sampling frequency and the number of stations vary between countries For more information on method-ology consult the CSI 020 indicator specification (EEA Indicator CSI020)
ContextExcessive emissions of nutrients to water cause eutrophication characterised by the proliferation of algal bloomsthat are aesthetically unappealing and reduce the clarity of water The algal blooms frequently involve toxiccyanobacteria which pose a threat to public health and decomposition of algae under anaerobic conditionsmay produce toxic gases Algal blooms are also associated with the loss of rsquodesirablersquo plant and animal speciesImpacts of eutrophication on freshwater ecosystems are documented throughout Europe However excessivelevels of nitrate have greatest significance with respect to the eutrophication of estuarine and coastal waters
Inputs of nutrients to agricultural land are generally in excess of what is required by crops and grassland resulting in nutrient surpluses1 The magnitude of these surpluses reflects the potential for detrimental impactson the environment including upon water quality Whilst other sources can be of importance (in particularuntreated urban wastewater ) in general terms agriculture is the greatest contributor to nitrate levels in fresh-water across Europe (50 - 75 ) to nitrate levels in freshwater across Europe As a consequence legislation hasbeen established to address this issue it is described below under policy and relevance context chapter
This factsheet describes nitrate concentrations in rivers and groundwater across Europe including currentlevels and historical trends The trend information identifies those countries for which improvement andordeterioration in nitrate water quality observed Assessment of current concentrations is made against legislative
1Grizzetti B Bouraoui F and Aloe A 2007 Spatialised European Nutrient Balance Institute for Environment andSustainability Joint Research Centre EUR 22692 EN
Agri-environmental indicator - nitrate pollution of water 8
criteria - primarily a threshold of 50 mg NO3l (113 mg Nl) with a guiding concentration of 25 mg NO3l(56 mg Nl) to reflect a level of concern
Policy relevance and contextNitrate in freshwater from agricultural sources is addressed by the Nitrates Directive (Directive 91676EEC) The Nitrates Directive requires the establishment of Nitrate Vulnerable Zones (NVZ) in areas where agricul-tural sources of nitrate have led or could lead to excessive concentrations in freshwater or threatened waterssensitive to eutrophication Action programmes are required for NVZ that detail a range of measures that needto prevent and reduce nitrate pollution Such measures include a threshold limit for the application of manurenitrogen to land of 170 kgha per year the provision of sufficient manure storage capacity and restrictions onfertiliser application when soil conditions are unsuitable (eg when saturated) or when crops are not in needfor nutrients (autumnwinter) Derogations to the threshold of 170 kgha per year have however been grantedin some countries under very strict conditions Full implementation of the Nitrates Directive is required (asa basic measure) under the Water Framework Directive (Directive 200060EC) which represents the singlemost important piece of EU legislation relating to the quality of fresh and coastal waters aiming to attain goodecological and chemical status of Europersquos fresh and coastal waters by 2015
Cross-compliance under the Common Agricultural Policy (CAP) contributes to a better implementation ofthe Nitrates and Groundwater Directive (Directive 8068EEC) In addition agri-environmental measures canalso play a role in reducing the pollution of water by nitrates The cross-compliance mechanism is implementedto require all farmers receiving payments under various schemes to comply with a set of statutory managementrequirements including those that address the environment (the Nitrates and Groundwater Directives) and torespect standards on Good Agricultural and Environmental Conditions (GAEC) The current cross-compliancerules also identify the need to maintain existing permanent pastures and avoid their conversion to arable landand to establish buffer strips along water courses
In addition to cross-compliance the CAPrsquos rural development regulation includes the implementation of agri-environmental measures These measures include payments to farmers who carry out specific agri-environmentalcommitments that go beyond a reference baseline consisting of inter alia the cross-compliance standards andrequirements of the legislation The CAPrsquos rural development regulation identify a range of potential measuresfor the improvement among others of water quality including reduced fertilization improving manure storagethe use of cover crops riparian buffer strips and wetland restoration They also recognize the importance ofeducational and advisory programmes for farmers Implementation of these CAP measures plays a key role inaddressing diffuse pollution from agriculture
Reforms of the Common Agricultural Policy contribute as well to reduce diffuse pollution from agricultureThe recent CAP proposal goes a step forward by greening the first pillar These means that 30 of DirectPayments will be allocated for the provision of public goods maintenance of permanent pasture at farm levelcrop diversification and ecological focus area These 3 measures will apply to every farmland
Nitrate levels in water intended for human consumption are addressed by the Drinking Water Directive whichrequires that concentrations do not exceed 50 mg NO3l Exceedence of this threshold does occur howeverand requires that the water is either treated or blended with a less contaminated source Both treatment andblending incur costs
Agri-environmental contextWhile nitrogen fixation atmospheric deposition and the application of treated sewage sludge can all be impor-tant typically the major nutrient inputs to agricultural land are from inorganic mineral fertilisers and organicmanure from livestock Today the highest total fertiliser nutrient application rates - mineral and organiccombined - generally although not exclusively occur in Western Europe Ireland England and Wales theNetherlands Belgium Denmark Luxembourg north-western and southern Germany the Brittany region of
Agri-environmental indicator - nitrate pollution of water 9
France and the Po valley in Italy all have high nutrient inputs23
Inputs of nutrients to agricultural land across Europe are generally in excess of what is required by cropsand grassland resulting in nutrient surpluses4 The magnitude of these surpluses reflects the potential fordetrimental impacts on the environment since it is available for gaseous loss to the atmosphere as ammoniabuild-up in soil pools over time or transport to the nearest receiving water body The pattern of national scalenitrogen surpluses across Europe reflects the magnitude of inputs via mineral and manure fertilisers Whilstmost countries exhibited an annual nitrogen surplus calculated as an average between 2006 and 2008 of atleast 30 kg N per hectare of total agricultural land values in excess of 100 kg N ha were apparent for MaltaBelgium Cyprus and Norway and even exceeded 200 kg N per ha in the case of the Netherlands balance inagriculture (Eurostat aeiprgnb )
Wider agro-economic factors and improved training for farmers are likely to have played a role in the de-cline of surpluses In addition policy measures such as national action plans established under the NitratesDirective have been of importance Despite the general decreases over recent years nutrient surpluses in someregions of Europe remain at an excessively high level Although certain catchment processes can attenuatemuch of the nutrient surplus a significant proportion can still be transported to freshwater and hence termedan emission According to model estimates agricultural emissions of nitrogen to freshwater exceed 10 kg perha per year across some European regions with values exceeding 20 kg N per ha per year in parts of Denmarksouthern Sweden and Norway western United Kingdom Ireland Belgium Netherlands Brittany and the PoValley5(Map 2) Such diffuse emissions are strongly dependent upon rainfall The magnitude of the emissionstogether with a range of other contributing factors determines the concentrations observed in freshwater
Excessive emissions of nutrients to freshwater cause eutrophication characterised by the proliferation of al-gal blooms that are toxic aesthetically unappealing and reduce the clarity of water giving it the appearanceof rsquogreen souprsquo often accompanied by unpleasant smells This proliferation is also associated with the loss ofrsquodesirablersquo plant and animal species The process of dissolved oxygen concentrations fall can be compoundedwhen the aquatic plant life dies generating huge amounts of organic matter and further diminishing oxygenlevels Impacts of eutrophication on freshwater ecosystems are documented throughout Europe However ex-cessive levels of nitrogen have greatest significance with respect to the eutrophication of estuarine and coastalwaters which remains widespread throughout Europe (EEA Indicator CSI023)
Toxic cyanobacteria associated with algal blooms pose a threat to public health Direct skin contact withwater containing these cyanotoxins for example through freshwater and marine recreation can cause allergicreactions similar to hay fever and asthma Skin eye and ear irritations can also occur and ingestion of thetoxins may result in gastrointestinal illness and liver damage Cyanotoxins can also affect the nervous systemA recent assessment of European waters indicates that mass populations of bloom- scum- mat- and biofilm-forming cyanobacteria with cyanotoxin potential are relatively widespread and occur in water resources usedfor drinking water supply aquaculture recreation and tourism and moreover health incidents involving cyan-otoxins have been reported in some European countries6 While excessive nutrient levels are strongly linked tocyanobacteria blooms understanding of the impact of human activities on their occurrence remains incomplete
Municipal drinking water supply systems supply treated water under quality controlled conditions ensuringthat nitrate concentrations do not exceed the threshold However in some rural areas of Europe drinkingwater is taken from wells and consumed without purification Excessive levels of nitrate in groundwater in the
2Grizzetti B Bouraoui F and Aloe A 2007 Spatialised European Nutrient Balance Institute for Environment andSustainability Joint Research Centre EUR 22692 EN
3Bouraoui F Grizzetti B and Aloe A 2009 Nutrient discharge from rivers to seas JRC EUR 24002 EN
4Grizzetti B Bouraoui F and Aloe A 2007 Spatialised European Nutrient Balance Institute for Environment andSustainability Joint Research Centre EUR 22692 EN
5Bouraoui F Grizzetti B and Aloe A 2009 Nutrient discharge from rivers to seas JRC EUR 24002 EN
6UNESCOIHP 2005 International Hydrological Programme-VI CYANONET A Global Network for Cyanobacterial Bloomand Toxin Risk Management Initial Situation Assessment and Recommendations Technical document in hydrology Number 76UNESCO Paris 2005
Agri-environmental indicator - nitrate pollution of water 10
vicinity of such wells could therefore pose a threat to public health
See alsobull Agri-environmental indicators (online publication)
Further informationPublications
bull Agriculture forestry and fishery statistics mdash 2016 edition (Statistical book)
bull Agriculture fishery and forestry statistics - 2014 edition
bull Environmental statistics and accounts in Europe - 2010 edition
bull Farm data needed for agri-environmental reporting
Dedicated sectionbull Agri-Environmental Indicators
Source data for tables figures and maps (MS Excel)bull Download Excel file
Other informationbull Commission Communication COM(2006)508 final - Development of agri-environmental indicators for mon-
itoring the integration of environmental concerns into the common agricultural policy
bull Agri-Environmental Indicators see
Legislation Commission Staff working document accompanying COM(2006)508 final
bull Agri-Environmental Indicators see
Corresponding IRENA Fact sheet 301
External linksbull Database
bull WISE-SoE Groundwaterbull WISE-SoE Rivers
bull Other external links
bull European Environment Agency
bull The European Environment - State and Outlook 2015bull Environment and healthbull Waterbull Freshwater Eutrophication Assessment
bull OECD - Agri-Environmental Indicators and Policies
Notes
Agri-environmental indicator - nitrate pollution of water 11
- Main statistical findings
-
- Key messages
-
- Assessment
-
- Data sources and availability
-
- Indicator definition
-
- Measurements
-
- Links with other indicators
-
- Data used and methodology
-
- Context
-
- Policy relevance and context
-
- Agri-environmental context
-
- See also
-
- Further information
-
- Publications
- Dedicated section
- Source data for tables figures and maps (MS Excel)
- Other information
-
- External links
- Notes
-
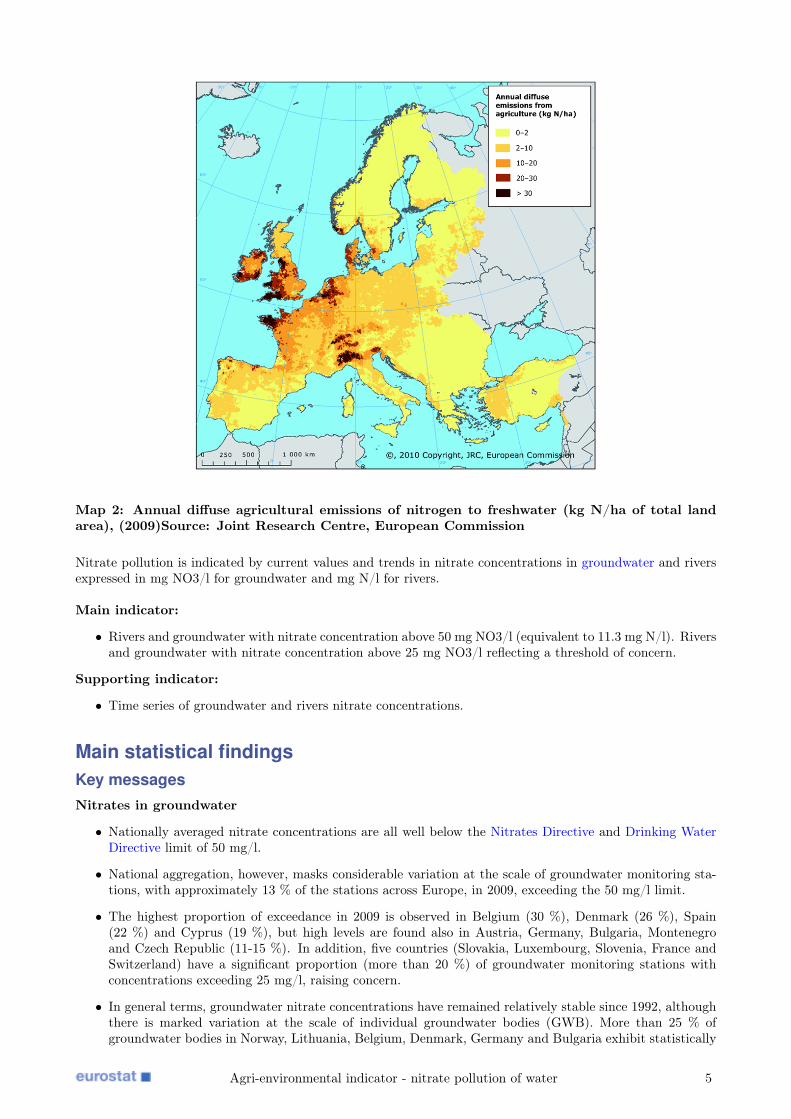