aging out of crime: exploring the relationship...
TRANSCRIPT
AGING OUT OF CRIME: EXPLORING THE RELATIONSHIP BETWEEN AGE AND CRIME WITH AGENT BASED MODELING
Caitlin V. M. Cornelius Christopher J. LynchVirginia Modeling, Analysis and Simulation
CenterVirginia Modeling, Analysis and Simulation
Center1030 University Boulevard, Suffolk, VA 1030 University Boulevard, Suffolk, VA
[email protected] [email protected]
Ross GoreVirginia Modeling, Analysis and Simulation Center
1030 University Boulevard, Suffolk, [email protected]
ABSTRACT
Criminologists have long observed a strong correlation between age and crime. The age crime relationship has withstood stringent testing since the 1920’s and repeatedly demonstrated that criminal activity peaks at age seventeen and then gradually declines. These efforts have resulted in the formation of several theories; however, quantitative assessment of these theories are incomplete and fail to fully examine the role of sociological and cultural factors. In this paper, we create an agent-based model (ABM) that generates a society where individuals age out of a predisposition to commit crimes. We also extend the model into a tool for decision makers to gather actionable insight with respect to competing crime reduction policies. Our results demonstrate that modeling crime through an ABM enables decision makers to test the viability of crime-related policies by reducing the uncertainty associated with the potential crime reduction outcomes while examining the effectiveness of resource allocations.
Keywords: agent-based modeling, criminology, resource allocation.
1 INTRODUCTION
The relationship between age and crime is one of the most solid within the field of criminology. It is understood that crime increases throughout adolescence and then peaks at age 17 (slightly earlier for property crime than for violent crime) and then begins to decrease over the life course moving forward. This trend has, over the years, withstood stringent testing and examination across time periods and maintains consistent results regardless of race/ethnicity, education level, or income (see for example: Farrington 1986; Braithwaite 1989; Hirschi and Gottfredson 1983; Moffitt 1993; Piquero et al. 2003). Hirschi and Gottfredson (1983) are generally credited with the resurgence of criminology’s examination of the age and crime relationship when they challenged this commonly held notion and suggested that the age and crime relationship was not as reliable as once thought and that the relationship was in serious need of reexamination. As recently as Shulman, Steinburg, and Piquero’s (2013) very thorough testing however, criminologists have come to understand that it is necessary to also include sociological, psychological, and environmental elements into the understanding of the age and crime relationship.
D

Cornelius, Lynch, and Gore
While criminology has traditionally utilized statistics as the basis of its science, there is perhaps another method of analysis well suited to the task, agent-based modeling. Agent-based modeling is a computational method within the discipline of Modeling and Simulation (M&S) that allows the researcher to simulate reality in order to examine a phenomenon from an independent platform using the rules that govern that system (Bonabeau 2002; Epstein and Axtell 1996; Gilbert 2008; Gilbert and Terna 2000). The idea that computer simulations can present the researcher with a separate and unique source of data is appealing. When combined with the well-established quantitative and qualitative methods that social scientists are more used to, agent-based modeling could allow for a further triangulation of results, or possibly present the foundational point for new studies moving forward.
The current study applies agent-based modeling and criminology to better understand the age and crime relationship by simulating the manner in which an individual “ages out” of crime, or fails to. Previously, studies of this topic were limited to the available data in a given time or location. An ABM of the age and crime relationship allows researchers to examine how this relationship plays out over time, across multiple, simulated “runs” and potentially, with a larger population than previously examined. We hope the results will point specifically to a better understanding of how individuals proceed throughout life, how they advance or fall into criminality, and further, what elements of the environment can be manipulated in order to decrease the overall level of crime throughout the “society.”
2 THE AGE AND CRIME RELATIONSHIP
The age and crime relationship is one of the strongest and most well tested in criminology. Starting with Farrington (1986), it is understood that rates of criminality generally increase through adolescence and peak at age 17 (again, slightly earlier for property crime than for violent crime) and descend as the individual ages. While the observation of this phenomenon is reliable from a scientific standpoint, the natural question arises concerning what exactly is contributing to this decline over the life course. The possible explanations for why crime might decrease over an individual’s lifetime can possibly be explained by already established criminological theories; specifically life course theory, social bond theory, strain theory, and social learning theory. It is this integrated theory approach which has become the foundation for the construction of the current study’s ABM.
Sampson and Laub (2003) propose one possible theory with regard to the reduction of crime over the life course of an individual. Their general life course theory proposes that the individual ages out of crime due to the “turning points” that one encounters which sends them on a “different trajectory.” Sampson and Laub (2003) identify graduating from high school or college, serving in the military, getting married, purchasing property, or having children (among other examples) as turning points in life that directly alter one’s trajectory. Further, these turning points can result in a trajectory away from criminality as crime is often not conducive to the achievement of each of these turning points. For example, one who has children might veer away from criminality as one would not like to spend time in jail away from one’s children nor have their children exposed to the dangers that often accompany criminal lifestyles.
Sampson and Laub’s life course theory, in the above sense, then begins to remind many criminologists of Travis Hirschi’s (1969) social bond theory due to its specific explanation of how the turning points might directly lead to a decrease in criminality over time. Hirschi presents his ideas that there are four major components to one’s relationship with society: attachment, commitment, involvement, and belief. He goes on further to explain these four elements: The attachment one has to their families and peers would lead to one not engaging in criminal behavior so as to not disappoint these individuals they hold in regard. One’s commitment to the dominating social norms and rules of law results in one’s unwillingness to violate said norms and laws and therefore resist criminal behavior, lest the individual lose the investment they have made in society and their role within it. If an individual is involved then they simply are too busy to engage in criminal activity because they are otherwise engaged in the legitimate behaviors of maintaining a job or raising children. Lastly, the individual’s belief that these rules and social norms are important and that violation will lead to unpleasant consequences will also lead to them avoiding criminal behavior (Hirschi 1969).

Cornelius, Lynch, and Gore
Agnew’s (1992) strain theory also plays a role in the construction of the current study’s ABM. Strain theory states that crime is the natural result of the convergence of a few concepts; first, that our society imparts on the individual a need to obtain success in order to achieve status, second, the legitimate means of achieving that success are limited, third, those who are unable to achieve that success in a legitimate manner will resort to crime in order to keep status or as a means of objecting to the system. A classic example would be a felon who is not offered employment due to his felony status, commits robbery/burglary in order to afford to feed himself and his children. Strain theory is important in the construction of the current model in that it speaks to the connection between social status and crime and the criminality that can occur when one is denied legitimate means to obtaining social status. Further exploration of strain theory, specifically the American Dream and the role that it plays in criminality describes a tendency for American’s to be more anomic in their daily lives and their quest for success. Messner and Rosenfeld (2003) describes a culture centered on the values of achievement, individualism, universalism and materialism with the emphasis being placed on success more so than on the legitimate means of achieving it. This cultural trend could be a major contributor to crime.
Lastly, as an explanation for why some individuals are unable to age out of crime, and also, why the individual’s surrounding peer group plays such a pivotal role in criminal behavior or the lack thereof, Sutherland’s differential association theory is appropriate. The idea that criminality is learned is entirely appropriate in contrasting a model of how one ages out of crime. Sutherland suggests that the individual does not spontaneously commit crime, but rather, learns the skills needed to commit crimes from one’s peers and also learns through their established peer network that continued criminality, via a set of cultural standards, is acceptable (Sutherland 1947). In Sutherland’s theory, the current study finds a foundation of peer support for criminality; that is, that it is very difficult to age out of crime where one already is a criminal and is surrounded by other criminal. “Social reinforcement and cultural validation are required whether one is learning to become a butcher or a dentist, a burglar or a rapist” (Messner and Rosenfeld 2007, pp. 51; Sutherland 1947). In this sense, an ABM of the age and crime relationship must account for peer associations of some sort.
3 CRIMINOLOGY, AGENT-BASED MODELING, AND RESOURCE ALLOCATION
Agent-based modeling is a new resource for criminology, but it is growing in popularity. Currently, the agent-based modeling and crime literature involve a few different themes and applications. Generally speaking, the current applications of agent-based modeling towards crime takes the form of actual crime based simulations that focus on the victim or the offender. Agents encounter other agents and either engage in crime or don’t as they go about some preset motion though the grid (see for example: Malleson et al 2010). The interaction of agents within a model, criminal and otherwise, can then also be used to generate synthetic street crime data for the purposes of allocating resources (Devia and Weber 2013).
A second theme of the agent-based modeling and crime literature is a representation of larger society and the occurrences of crime on a larger scale within that simulated society or the role that the altering of the simulated environment has on the occurrence of crime (see for example: Epstein 2002; Lim et al.2007; Malleson et al. 2013). Likewise, agent-based models of the grid itself, specifically, the potential targets in a given area, has produced unique insight into criminal activity within neighborhoods and communities (see for example: Malleson and Birkin 2012). Groff (2007) combines GIS with her ABM of crime to present an even more accurate simulation of street crime and found that the distribution of crime throughout the simulated model is more accurate and differs significantly when real life data is used.
Neither approach to an ABM of crime is necessarily better than the other. Instead, they are simulating different models of crime at different levels of resolution. For the purpose of this project, the abstractness of the latter type is more appropriate for modeling the age and crime relationship.
Furthermore, by modeling crime through an ABM, the model itself can become a tool for decision makers to gather actionable insight with respect to competing policies. Frequently decision makers face difficult decisions related to funding different crime reduction programs. Some of these programs reduce criminality by helping criminals enter the first stage of their life course, while others attempt to provide
Cornelius, Lynch, and Gore
incentives to non-criminals in the first stage of their life course so they do not have to resort to criminal behavior. Modeling crime through an ABM enables decision makers to test the deployment of different programs to reduce the level of uncertainty related to the potential outcomes of the policy and to help in identifying where to apply resources (i.e. programs and program funding money) more effectively.
4 CURRENT STUDY
We utilize an integrated theory approach to construct an ABM that builds upon the growing literature of agent-based modeling and crime. The current model is a very abstract representation of a splice of a cohort of society. Four hundred agents are evenly distributed into a social hierarchy consisting of seven stages numbered 0 through 6. In those cases where agents cannot be exactly evenly distributed across all stages the remaining agents are distributed evenly amongst a randomly chosen subset of the stages . To incorporate the aforementioned criminological theories, those agents who engage in criminal activity are represented at level 0 of the hierarchy and we track each agent’s progression throughout the stages throughout each simulated run. Working with an integrated theory approach, we surmise that the individual proceeds on a linear timeline throughout life while checking off major life events in a given order along the way. We further surmise that the completion of each major life event leads to an overall reduction, of a non-quantified amount, in the chances that the individual will engage in criminal activity through the assistance of an agent’s peers (the other agents occupying the same level as the agent) in helping to prevent the agent from reverting back to crime.
Borrowing from Sampson and Laub’s (2003) life-course perspective, specifically the component dealing with trajectories that set people on different paths that lead away from crime, we establish the following trajectory-life stage path for our agents: stage 1 - graduate high school; stage 2 - graduate college or serve in the military; stage 3 - secure a career/stable place in the workforce; stage 4 - enter into marriage or partnership; stage 5 - purchase a home; and stage 6 - have children. We then construct the following rules to form the foundation of our base model:
a) Agents move randomly at each time step within their lateral stage, they can’t change stages randomly.
b) At each time step, each agent consults its 4 closest neighbors and if all 4 are of a higher stage, then the agent can move up one stage. If all 4 are of a lower stage, then the agent moves down one stage.
c) If 3 out of the agent’s 4 neighbors are criminals (life stage 0), then the agent becomes a criminal. d) In all other cases, the agents stay in their current stages.
While these life events and their corresponding stages are not the only way that an individual could proceed through life, they are a reasonable baseline for a model. Those agents at the “bottom” of the grid then represent those who have not progressed in the life stages and are perhaps poor, uneducated, and more predisposed to criminal activity.
In understanding the stages of the grid, it becomes clear that not only is it a life event progression, but it is also a representation of a socioeconomic hierarchy; those who have become educated, productive property owners are at the “top.” The implementation of some sort of resource allocation reflecting an external stimulus to further one’s progress through the stages is a logical extension. To do this, our model assumes a finite pool of resources available to our agents that serve to move agents up a stage independent of the rules listed above. Here, the term finite means that as agents consume the resources, the number of available resources is reduced.
Within this model extension, at each time step an agent applies the rules previously described. However, if the agent remained in the same stage, then the agent also applies the following:
a) Identify the number of resources available to agents within their stage and the number of agents, including themselves, within the stage. These two numbers are used to compute the Resources to Agents Ratio (RAR). Specifically, RAR is calculated by:
Cornelius, Lynch, and Gore
.
b) Draw a random number from a uniform probability distribution that is between 0 and 1. This random number reflects their likelihood of securing a resource (LAR).
c) If the agent’s LAR is less than or equal to the agent’s RAR, then the Number of Resources Available Within Stage is reduced by one and the agent moves up to the next stage in the model. Note that the resources allocated to the top stage of the model, Stage 6, are effectively wasted because agents cannot ascend any higher.
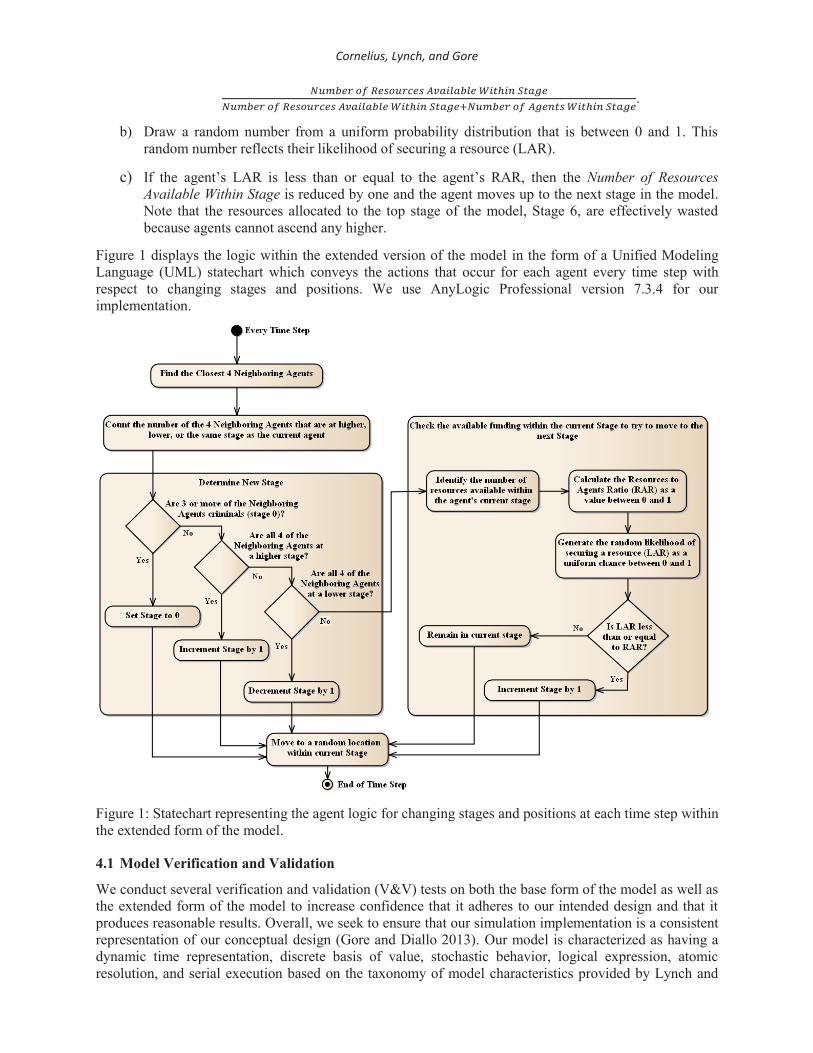
Figure 1 displays the logic within the extended version of the model in the form of a Unified Modeling Language (UML) statechart which conveys the actions that occur for each agent every time step with respect to changing stages and positions. We use AnyLogic Professional version 7.3.4 for our implementation.
Figure 1: Statechart representing the agent logic for changing stages and positions at each time step within the extended form of the model.
4.1 Model Verification and Validation
We conduct several verification and validation (V&V) tests on both the base form of the model as well as the extended form of the model to increase confidence that it adheres to our intended design and that it produces reasonable results. Overall, we seek to ensure that our simulation implementation is a consistent representation of our conceptual design (Gore and Diallo 2013). Our model is characterized as having a dynamic time representation, discrete basis of value, stochastic behavior, logical expression, atomic resolution, and serial execution based on the taxonomy of model characteristics provided by Lynch and

Cornelius, Lynch, and Gore
Diallo (2015). Therefore, while we do not expect challenges due to competing characteristics, we want to be sure that the model is free from structural errors and implementation errors.
To accomplish this goal we check the code both during execution and absent from execution using a variety of V&V techniques, including execution testing, execution monitoring, execution profiling (Balci 1998), traces (Courdier et al. 2002; Sargent 2013), model logging (North and Macal 2007), and visualization and animation (North and Macal 2007; Sargent 2013; Takadama, Kawai, and Koyama 2008). As an informal V&V check, we utilize visualization and animation techniques for gathering quantitative insights, for exploring our solution space, and for conducting pattern and flow analysis (Vernon-Bido, Collins, and Sokolowski 2015) by comparing our visual results against our conceptualization. We map the agents’ seven-stage, social hierarchy to an environmental separation where each stage is positioned above each other starting with criminals and moving upwards to stage six. Each stage is then assigned a unique color and during execution we observe that all agents appear to reposition every time step and that they correctly display the color of the stage that they are currently positioned within; therefore, we have increased confidence that the movement and stage update components are implemented correctly. We implement the logic provided in Figure 1 graphically as a state diagram and through the graphical state diagram execution that AnyLogic provides we are able to visually confirm that the implemented logic does not dead-end or result in infinite loops.
We use execution testing, execution monitoring, and execution profiling to check that (i) every agent changes position every time step, (ii) resources correctly decrement every time that an agent uses a resource to increase its stage, (iii) upward stage changes only occur in one stage increments, (iv) agents do not try to increase their stage past stage six, (v) agents do not change stage unless they satisfy one of the four “Yes” conditions shown on the decision blocks within Figure 1, and (vi) that the model does not suffer from concurrency errors due to agents simultaneously competing for resources.
To analyze these execution questions, we generate traces and model logs during runtime which provide time-series outputs that reflect model states, such as the number of agents at each stage and the number of available resources at each stage during each time step. Additionally, we collect the current stage of each agent at each time step as well as the current stage of each of the four nearest neighbors to each agent. In Section 5 the results of these validation experiments are discussed after the findings from the simulation are disclosed.
5 FINDINGS AND RESULTS
Our base model enables us to trace the life stage path of agents over time. We run the model with a population of 400 agents and allow it to execute for 100 time steps per run. While there is some variation in the model output from run to run due to the use of stochastics, the results shown in Figure 2 are representative of the base model’s behavior.
In the figure the number of agents are colored based on their criminality. The number of current criminals is shown in red and the number of current non-criminals is shown in black. As time passes the number of agents who are criminals decreases and the number of agents who are non-criminals increases. The rules within the base model provide one explanation for why individuals are less likely to commit crimes as their life courses progress.
However, while the base model forms one explanation for why individuals age out of crime it does not enable a decision maker to explore policies that minimize crime or maximize the life stage of an individual. To answer these questions we employ the extended version of our model.

Cornelius, Lynch, and Gore
Figure 2: Number of criminals (bottom/red) and non-criminals (top/black) at each time step.
Recall, in the extended version of our model a user allocates a finite pool of resources to agents among each life stage. In the model resources provide another mechanism for an individual to move up to the next life stage. Allocating resources represents choices related to funding different programs for individuals in each life stage. In an ideal world all programs are funded and individuals in every life stage receive help. Unfortunately, due to budget constraints decision makers cannot afford to fund every program. Our extended model provides a means to gain insight into the outcomes of funding different programs at different life stages.
To explore the different outcomes that are possible within our extended model we conduct a parameter sweep where the number of finite resources allocated to agents at each stage are varied. We assume that 100 total finite resources are available to be allocated across all stages. Recall, because a resource is finite, once it is consumed by an agent to enable him/her to move up a stage, it no longer exists.
Our exploration uncovers several different parameterizations that result in zero criminal agents after 100 time steps. These parameterizations are shown in Figure 3. In the figure, the total number of resources consumed is plotted on the x-axis, the average stage of agents in the simulation after 100 time steps is plotted on the y-axis, and the point on the graphic is colored to reflect stage where the maximum number of resources were allocated at the beginning of the run.
Several trends are apparent in Figure 3. The most obvious trend is that there are no parameterizations that results in a criminal free population after 100 time steps when the majority of the resources are allocated to Stage 6. This outcome is expected. Recall, due to the structure of the extended model resources allocated to Stage 6 are effectively wasted because agents cannot advance to a higher life stage. As a result, wasting resources does not create a criminal free population after 100 time steps.
The second trend apparent in Figure 3 is that all 100 total resources do not need to be used to create a criminal free population. There are more than 10 different parameterizations of the model that yield
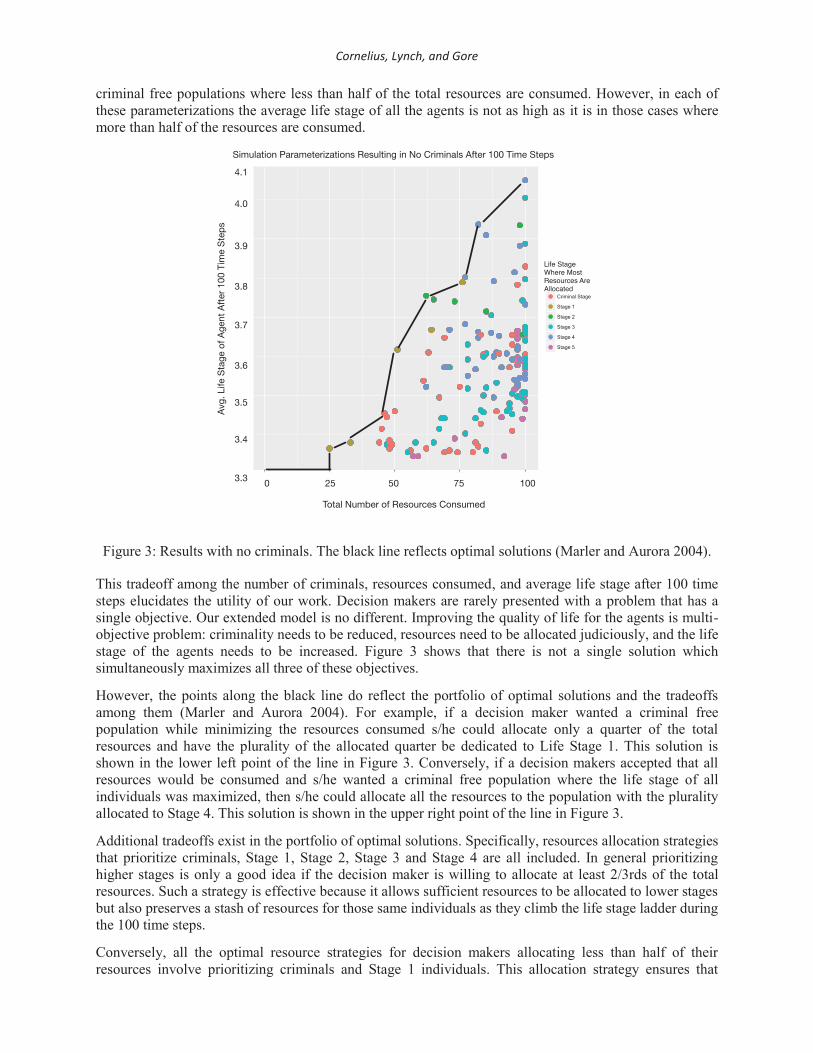
Cornelius, Lynch, and Gore
criminal free populations where less than half of the total resources are consumed. However, in each of these parameterizations the average life stage of all the agents is not as high as it is in those cases where more than half of the resources are consumed.
Figure 3: Results with no criminals. The black line reflects optimal solutions (Marler and Aurora 2004).
This tradeoff among the number of criminals, resources consumed, and average life stage after 100 time steps elucidates the utility of our work. Decision makers are rarely presented with a problem that has a single objective. Our extended model is no different. Improving the quality of life for the agents is multi-objective problem: criminality needs to be reduced, resources need to be allocated judiciously, and the life stage of the agents needs to be increased. Figure 3 shows that there is not a single solution which simultaneously maximizes all three of these objectives.
However, the points along the black line do reflect the portfolio of optimal solutions and the tradeoffs among them (Marler and Aurora 2004). For example, if a decision maker wanted a criminal free population while minimizing the resources consumed s/he could allocate only a quarter of the total resources and have the plurality of the allocated quarter be dedicated to Life Stage 1. This solution is shown in the lower left point of the line in Figure 3. Conversely, if a decision makers accepted that all resources would be consumed and s/he wanted a criminal free population where the life stage of all individuals was maximized, then s/he could allocate all the resources to the population with the plurality allocated to Stage 4. This solution is shown in the upper right point of the line in Figure 3.
Additional tradeoffs exist in the portfolio of optimal solutions. Specifically, resources allocation strategies that prioritize criminals, Stage 1, Stage 2, Stage 3 and Stage 4 are all included. In general prioritizing higher stages is only a good idea if the decision maker is willing to allocate at least 2/3rds of the total resources. Such a strategy is effective because it allows sufficient resources to be allocated to lower stages but also preserves a stash of resources for those same individuals as they climb the life stage ladder during the 100 time steps.
Conversely, all the optimal resource strategies for decision makers allocating less than half of their resources involve prioritizing criminals and Stage 1 individuals. This allocation strategy ensures that
Cornelius, Lynch, and Gore
given the limited pool of resources, priority is given towards actively advancing the life stage of criminals and to those individuals who can pull criminals into the next life stage through their interactions.
As an additional form of validation we explore those simulation parameterizations that yield an increase in the number of criminals after 100 time steps using exploration techniques based on statistical debugging described in Gore et al. (2015), Diallo et al. (2016), and Gore, Lynch, and Havak (2016). In each parameterization that increases the number of criminals in our extended model, the life stage where the maximum number of resources is spent is never: (a) criminals, or (b) Life Stage 1. These results also make sense. Keeping resources away from those agents that are criminals or those agents that have the highest chance of interacting with criminals creates opportunity for criminality to increase.
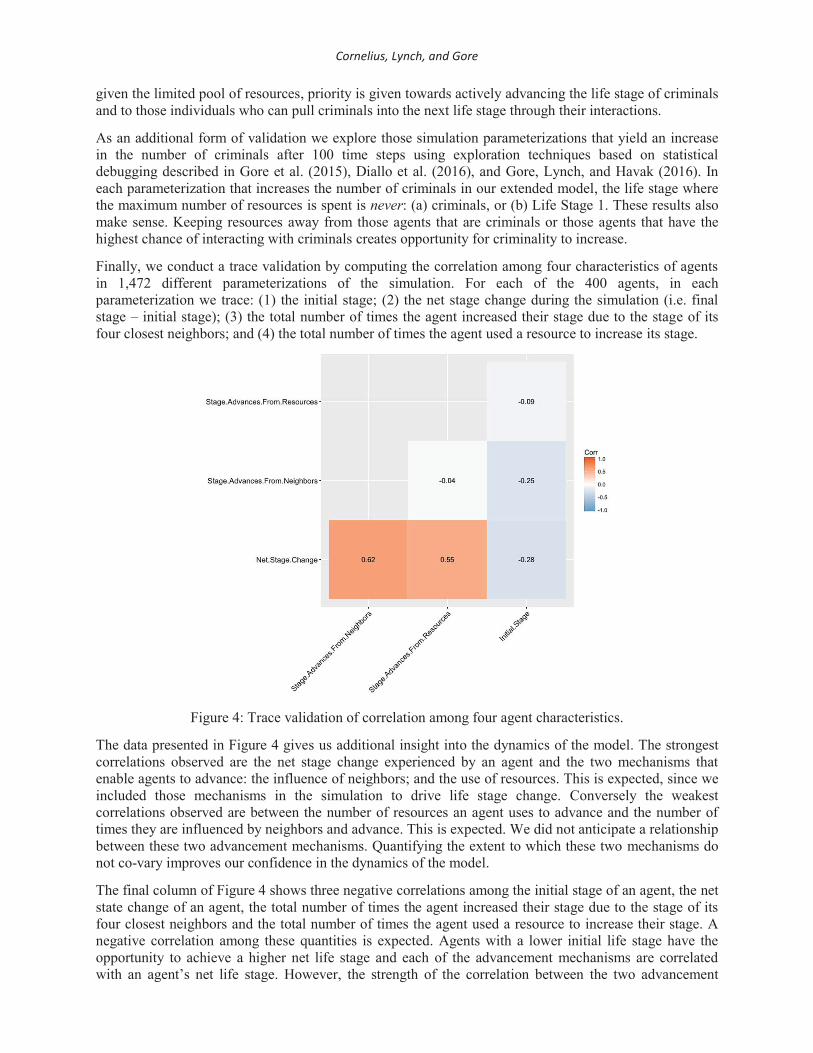
Finally, we conduct a trace validation by computing the correlation among four characteristics of agents in 1,472 different parameterizations of the simulation. For each of the 400 agents, in each parameterization we trace: (1) the initial stage; (2) the net stage change during the simulation (i.e. final stage – initial stage); (3) the total number of times the agent increased their stage due to the stage of its four closest neighbors; and (4) the total number of times the agent used a resource to increase its stage.
Figure 4: Trace validation of correlation among four agent characteristics.
The data presented in Figure 4 gives us additional insight into the dynamics of the model. The strongest correlations observed are the net stage change experienced by an agent and the two mechanisms that enable agents to advance: the influence of neighbors; and the use of resources. This is expected, since we included those mechanisms in the simulation to drive life stage change. Conversely the weakest correlations observed are between the number of resources an agent uses to advance and the number of times they are influenced by neighbors and advance. This is expected. We did not anticipate a relationship between these two advancement mechanisms. Quantifying the extent to which these two mechanisms do not co-vary improves our confidence in the dynamics of the model.
The final column of Figure 4 shows three negative correlations among the initial stage of an agent, the net state change of an agent, the total number of times the agent increased their stage due to the stage of its four closest neighbors and the total number of times the agent used a resource to increase their stage. A negative correlation among these quantities is expected. Agents with a lower initial life stage have the opportunity to achieve a higher net life stage and each of the advancement mechanisms are correlated with an agent’s net life stage. However, the strength of the correlation between the two advancement

Cornelius, Lynch, and Gore
mechanisms in our model (resources and neighbors) and an agent’s initial stage are not similar. The correlation between an agent’s initial stage and their use of resources is -0.09 while the correlation between an agent’s initial stage and their use of neighbors as an advancement mechanism is -0.25.
This disparity reflects a key difference in the two advancement mechanisms within the model. Recall, resources are finite, once a resource is consumed it is removed from the model. However, there is not a similar constraint on the number of times a neighboring agent can influence another agent to advance. Initially, the landscape contains resources and neighboring agents as mechanisms for life stage advancement. However, as time passes, resources at many stages are completely consumed. At this point the influence of neighboring agents is the only means for an agent to advance their life stage. As a result, this mechanism is a slightly stronger driver of overall net life stage change for agents than resources.
6 DISCUSSION AND CONCLUSIONS
This work has illustrated the potential future role that ABM can play in the shaping of crime related policy. The model’s demonstration of the aging out of crime over the life course of an individual is valuable as are the implications of the connection between the allocation of resources and crime.
In its most simplistic explanation, the model demonstrates three optimal goals for our represented splice of society; reduce criminality, allocate the resources in a fair and effective manner, and allow the agents to advance along the life stages. While no single solution maximized all three objectives, our findings elucidate the best possible solutions to meet these objectives and the tradeoffs that exist among them.
Working with the real-life assumption that different social stimulus programs are available at different life stages, we attempted to understand how the allocation of resources to different life stages impacts criminality over the life course. For example, it could be assumed that Stage 1, representing younger high school graduates, could have mentorship or college scholarship programs available that would require funding to operate; likewise, various programs making continued education in the workforce, home ownership and general personal purchasing power at the various life stages possible, which would also require funding to operate, and could help the agent advance amongst the stages.
We found that there were no scenarios in which allocating the majority of the resources to stage 6 results in a criminal free population. Allocating resources to the top levels of society where further advancement is not possible, is also not an effective way to reduce criminality. This makes sense as removing resources from those engaging in criminal activity and those who are most likely to encounter criminals would only encourage further criminal behavior as a means for survival. In terms of policy implications, policy makers should gear the allocation of resources to those life stages that have the biggest impact in the overall levels of crime. For example, the least expenditure of resources resulting in the biggest decrease in criminality involved allocating a quarter of the resources to Stage 1; this serves to essentially help jump start those early in their life stages into active and contributing participation in society. If a policy maker was comfortable utilizing all available resources, directing a heavy disbursement to Stage 4 is optimal.
As this is the first attempt at modeling age and crime and the connection it has to the allocation of resources within a society, future research is still needed. Conceptually, moving forward, the specific types of programs available at life stages needs to be further explored, as does the specific type of resources being allocated (i.e. cash funds, manpower hours, technology). Further, there is a regional or geographic element to the model that needs to be explored in the future. Questions here include how do different neighborhoods interact, how does differences in rural or urban areas effect the allocation of resources and resulting levels of criminality, how does the allocation of resources in one geographic area (neighborhood) effect the resulting criminality across the entire region?
REFERENCESAgnew, R. 1992. “Foundation for a General Strain Theory of Crime and Delinquency.” Criminology 30,
pp. 47-87.
Cornelius, Lynch, and Gore
Balci, O. 1998. “Verification, Validation and Testing.” Handbook of Simulation, Chapter 10, pp. 335-393. Bonabeau, E. 2002. “Agent-based Modeling: Methods and Techniques for Simulating Human Systems”.
Proceedings of the National Academy of Sciences 99(suppl 3), pp. 7280-7287. Braithwaite, J. 1989. “Crime, Shame and Reintegration.” Cambridge University Press: Cambridge, MA. Courdier, R., Guerrin, F., Andriamasinoro, F. H., and Paillat, J. M. 2002. “Agent-based Simulation of
Complex Systems: Application to Collective Management of Animal Wastes.” Journal of Artificial Societies and Social Simulation 5(3), pp. 1-17.
Devia, N., and Weber, R. 2013. “Generating Crime Data Using Agent-Based Simulation.” Computers, Environment and Urban Systems 42, pp. 26-41.
Diallo, S.Y., Gore, R., Lynch, C.J., and Padilla, J.J., 2016. “Formal Methods, Statistical Debugging and Exploratory Analysis in Support of System Development: Towards a Verification and Validation Calculator Tool”. International Journal of Modeling, Simulation, and Scientific Computing 7(1), pp. 1-22, doi: 10.1142/S1793962316410014.
Epsein, J. M. 2002. “Modeling Civil Violence: An Agent Based Computational Approach.” Proceedings of the National Academy of Sciences of the United States of America 99(3), pp. 7243-7250.
Epstein, J. M., and Axtell, R. 1996. Growing Artificial Societies: Social Science from the Bottom Up. Washington, D. C.: Brookings Institution Press.
Farrington, D. P. 1986. “Age and Crime”. Crime and Justice 7, pp. 189-250. Gilbert, N. 2008. Agent-based Models. Thousand Oaks, CA: SAGE Publications. Gilbert, N., and Terna, P. 2000. “How to Build and Use Agent-Based Models in Social Science”. Mind &
Society 1(1), pp. 57-72. Gore, R., and Diallo, S. 2013. “The Need for Usable Formal Methods in Verification and Validation.” In
Proceedings of the 2013 Winter Simulation Conference, edited by R. Pasupathy, S.-H. Kim, A. Tolk, R. Hill, and M. E. Kuhl, pp. 1257-1268. IEEE Press.
Gore, R., Lynch, C. J., and Kavak, H. 2016. “Applying Statistical Debugging for Enhanced Trace Validation of Agent-based Models”. SIMULATION: Transactions of the Society for Modeling and Simulation International, pp. 1-12, doi: 10.1177/0037549716659707. Special Issue of SIMULATION: Modeling and Simulation in the Era of Big Data and Cloud Computing: Theory, Framework, and Tools.
Gore, R., Reynolds Jr, P. F., Kamensky, D., Diallo, S., and Padilla, J. 2015. “Statistical Debugging for Simulations.” ACM Transactions on Modeling and Computer Simulation (TOMACS) 25(3), pp. 1-26.
Groff, E. H. 2007. “‘Situating’ Simulation to Model Human Spatio-Temporal Interactions: An Example Using Crime Events.” Transactions in GIS 11(4), pp. 507-530.
Hirschi, T. 1969. Causes of Delinquency. Berkley, CA: University of California Press. Hirschi, T., and Gottfredson, M. 1983. “Age and the Explanation of Crime.” American Journal of
Sociology 90, pp.1330-33. Lim, M., Metzler, R., and Bar-Yam, Y. 2007. “Global Pattern Formation and Ethnic/Cultural Violence”.
Science 317(5844), pp. 1540-1544. Lynch, C. J., and Diallo, S. Y. 2015. “A Taxonomy for Classifying Terminologies that Describe
Simulations with Multiple Models.” In Proceedings of the 2015 Winter Simulation Conference, edited by L. Yilmaz, W. Chan, I. Moon, T. Roeder, C. Macal, and M. Rossetti, pp. 1621-1632. Piscataway, NJ: IEEE Press.
Malleson, N, and Birkin, M. 2012. “Analysis of Crime Patterns Through the Integration of an Agent-Based Model and a Population Microsimulation”. Computers, Environment and Urban Systems 36(6), pp. 551-561.
Malleson, N., Heppenstall, A., and See, L. 2010. “Crime Reduction Through Simulation: An Agent Based Model of Burglary”. Computers, Environment and Urban Systems 34, pp. 236-250.

Cornelius, Lynch, and Gore
Malleson, N., Happenstall, A., See, L., and Evans, A. 2013. “Using Agent-Based Crime Simulation to Predict the Effects of Urban Regeneration on Individual Household Burglary Risk.” Environment and Planning B: Urban Analytics and City Science 40(3), pp. 405-426.
Marler, R. T., and Arora, J. S. 2004. “Survey of Multi-objective Optimization Methods for Engineering.” Structural and multidisciplinary optimization 26, pp. 369-395.
Messner, S. F., and Rosenfeld, R. 2007. Crime and the American Dream. Belmont, CA: Thomas Higher Education.
Moffitt, T. E. 1993. “‘Life-Course Persistent’ and ‘Adolescence-Limited’ Antisocial Behavior: A Developmental Taxonomy. Psychological Review 100, pp. 674-701.
North, M. J., and Macal, C. M. 2007. Managing Business Complexity: Discovering Strategic Solutions with Agent-based Modeling and Simulation. Oxford University Press.
Piquero, A. R., Farrington, D. P., and Blumstein, A. 2003. “The Criminal Career Paradigm.” pp. 359-506 in Crime and Justice: A review of the Research Vol. 30, edited by Michael Tonry. University of Chicago Press: Chicago IL.
Sampson, R. J., and Laub, J. H. 2003. “Life-Course Desisters? Trajectories of Crime Among Delinquent Boys Followed to Age 70.” Criminology 41, pp. 555-592.
Sargent, R. G. 2013. “Verification and Validation of Simulation Models.” Journal of Simulation 7(1), pp. 12-24.
Sutherland, E. H. 1947. Principles of Criminology. Philadelphia, PA: Lippincott Press. Shulman, E. P., Steinberg, L. D., and Piquero, A. R. 2013. “The Age-Crime Curve in Adolescence and
Early Adulthood in Not Due to Age Difference in Economic Status.” Journal of Youth Adolescence 42, pp. 848-860.
Takadama, K., Kawai, T., and Koyama, Y. 2008. “Micro-and Macro-level Validation in Agent-based Simulation: Reproduction of Human-like Behaviors and Thinking in a Sequential Bargaining Game.” Journal of Artificial Societies and Social Simulation 11(2), pp. 1-17.
Vernon-Bido, D., Collins, A., and Sokolowski, J. 2015. “Effective Visualization in Modeling & Simulation.” In Proceedings of the 48th Spring Simulation Multi-Conference - Annual Simulation Symposium, pp. 33-40. San Diego, CA: Society for Computer Simulation International.
AUTHOR BIOGRAPHIES
CAITLIN V. M. CORNELIUS is a Post-Doctorate Research Associate at the Virginia Modeling, Analysis and Simulation Center. She holds a PhD in Criminology from Old Dominion University, a MA in Criminal Justice from the University of Toledo and a BA in Political Science from Salisbury University. Her research interests include crimes within the military community, and crimes of violence against women and children. Her email address is [email protected].
CHRISTOPHER J. LYNCH is a Senior Project Scientist at the Virginia Modeling, Analysis and Simulation Center. He is currently pursuing a Ph.D. in M&S from ODU where he also received his MS in M&S in 2012 and a BS in Electrical Engineering in 2011. His research interests include multi-paradigm modeling, conceptual modeling, and verification of simulation models. His email address is [email protected].
ROSS GORE is a Research Assistant Professor at the Virginia Modeling, Analysis and Simulation Center. He holds a Ph.D. and a MS in computer science from the University of Virginia and a bachelor’s degree in computer science from the University of Richmond. His email address is [email protected].