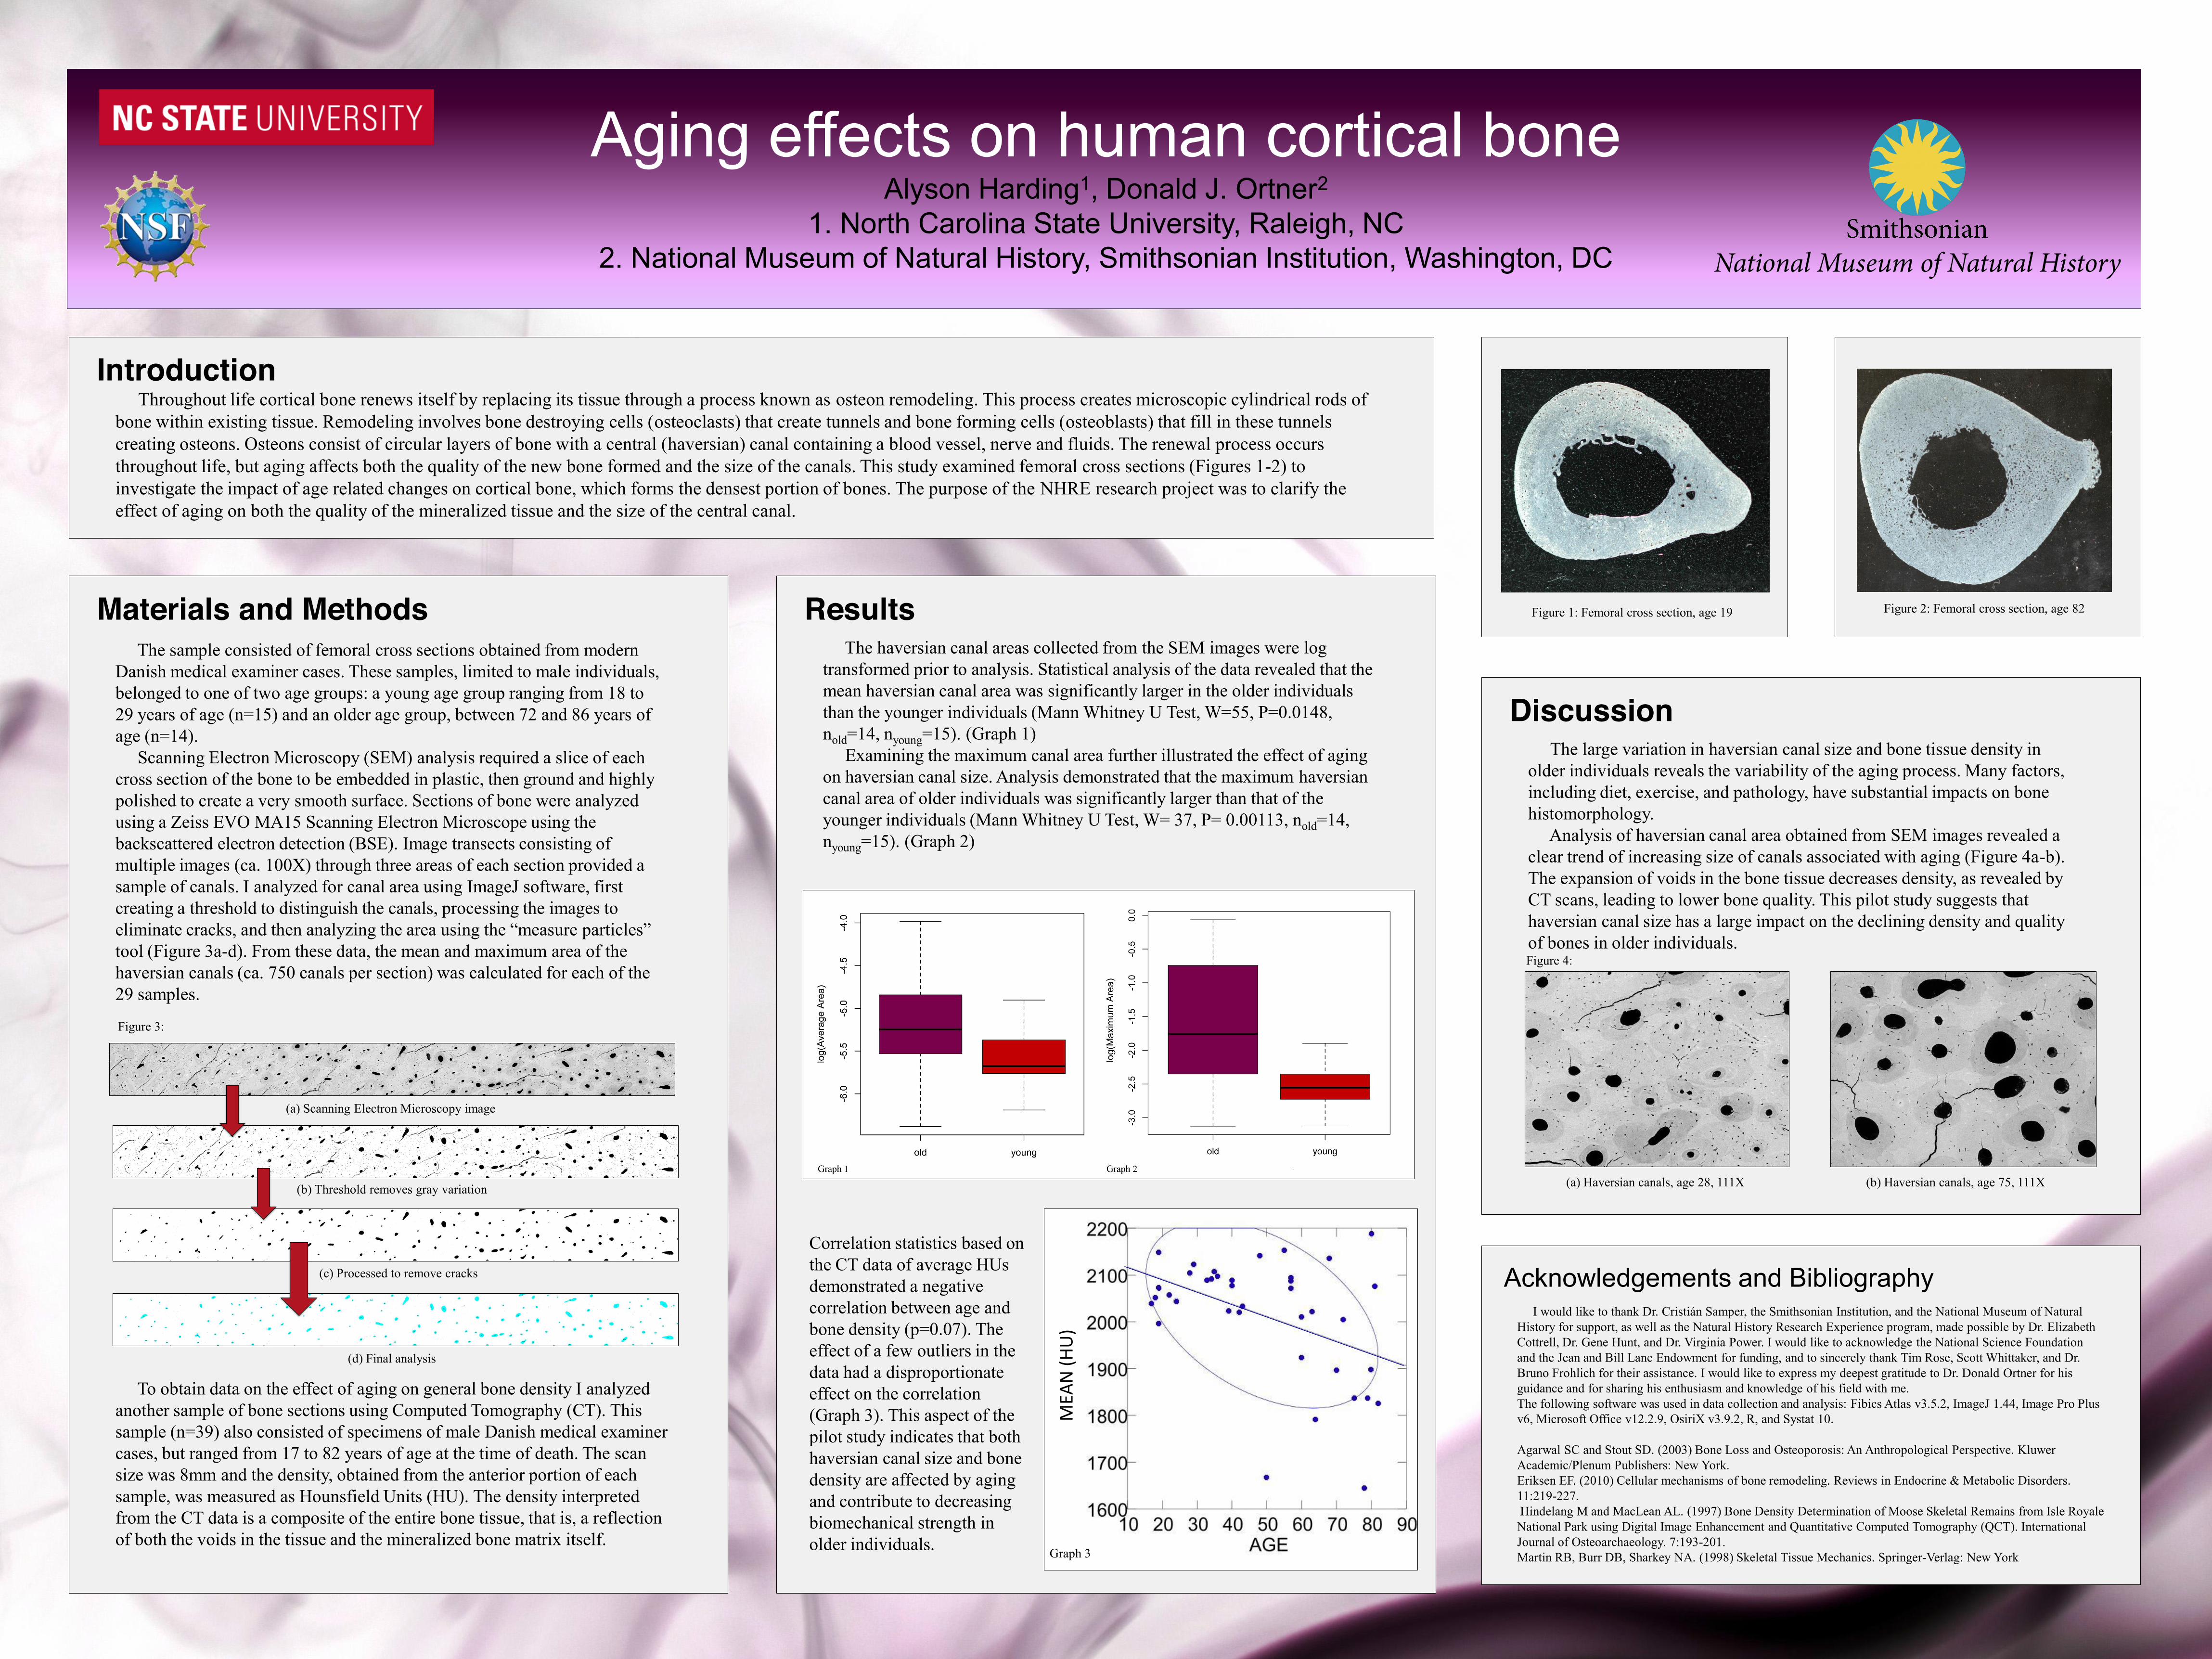
aging effects on human cortical bone

1
Aging effects on human cortical bone Alyson Harding 1 , Donald J. Ortner 2 1. North Carolina State University, Raleigh, NC 2. National Museum of Natural History, Smithsonian Institution, Washington, DC Figure 1: Femoral cross section, age 19 Figure 2: Femoral cross section, age 82 Throughout life cortical bone renews itself by replacing its tissue through a process known as osteon remodeling. This process creates microscopic cylindrical rods of bone within existing tissue. Remodeling involves bone destroying cells (osteoclasts) that create tunnels and bone forming cells (osteoblasts) that fill in these tunnels creating osteons. Osteons consist of circular layers of bone with a central (haversian) canal containing a blood vessel, nerve and fluids. The renewal process occurs throughout life, but aging affects both the quality of the new bone formed and the size of the canals. This study examined femoral cross sections (Figures 1-2) to investigate the impact of age related changes on cortical bone, which forms the densest portion of bones. The purpose of the NHRE research project was to clarify the effect of aging on both the quality of the mineralized tissue and the size of the central canal. Introduction I would like to thank Dr. Cristián Samper, the Smithsonian Institution, and the National Museum of Natural History for support, as well as the Natural History Research Experience program, made possible by Dr. Elizabeth Cottrell, Dr. Gene Hunt, and Dr. Virginia Power. I would like to acknowledge the National Science Foundation and the Jean and Bill Lane Endowment for funding, and to sincerely thank Tim Rose, Scott Whittaker, and Dr. Bruno Frohlich for their assistance. I would like to express my deepest gratitude to Dr. Donald Ortner for his guidance and for sharing his enthusiasm and knowledge of his field with me. The following software was used in data collection and analysis: Fibics Atlas v3.5.2, ImageJ 1.44, Image Pro Plus v6, Microsoft Office v12.2.9, OsiriX v3.9.2, R, and Systat 10. Agarwal SC and Stout SD. (2003) Bone Loss and Osteoporosis: An Anthropological Perspective. Kluwer Academic/Plenum Publishers: New York. Eriksen EF. (2010) Cellular mechanisms of bone remodeling. Reviews in Endocrine & Metabolic Disorders. 11:219-227. Hindelang M and MacLean AL. (1997) Bone Density Determination of Moose Skeletal Remains from Isle Royale National Park using Digital Image Enhancement and Quantitative Computed Tomography (QCT). International Journal of Osteoarchaeology. 7:193-201. Martin RB, Burr DB, Sharkey NA. (1998) Skeletal Tissue Mechanics. Springer-Verlag: New York Acknowledgements and Bibliography Discussion The large variation in haversian canal size and bone tissue density in older individuals reveals the variability of the aging process. Many factors, including diet, exercise, and pathology, have substantial impacts on bone histomorphology. Analysis of haversian canal area obtained from SEM images revealed a clear trend of increasing size of canals associated with aging (Figure 4a-b). The expansion of voids in the bone tissue decreases density, as revealed by CT scans, leading to lower bone quality. This pilot study suggests that haversian canal size has a large impact on the declining density and quality of bones in older individuals. Figure 4: (b) Haversian canals, age 75, 111X (a) Haversian canals, age 28, 111X The sample consisted of femoral cross sections obtained from modern Danish medical examiner cases. These samples, limited to male individuals, belonged to one of two age groups: a young age group ranging from 18 to 29 years of age (n=15) and an older age group, between 72 and 86 years of age (n=14). Scanning Electron Microscopy (SEM) analysis required a slice of each cross section of the bone to be embedded in plastic, then ground and highly polished to create a very smooth surface. Sections of bone were analyzed using a Zeiss EVO MA15 Scanning Electron Microscope using the backscattered electron detection (BSE). Image transects consisting of multiple images (ca. 100X) through three areas of each section provided a sample of canals. I analyzed for canal area using ImageJ software, first creating a threshold to distinguish the canals, processing the images to eliminate cracks, and then analyzing the area using the “measure particles” tool (Figure 3a-d). From these data, the mean and maximum area of the haversian canals (ca. 750 canals per section) was calculated for each of the 29 samples. To obtain data on the effect of aging on general bone density I analyzed another sample of bone sections using Computed Tomography (CT). This sample (n=39) also consisted of specimens of male Danish medical examiner cases, but ranged from 17 to 82 years of age at the time of death. The scan size was 8mm and the density, obtained from the anterior portion of each sample, was measured as Hounsfield Units (HU). The density interpreted from the CT data is a composite of the entire bone tissue, that is, a reflection of both the voids in the tissue and the mineralized bone matrix itself. (a) Scanning Electron Microscopy image (b) Threshold removes gray variation (c) Processed to remove cracks (d) Final analysis Figure 3: Materials and Methods The haversian canal areas collected from the SEM images were log transformed prior to analysis. Statistical analysis of the data revealed that the mean haversian canal area was significantly larger in the older individuals than the younger individuals (Mann Whitney U Test, W=55, P=0.0148, n old =14, n young =15). (Graph 1) Examining the maximum canal area further illustrated the effect of aging on haversian canal size. Analysis demonstrated that the maximum haversian canal area of older individuals was significantly larger than that of the younger individuals (Mann Whitney U Test, W= 37, P= 0.00113, n old =14, n young =15). (Graph 2) Correlation statistics based on the CT data of average HUs demonstrated a negative correlation between age and bone density (p=0.07). The effect of a few outliers in the data had a disproportionate effect on the correlation (Graph 3). This aspect of the pilot study indicates that both haversian canal size and bone density are affected by aging and contribute to decreasing biomechanical strength in older individuals. Results Graph 3 MEAN (HU)

Upload: others

Post on 26-Nov-2021

3 views

Category:

Documents


0 download

TRANSCRIPT

Graph 1 Graph 2

Aging effects on human cortical boneAlyson Harding1, Donald J. Ortner2

1. North Carolina State University, Raleigh, NC2. National Museum of Natural History, Smithsonian Institution, Washington, DC

Figure 1: Femoral cross section, age 19 Figure 2: Femoral cross section, age 82

Throughout life cortical bone renews itself by replacing its tissue through a process known as osteon remodeling. This process creates microscopic cylindrical rods of bone within existing tissue. Remodeling involves bone destroying cells (osteoclasts) that create tunnels and bone forming cells (osteoblasts) that fill in these tunnels creating osteons. Osteons consist of circular layers of bone with a central (haversian) canal containing a blood vessel, nerve and fluids. The renewal process occurs throughout life, but aging affects both the quality of the new bone formed and the size of the canals. This study examined femoral cross sections (Figures 1-2) to investigate the impact of age related changes on cortical bone, which forms the densest portion of bones. The purpose of the NHRE research project was to clarify the effect of aging on both the quality of the mineralized tissue and the size of the central canal.

Introduction

I would like to thank Dr. Cristián Samper, the Smithsonian Institution, and the National Museum of Natural History for support, as well as the Natural History Research Experience program, made possible by Dr. Elizabeth Cottrell, Dr. Gene Hunt, and Dr. Virginia Power. I would like to acknowledge the National Science Foundation and the Jean and Bill Lane Endowment for funding, and to sincerely thank Tim Rose, Scott Whittaker, and Dr. Bruno Frohlich for their assistance. I would like to express my deepest gratitude to Dr. Donald Ortner for his guidance and for sharing his enthusiasm and knowledge of his field with me.The following software was used in data collection and analysis: Fibics Atlas v3.5.2, ImageJ 1.44, Image Pro Plus v6, Microsoft Office v12.2.9, OsiriX v3.9.2, R, and Systat 10.

Agarwal SC and Stout SD. (2003) Bone Loss and Osteoporosis: An Anthropological Perspective. KluwerAcademic/Plenum Publishers: New York. Eriksen EF. (2010) Cellular mechanisms of bone remodeling. Reviews in Endocrine & Metabolic Disorders. 11:219-227.Hindelang M and MacLean AL. (1997) Bone Density Determination of Moose Skeletal Remains from Isle Royale National Park using Digital Image Enhancement and Quantitative Computed Tomography (QCT). International Journal of Osteoarchaeology. 7:193-201.Martin RB, Burr DB, Sharkey NA. (1998) Skeletal Tissue Mechanics. Springer-Verlag: New York

Acknowledgements and Bibliography

DiscussionThe large variation in haversian canal size and bone tissue density in

older individuals reveals the variability of the aging process. Many factors, including diet, exercise, and pathology, have substantial impacts on bone histomorphology.

Analysis of haversian canal area obtained from SEM images revealed a clear trend of increasing size of canals associated with aging (Figure 4a-b). The expansion of voids in the bone tissue decreases density, as revealed by CT scans, leading to lower bone quality. This pilot study suggests that haversian canal size has a large impact on the declining density and quality of bones in older individuals. Figure 4:

(b) Haversian canals, age 75, 111X(a) Haversian canals, age 28, 111X

The sample consisted of femoral cross sections obtained from modern Danish medical examiner cases. These samples, limited to male individuals, belonged to one of two age groups: a young age group ranging from 18 to 29 years of age (n=15) and an older age group, between 72 and 86 years of age (n=14).

Scanning Electron Microscopy (SEM) analysis required a slice of each cross section of the bone to be embedded in plastic, then ground and highly polished to create a very smooth surface. Sections of bone were analyzed using a Zeiss EVO MA15 Scanning Electron Microscope using the backscattered electron detection (BSE). Image transects consisting of multiple images (ca. 100X) through three areas of each section provided a sample of canals. I analyzed for canal area using ImageJ software, first creating a threshold to distinguish the canals, processing the images to eliminate  cracks,  and  then  analyzing  the  area  using  the  “measure  particles”  tool (Figure 3a-d). From these data, the mean and maximum area of the haversian canals (ca. 750 canals per section) was calculated for each of the 29 samples.

To obtain data on the effect of aging on general bone density I analyzed another sample of bone sections using Computed Tomography (CT). This sample (n=39) also consisted of specimens of male Danish medical examiner cases, but ranged from 17 to 82 years of age at the time of death. The scan size was 8mm and the density, obtained from the anterior portion of each sample, was measured as Hounsfield Units (HU). The density interpreted from the CT data is a composite of the entire bone tissue, that is, a reflection of both the voids in the tissue and the mineralized bone matrix itself.

(a) Scanning Electron Microscopy image

(b) Threshold removes gray variation

(c) Processed to remove cracks

(d) Final analysis

Figure 3:

Materials and MethodsThe haversian canal areas collected from the SEM images were log

transformed prior to analysis. Statistical analysis of the data revealed that the mean haversian canal area was significantly larger in the older individuals than the younger individuals (Mann Whitney U Test, W=55, P=0.0148, nold=14, nyoung=15). (Graph 1)

Examining the maximum canal area further illustrated the effect of aging on haversian canal size. Analysis demonstrated that the maximum haversiancanal area of older individuals was significantly larger than that of the younger individuals (Mann Whitney U Test, W= 37, P= 0.00113, nold=14, nyoung=15). (Graph 2)

Correlation statistics based on the CT data of average HUs demonstrated a negative correlation between age and bone density (p=0.07). The effect of a few outliers in the data had a disproportionate effect on the correlation (Graph 3). This aspect of the pilot study indicates that both haversian canal size and bone density are affected by aging and contribute to decreasing biomechanical strength in older individuals.

Results

Graph 3

MEA

N (H

U)