aging and disability: implications for the housing … and disability: implications for the housing...
TRANSCRIPT
Aging and Disability: Implications for the Housing Industry
and Public Policy in the United States
Stanley K. Smith, University of Florida Stefan Rayer, University of Florida Eleanor A. Smith, Concrete Change
Paper presented at the annual meeting of the Southern Demographic Association, Birmingham, October 11-13 2007

2
ABSTRACT The elderly population of the United States is large and growing rapidly. In 2000 there were 35 million persons age 65+, comprising 12% of the total population. By 2050 this population is projected to exceed 86 million, almost 21% of the total. Since disability rates increase with age, the aging of the population will bring substantial increases in the number of disabled persons and have a significant impact on the demand for housing. In this paper, we collect information on physical disabilities, particularly as they relate to mobility limitations. We analyze trends in disability rates over time and apply projected rates by age and sex to projections of the U.S. population to produce projections of the number of disabled persons. We follow a similar procedure to produce projections of the number of households with at least one disabled resident and develop an estimate of the probability that a newly built single-family detached unit will house at least one disabled resident during its lifetime. We extend the analysis to include the impact of “visitability,” or the ability of a disabled person to visit the homes of friends and relatives without difficulty. We close with a discussion of the implications of the rapidly rising number of disabled persons for the housing industry and for public policy in the United States.
3
Introduction
The elderly population of the United States is large and growing rapidly. In 2000 there
were 35 million persons age 65+, comprising 12% of the total population. This
population is projected to exceed 86 million by 2050, almost 21% of the total population
(U.S. Census Bureau, 2004). The oldest portion of the elderly population is growing
particularly rapidly, as the population age 85+ is projected to grow more than fivefold
between 2000 and 2050, from 4 million to 21 million. Since disability rates rise with
age—with the largest increases occurring at the oldest ages—the aging of the population
will bring large increases in the number of disabled persons. Both of these changes have
major implications for the housing industry and for public policy.
In this paper, we analyze the links connecting aging, disability, and housing in the
United States. We have three primary objectives: 1) Produce projections of the number
of disabled persons and the number of households with at least one disabled resident; 2)
Develop an estimate of the probability that a newly built single-family (SF) detached unit
will house at least one disabled resident during its expected lifetime; and 3) Consider
some of the implications of the growing number of disabled persons for the housing
industry and for public policy in the United States.
To our knowledge, this is the first study to project the number of households with
a disabled resident and the first to view the prevalence of disabilities from the perspective
of a housing unit rather than an individual. We believe both of these innovations are
essential for estimating the impact of aging and disability on the demand for housing and
the formation of public policy. Although our focus is on the United States, we believe
many of our findings are relevant to other countries as well.
4
We start by discussing several different measures of disability, particularly as they
relate to mobility impairments. Our focus is on physical disabilities that limit a person’s
ability to enter, leave, or get around effectively at home, and for whom accessibility
features such as ramps, handrails, and wider doorways might allow a person to live a
longer time in that home than would otherwise be possible.
We collect data on several disability measures and analyze trends in disability
rates over time. Based on this information and projections of the U.S. population by age
and sex, we develop projections of the number of disabled persons from 2000 to 2050.
We follow a similar procedure to develop projections of the number of households (i.e.,
occupied housing units) with at least one disabled resident over the same time period.
Changes in the number of households with disabled residents have a substantial impact
on the demand for accessibility features.
Population and household projections provide useful information regarding the
potential market for accessible housing, but do not tell the whole story because housing
units typically last for many years and are occupied by a number of different households
over time. To deal with this issue, we collect information on the average lifespan of a SF
detached unit and estimate the average length of residence for households occupying SF
detached units. We focus on SF detached units because they constitute the majority of
housing units in the United States and—in contrast to multifamily units—are seldom
covered by federal accessibility legislation. Using this information, we develop an
estimate of the probability that a newly built SF detached unit will have at least one
disabled resident during its expected lifetime. We extend the analysis to include the
5
concept of “visitability,” or the ability of a disabled person to visit the home of a friend or
relative without undue difficulty.
We conclude that there is a substantial probability that a newly built SF detached
unit will house at least one disabled resident during its expected lifetime. Given the
aging of the U.S. population and the desire of most older people to remain in their current
home for as long as possible (e.g., Kochera et al., 2005; Lawler, 2001), we believe there
is a large and growing demand for structural features that make housing units accessible
and livable for occupants with disabilities. When the probability of having visitors with
disabilities is factored in, the demand for such features is even greater. The high cost of
institutionalization—both for individuals and for society as a whole—creates a strong
economic incentive to incorporate home accessibility features as well. We believe rapid
growth in the number of disabled persons will present formidable challenges to the
housing industry and to the formation of public policy in the United States over the next
several decades, but will present significant opportunities as well.
Disability Measures and Trends
Measures. A disability can be defined as “a physical or mental impairment that
substantially limits one or more major life activities” (Steinmetz, 2006). Although the
concept is clear, there is no single, standard way to measure the prevalence of disabilities
within a population. Measures are often based on Activities of Daily Living (ADLs),
which include activities such as bathing, dressing, eating, getting out of a chair or bed,
walking across a room, and using the toilet (e.g., Freedman et al., 2004; Lakdawalla et
al., 2003; Manton and Gu, 2001). Other measures—reflecting somewhat less-severe
6
disabilities—are based on Instrumental Activities of Daily Living (IADLs), such as doing
housework, preparing meals, shopping for groceries, taking medications, managing
money, and using the telephone (e.g., Crimmins and Saito, 2000; Spillman, 2004;
Waidmann and Liu, 2000).
Data on ADLs and IADLs have been collected through a number of surveys in
recent decades. Even when data are drawn from the same sample, however, measures of
disability can differ from each other because of differences in the specific activities
included; the way disability is defined (e.g., having difficulty performing an activity vs.
being unable to perform that activity without help); the threshold level chosen (e.g.,
difficulty performing at least one activity vs. difficulty performing two or more
activities); and the time period covered (e.g., difficulty now vs. difficulty for at least three
months).
In this paper, we develop four disability measures based on the ability to perform
daily activities, two related to individuals and two to households. All are designed to
focus on mobility limitations and are constructed using data from the 5% Public Use
Microdata Sample (PUMS) file from Census 2000.
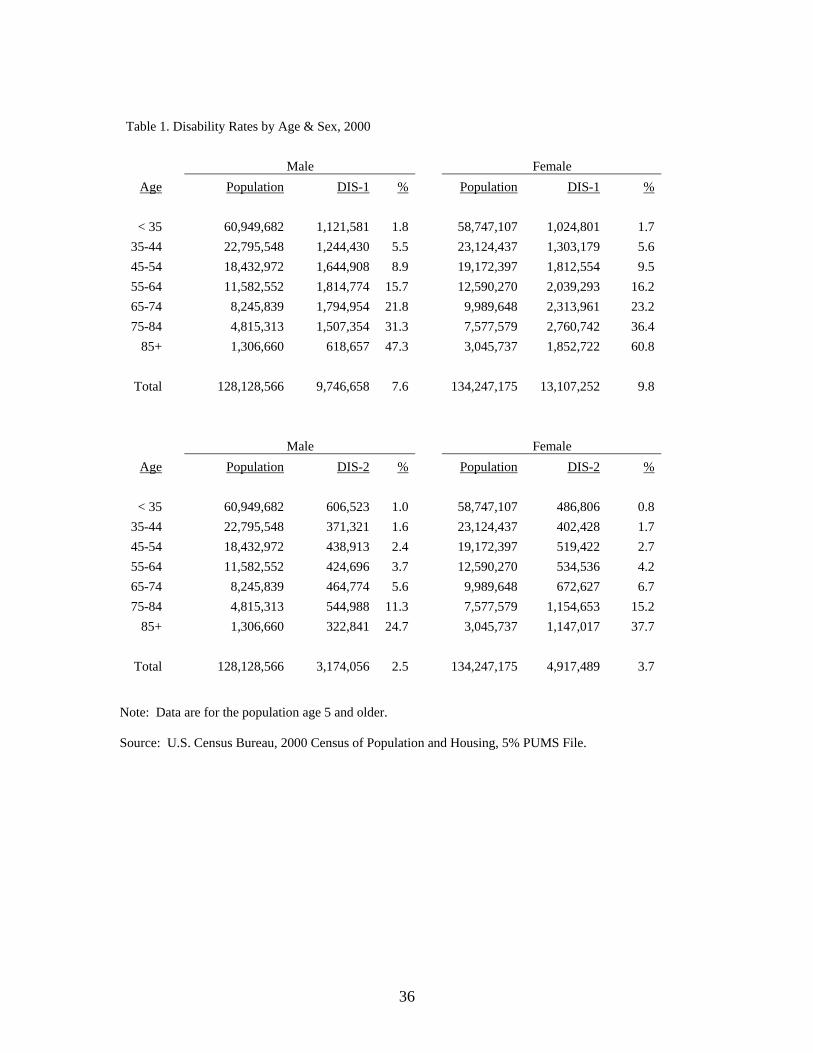
The first two measures refer to individuals. One (DIS-1) is based on whether the
respondent has a long-lasting condition that substantially limits one or more physical
activities such as walking, climbing stairs, reaching, lifting, or carrying. The other (DIS-
2) is based on whether the respondent has a condition lasting six months or more that
makes it difficult to dress, bathe, or get around inside the home. For both measures,
disability rates are calculated for each age-sex group by dividing the number of persons
with a disability by the number of persons in the group (see Table 1). It should be noted

7
that these rates include persons living in institutions as well as those living in households,
thereby covering the entire population.
(Table 1 about here)
Both measures show disability rates to increase rapidly with age. This nearly
universal pattern has been reported frequently in the literature (e.g., Bhattacharya et al.,
2004; Kaye et al., 2000; Steinmetz, 2006). Also, both measures show slightly lower rates
for females than males in the youngest group but higher rates for females in all older
groups, with the differences becoming larger as age increases. Similar patterns have
been noted before (e.g., Kaye et al., 2000; Steinmetz, 2006). Rates for DIS-1 are
substantially higher than for DIS-2, indicating that DIS-1 reflects less severe disabilities
than DIS-2.
How do these rates compare with other disability measures? The rates for DIS-1
are similar to rates measuring severe disabilities published in a recent Census Bureau
report, while the rates for DIS-2 are similar to rates measuring the need for personal
assistance (Steinmetz, 2006). Also, the rates for DIS-2 are similar to those reported for
users of mobility devices such as wheelchairs, scooters, walkers, canes, or crutches (Kaye
et al., 2000). We interpret DIS-1 as measuring both moderate and severe mobility
limitations and DIS-2 as measuring only the most severe mobility limitations. We
believe these measures provide reasonable alternative estimates of the population for
whom housing accessibility features might be beneficial.
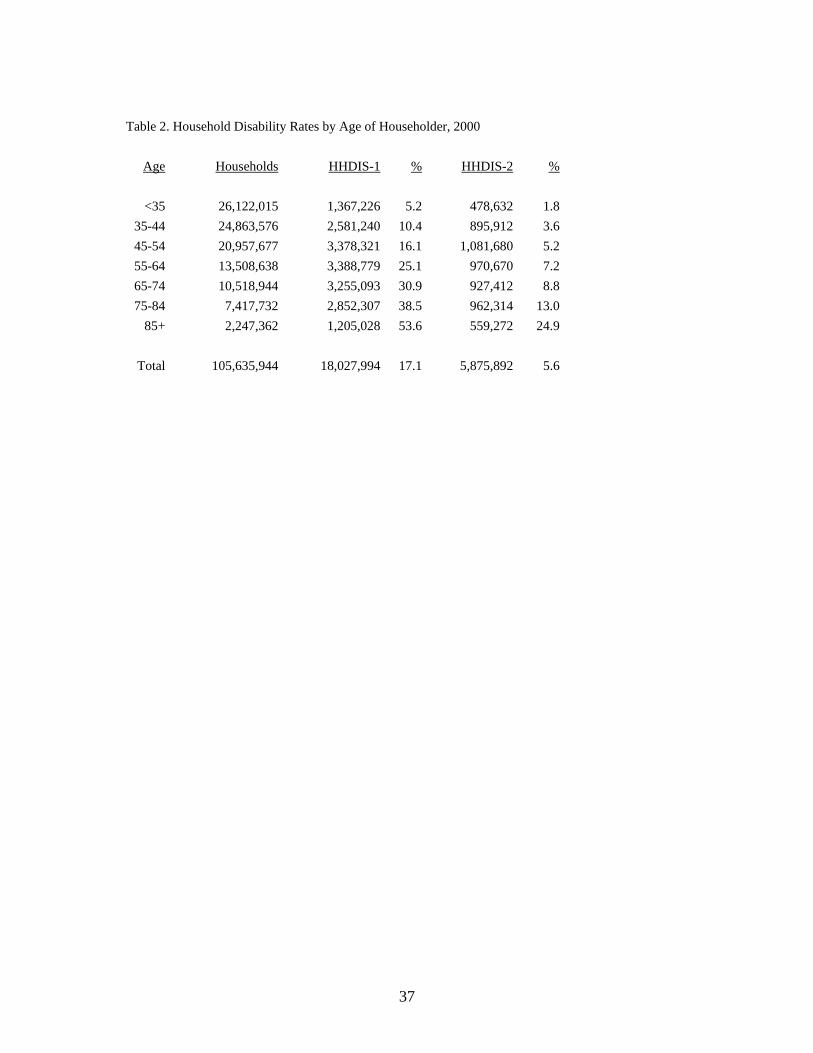
The second two measures refer to households. One (HHDIS-1) is based on
whether any resident of the household has a long-lasting condition that substantially
limits one or more physical activities such as walking, climbing stairs, reaching, lifting,
8
or carrying. The other (HHDIS-2) is based on whether any resident of the household has
a condition lasting six months or more that makes it difficult to dress, bathe, or get
around inside the home. Since these rates refer solely to the household population, they
exclude the impact of persons living in institutions.
Household disability rates were calculated by dividing the number of households
with at least one disabled resident by the number of households. These rates were
calculated for each age group according to the age of the householder, but disabilities
refer to anyone in the household regardless of age. Age groups were based on
householders as defined in the ProFamy household projection model (Yi et al., 2006).
Household disability rates by age of householder are shown in Table 2.
(Table 2 about here)
Whereas DIS-1 and DIS-2 show the proportion of the population in each age-sex
group with a disability, HHDIS-1 and HHDIS-2 show the proportion of households in
each age group with at least one disabled resident. Overall, household disability rates are
roughly twice as large as individual disability rates. This is not surprising, of course,
because most households have two or more occupants. Again, rates are found to increase
rapidly with age and rates based on the first measure are substantially higher than rates
based on the second.
All four disability measures are based on a widely used approach to measuring
disability and utilize data from a well-recognized and reliable source. The measures
based on individual data are consistent with the measures based on household data yet
permit comparisons with measures discussed in other studies. Perhaps most important,
the measures based on household data can be directly related to estimates and projections
9
of the housing stock. We believe these measures provide a useful means for evaluating
the relationships connecting aging, disability, and housing.
Trends over Time. How are disability rates likely to change over the next few
decades? Before we can answer this question, it is important to consider the determinants
of disability rates and how they have changed over the last few decades.
This task is complicated by the fact that disability is a social construct determined
by an individual’s physical, mental, and emotional condition and by a variety of
environmental factors (Freedman et al., 2004). Consequently, disability rates are affected
both by a person’s underlying capacity to perform certain tasks and by the availability of
technological or human assistance. Changes in disability rates over time reflect changes
not only in the underlying physical and mental capacity of the population but also in the
adaptations and accommodations made by individuals or provided by the environment.
Numerous studies of disability trends have been published in recent years, often
focusing on the elderly population. Although they have relied on a variety of data
sources and disability measures, many have reported declines in disability rates for older
persons during the 1980s and 1990s (e.g., Cai and Lubitz, 2007; Manton and Gu, 2001;
Martin et al., 2007; Spillman, 2004; Waidmann and Liu, 2000). These declines were
often found to be large (1-2% per year) and statistically significant.
Not all studies have reported declines, however. Crimmins and Saito (2000)
found declines in disability rates for older women between 1984 and 1994, but not for
older men. They also found statistically significant increases in the prevalence of a
number of diseases over this time period (e.g., heart disease, cancer, diabetes, arthritis,
and osteoporosis). Freedman and Martin (2000) reported similar increases in the
10
prevalence of diseases. Spillman (2004) noted that much of the decline in elderly
disability rates observed during the 1980s and 1990s was confined to less severe
disabilities and that the evidence for more severe disabilities was mixed.
Studies of the younger population have not reported declining disability rates. In
fact, several have reported increasing rates. Bhattacharya et al. (2004) and Lakdawalla et
al. (2004) found increases in disability rates among younger persons from the mid-1980s
to the mid-1990s even as the older population became healthier. Kaye et al. (1996)
reported increasing disability rates for younger persons during the early 1990s. Martin et
al. (2007) reported mixed results regarding the health status of younger adults between
1982 and 2003.
There are several reasons for the mixed evidence regarding trends in disability
rates. One is simply that different studies use different populations, data sets, and
measures of disability; such differences are known to affect estimates of disability rates
and trends over time (e.g., Freedman et al., 2004; Wolf et al., 2005). A second reason is
more complex. Several analysts have reported disability rates that declined even as the
prevalence of diseases increased (e.g., Crimmins and Saito, 2000; Freedman and Martin,
2000). This occurs because the relationship between disability and health is affected by
factors such as the development of more effective diagnostic techniques, improvements
in disease management, the introduction of better assistive devices, improvements in
accessibility features, and changing perceptions of what constitutes a disability.
Declining disability rates are not necessarily an indicator of improving health.
What does all this evidence suggest regarding future trends? Pointing to the
magnitude of recent declines and to factors such as increases in educational levels, the
11
development of new biotechnologies, more aggressive public health programs, a growing
awareness of the importance of regular exercise and good nutrition, and the potential
benefits of biomedical and epidemiological research, some analysts are optimistic that
recent declines in disability rates for older persons will continue well into the future (e.g.,
Freedman and Martin, 2000; Singer and Manton, 1998; Waidmann and Lui, 2000). Such
declines would have an important impact on overall disability rates because older people
account for a disproportionately large share of the disabled population.
Others are less optimistic that rates will continue falling, either for the older
population or the population as a whole. They point out that disability rates have
increased for younger adults, a group that constitutes the majority of the population and
will become the older population of future decades (e.g., Bhattacharya et al., 2004;
Lakdawalla et al., 2004). They note that there have been substantial increases in the
prevalence of obesity—a condition associated with elevated disability rates—among both
older and younger adults (e.g., Arterburn et al., 2004; Reynolds et al., 2005).
Furthermore, the pace of educational improvement—a factor that contributed
significantly to disability declines over the last several decades—will slow in future
decades (e.g., Freedman and Martin, 1999) and the largest racial and ethnic minorities—
groups with persistently higher disability rates than non-Hispanic whites (e.g., Schoeni et
at., 2005)—will increase as a proportion of the total population (U.S. Census Bureau,
2004). Consequently, some analysts have questioned the likelihood of continuing
declines in disability rates (e.g., Bhattacharya et al., 2004; Spillman, 2004; Sturm et al.,
2004; Wang et al., 2007; Wolf et al., 2005) and others have projected that rates will
eventually rise (e.g., Lakdawalla et al., 2003).
12
We believe arguments for increasing disability rates are at least as convincing as
arguments for persistently declining rates. We also note that when there is substantial
uncertainty regarding the direction of future trends, it is generally advisable to hold rates
constant when making projections (Smith et al., 2001, p. 84). Consequently, we base our
medium projections on disability rates that remain constant at 2000 levels. We also
evaluate projections based on rates that increase or decline by 5% per decade between
2000 and 2050; we refer to these as high and low scenarios, respectively. Given the
trends in disability rates observed over the last several decades and the arguments for
rising and falling rates discussed previously, we believe these scenarios provide a
reasonable range of projections.
Projections
Our first objective is to produce projections of the number of disabled persons and the
number of households with at least one disabled resident. We do this by applying the
disability rates described above to population and household projections based on the
ProFamy projection model (Yi et al., 2006). We use these projections because they were
based on recent estimates and they cover both households and population (the U.S.
Census Bureau has not released a set of household projections since the mid-1990s). A
comparison of the ProFamy population projections with the most recent set released by
the U.S. Census Bureau (2004) showed them to be very similar, differing by only 2.3%
by 2050. The ProFamy projections were slightly lower in each projection year.
Population. Projections of total population and the number of disabled persons
are shown in Table 3. Under the medium scenario, the number of disabled persons for

13
both disability measures more than doubles between 2000 and 2050, a growth rate
substantially higher than for the population as a whole. Consequently, the proportion of
the population with disabilities increases from 8.2% in 2000 to 11.6% in 2050 for DIS-1
and from 2.9% to 4.6% for DIS-2.
(Table 3 about here)
Even under the low scenario, the number of disabled persons grows more rapidly
than the population as a whole. For DIS-1, the number of disabled persons grows by
59% between 2000 and 2050; for DIS-2, it grows by 76%. Apparently, the aging of the
population more than offsets the impact of declining disability rates. Under the high
scenario, the number of disabled persons grows by 163% between 2000 and 2050 for
DIS-1 and by 190% for DIS-2. Clearly, the combination of population aging and rising
disability rates would lead to huge increases in the number of disabled persons.
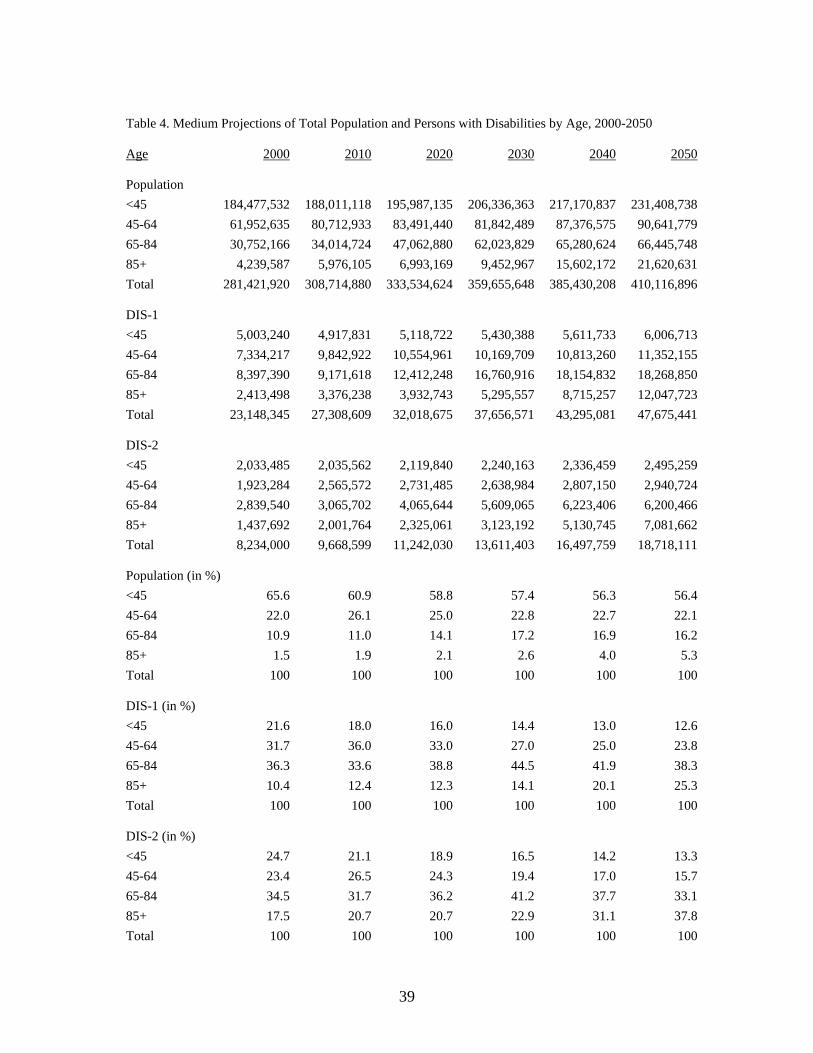
Projections for abbreviated age groups under the medium scenario are shown in
Table 4. The aging of the population is dramatic, as the population age 65+ rises from
12.4% of the total in 2000 to 21.5% in 2050. The population age 85+ grows almost five-
fold, from 1.5% of the total population in 2000 to 5.3% in 2050. Although the number of
disabled persons rises over time in each age group, the increases are much greater for the
older population than the younger population. For DIS-1, persons age 65+ accounted for
46.7% of all disabled persons in 2000. By 2050, they are projected to account for 63.6%.
For DIS-2, the proportion age 65+ is projected to rise from 52.0% to 70.9%.
(Table 4 about here)
Households. Projections of the number of households and the number of
households with a disabled resident are shown in Table 5. Under the medium scenario,
14
the number of households with a disabled resident almost doubles between 2000 and
2050 for HHDIS-1; for HHDIS-2, it more than doubles. The proportion of households
with a disabled resident increases substantially between 2000 and 2050, from 16.5% to
21.2% for HHDIS-1 and from 5.4% to 7.2% for HHDIS-2.
(Table 5 about here)
Under the low scenario, the number of households with a disabled resident as
measured by HHDIS-1 grows more rapidly than the total number of households through
2030 but more slowly thereafter. By 2050, it is a slightly lower proportion of the
population than it was in 2000 but a substantially higher number. For HHDIS-2, the
proportion of households with a disabled resident increases slowly through 2040 but
declines slightly by 2050. Under the high scenario, the number of households with a
disabled resident grows by approximately 150% between 2000 and 2050 for both
HHDIS-1 and HHDIS-2. As a result of these high growth rates, the proportion of
households with a disabled resident rises from 16.5% to 27.1% for HHDIS-1 and from
5.4% to 9.2% for HHDIS-2.
Projections by age of householder are shown in Table 6. Again, the impact of
population aging is clearly visible, both in projections of households and the medium
projections of households with at least one disabled resident. For HHDIS-1,
householders age 65+ comprise 38.7% of all households with a disabled resident in 2000;
by 2050, this proportion rises to 56.4%. For HHDIS-2, it rises from 39.6% to 59.5%.
(Table 6 about here)
Probability of a Disabled Resident
15
Our second objective is to estimate the probability that a newly built SF detached
unit will house at least one disabled resident during its expected lifetime. We assume that
all new units have an equal probability of being occupied by a household with a disabled
resident because—at this point in the analysis—we are not interested in the features of
individual units that make them more or less attractive to persons with disabilities.
We focus on SF detached units for two reasons. First, they constitute the majority
of housing units in the United States and are particularly likely to house older persons,
the group with the highest disability rates. In 2005, 63% of households and 68% of
householders age 65+ lived in SF detached units (U.S. Census Bureau, 2006). Second,
multi-unit structures—the second most common type of housing in the United States—
are already subject to a number of federal accessibility requirements. Consequently,
future policy changes affecting accessibility requirements will most likely be directed
toward SF detached units.
In order to estimate the probability that a newly built SF detached unit will house
at least one disabled resident, we need information regarding the average lifespan of SF
detached units, the average length of residence in those units, and the projected
proportion of households with a disabled resident. Regarding the first, we note that the
lifespan of a housing unit (i.e., the period over which it provides dwelling services) is
determined primarily by the quality of its design and construction; its exposure to
hazards; and the extent of maintenance, renovation, and restoration it receives.
Theoretically, the lifespan of a housing unit can be extended almost indefinitely if
sufficient resources are devoted to that end. In reality, that is seldom the case. Estimates
of the average lifespan of single-family and low-density multifamily units in the United
16
States generally range between 75 and 100 years (Baer, 1990). Estimates for Europe are
often substantially higher (e.g., Bradley and Kohler, 2007; Johnstone, 2001). We use a
range of 75 to 100 years in our calculations.
If length of residence and disability rates were the same for everybody and were
projected to remain constant over time, we could estimate the probability that a newly
built SF detached unit will house at least one disabled resident during its lifetime as:
(1) PROB = 1 – [(1-r)x]
where r is the proportion of households with at least one disabled resident and x is the
number of households occupying a SF unit over its expected lifetime.
We can illustrate this calculation using a hypothetical example based on the
average of the medium disability proportions for HHDIS-1 from 2000-2050 shown in
Table 5 (19.2%), the average length of residence for SF detached units in 2000 shown in
Table 7 (13.7 years), and the midpoint of the 75-100 year lifespan range (87.5 years).
The average number of households occupying a SF detached unit during its expected
lifetime (a measure of housing turnover) can be estimated by dividing the lifespan by the
length of residence (87.5/13.7 = 6.4). The probability that a newly built SF detached unit
will have at least one disabled resident can then be estimated as:
(2) PROB = 1 – [(1-.192)6.4] = 1 - .256 = .744 or 74.4%.
This estimate will not be valid, however, if disability rates and length of residence
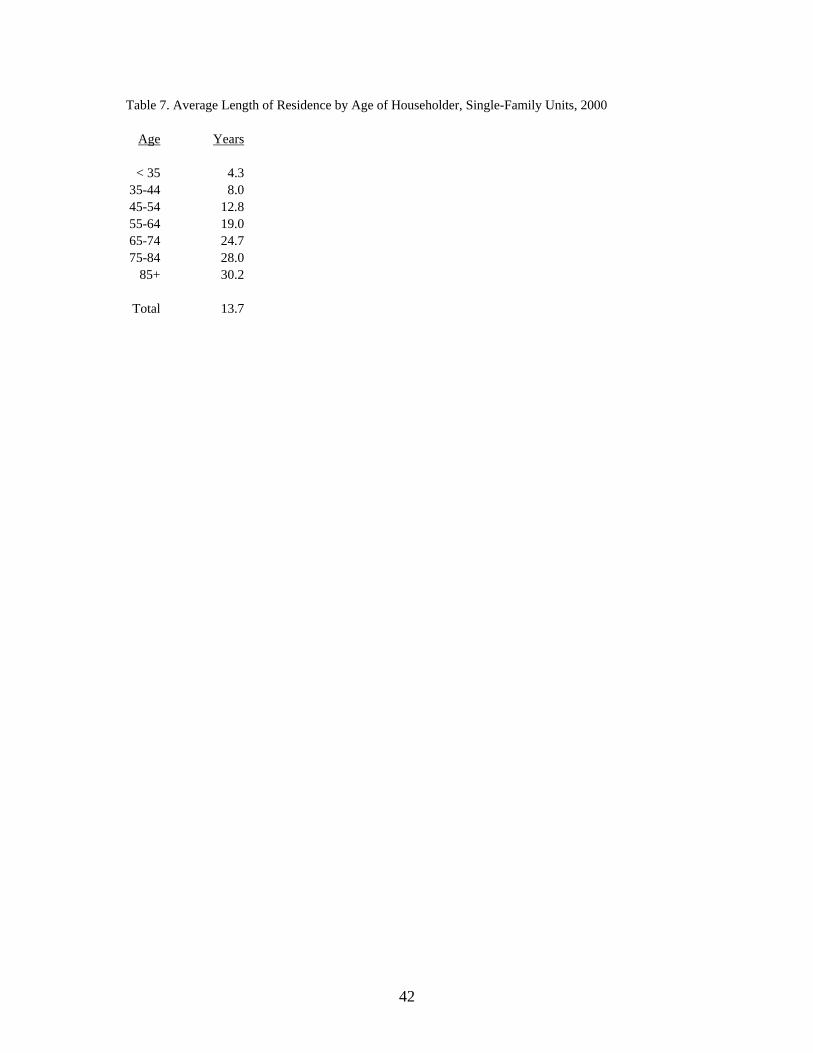
are not the same for everybody. We have already shown that disability rates differ
substantially by age. Table 7 shows that the average length of residence in SF detached
units also differs considerably by age, rising from 4.3 years for householders less than
age 35 to 30.2 for householders age 85 or older.

17
(Table 7 about here)
The hypothetical example thus overstates the probability that a SF detached unit
will house at least one disabled resident because disability rates are highest in the age
groups with the greatest length of residence. How can this problem be solved? There is
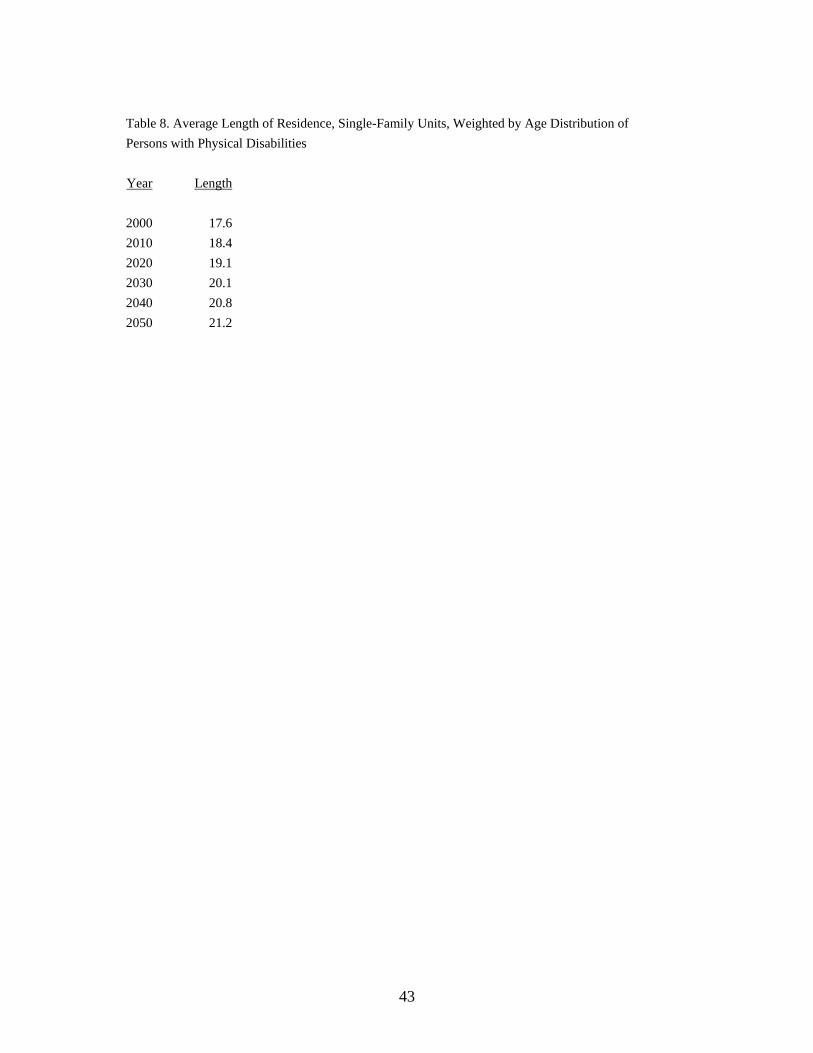
no perfect solution, but we can improve the estimate substantially by calculating an
adjusted length of residence for each projection year, with the length of residence for
each age group (shown in Table 7) weighted by the age distribution of households with at
least one disabled resident (using an average of the distributions for HHDIS-1 and
HHDIS-2 shown in Table 6). This adjustment accounts for the fact that the age groups
with the highest disability rates are the groups with the longest length of residence.
The results of the weighting process are shown in Table 8. The weighted average
length of residence for 2000 is 17.6 years, considerably longer than the unweighted
average of 13.7 years. It increases slowly over the projection horizon, reaching 21.2 in
2050. This occurs because population aging leads to larger increases in disabled
residents at older ages than at younger ages. Adjusted estimates are thus substantially
larger than unadjusted estimates and increase over time; both of these results are
consistent with the patterns noted previously.
(Table 8 about here)
We can now calculate a more realistic estimate of the probability that a newly
built SF detached unit will house at least one disabled resident during its expected
lifetime. A length of residence that rises from 17.6 in 2000 to 21.2 in 2050 implies that
an average of four households would occupy a newly built SF detached unit over
approximately an 80-year period. This is at the lower end of the 75-100 year range, but

18
we use it as a conservative estimate of average lifespan of a SF detached unit. Taking the
proportion of households with at least one disabled resident from the medium projections
for 2010, 2030, and 2050 (and, by linear extrapolation, for 2070), we can calculate the
probabilities for our two disability measures as:
(3) PROB(1) = 1 – [(1-.178)(1-.200)(1-.212)(1-.224)] = 1-.402 = .598 or 59.8%.
(4) PROB(2) = 1 – [(1-.058)(1-.065)(1-.072)(1-.079)] = 1-.753 = .247 or 24.7%.
That is, we estimate that 60% of newly built SF detached units will house at least
one disabled resident under our first measure and 25% under our second. Following a
similar procedure for the low and high projections, we estimate a range of 51-69% for the
first measure and 20-30% for the second. Clearly, the prevalence of disabilities is
substantially greater when measured over the lifetime of a housing unit than when
measured at a given point in time for an individual.
Again, we note that these calculations are based on the assumption that all new SF
detached units have an equal probability of occupancy by households with at least one
disabled resident. They are intended to show the potential size of the long-term market
for accessibility features, not to provide a prediction for any specific unit. If some units
are inaccessible to persons with disabilities, they will have a lower probability than is
shown here and the remaining units will have a higher probability.
Extension: Visitability
“Visitability” refers to the presence of features that make a home accessible to
visitors with disabilities, most notably those with mobility impairments (Kaminski et al.,
2006). Although features such as reachable electrical controls and lever door handles are
19
sometimes included, the primary features that make a home visitable are a no-step
entrance, a bathroom or half bath on the main floor, and interior doors at least 32 inches
wide (Maisel, 2006). The objective of visitability advocates is to change construction
practices so that virtually all new homes have a few basic features that make it easier for
people with mobility impairments to visit or live there (Concrete Change, 2007a). We
present a fuller discussion of the visitability movement in the next section.
Accounting for visitors as well as residents greatly expands our definition of the
disabled population. It is very difficult to estimate this population, however, due to
measurement and data collection issues. On the average, how many friends and relatives
does a disabled person have? How many might they visit if accessibility were not a
problem? It is difficult or impossible to answer these questions precisely.
We can develop an approximation, however, by making a few simplifying
assumptions. First, we assume that members of all age groups have an equal probability
of being visited by disabled friends or relatives. This seems reasonable because of the
inter-generational nature of visits: although older people have substantially higher
disability rates than younger people, younger people often have older visitors (e.g.,
parents visiting adult children). Consequently, we use the average length of residence in
SF detached units for all persons (13.7), rather than weighting it according to the
distribution of persons with disabilities. Dividing an average lifespan of 87.5 by 13.7
implies that 6.4 different households will occupy a SF detached unit over its expected
lifespan.
Second, we assume there will be one visit to a non-disabled household for each
household with a disabled resident during each occupancy period, with each non-disabled
20
household receiving no more than one disabled visitor. Consequently, we double the
proportion of households with a disabled resident to account for both residents and
visitors. Given the large number of friends and relatives potentially associated with each
disabled person, this is a very conservative assumption. However, it provides an
indication of the impact of including disabled visitors in the calculations.
Using the medium projections and twice the proportion of households with a
disabled resident in 2040—approximately the midpoint in the average lifespan of a unit
built in 2000—we estimate the probability that a newly built SF detached unit will have
at least one disabled resident or visitor during its lifetime as:
(5) PROB(1) = 1 – [(1-.418)6.4] = 1 - .031 = .969 or 96.9%.
(6) PROB(2) = 1 – [(1-.140)6.4] = 1 - .381 = .619 or 61.9%.
Under the first measure (HHDIS-1), there is a 97% probability that a newly built
SF detached unit will have at least one disabled resident or visitor; that is, it is a near
certainty. Even for the more restrictive measure (HHDIS-2), the probability is 62%.
These are very subjective estimates, of course, but they illustrate the potential demand for
accessible SF units when disabled visitors as well as disabled residents are accounted for
in the calculations.
Discussion
Evaluating Estimates and Projections. Although several studies have developed
projections of the disabled population (e.g., Singer and Manton, 1998; Waidmann and
Liu, 2000; Wang et al., 2007), this is the first study (to our knowledge) to project the
number of households with at least one disabled resident and to estimate the probability
21
that a newly built unit will house at least one disabled resident during its expected
lifetime. We believe estimates and projections of this type are essential for analyzing the
links connecting aging, disability, and housing.
Under our medium assumptions, we projected that 21% of U.S. households will
have at least one disabled resident in 2050 using the first disability measure and 7% using
the second. We estimated that there is a 60% probability that a newly built SF detached
unit will house at least one disabled resident during its lifetime using the first measure
and a 25% probability using the second. When disabled visitors are accounted for, the
probabilities rise to 97% and 62%, respectively. Given the size of these numbers and the
millions of units that will be added to the nation’s housing stock over each of the next
few decades, we believe there is a large and growing market for features that make
housing units accessible to persons with disabilities and that the public policy
implications of this growth are significant.
The assumptions underlying our estimates and projections can be questioned, of
course, and alternatives could be developed. However, we believe our assumptions are
consistent with the historical evidence and that our estimates and projections are—if
anything—likely to be a bit low. In addition to the possibility that disability rates might
rise over time, we note that: 1) Disability rates were based on disability status at a single
point in time, missing the impact of people who were previously disabled but had since
recovered; 2) Household disability rates were not adjusted upward to account for the
impact of people residing in nursing homes, who tend to have very high disability rates;
and 3) Using the upper rather than the lower end of the 75-100 year lifespan range would
have resulted in five rather than four households occupying a SF detached unit over its

22
expected lifetime. Accounting for any of these factors would have raised the estimates
and projections shown here.
Regardless of the assumptions used, two facts are beyond dispute: 1) The
proportion of households with at least one disabled resident is substantially larger than
the proportion of persons with disabilities, and 2) Most housing units are occupied by
several households during their lifetimes. Analyses based on households and housing
turnover thus indicate a substantially greater—and, in our view, more realistic—estimate
of the prevalence of disability than might be inferred from analyses focusing solely on
individuals. Furthermore, persistent population growth and the aging of the U.S.
population mean that the number of households with a disabled resident is likely to grow
rapidly as well. Regardless of the specific assumptions used, these factors point toward a
large and growing demand for housing features that improve accessibility.
Demand and Cost. The demand for accessibility features comes not only from the
currently disabled population, but from other groups as well. Many people who do not
have disabilities have disabled friends and relatives they would like to accommodate
when they come to visit (Bayer and Harper, 2000). Others have injuries or conditions
that temporarily limit their ability to function, even though they eventually return to full
functionality (Crimmins, 2004). Both of these groups contribute to the demand for
accessibility features.
Perhaps more important, many people who do not currently have mobility
impairments recognize the possibility that someday they will. Nearly one-fourth of the
respondents to a recent survey of Americans age 45 and older thought it was likely that
someone in their household would have difficulty getting around in the home within the

23
next five years (Bayer and Harper, 2000). This population contributes to a potentially
huge demand for accessibility features because the vast majority of older people want to
continue living in their current homes as they age. Kochera and colleagues (2005)
reported that 78% of persons aged 50-64, 91% of persons aged 65-74, and 95% of
persons aged 75+ expressed a desire of to remain in their current home for as long as
possible. In an attempt to do so, many have made structural modifications such as
widening doors and installing ramps. More than two-thirds of those who have made such
modifications believe those changes will allow them or some member of their household
to live in that residence longer than they could have otherwise (Bayer and Harper, 2000).
What about the cost of accessibility features? The answer to this question
depends on the specific features included and whether they are incorporated into the
construction of new units or added as modifications to existing units. When incorporated
into the construction of new units, the costs are very low. If the unit is designed with at
least a half bathroom on the main floor, the additional cost of basic visitability features (a
no-step entrance and wider interior doors) has been estimated to be less than $100 for
homes built on a concrete slab and $300-$600 for homes with a basement (Concrete
Change, 2007b). Even adding features such as wider hallways and wheel-in showers
raises the cost of a new unit by only a few thousand dollars.
When modifications are made to units that have already been built, however, costs
are often much higher, ranging from less than $100 for simple changes such as installing
a handrail to $50,000 or more for major structural changes (Duncan, 1998; Pynoos and
Nishita, 2003). Features that are very inexpensive when included in a new unit can be
very expensive when added to existing units. For someone with no current disability,
24
choosing a new home with built-in accessibility features is similar to buying an insurance
policy: a small front-end cost may eliminate the need for expensive modifications at
some point in the future.
When considering costs, it is important to consider not only the cost of
incorporating accessibility features into the construction of new units or the modification
of existing units, but also the cost of not doing so. Disabled people living in units
without adequate accessibility features face a greater risk of injury than those living in
units with adequate features, primarily due to a greater risk of falling (e.g., Close et al.,
1999). Indeed, the fear of falling itself has severe negative consequences for the sense of
well-being for many older persons (e.g., Gitlin et al., 2006). Also, disabled people living
in units without adequate accessibility features are more likely to suffer from social
isolation and loneliness (e.g., Hammel, 2005) and the lack of accessibility features places
a burden on caregivers, making it more difficult for them to provide assistance (e.g.,
Saville-Smith et al., 2007). Finally, when people leave a hospital after sustaining a
debilitating injury or disease, the lack of accessibility features may force them to enter a
nursing home rather than return home, imposing high emotional and financial costs on
the individual and—in many instances—a high financial cost on society as a whole.
Some of these costs are psychological or emotional rather than economic, but all have a
negative impact on personal well-being.
The cost of nursing home care is particularly important for an aging society.
Cohen et al. (2005) reported that several studies have estimated that, at current rates, 40-
50% of persons reaching age 65 will live in nursing homes as some point during their
lifetimes. Total spending on nursing home care was $122 billion in 2005, with Medicaid
25
accounting for 44% and Medicare for another 16% (U.S. Department of Health and
Human Services, 2007). Public expenditures thus account for the majority of nursing
home costs, which are large and growing rapidly. The average annual cost of nursing
home care has been estimated as $74,000 for a private room and $64,000 for a semi-
private room (MetLife, 2005). Numerous studies have concluded that costs of nursing
home care are substantially higher than costs of home care, even when the value of
assistive services are included in home care costs (e.g., Chappell et al., 2004; LaPlante et
al., 2007; Redfoot, 1993). It is likely that helping people delay or avoid the need for
nursing home care would lead to substantial economic savings, both for individuals and
for society as a whole. Given the strong desire of most older people to remain in their
current homes—and the dread many feel when confronted with moving to a nursing
home (Redfoot, 1993)—there are substantial non-economic advantages as well.
Policy Measures. What has been done to promote the construction of accessible
housing in the United States? At the federal level, Section 504 of the Rehabilitation Act
of 1973 requires that recipients of federal funds make at least 5% of new or substantially
rehabilitated multifamily units accessible to people with mobility impairments. The Fair
Housing Amendments Act of 1988 prohibits housing discrimination on the basis of
disability; requires landlords to allow tenants to make reasonable modifications to
accommodate disabilities; and includes design and construction standards providing
accessibility to all new or substantially rehabilitated multifamily units, regardless of
whether federal funds were used in their construction. These standards include features
such as an accessible entrance; wide interior doors; bathroom walls reinforced to
26
accommodate the installation of grab bars; usable bathrooms and kitchens; and accessible
light switches, electrical outlets, and environmental controls (Kochera, 2002).
The Americans with Disabilities Act (ADA) of 1990 also addresses accessibility
issues but focuses primarily on public buildings and buildings requiring public access
(Kaminski et al., 2006). However, Title II of the ADA and the Architectural Barriers Act
of 1968 require that a small percentage of SF units built with federal funds be accessible
to persons with disabilities.
Although federal accessibility requirements currently apply only to a small
percentage of SF units, that may be about to change. H.R. 2353 (The Inclusive Home
Design Act) was introduced in 2002 by Representative Jan Schakowsky (D-IL) and
reintroduced as H.R. 1441 in 2005. This bill would require a no-step accessible entrance,
32 inch doorways on the main floor, and a bathroom that can accommodate wheelchairs
in all new SF homes built using federal funds. As of 2006, the bill had some 36
cosponsors and more than 25 organizations supporting the legislation (Maisel, 2006).
The proposed federal legislation was inspired by the visitability movement, which
promotes the idea that virtually all new homes should include features that make them
accessible to visitors with mobility impairments. This movement arose independently in
Europe and the United States during the 1980s. In the United States, it originated with
Concrete Change, a disability advocacy group in Atlanta, GA. The movement in the
United States is based on three fundamental principles: that accessibility is a civil right
the improves everyone’s quality of life; that accessibility for new housing units can be
achieved at minimal cost if good design practices are followed; and that focusing on a
limited number of features will speed their adoption (Maisel, 2006).
27
The goal of the visitability movement is not to designate a fixed proportion of
new housing units for people with disabilities, but rather is to add certain accessibility
features to virtually all new housing units. The specific features championed by
visitability advocates differ from place to place, but typically include a no-step accessible
entrance, a bathroom or half bath on the main floor, and interior doors at least 32 inches
wide (e.g., Concrete Change, 2007a). These features are a subset of those espoused by a
broader movement promoting the idea that homes should be accessible and livable for
people at all stages of their lives, even as they undergo declining health and increasing
disability. The broader set of features includes those advocated by the visitability
movement as well as features such as lower countertops, cabinets with pull-out shelves,
higher toilet seats, and roll-in showers (Kaminski et al., 2006). Advocates of the broader
movement (e.g., universal design, inclusive design, lifetime design, and barrier-free
housing) often go beyond basic accessibility features to include energy efficiency, floor
space, storage, and other issues (e.g., Milner and Madigan, 2004).
The visitability movement has achieved a number of successes. In 1989,
Concrete Change influenced the Atlanta affiliate of Habitat for Humanity to include
visitability features in virtually all their new houses. In 1992, Atlanta passed the first
ordinance requiring visitability features in private SF homes or duplexes built with any
type of public funds or financial benefits dispersed by the city. Similar legislation has
since been passed in other cities and states, including Austin TX, San Antonio TX,
Chicago IL, Urbana IL, and Scranton PA and the states of Georgia, Texas, and Kansas.
Although most legislation applies only to houses built with some degree of public
funding, a few local areas (e.g., Naperville IL, Bolingbrook IL, and Pima County AZ)
28
have passed legislation that applies to all new housing, including units built solely with
private funding. In addition to mandatory requirements, several cities and states have
worked with developers and builders to establish voluntary programs. By 2006, 44 state
and local governments had some type of visitability program in place and another 27
were in the process of developing such programs (Maisel, 2006).
There are active visitability and housing design movements in other countries as
well. Italy, Spain, Greece, France, Denmark, Sweden, and the Netherlands have
established accessibility policies for multifamily housing (Kochera, 2002). The United
Kingdom has the most extensive accessibility requirements of any country, requiring all
new housing units to have a no-step entrance, wide halls and doorways, a bathroom on
the entrance level, and reachable electrical outlets and switches (Imrie, 2003). These
requirements apply to SF as well as multifamily units and to those built with private as
well as public funding. As is true for most visitability legislation in the United States,
waivers may be granted based on the topography of the construction site.
Further Research. Much remains to be done in the study of aging, disability, and
housing. What measures of disability are most closely related to the need for
accessibility features? What are the primary determinants of different types of disability
and how are disability rates likely to change over time? Which accessibility features are
most essential to persons with disabilities? How much are people willing to pay for
specific accessibility features? How cost effective is investment in accessible housing as
an alternative to nursing home care? Does the lack of access features contribute to rates
of institutionalization? These and other questions provide a rich field for further
research.

29
Conclusions
Homebuilders often claim that the number of people with mobility impairments is
too small to support the construction of large numbers of accessible housing units (e.g.,
Imrie, 2003; Kaminski et al., 2006). Given the findings reported here, we do not believe
these claims are valid. Population growth and aging will substantially raise the number
of U.S. households with at least one disabled resident over the next few decades, spurring
the demand for homes with accessibility features. The desire to accommodate the needs
of visitors and to age in place will add to that demand. Housing turnover will magnify
the probability that any given unit will house a person with disabilities. When viewed
from the perspective of households and housing units rather than individuals—which, in
our view, is the relevant perspective—we believe there is a large and growing demand for
homes with accessibility features.
The cost of incorporating accessibility features into the construction of new units
is typically very low and several studies have shown that many people—including many
with no disabilities—value those features and are willing to pay for them (e.g., Alonso,
2002; Kochera, 2002). Yet the vast majority of the housing stock in the United States
and many other countries is currently inaccessible to persons with disabilities (e.g., Imrie,
2003; Maisel, 2006; Steinfeld et al., 1998). Given the strong consumer demand for
accessibility features, the low cost of incorporating them into the construction of new
units, the high cost of making modifications to existing units, and the high cost of living
in a nursing home, we believe it is imperative to close this gap. We encourage the
housing industry to include more accessibility features in new units and urge policy
30
makers at all levels of government to develop and implement policies directed toward
that end. We believe the inclusion of such features will be tremendously beneficial to
currently disabled persons, to their families and friends, to those who become disabled in
the future, and to society as a whole.
31
REFERENCES
Alonso, Fernando. 2002. “The Benefits of Building Barrier-Free: A Contingent Valuation of Accessibility as an Attribute of Housing,” European Journal of Housing Policy 2: 25-44.
Arterburn, David E., Paul K. Crane, and Sean D. Sullivan. 2004. “The Coming
Epidemic of Obesity in Elderly Americans,” Journal of the American Geriatrics Society 52: 1907-1912.
Baer, William C. 1990. “Aging of the Housing Stock and Components of Inventory
Change,” pp. 249-273 in Dowell Myers (ed.), Housing Demography. Madison: University of Wisconsin Press.
Bayer, Ada-Helen and Leon Harper. 2000. “Fixing to Stay: a National Survey of
Housing and Home Modification Issues,” Washington DC: AARP. Bhattacharya, Jayanta, David M. Cutler, Dana P. Goldman, Michael D. Hurd, Geoffrey F. Joyce, Darius N. Lakdawalla, Constantijn W. A. Panis, andBaoping
Shang. 2004. “Disability Forecasts and Future Medicare Costs,”NBER Frontiers in Health Policy Research 7: 75-94.
Bradley, Patrick Erik and Niklaus Kohler. 2007. “Methodology for the Survival
Analysis of Urban Building Stocks,” Building Research & Information 35: 529-542.
Cai, Liming and James Lubitz. 2007. “Was There Compression of Disability for Older
Americans from 1992 to 2003?” Demography 44:479-495. Chappell, Neena L., Betty Havens, Marcus J. Hollander, Jo Ann Miller, and Carol
McWilliam. 2004. “Comparative Costs of Home Care and Residential Care,” The Gerontologist 44: 389-400.
Close, Jacqueline, Margaret Ellis, Richard Hooper, Edward Slucksman, Stephen Jackson,
and Cameron Swift. 1999. “Prevention of Falls in the Elderly Trial (PROFET): A Randomized Controlled Trial,” The Lancet 353: 93-97.
Cohen, Marc A., Maurice Weinrobe, Jessica Miller, and Anne Ingoldsby. 2005.
“Becoming Disabled After 65: The Expected Lifetime Costs of IndependentLiving,” Washington DC: AARP Public Policy Institute.
Concrete Change. 2007a. “Visitability Defined.”
http://www.concretechange.org/Definition_of_Visitability.htm. Concrete Change. 2007b. “Myths and Facts.” http://www.concretechange.org/myth.htm.
32
Crimmins, Eileen M. 2004. “Trends in the Health of the Elderly,” Annual Review of Public Health 25: 79-98.
Crimmins, Eileen M. and Yasuhiko Saito. 2000. “Change in the Prevalence of Diseases
Among Older Americans: 1984-1994,” Demographic Research 3: 9. Duncan, Richard. 1998. “Funding, Financing and Other Resources for Home
Modifications,” Technology and Disability 8: 37-50. Freedman, Vicki A. and Linda G. Martin. 1999. “The Role of Education in Explaining
and Forecasting Trends in Functional Limitations among Older Americans,” Demography 36: 461-473.
Freedman, Vicki A. and Linda G. Martin. 2000. “Contribution of Chronic Conditions
toAggregate Changes in Old-Age Functioning,” American Journal of Public Health 90: 1755-1760.
Freedman, Vicki A., Eileen Crimmins, Robert F. Schoeni, Brenda C. Spillman, Hakan
Aykan, Ellen Kramarow, Kenneth Land, James Lubitz, Kenneth Manton, Linda G. Martin, Diane Shinberg, and Timothy Waidmann. 2004. “Resolving Inconsistencies in Trends in Old-Age Disability: Report from a TechnicalWorking Group,” Demography 41: 417-441.
Gitlin, Laura N., Laraine Winter, Marie P. Dennis, Mary Corcoran, Sandy Schinfeld, and
Walter W. Hauck. 2006. “A Randomized Trial of a Multicomponent Home Intervention to Reduce Functional Difficulties in Older Adults,” Journal of the American Geriatrics Society 54: 809-816.
Hammel, Joy. 2005. “The Impact of Home Modification Services on Community Living
and Participation Outcomes for People who Are Aging with Disabilities: Final Report,” RRF Grant 2001-328, University of Illinois at Chicago.
Imrie, Rob. 2003. “Housing Quality and the Provision of Accessible Homes,” Housing
Studies 18: 387-408. Johnstone, Ivan M. 2001. “Energy and Mass Flows of Housing: Estimating Mortality,”
Building and Environment 36: 43-51. Kaminski, Scott E., Sanjoy Mazumdar, Joseph F. C. DeMento, and Gilbert Geis. 2006.
“The Viability of Voluntary Visitability: A Case Study of Irvine’s Approach,” Journal of Disability Policy Studies 17: 49-56.
Kaye, H. Stephen, Mitchell P. LaPlante, Dawn Carlson, and Barbara L. Wenger. 1996.
“Trends in Disability Rates in the United States, 1970-1994,” Disability Statistics Abstract 17: 1-6.

33
Kaye, H. Stephen, Taewoon Kang, and Mitchell P. LaPlante. 2000. “Mobility Device Use in the United States,” Disability Statistics Report 14. Washington DC: National Institute on Disability and Rehabilitation Research.
Kochera, Andrew. 2002. “Accessibility and Visitability Features in Single-Family
Homes: A Review of State and Local Activity,” Washington DC: AARP Public Policy Institute.
Kochera, Andrew, Audrey Straight and Thomas Guterbock. 2005. “Beyond 50.05: A
Report to the Nation on Livable Communities,” Washington DC: AARP Public Policy Institute.
Lakdawalla, Darius N., Jayanta Bhattacharya, and Dana P. Goldman. 2004. “Are the
Young Becoming More Disabled?” Health Affairs 23: 168-176. Lakdawalla, Darius, Dana P. Goldman, Jay Bhattacharya, Michael D. Hurd, Geoffrey F.
Joyce, and Constantijn W.A. Panis. 2003. “Forecasting the Nursing Home Population,” Medical Care 41: 8-20.
LaPlante, Mitchell P., H. Stephen Kaye, and Charlene Harrington. 2007. “Estimating the
Expense of a Mandatory Home- and Community-Based Personal Assistance Services Benefit Under Medicaid,” Journal of Aging & Social Policy 19: 47-64.
Lawler, Kathryn. 2001. “Aging in Place: Coordinating Housing and Health Care
Provision for America’s Growing Elderly Population,” Joint Center for Housing Studies, Harvard University.
Maisel, Jordana L. 2006. “Toward Inclusive Housing and Neighborhood Design: A
Look at Visitability,” Community Development 37: 26-34. Manton, Kenneth G. and XiLiang Gu. 2001. “Changes in the Prevalence of Chronic Disability in the United States Black and Nonblack Population above Age 65
from 1982-1999,” Proceedings of the National Academy of Sciences 98: 6354-6359.
Martin, Linda G., Robert F. Schoeni, Vicki A. Freedman, and Patricia Andreski. 2007.
“Feeling Better? Trends in General Health Status,” Journal of Gerontology: Social Sciences 62B: S11-S21.
MetLife. 2005. “The MetLife Market Survey of Nursing Home & Home Care Costs,”
MetLife Mature Market Institute, Westport, CT. Milner, Jo and Ruth Madigan. 2004. “Regulation and Innovation: Rethinking ‘Inclusive’
Housing Design,” Housing Studies 19: 727-744.
34
Pynoos, Jon and Christy M. Nishita. 2003. “The Cost of Financing of Home Modifications in the United States,” Journal of DisabilityPolicy Studies 14: 68-73.
Redfoot, Donald L. 1993. “Long-Term Care Reform and the Role of Housing
Finance,”Housing Policy Debate 4: 497-537. Reynolds, Sandra L., Yasuhiko Saito, and Eileen M. Crimmins. 2005. “The Impact of
Obesity on Active Life Expectancy in Older American Men and Women,” The Gerontologist 45: 438-444.
Saville-Smith, Kay, Bev James, Ruth Fraser, Bernadette Ruan, and Sarah Travaglia.
2007. “Housing and Disability: Future Proofing New Zealand’s Housing Stock for an Inclusive Society,” Centre for Housing Research, Aotearoa, New Zealand.
Schoeni, Robert F., Linda G. Martin, Patricia M. Andreski, and Vicki A. Freedman.
2005. “Persistent and Growing Socioeconomic Disparities in Disability among the Elderly: 1982-2002,” American Journal of Public Health 95: 2065-2070.
Singer, Burton H. and Kenneth G. Manton. 1998. “The Effects of Health Changes on
Projections of Health Service Needs for the Elderly Population of the United States,” Proceedings of the National Academy of Sciences 95: 15618-15622.
Smith, Stanley K., Jeff Tayman, and David A. Swanson. 2001. State and Local
Population Projections: Methodology and Analysis. New York: Kluwer Academic/Plenum Publishers.
Spillman, Brenda C. 2004. “Changes in Elderly Disability Rates and the Implications
for Health Care Utilization and Cost,” The Milbank Quarterly 82: 157-194. Steinfeld, Edward, Denise R. Levine, and Scott M. Shea. 1998. “Home Modifications
and the Fair Housing Law,” Technology and Disability 8: 15-35. Steinmetz, Erika. 2006. “Americans with Disabilities: 2002.” Current Population
Reports, P70-107. Washington DC: U.S. Census Bureau. Sturm, Roland, Jeanne S. Ringel, and Tatiana Andreyeva. 2004. “Increasing Obesity
Rates and Disability Trends,” Health Affairs 23: 199-205. U.S. Census Bureau. 2004. “U.S. Interim Projections by Age, Sex, Race, and Hispanic
Origin,” http://www.census.gov/ipc/www/usinterimproj/. U.S. Census Bureau. 2006. “American Housing Survey for the United States: 2005,”
Current Housing Reports, Series H150/05. Washington DC.
35
U.S. Department of Health and Human Services. 2007. “National Health Expenditures by Type of Service and Source of Funds,” Centers for Medicare and Medicaid Services, http://www.cms.hhs.gov/NationalHealthExpendData/02_NationalHealthAccountsHistorical.asp.
Waidmann, Timothy A. and Korbin Liu. 2000. “Disability Trends among
ElderlyPersons and Implications for the Future,” Journal of Gerontology: Social Sciences 55B: S298-S307.
Wang, Zhenglian, Danan Gu, and Zeng Yi. 2007. “Projections of Elderly Disability,
Care Needs, and Care Costs for the States of California, Florida, Minnesota, and North Carolina: A Pilot Study,” paper presented at the annual meeting of the Population Association of America, New York.
Wolf, Douglas A., Kelly Hunt, and James Knickman. 2005. “Perspectives on the Recent
Decline in Disability at Older Ages,” The Milbank Quarterly 83: 365-395. Yi, Zeng, Kenneth C. Land, Zhenglian Wang, and Danan Gu. 2006. “U.S. Family
Household Momentum and Dynamics: An Extension and Application of the ProFamy Method,” Population Research and Policy Review 25: 1-41.
36
Table 1. Disability Rates by Age & Sex, 2000
Male Female Age Population DIS-1 % Population DIS-1 %
< 35 60,949,682 1,121,581 1.8 58,747,107 1,024,801 1.7
35-44 22,795,548 1,244,430 5.5 23,124,437 1,303,179 5.6 45-54 18,432,972 1,644,908 8.9 19,172,397 1,812,554 9.5 55-64 11,582,552 1,814,774 15.7 12,590,270 2,039,293 16.2 65-74 8,245,839 1,794,954 21.8 9,989,648 2,313,961 23.2 75-84 4,815,313 1,507,354 31.3 7,577,579 2,760,742 36.4
85+ 1,306,660 618,657 47.3 3,045,737 1,852,722 60.8
Total 128,128,566 9,746,658 7.6 134,247,175 13,107,252 9.8 Male Female
Age Population DIS-2 % Population DIS-2 %
< 35 60,949,682 606,523 1.0 58,747,107 486,806 0.8 35-44 22,795,548 371,321 1.6 23,124,437 402,428 1.7 45-54 18,432,972 438,913 2.4 19,172,397 519,422 2.7 55-64 11,582,552 424,696 3.7 12,590,270 534,536 4.2 65-74 8,245,839 464,774 5.6 9,989,648 672,627 6.7 75-84 4,815,313 544,988 11.3 7,577,579 1,154,653 15.2
85+ 1,306,660 322,841 24.7 3,045,737 1,147,017 37.7
Total 128,128,566 3,174,056 2.5 134,247,175 4,917,489 3.7 Note: Data are for the population age 5 and older. Source: U.S. Census Bureau, 2000 Census of Population and Housing, 5% PUMS File.
37
Table 2. Household Disability Rates by Age of Householder, 2000
Age Households HHDIS-1 % HHDIS-2 %
<35 26,122,015 1,367,226 5.2 478,632 1.8 35-44 24,863,576 2,581,240 10.4 895,912 3.6 45-54 20,957,677 3,378,321 16.1 1,081,680 5.2 55-64 13,508,638 3,388,779 25.1 970,670 7.2 65-74 10,518,944 3,255,093 30.9 927,412 8.8 75-84 7,417,732 2,852,307 38.5 962,314 13.0
85+ 2,247,362 1,205,028 53.6 559,272 24.9
Total 105,635,944 18,027,994 17.1 5,875,892 5.6

38
Table 3. Projections of Total Population and Persons with Disabilities, 2000-2050 2000 2010 2020 2030 2040 2050 Population 281,421,920 308,714,880 333,534,624 359,655,648 385,430,208 410,116,896 DIS-1 Low 23,148,345 25,943,179 28,896,854 32,285,802 35,264,114 36,890,348 % 8.2 8.4 8.7 9.0 9.1 9.0 Medium 23,148,345 27,308,609 32,018,675 37,656,571 43,295,081 47,675,441 % 8.2 8.8 9.6 10.5 11.2 11.6 High 23,148,345 28,674,040 35,300,589 43,592,188 52,625,442 60,847,287 % 8.2 9.3 10.6 12.1 13.7 14.8 DIS-2 Low 8,234,000 9,185,169 10,145,932 11,670,077 13,437,528 14,483,717 % 2.9 3.0 3.0 3.2 3.5 3.5 Medium 8,234,000 9,668,599 11,242,030 13,611,403 16,497,759 18,718,111 % 2.9 3.1 3.4 3.8 4.3 4.6 High 8,234,000 10,152,029 12,394,338 15,756,901 20,053,130 23,889,579 % 2.9 3.3 3.7 4.4 5.2 5.8
39
Table 4. Medium Projections of Total Population and Persons with Disabilities by Age, 2000-2050 Age 2000 2010 2020 2030 2040 2050 Population <45 184,477,532 188,011,118 195,987,135 206,336,363 217,170,837 231,408,738 45-64 61,952,635 80,712,933 83,491,440 81,842,489 87,376,575 90,641,779 65-84 30,752,166 34,014,724 47,062,880 62,023,829 65,280,624 66,445,748 85+ 4,239,587 5,976,105 6,993,169 9,452,967 15,602,172 21,620,631 Total 281,421,920 308,714,880 333,534,624 359,655,648 385,430,208 410,116,896 DIS-1 <45 5,003,240 4,917,831 5,118,722 5,430,388 5,611,733 6,006,713 45-64 7,334,217 9,842,922 10,554,961 10,169,709 10,813,260 11,352,155 65-84 8,397,390 9,171,618 12,412,248 16,760,916 18,154,832 18,268,850 85+ 2,413,498 3,376,238 3,932,743 5,295,557 8,715,257 12,047,723 Total 23,148,345 27,308,609 32,018,675 37,656,571 43,295,081 47,675,441 DIS-2 <45 2,033,485 2,035,562 2,119,840 2,240,163 2,336,459 2,495,259 45-64 1,923,284 2,565,572 2,731,485 2,638,984 2,807,150 2,940,724 65-84 2,839,540 3,065,702 4,065,644 5,609,065 6,223,406 6,200,466 85+ 1,437,692 2,001,764 2,325,061 3,123,192 5,130,745 7,081,662 Total 8,234,000 9,668,599 11,242,030 13,611,403 16,497,759 18,718,111 Population (in %) <45 65.6 60.9 58.8 57.4 56.3 56.4 45-64 22.0 26.1 25.0 22.8 22.7 22.1 65-84 10.9 11.0 14.1 17.2 16.9 16.2 85+ 1.5 1.9 2.1 2.6 4.0 5.3 Total 100 100 100 100 100 100 DIS-1 (in %) <45 21.6 18.0 16.0 14.4 13.0 12.6 45-64 31.7 36.0 33.0 27.0 25.0 23.8 65-84 36.3 33.6 38.8 44.5 41.9 38.3 85+ 10.4 12.4 12.3 14.1 20.1 25.3 Total 100 100 100 100 100 100 DIS-2 (in %) <45 24.7 21.1 18.9 16.5 14.2 13.3 45-64 23.4 26.5 24.3 19.4 17.0 15.7 65-84 34.5 31.7 36.2 41.2 37.7 33.1 85+ 17.5 20.7 20.7 22.9 31.1 37.8 Total 100 100 100 100 100 100

40
Table 5. Projections of Households and Households with at Least One Disabled Resident, 2000-2050 2000 2010 2020 2030 2040 2050 Households 103,368,736 120,795,809 131,624,150 140,088,321 148,551,774 156,268,390 HHDIS-1 Low 17,097,283 20,402,031 22,423,483 24,067,264 25,244,765 25,682,981 % 16.5 16.9 17.0 17.2 17.0 16.4 Medium 17,097,283 21,475,822 24,845,964 28,070,872 30,993,949 33,191,541 % 16.5 17.8 18.9 20.0 20.9 21.2 High 17,097,283 22,549,613 27,392,675 32,495,544 37,673,338 42,361,751 % 16.5 18.7 20.8 23.2 25.4 27.1 HHDIS-2 Low 5,569,750 6,634,110 7,230,879 7,840,868 8,429,025 8,704,061 % 5.4 5.5 5.5 5.6 5.7 5.6 Medium 5,569,750 6,983,274 8,012,055 9,145,202 10,348,631 11,248,741 % 5.4 5.8 6.1 6.5 7.0 7.2 High 5,569,750 7,332,438 8,833,290 10,586,714 12,578,826 14,356,560 % 5.4 6.1 6.7 7.6 8.5 9.2 Note: These numbers exclude disabled persons living in group quarters.

41
Table 6. Medium Projections of Households and Households with at Least One Disabled Resident by Age of Householder, 2000-2050
Age 2000 2010 2020 2030 2040 2050
Households <45 51,719,959 52,735,162 54,167,172 54,496,539 55,464,646 58,575,301 45-64 33,328,331 44,509,952 45,889,413 44,561,131 47,469,150 49,033,225 65-84 16,361,825 20,252,720 27,796,377 36,090,244 37,572,488 37,649,117 85+ 1,958,621 3,297,975 3,771,188 4,940,407 8,045,490 11,010,747 Total 103,368,736 120,795,809 131,624,150 140,088,321 148,551,774 156,268,390 HHDIS-1 <45 3,979,661 3,884,806 4,008,399 4,109,596 4,127,649 4,372,436 45-64 6,510,796 8,983,241 9,536,397 9,121,471 9,674,956 10,102,608 65-84 5,553,614 6,853,519 9,300,722 12,218,253 12,922,761 12,877,053 85+ 1,053,212 1,754,255 2,000,447 2,621,552 4,268,582 5,839,443 Total 17,097,283 21,475,822 24,845,964 28,070,872 30,993,949 33,191,541 HHDIS-2 <45 1,386,986 1,353,754 1,396,245 1,430,973 1,437,573 1,522,828 45-64 1,979,764 2,707,866 2,853,493 2,739,118 2,908,067 3,028,914 65-84 1,713,642 2,110,040 2,837,812 3,763,400 4,030,121 3,998,537 85+ 489,358 811,614 924,505 1,211,711 1,972,870 2,698,462 Total 5,569,750 6,983,274 8,012,055 9,145,202 10,348,631 11,248,741 Households (in %) <45 50.0 43.7 41.2 38.9 37.3 37.5 45-64 32.2 36.8 34.9 31.8 32.0 31.4 65-84 15.8 16.8 21.1 25.8 25.3 24.1 85+ 1.9 2.7 2.9 3.5 5.4 7.0 Total 100 100 100 100 100 100 HHDIS-1 (in %) <45 23.3 18.1 16.1 14.6 13.3 13.2 45-64 38.1 41.8 38.4 32.5 31.2 30.4 65-84 32.5 31.9 37.4 43.5 41.7 38.8 85+ 6.2 8.2 8.1 9.3 13.8 17.6 Total 100 100 100 100 100 100 HHDIS-2 (in %) <45 24.9 19.4 17.4 15.6 13.9 13.5 45-64 35.5 38.8 35.6 30.0 28.1 26.9 65-84 30.8 30.2 35.4 41.2 38.9 35.5 85+ 8.8 11.6 11.5 13.2 19.1 24.0 Total 100 100 100 100 100 100 Note: These numbers exclude disabled persons living in group quarters.
42
Table 7. Average Length of Residence by Age of Householder, Single-Family Units, 2000
Age Years
< 35 4.3 35-44 8.0 45-54 12.8 55-64 19.0 65-74 24.7 75-84 28.0
85+ 30.2
Total 13.7
43
Table 8. Average Length of Residence, Single-Family Units, Weighted by Age Distribution of Persons with Physical Disabilities Year Length 2000 17.6 2010 18.4 2020 19.1 2030 20.1 2040 20.8 2050 21.2