agilent flow tracker series 1000/2000 - chemical analysis ... tracker... · 4 reference manual flow...
TRANSCRIPT
Agilent Flow Tracker Series 1000/2000
Reference Manual
Agilent Technologies
Notices© Agilent Technologies, Inc. 2002
No part of this manual may be reproduced in any form or by any means (including elec-tronic storage and retrieval or translation into a foreign language) without prior agree-ment and written consent from Agilent Technologies, Inc. as governed by United States and international copyright laws.
Microsoft ® is a U.S. registered trademark of Microsoft Corporation.
EditionSecond edition, May 2002First edition, August 2001
Printed in USA
Agilent Technologies, Inc.2850 Centerville Road Wilmington, DE 19808-1610 USA
Safety Notices
CAUTION
A CAUTION notice denotes a haz-ard. It calls attention to an operat-ing procedure, practice, or the like that, if not correctly performed or adhered to, could result in damage to the product or loss of important data. Do not proceed beyond a CAUTION notice until the indicated conditions are fully understood and met.
WARNING
A WARNING notice denotes a hazard. It calls attention to an operating procedure, practice, or the like that, if not correctly per-formed or adhered to, could result in personal injury or death. Do not proceed beyond a WARNING notice until the indicated condi-tions are fully understood and met.
2 Reference Manual
Agilent Flow Tracker Series 1000/2000Reference Manual
Flow Tracker Series 1000/2000
Safety Information 4
Installation 6
Flow Measurement Operating Principle 9
Basic Operation 10
Operating Modes 14
RS-232 Output 29
Maintenance and Recalibration 32
Flow Tracker 1000/2000 Flow Measurement Specifications 34
Flow Tracker 2000 Leak Detector Specifications 35
The Agilent Flow Tracker 1000 and 2000 Series Gas Chromatography flowmeters are designed to provide useful flow information in one simple, reliable, and portable instrument. The Flow Tracker 1000 has two operating modes, Flow mode and Gas Chromatography (GC) mode. The Flow Tracker 2000 has an additional Leak Detector mode and incorporates a separate, built–in sampling pump and probe.
The Flow Tracker data presentation format uses a multi-line LCD display that allows simultaneous viewing of all parameters associated with the current operating mode. Selected parameters can be brought to the enlarged “Primary Data” position to simplify viewing of the parameter in which the user is most interested at any given time.
The Flow Tracker RS-232 output allows data from the current operating mode to be streamed in real-time to a laptop computer for collection or analysis without specialized software.
3Agilent Technologies

Flow Tracker Series 1000/2000
Safety Information
General
4
For indoor use only. This product should not be used in hazardous locations. This product is rated as Safety Class II, Installation category II, and Pollution Degree 2. If this equipment is used in a manner not specified, the protection of the equipment may be impaired. Agilent Technologies assumes no liability for the customer’s failure to comply with these requirements.
• Operating temperature range is 10—50 °C.
• Operating humidity range is 0—90% RH (noncondensing).
• Maximum recommended altitude is 15,000 ft.
Electromagnetic compatability
This device has been tested and found to comply with the limits of CISPR 11. These limits are designed to provide reasonable protection against harmful interference in an installation. This equipment generates, uses, and can radiate radio frequency energy. If not installed and used in accordance with the instructions, this device may cause harmful interference to radio or television reception. This can be determined by turning the equipment off and on. The user is encouraged to try to correct any interference by taking one or more of the following measures:
• Reorient or relocate the receiving antenna.
• Increase the separation between the equipment and the receiver.
• Connect the equipment into an outlet on a circuit different from that to which the receiver is connected.
• Consult the dealer or an experienced radio/TV technician for help.
Unauthorized modification or installation of this equipment may invalidate the user’s ability to operate this equipment.
Reference Manual
Flow Tracker Series 1000/2000
Reference Manual
This ISM device complies with Canadian ICES-001.Cet appareil ISM est conforme a la norme NMB-001 du Canada.This device is CE marked for ISM Group 1, Class A equipment.
5
Flow Tracker Series 1000/2000
Installation
6
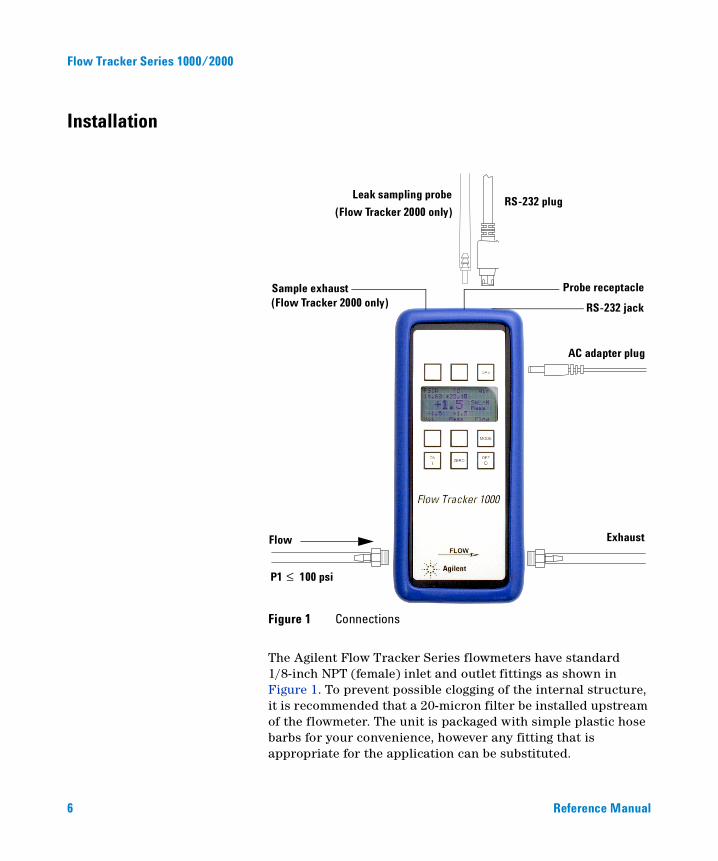
The Agilent Flow Tracker Series flowmeters have standard 1/8-inch NPT (female) inlet and outlet fittings as shown in Figure 1. To prevent possible clogging of the internal structure, it is recommended that a 20-micron filter be installed upstream of the flowmeter. The unit is packaged with simple plastic hose barbs for your convenience, however any fitting that is appropriate for the application can be substituted.
Figure 1 Connections
RS-232 plugLeak sampling probe
(Flow Tracker 2000 only)
AC adapter plug
ExhaustFlow
Sample exhaust(Flow Tracker 2000 only)
Probe receptacle
RS-232 jack
P1 100 psi≤
Reference Manual
Flow Tracker Series 1000/2000
Reference Manual
When installing fittings into the NPT ports, do not exceed 12 ft-lbs of
CAUTIONtorque.Use of pipe dopes and sealants on the NPT ports can cause permanent
NOTEdamage to the flowmeter should they get into the flow stream. If a thread sealing tape is required, avoid wrapping the first thread or two to minimize the possibility of getting a piece of shredded tape into the flow stream. When changing fittings, always clean any tape out of the threads that may come loose and enter the flow stream.Maximum operating line pressure is 100 PSIG (690 kPa) If the line pressure is higher than 100 PSIG (690 kPa), a pressure regulator must be used upstream from the flowmeter to reduce the pressure to 100 PSIG (690 kPa) or less. Although the flowmeter’s operation is unidirectional, reversing the direction of the flow will not inflict any damage as long as the maximum specified limits are not exceeded. The differential pressure sensor used in the Flow Tracker is a very sensitive device capable of detecting minute differences in pressure.
Exceeding the maximum specified line pressure may cause permanent
CAUTIONdamage to the solid-state differential pressure transducer. Avoid installations (such as snap–acting solenoid valves upstream) that apply instantaneous high pressure to the flowmeter as permanent damage to the differential pressure sensor could result.RS-232 output cable The Agilent Flow Trackers are equipped with an 8-pin mini-DIN data output jack located as shown in Figure 1. The included data cable plugs into this jack with the flat on the cable plug towards the back of the flowmeter. If the serial port on your computer is female, the flowmeter can simply be plugged into your serial port via the included 8-pin mini-DIN to DB-9 serial adapter cable. If the serial port on your computer is male, you will need a common double–ended female adapter cable.
7
8
Flow Tracker Series 1000/2000
Power/batteries Power is supplied by six (6) standard AA size batteries or by an optional AC/DC adapter (Part number 5183-4781). New batteries can provide power for several days of continuous operation depending on the quality of the batteries and whether the leak sampling pump (Flow Tracker 2000) is used. The power adapter jack is located as shown in Figure 1. A P-5 style, positive center 6-15 Vdc adapter rated for at least 100 mA is required.
To install the batteries:
1 Remove the flexible boot from the flowmeter housing.
2 Remove all three screws from the back cover.
3 Carefully remove the back cover to expose the battery housing.
4 Install the batteries as shown on the back cover.
5 Replace the back cover and re-install the screws.
6 Replace the flexible boot, pushing the bottom end of the flowmeter into the boot first.
The auto-off feature automatically shuts the flowmeter off after
NOTEapproximately 5 minutes of continuous no flow (less than 4 mL/min) condition. This applies only under battery power. The auto-off feature is disabled when power is supplied via an AC to DC adapter.Reference Manual
Flow Tracker Series 1000/2000
Flow Measurement Operating Principle
Reference Manual
The volumetric flow rate is determined by creating a pressure drop across a unique internal restriction (known as a Laminar Flow Element) and measuring differential pressure across it. The restriction is designed so that the gas molecules are forced to move in parallel paths along the entire length of the passage; hence Laminar (streamline) flow is established for the entire range of operation of the device.
Unlike other flow measuring devices, in laminar flowmeters the relationship between pressure drop and flow is linear. The underlying principle of operation of the Agilent Flow Tracker Series flowmeters is known as the Poiseuille Equation:
Since π, r and L are constant, this equation can be rewritten as:
The second equation shows the linear relationship between volumetric flow rate (Q), differential pressure (∆P), and absolute viscosity (η) in a simpler form.
Q = (P1-P2)πr4/8ηL
where: Q = volumetric flow rateP1 = static pressure at the inletP2 = static pressure at the outletr = radius of the restrictionη = (eta) absolute viscosity of the fluid or gasL = length of the restriction
Q = K (∆P/η)
where: K= a constant factor determined by the geometry of the restriction.
9
Flow Tracker Series 1000/2000
Basic Operation
10
Operation of the Agilent Flow Tracker Series flowmeters is very intuitive. The operating modes are explored in considerable detail in the Operating Modes section.
In general, each operating mode displays all of the parameters that are associated with that mode of operation. Each parameter has a button associated with it and is labeled either by a “dynamic label” on the display, or, if it is a global parameter (a parameter which is common to all modes) the associated button is labeled directly. The two global parameters are GAS and MODE.
Dynamically labeled parameters are either active or passive. Active parameters are directly affected by the flow and are constantly changing. These parameters can be moved to the primary display by pushing the button associated with them. Passive parameters are usually variables that require input from the user. The buttons associated with passive parameters are used to select the value of the variable.
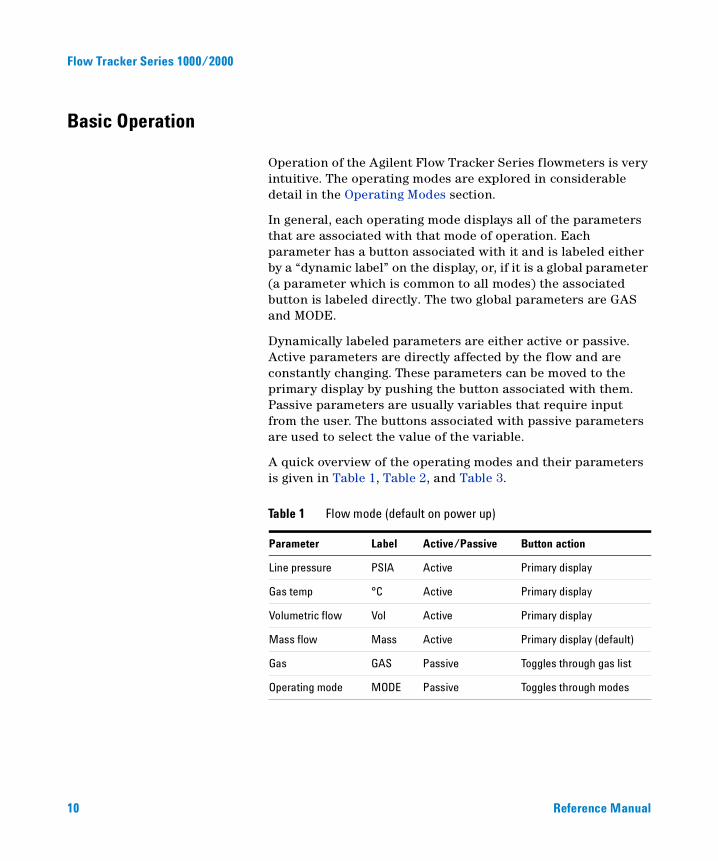
A quick overview of the operating modes and their parameters is given in Table 1, Table 2, and Table 3.
Table 1 Flow mode (default on power up)
Parameter Label Active/Passive Button action
Line pressure PSIA Active Primary display
Gas temp °C Active Primary display
Volumetric flow Vol Active Primary display
Mass flow Mass Active Primary display (default)
Gas GAS Passive Toggles through gas list
Operating mode MODE Passive Toggles through modes
Reference Manual

Flow Tracker Series 1000/2000
Reference Manual
Table 2 GC mode
Parameter Label Active/Passive Button action
Linear velocity LinVel Active Primary display (default)
Capillary inside diameter
Dia. mm Passive Toggles through column list
Split ratio Split Active Primary display
Reference flow Ref. Passive Sets ref. to present flow
Gas GAS Passive Toggles through gas list
Operating mode MODE Passive Toggles through modes
Table 3 Leak mode (Flow Tracker 2000 only)
Parameter Label Active/Passive Button action
Leak rate Rate Active Primary display (default)
Thermal conductivity
Cond. Active Primary display
Relative conductivity
Rel. Active Primary display
Sound Sound Passive Toggles sound on or off
Gas GAS Passive Toggles through gas list
Operating mode MODE Passive Toggles through modes
11
Flow Tracker Series 1000/2000
Operating the Flow Tracker
12
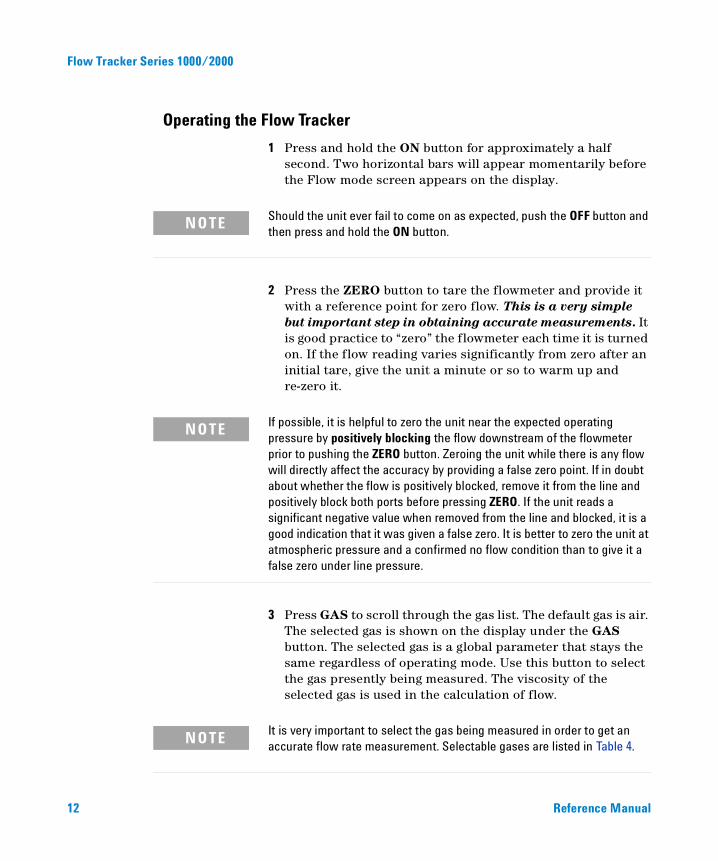
1 Press and hold the ON button for approximately a half second. Two horizontal bars will appear momentarily before the Flow mode screen appears on the display.
Should the unit ever fail to come on as expected, push the OFF button and
NOTEthen press and hold the ON button.2 Press the ZERO button to tare the flowmeter and provide it with a reference point for zero flow. This is a very simple but important step in obtaining accurate measurements. It is good practice to “zero” the flowmeter each time it is turned on. If the flow reading varies significantly from zero after an initial tare, give the unit a minute or so to warm up and re-zero it.
If possible, it is helpful to zero the unit near the expected operating
NOTEpressure by positively blocking the flow downstream of the flowmeter prior to pushing the ZERO button. Zeroing the unit while there is any flow will directly affect the accuracy by providing a false zero point. If in doubt about whether the flow is positively blocked, remove it from the line and positively block both ports before pressing ZERO. If the unit reads a significant negative value when removed from the line and blocked, it is a good indication that it was given a false zero. It is better to zero the unit at atmospheric pressure and a confirmed no flow condition than to give it a false zero under line pressure.3 Press GAS to scroll through the gas list. The default gas is air. The selected gas is shown on the display under the GAS button. The selected gas is a global parameter that stays the same regardless of operating mode. Use this button to select the gas presently being measured. The viscosity of the selected gas is used in the calculation of flow.
It is very important to select the gas being measured in order to get an
NOTEaccurate flow rate measurement. Selectable gases are listed in Table 4.Reference Manual

Flow Tracker Series 1000/2000
Reference Manual
Table 4 Selectable gases
Gas Label
Air (default) Air
Nitrogen N2
Carbon dioxide CO2
Methane CH4
Hydrogen H2
95% Argon, 5% Methane mix 95% Ar 5% CH4
Helium He
The Agilent Flow Tracker Series flowmeters can also measure gases that
NOTEare not listed here. See the GC mode section for more information.4 Press the MODE button to switch between operating modes. There are two operating modes (Flow and GC) in the Flow Tracker 1000 and three operating modes (Flow, GC, and Leak) in the Flow Tracker 2000.
5 Press the OFF button to turn the unit power off from any operating mode.
13
Flow Tracker Series 1000/2000
Operating Modes
Flow mode
14
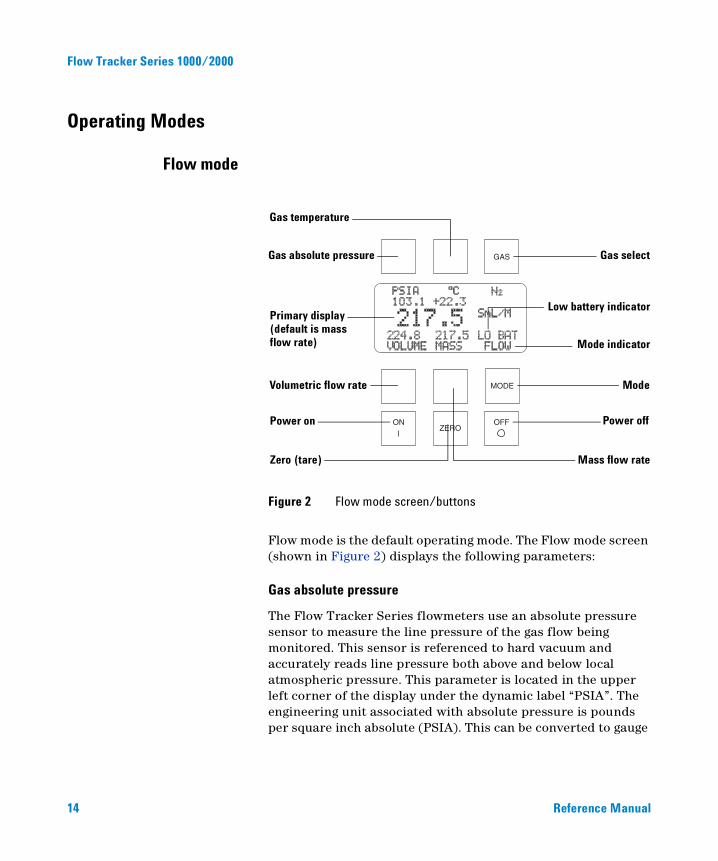
Flow mode is the default operating mode. The Flow mode screen (shown in Figure 2) displays the following parameters:
Gas absolute pressure
The Flow Tracker Series flowmeters use an absolute pressure sensor to measure the line pressure of the gas flow being monitored. This sensor is referenced to hard vacuum and accurately reads line pressure both above and below local atmospheric pressure. This parameter is located in the upper left corner of the display under the dynamic label “PSIA”. The engineering unit associated with absolute pressure is pounds per square inch absolute (PSIA). This can be converted to gauge
Figure 2 Flow mode screen/buttons
GAS
MODE
OFFONZERO
Gas select
Power off
Mode
Mode indicator
Low battery indicator
Mass flow rate
Gas absolute pressure
Gas temperature
Volumetric flow rate
Primary display(default is massflow rate)
Power on
Zero (tare)
Reference Manual

Flow Tracker Series 1000/2000
Reference Manual
pressure (PSIG = the reading obtained by a pressure gauge that reads zero at atmospheric pressure) by simply subtracting local atmospheric pressure from the absolute pressure reading:
PSIG = PSIA – (Local Atmospheric Pressure)
The flowmeters use the absolute pressure of the gas in the calculation of the mass flow rate.
For working in metric units, note that 1 PSI = 6.89 kPa.
NOTEGas temperature
The Flow Tracker Series flowmeters use a temperature sensor to measure the line temperature of the gas flow being monitored. The temperature is displayed in engineering units of degrees Celsius (°C). The flowmeters use the temperature of the gas in the calculation of the mass flow rate. This parameter is located in the upper middle portion of the display under the dynamic label “°C”.
Volumetric flow rate
The volumetric flow rate is determined as described in the Flow Measurement Operating Principle section. The engineering unit associated with the volumetric flow rate is milliliters per minute (mL/min). This parameter is located in the lower left corner of the display over the dynamic label “Vol”. In order to get an accurate volumetric flow rate, the gas being measured must be selected (see Gas select). This is important because the device calculates the flow rate based on the viscosity of the gas at the measured temperature. If the gas being measured is not what is selected, an incorrect value for the viscosity of the gas will be used in the calculation of flow, and the resulting output will be inaccurate in direct proportion to the difference in the two gases’ viscosities.
15

16
Flow Tracker Series 1000/2000
Gas viscosity, and thus gas composition, can be very important to the
NOTEaccuracy of the flowmeter. Anything that has an effect on the gas viscosity (e.g. water vapor, odorant additives, etc.) will have a direct proportional effect on the accuracy. Selecting methane and measuring natural gas for instance, will result in a fairly decent reading, but it is not highly accurate because natural gas contains small and varying amounts of other gases such as butane and propane that result in a viscosity that is somewhat different than pure methane.Absolute viscosity changes very little with pressure therefore a true
NOTEvolumetric reading does not require a correction for pressure. Changes in gas temperature do affect viscosity. For this reason, the Flow Tracker uses the temperature sensor to internally compensate for this change and no outside temperature correction is required for volumetric measurement.Other gases
The Agilent Flow Tracker Series flowmeters can easily be used to measure the flow rate of gases other than those listed as long as “non-corrosive" gas compatibility is observed. For example, a flowmeter that has been set for air can be used to measure the flow of oxygen.
The conversion factor needed for measuring the flow of different gases is linear and is simply determined by the ratio of the absolute viscosity of the gases. This factor can be calculated as follows:
Qog = Q1 [η1/ηog]
where: Q1 = Flow rate indicated by the flowmeterη1 = Viscosity of the calibrated gas at the measured temp.Qog = Flow rate of the alternate gasηog = Viscosity of the alternate gas at the measured temp.
A good rule of thumb is “at a given flow rate, the higher the viscosity, the
NOTEhigher the indicated flow.”Reference Manual
Flow Tracker Series 1000/2000
Reference Manual
Mass flow rate
The mass flow rate is the volumetric flow rate corrected to a standard temperature and pressure (14.695 PSIA and 25 °C). This parameter is located in the lower middle portion of the display over the dynamic label “Mass”. The engineering unit associated with the mass flow rate is called a standard milliliter per minute (SmL/min). The flowmeter uses the measured temperature and the measured absolute pressure to calculate what the flow rate would be if the gas pressure was at 1 atmosphere and the gas temperature was 25 °C. This allows a solid reference point for comparing one flow to another.
Volume flow vs. mass flow At room temperature and low pressures the volumetric and mass flow rate will be nearly identical, however, these rates can vary drastically with changes in temperature and/or pressure because temperature and pressure of the gas directly affects the volume. For example, assume a volumetric flow reading was used to fill balloons with 250 mL of helium, but the incoming line ran near a furnace that cycled on and off, intermittently heating the incoming helium. Because the volumetric flowmeter simply measures the volume of gas flow, all of the balloons would initially be the same size. However, if all the balloons are placed in a room and allowed to come to an equilibrium temperature, they would generally all come out to be different sizes. If, on the other hand, a mass flow reading were used to fill the balloons with 250 standard mL of helium, the resulting balloons would initially be different sizes, but when allowed to come to an equilibrium temperature, they would all turn out to be the same size.
This parameter is called “corrected mass flow” because the resulting reading has been compensated for temperature and pressure and can therefore be tied to the mass of the gas. Without knowing the temperature and pressure of the gas (and thus the density), the mass of the gas cannot be determined.
Volumetric and mass flow conversion In order to convert volume to mass, the density of the gas must be known. The relationship between volume and mass is as follows:
Mass = Volume x Density
17
18
Flow Tracker Series 1000/2000
The density of the gas changes with temperature and pressure and therefore the conversion of volumetric flow rate to mass flow rate requires knowledge of density change. Using ideal gas laws, the effect of temperature on density is:
The change in density with pressure can also be described as:
Therefore, in order to determine mass flow rate, two correction factors must be applied to volumetric rate: temperature effect on density and pressure effect on density.
Although the correct units for mass are expressed in grams, kilograms, etc. it has become standard that mass flow rate is specified in SLPM (standard liters/minute), SCCM (standard cubic centimeters/minute) or SmL/M (standard milliliters/minute).
This means that mass flow rate is calculated by normalizing the volumetric flow rate to some standard temperature and pressure (STP). By knowing the density at that STP, one can determine the mass flow rate in grams per minute, kilograms per hour, etc.
STP is usually specified as the sea level conditions, however, no single standard exists for this convention. Examples of common reference conditions include:
ρa / ρs = Ts / Ta
where: ρa = density @ ambient conditionTa = absolute temp @ ambient condition in Kelvinρs = density @ standard (reference) conditionTs = absolute temp @ standard (reference) condition in
KelvinK = ºC + 273.15 (K = Kelvin)
ρa / ρs = Pa / Ps
where: ρa = density @ ambient conditionPa = ambient absolute pressureρs = density @ standard (reference) conditionPs = Absolute pressure @ standard (reference) condition
Reference Manual
Flow Tracker Series 1000/2000
Reference Manual
0 °C and 14.695 PSIA25 °C and 14.695 PSIA0 °C and 760 torr (mmHG)70 °F and 14.695 PSIA68 °F and 29.92 inHG20 °C and 760 torr (mmHG)
The Agilent Flow Tracker Series flowmeters reference 25 ºC and
NOTE14.695 PSIA (101.32 kPa).Gas select
The selected gas is shown in the upper right hand corner of the display. There are seven different gases commonly used for gas chromatography that can be selected. The gas can be changed by pushing the GAS button until the desired gas is displayed. The selected gas is common to all operating modes and can be changed at any time in any operating mode. The gases are shown in Table 4.
Low battery indicator (LO BAT)
The low battery indicator, located just above the mode indicator in the lower right corner of the display, appears if the batteries run below a certain voltage level that can affect the accuracy of the flowmeter.
To avoid inaccurate readings, be sure to change the batteries when the
CAUTIONLO BAT indicator is displayed. Low power can result in inflated temperature sensor readings which affect the expected gas viscosity and mass flow calculations.Flow mode indicator
This indicator, located in the lower right corner of the display, signals that the unit is in Flow mode. The operating mode can be changed by pushing the MODE button.
19
Flow Tracker Series 1000/2000
GC mode
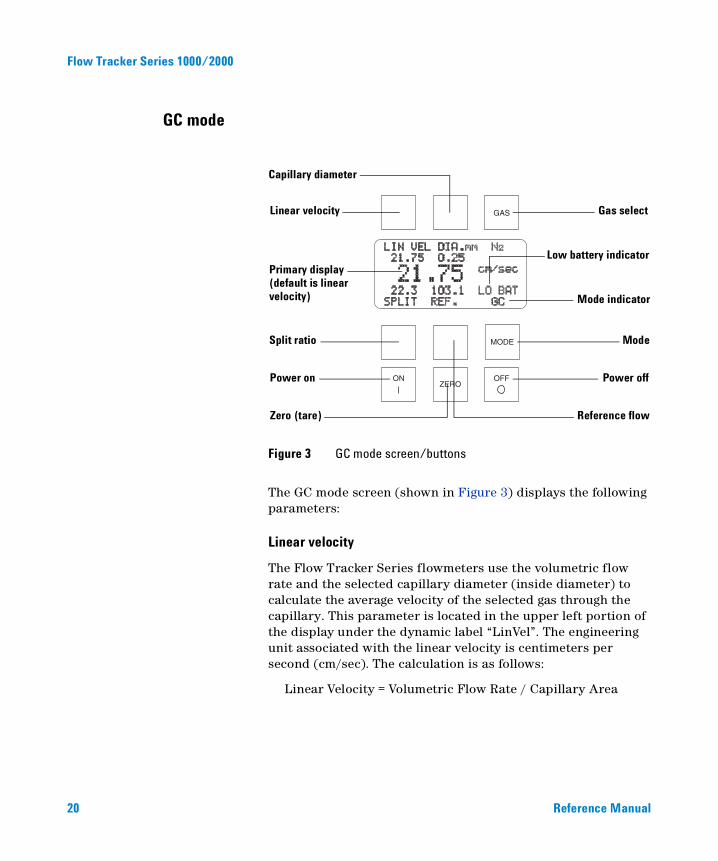
20
The GC mode screen (shown in Figure 3) displays the following parameters:
Linear velocity
The Flow Tracker Series flowmeters use the volumetric flow rate and the selected capillary diameter (inside diameter) to calculate the average velocity of the selected gas through the capillary. This parameter is located in the upper left portion of the display under the dynamic label “LinVel”. The engineering unit associated with the linear velocity is centimeters per second (cm/sec). The calculation is as follows:
Linear Velocity = Volumetric Flow Rate / Capillary Area
Figure 3 GC mode screen/buttons
GAS
MODE
OFFONZERO
Gas select
Power off
Mode
Mode indicator
Low battery indicator
Reference flow
Linear velocity
Capillary diameter
Split ratio
Primary display(default is linearvelocity)
Power on
Zero (tare)
Reference Manual
Flow Tracker Series 1000/2000
Reference Manual
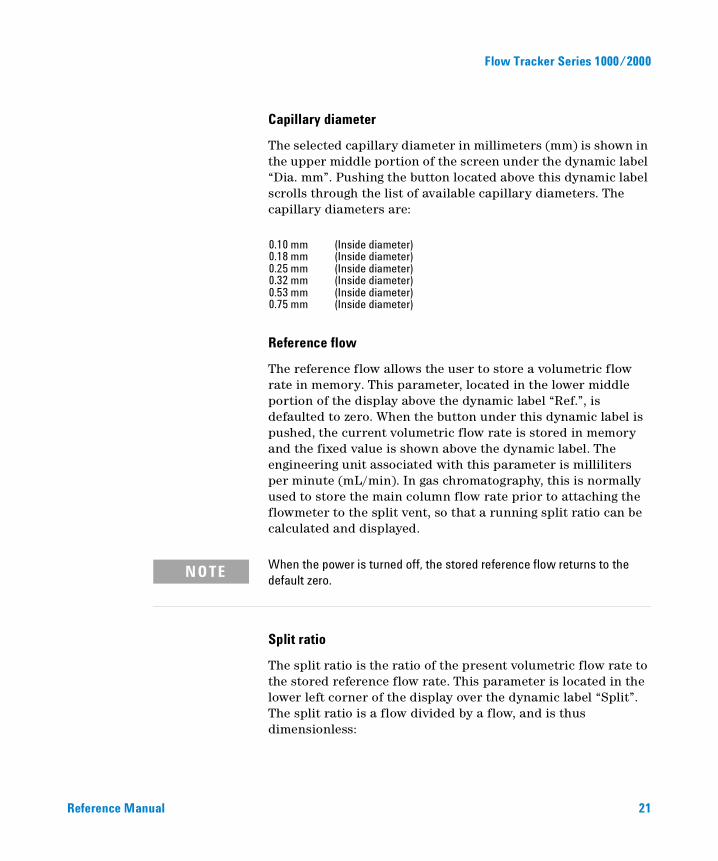
Capillary diameter
The selected capillary diameter in millimeters (mm) is shown in the upper middle portion of the screen under the dynamic label “Dia. mm”. Pushing the button located above this dynamic label scrolls through the list of available capillary diameters. The capillary diameters are:
Reference flow
The reference flow allows the user to store a volumetric flow rate in memory. This parameter, located in the lower middle portion of the display above the dynamic label “Ref.”, is defaulted to zero. When the button under this dynamic label is pushed, the current volumetric flow rate is stored in memory and the fixed value is shown above the dynamic label. The engineering unit associated with this parameter is milliliters per minute (mL/min). In gas chromatography, this is normally used to store the main column flow rate prior to attaching the flowmeter to the split vent, so that a running split ratio can be calculated and displayed.
0.10 mm (Inside diameter)0.18 mm (Inside diameter)0.25 mm (Inside diameter)0.32 mm (Inside diameter)0.53 mm (Inside diameter)0.75 mm (Inside diameter)
When the power is turned off, the stored reference flow returns to the
NOTEdefault zero.Split ratio
The split ratio is the ratio of the present volumetric flow rate to the stored reference flow rate. This parameter is located in the lower left corner of the display over the dynamic label “Split”. The split ratio is a flow divided by a flow, and is thus dimensionless:
21

22
Flow Tracker Series 1000/2000
Split ratio = present volumetric flow rate / reference flow rate
In gas chromatography, the reference flow rate is normally the main column flow rate, and the present flow rate is normally the split vent flow:
Split ratio = split vent flow rate / main column flow rate
This parameter reads:
• “DIV0” (division by zero error) until a value is stored in the reference flow buffer as described in the Reference flow section, or
• “OVRFLO” (overflow) if the resulting ratio is too large to display. This can occur if the stored reference flow is very near zero and/or the present flow is high. The maximum value that can be displayed here is 655.35.
Gas select
The selected gas is shown in the upper right hand corner of the display. Available gases are listed in Table 4.
Low battery indicator (LO BAT)
The low battery indicator, located just above the mode indicator in the lower right corner of the display, appears if the batteries run below a certain voltage level that can affect the accuracy of the flowmeter.
To avoid inaccurate readings, be sure to change the batteries when the
CAUTIONLO BAT indicator is displayed. Low power can result in inflated temperature sensor readings which affect the expected gas viscosity and mass flow calculations.GC mode indicator
This indicator is located in the lower right corner of the display and simply indicates that the unit is in GC mode. The operating mode can be changed by pushing the MODE button.
Reference Manual

Flow Tracker Series 1000/2000
Leak mode (Flow Tracker 2000 only)
Reference Manual
The Agilent Flow Tracker 2000 flowmeters use the thermal conductivity property of gases to detect leaks. The mechanism for detecting leaks is entirely separate from the main flow metering portion of the device. It consists of a sample suction probe, internal flow channel with thermal conductivity sensors, an internal suction pump, and an exhaust port.
Figure 4 Leak detector mode screen/buttons
GAS
MODE
OFFONZERO
Gas select
Power off
Mode
Mode indicator
Low battery indicator
Sound on/off
Leak rate
Thermal conductivity
Relative conductivity
Primary display(default is leak rate)
Power on
Zero (tare)
23
Flow Tracker Series 1000/2000
Operating principle
24
Ambient temperature
Temperature
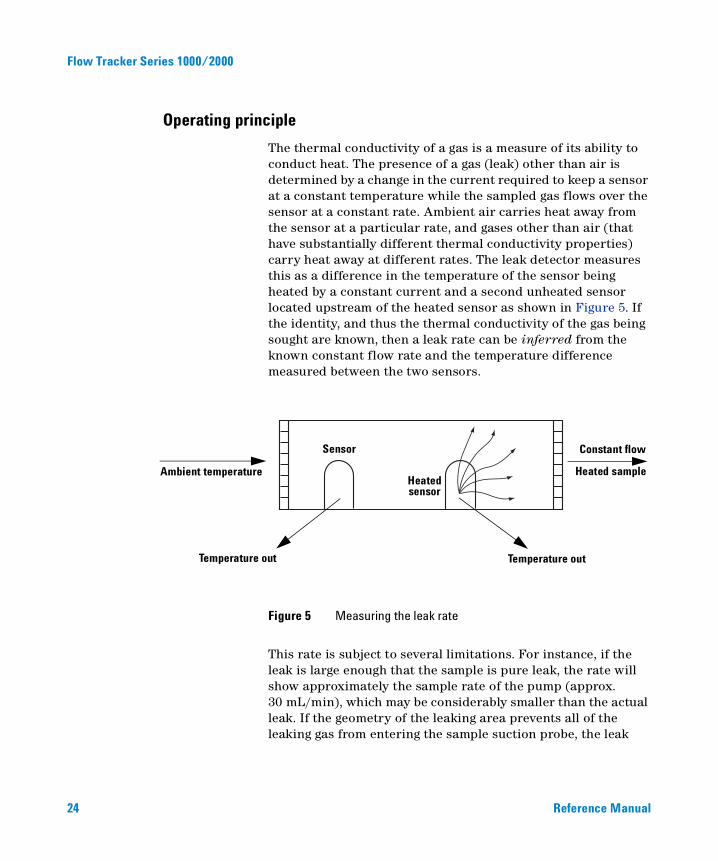
The thermal conductivity of a gas is a measure of its ability to conduct heat. The presence of a gas (leak) other than air is determined by a change in the current required to keep a sensor at a constant temperature while the sampled gas flows over the sensor at a constant rate. Ambient air carries heat away from the sensor at a particular rate, and gases other than air (that have substantially different thermal conductivity properties) carry heat away at different rates. The leak detector measures this as a difference in the temperature of the sensor being heated by a constant current and a second unheated sensor located upstream of the heated sensor as shown in Figure 5. If the identity, and thus the thermal conductivity of the gas being sought are known, then a leak rate can be inferred from the known constant flow rate and the temperature difference measured between the two sensors.
This rate is subject to several limitations. For instance, if the leak is large enough that the sample is pure leak, the rate will show approximately the sample rate of the pump (approx. 30 mL/min), which may be considerably smaller than the actual leak. If the geometry of the leaking area prevents all of the leaking gas from entering the sample suction probe, the leak
Figure 5 Measuring the leak rate
Constant flow
Heated sample
Temperature out
Sensor
Heatedsensor
out
Reference Manual

Flow Tracker Series 1000/2000
Reference Manual
rate inferred will also be smaller than the actual leak rate. For these reasons, the accuracy of the reported leak rate can be quite subjective, and should be regarded appropriately.
A good rule of thumb is that the actual leak rate is at least the rate
NOTEindicated if the appropriate gas is selected.Generally, only gases with thermal conductivities substantially different, either higher or lower than air, can be detected with this method. The absolute thermal conductivities (at 80 °F, 26.7 °C) of the gases that are selectable in the Flow Tracker 2000 are shown in Table 5.
Table 5 Thermal conductivities
Gas Absolute thermal conductivity cal/(sec)(cm2)(°C/cm) x 10-6
Detectable Temp
Air 62.20 No 80 °F, 26.7 °C
Nitrogen 62.40 No 80 °F, 26.7 °C
Carbon dioxide 39.67 Yes 80 °F, 26.7 °C
Methane* 81.83 *
* These gases are technically detectable, however this device is not rated for use in hazardous areas
80 °F, 26.7 °C
Hydrogen* 433.92 * 80 °F, 26.7 °C
95-5 Argon-methane
Yes 80 °F, 26.7 °C
Helium 360.36 Yes 80 °F, 26.7 °C
If the temperature of the gas leak is known, the leak rate and conductivity
NOTEcan be compensated for temperature. The thermal conductivity of gases changes in direct proportion to the temperature of the gas. This change is relatively small and approximately linear at 0.27% per degree Celsius (greater temp = greater conductivity).25
26
Flow Tracker Series 1000/2000
Leak detector operating steps
1 Insert the suction probe into the probe receptacle on the top of the unit (see Figure 1). If desired, a length of inert tubing can be substituted for the included sampling probe using the brass hose barb supplied with the probe.
2 Turn the unit on and press MODE three times to cycle to Leak mode. The word “Leak” will appear in the mode indicator position on the display. Allow the detector to warm up until the “WarmUp” indicator in the display disappears (approximately 7—8 minutes). The suction pump will power up (usually heard as a faint squeaking sound) when the device is ready to make gross leak measurements.
3 Ensure that the device is well away from the suspected leak area. Press ZERO.
It is good practice to allow the detector to purge away from the suspected leak for 1—2 minutes between leak detections.
In Leak mode, the ZERO button is used to store the conductivity of ambient
NOTEair away from a potential leak. This value is used to calculate relative conductivity and inferred leak rate.4 Press GAS to select the gas to be detected.
The detector will use the conductivity of the selected gas, along with the
NOTEconductivity detected and the constant flow rate to infer a leakage rate. If the selected gas happens to be an undetectable gas (as denoted in Table 5), the rate, conductivity, and relative conductivity parameter indicators will read “gas?” to prompt the user to select a detectable gas.If desired, the sound can be toggled on at this point by pressing the SOUND button. Normal, no leakage conditions are indicated by slow intermittent ticks. As the conductivity varies from that of air when leaks are detected, the tick frequency and pitch become proportionately higher.
Reference Manual
Flow Tracker Series 1000/2000
Reference Manual
5 When a satisfactory zero is obtained, move the end of the suction probe to the point of the suspected leak. Allow a few seconds for the sample to reach the sensors.
Leak mode parameters
The Leak detector mode screen (shown in Figure 4) displays the following parameters:
Leak rate The leak rate for the selected gas is inferred from the conductivity of the gas being sampled, the known conductivity of the selected gas, and the known constant flow rate provided by the sampling pump. This parameter is located in the upper left corner of the display below the dynamic label “Rate”. The engineering unit associated with this parameter is cubic centimeters per second (cc/sec).
Thermal conductivity The thermal conductivity of a gas is a measure of its ability to conduct heat. The absolute thermal conductivity of the gas presently being sampled is located in the upper middle of the display under the dynamic label “Cond.” The engineering units associated with the thermal conductivity shown are the value x 10-6 ((cal/(sec)(cm2)(°C/cm)). Because of the excessive length of the units, they are not shown on the display.
The thermal conductivity of air is given as 62.2 x 10⁻⁶
NOTE((cal/(sec)(cm2)(°C/cm)) in the CRC Handbook of Chemistry and Physics [1].Relative conductivity indicator The relative conductivity indicator is a dimensionless value reflecting the raw sensor measurement of the difference in temperature between the heated and unheated sensors. This parameter is located in the lower left corner of the display above the dynamic label “Rel.” It can be signed plus or minus with zero being the state at which the device was last zeroed, which is nominally in ambient air. This value can be roughly interpreted as:
27
28
Flow Tracker Series 1000/2000
Rel. = (Temperature difference between the two sensors when last zeroed) – (Present temperature difference between the two sensors)
Thus, if the unit is completely warmed up and zeroed in air, the relative conductivity indicator will read approximately zero until a leak is detected. If a gas with a greater conductivity than air is introduced, more current will be required and the Rel. reading will increase positively. If a gas with a lower conductivity than air is introduced, less current will be required and the Rel. reading will go negative.
Sound on/off This indicator is located in the bottom center of the display above the dynamic label “Sound”. The unit defaults in sound off. The sound can be toggled on and off simply by pushing the button located under the dynamic label. The sound is normally a slow intermittent tick sound that becomes more frequent with a change (either positive or negative) in the thermal conductivity from air. When measuring gross leaks, the tick sounds merge into a constant tone, indicating a large leak.
Gas select The selected gas is shown in the upper right hand corner of the display. Available gases are listed in Table 4 on page 13.
Low battery indicator (LO BAT) The low battery indicator, located just above the mode indicator in the lower right corner of the display, appears if the batteries run below a certain voltage level that can affect the accuracy of the flowmeter.
To avoid inaccurate readings, be sure to change the batteries when the
CAUTIONLO BAT indicator is displayed. Low power can result in inflated temperature sensor readings which affect the expected gas viscosity and mass flow calculations.Leak mode indicator This indicator is located in the lower right corner of the display and indicates that the unit is in Leak mode. The operating mode can be changed by pushing the MODE button.
Reference Manual

Flow Tracker Series 1000/2000
RS-232 Output
Connecting to the computer
Reference Manual
The Flow Tracker Series flowmeters have robust RS-232 serial output capabilities. If the serial port on your computer is female, the flowmeter can simply be plugged into your serial port via the 8-pin mini-DIN to DB-9 serial adapter cable included with the Flow Tracker. If the serial port on your computer is male, you will need a common double ended female adapter cable.
Configuring HyperTerminal
1 Open your HyperTerminal RS-232 terminal program (installed under the Accessories menu on all Microsoft® Windows operating systems).
2 Select Properties from the file menu.
3 Click on the Configure button under the “Connect To” tab. Be sure the program is set for: 19,200 baud and an 8-N-1-None (8 Data Bits, No Parity, 1 Stop Bit, and no Flow Control) protocol.
4 Under the “Settings” tab, make sure the Terminal Emulation is set to ANSI.
5 Click on the ASCII Setup button and be sure the “Send Line Ends with Line Feeds” box is not checked, and that the “Append Line Feeds to Incoming Lines” box is checked.
Settings not mentioned here are normally acceptable in the default
NOTEposition.If the flowmeter is connected to the serial port on the computer, data should begin streaming to the window. If not, try hitting the Enter key several times to clear any extraneous information. If data still does not appear, check all the connections and COM port assignments.
29
Flow Tracker Series 1000/2000
Data format
30
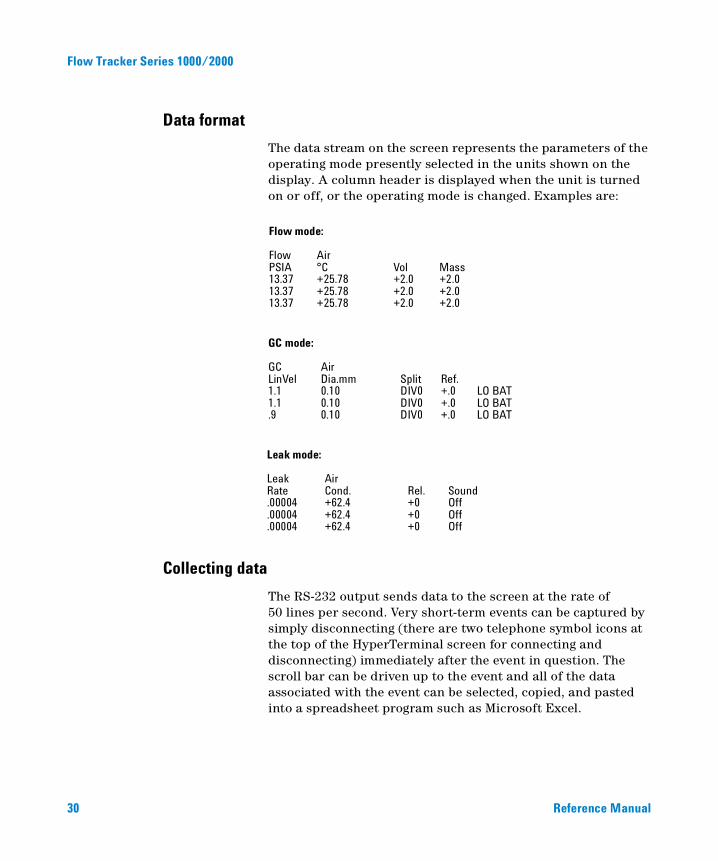
The data stream on the screen represents the parameters of the operating mode presently selected in the units shown on the display. A column header is displayed when the unit is turned on or off, or the operating mode is changed. Examples are:
Flow mode:
Flow AirPSIA °C Vol Mass13.37 +25.78 +2.0 +2.013.37 +25.78 +2.0 +2.013.37 +25.78 +2.0 +2.0
GC mode:
GC AirLinVel Dia.mm Split Ref.1.1 0.10 DIV0 +.0 LO BAT1.1 0.10 DIV0 +.0 LO BAT.9 0.10 DIV0 +.0 LO BAT
Leak mode:
Leak AirRate Cond. Rel. Sound.00004 +62.4 +0 Off.00004 +62.4 +0 Off.00004 +62.4 +0 Off
Collecting data
The RS-232 output sends data to the screen at the rate of 50 lines per second. Very short-term events can be captured by simply disconnecting (there are two telephone symbol icons at the top of the HyperTerminal screen for connecting and disconnecting) immediately after the event in question. The scroll bar can be driven up to the event and all of the data associated with the event can be selected, copied, and pasted into a spreadsheet program such as Microsoft Excel.
Reference Manual
Flow Tracker Series 1000/2000
Reference Manual
Capturing data in a text file
For longer term data, it is useful to capture the data in a text file.
1 Select Capture Text from the Transfer Menu with the desired data streaming to the screen.
2 Type in the path and file name you wish to use.
3 Push the Start button.
4 Select Capture Text from the Transfer Menu when the data collection period is complete.
5 When finished, select Stop from the sub-menu that appears.
Copying data into Excel
Data that is selected and copied, either directly from HyperTerminal or from a text file can be pasted directly into Excel. When the data is pasted it will all be in the selected column.
1 Copy the data from HyperTerminal.
2 Select Text to Columns… under the Data menu in Excel.
3 Make sure that “Fixed Width” is selected under Original Data Type when the Text to Columns Wizard dialog box appears. Click Next.
4 Set the column widths as desired in the second dialog box (the default is usually acceptable). Click Next.
5 Make sure the column data format is set to “General” in the third dialog box.
This separates the data into columns for manipulation and removes
NOTEsymbols such as the plus signs from the numbers. Once the data is in this format, it can be graphed or manipulated as desired.6 Click Finish.
31
Flow Tracker Series 1000/2000
Maintenance and Recalibration
32
The Agilent Flow Tracker Series flowmeters require minimal maintenance. With the exception of the sampling pump in the 2000 Series, the Flow Tracker flowmeters have no moving parts. The single most important thing that affects the life and accuracy of this device is the quality of the gas being measured. It is designed to measure CLEAN, DRY, NON-CORROSIVE gases.
A 20-micron filter mounted upstream of the flowmeter is highly
Cleaning
NOTErecommended. Moisture, oil, and other contaminates can affect the laminar flow elements and/or reduce the area that is used to calculate the flow rate. This directly affects the accuracy.
The Flow Tracker flowmeters require no periodic cleaning. If necessary, clean the outside of the flowmeter with a soft dry rag. Be sure to avoid any excess moisture or solvents.
Replacing the batteries
To replace old or worn batteries:
1 Remove the flexible boot from the flowmeter housing.
2 Remove all three screws from the back cover.
3 Carefully remove the back cover to expose the batteries.
4 Carefully remove the old batteries.
5 Install new batteries as shown on the back cover.
6 Replace the back cover and re-install the three screws.
7 Replace the flexible boot, pushing the bottom end of the flowmeter into the boot first.
Recalibration
The recommended period for recalibration is two years or less, although the calibration interval can be shortened to meet individual requirements. Providing that the CLEAN, DRY, and
Reference Manual
Flow Tracker Series 1000/2000
Reference Manual
NON-CORROSIVE mantra is observed, this periodic recalibration is quite sufficient. A label located on the back of the flowmeter (under the flexible cover) lists the recalibration due date. The flowmeter should be returned to an approved repair/recalibration center for recalibration before the listed due date.
For repairs and re-calibrations, locate the serial number on the back of the unit and visit the Agilent web site for instructions on where to send your flowmeter.
33

Flow Tracker Series 1000/2000
Flow Tracker 1000/2000 Flow Measurement Specifications
34
Table 6 provides flow measurement specifications for the Flow Tracker 1000 and Flow Tracker 2000 flowmeters.
Table 6 Flow measurement specifications
Flow range for measurement 0–500 mL/min
Accuracy(over 5–500 mL/min)
Flow: ± 2% of reading, ± 0.2 mL/min (± 5% from 0–5mL/min)*
* Median reading using test procedure. Test procedure can be found at: www.agilent.com/chem/supplies under the gas management section
Temp: ± 0.5 °C
Press: ± 0.5% of reading
Sensor type Flow: Solid-state piezoresistive differential pressure sensor with measurement in the laminar flow region. No heated elements
Temp: Integrated circuit absolute temperature sensor. No RTD’s
Press: Solid state absolute pressure sensor
Calibration NIST traceable multi-point calibration certificate included
Calibrated gases Nitrogen, hydrogen, helium, air, carbon dioxide, methane,95% argon / 5% methane blend
Modes Flow, gas chromatography, leak detection (Flow Tracker 2000 only)
Display Dynamically labeled multi-function 7 line LCD with 99 characters
Power Six AA batteries (included) or optional universal AC/DC Adapter(Part number 5183-4781)
Dimensions 8.3-inch (h) x 3.75-inch (w) x 1.9-inch (d)
Certification CE marked
Operating pressure 100 PSI (690 kPa) maximum
Output RS-232 output for all variables for selected mode, no special software required
Weight Approx. 2.4 lbs (1.1 kg)
Inlet and outlet 1/8-inch NPT (female) threads
Accessories RS-232 cable, stand, batteries, 1/8-inch and 1/4-inch barbed fittings
Reference Manual
Flow Tracker Series 1000/2000
Flow Tracker 2000 Leak Detector Specifications
Reference Manual
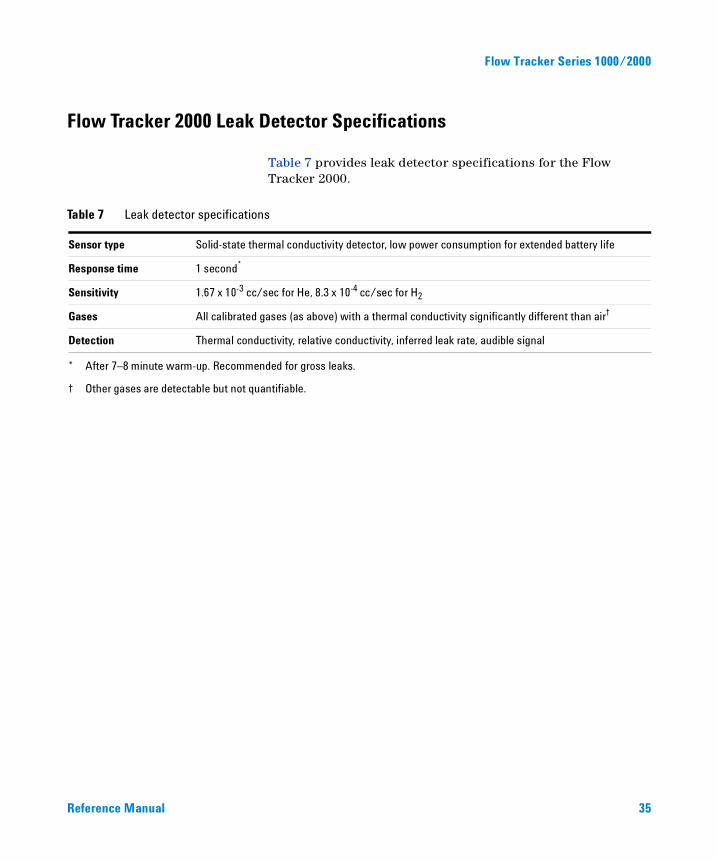
Table 7 provides leak detector specifications for the Flow Tracker 2000.
ns
Table 7 Leak detector specificatioSensor type Solid-state thermal conductivity detector, low power consumption for extended battery life
Response time 1 second*
Sensitivity 1.67 x 10⁻³ cc/sec for He, 8.3 x 10⁻⁴ cc/sec for H2
Gases All calibrated gases (as above) with a thermal conductivity significantly different than air†
Detection Thermal conductivity, relative conductivity, inferred leak rate, audible signal
* After 7–8 minute warm-up. Recommended for gross leaks.
† Other gases are detectable but not quantifiable.
35
Flow Tracker Series 1000/2000
References
36
1 Weast, Robert C., CRC Handbook of Chemistry and Physics. 61st ed. 1980: CRC Press.
Reference Manual