aggregate and soil proficiency sample testing program for 2010 · aggregate and soil proficiency...
TRANSCRIPT
Aggregate and Soil Proficiency Sample Testing
Program for 2010
MERO-040
Ministry of Transportation Materials Engineering and Research Office Report
Publication Title
Author(s) Mark Vasavithasan, Carole Anne MacDonald, Stephen Senior
Originating Office Soils and Aggregates Section, Materials Engineering and Research Office
Report Number MERO-040; ISBN 978-1-4435-6089-4 (Print, 2010 ed.); ISBN 978-1-4435-6090-0 (PDF, 2010 ed.)
Publication Date February 2011
Ministry Contact Soils and Aggregates Section, Materials Engineering and Research Office Highway Standards Branch, Ontario Ministry of Transportation Room 220, Building C, 1201 Wilson Avenue Downsview, Ontario, Canada M3M 1J8 Tel: (416) 235-3735; Fax: (416) 235-4101
Abstract The Materials Engineering and Research Office, Soils and Aggregates Section, conducts a proficiency sample-testing program each year to provide a means for participating laboratories to see if they are performing satisfactorily. We also conduct a sample testing program for the tests related to Superpave consensus properties of aggregates. This is conducted along with our annual Aggregate and Soil Proficiency Sample Testing Program.
The laboratories are asked to perform a number of different tests on pairs of samples that have been prepared and randomly selected at the MTO Laboratory. The samples are delivered to the participating laboratories starting in June, and they report their results for the aggregate and soil proficiency sample tests starting in mid-August. A preliminary report issued in the 1st week of September allows the laboratories to examine their procedures or equipment and correct any problems that may have occurred.
This is the final report for both the Aggregate and Soil Proficiency Samples and Superpave Consensus Property Testing for 2010. This year, two hundred and twenty-nine laboratories from the private, public sector and universities participated in the Aggregate and Soil Proficiency Sample Testing Program. Sixty-one laboratories from the private sector and MTO Downsview laboratory reported results for all four of the Superpave consensus property tests.
Results of the aggregate and soil tests from the 2010 program are found to be consistent with the results reported in the last three years, but, in some of the tests, the multi-laboratory variations show noticeable improvements over the ASTM or MTO precision estimates where available. Although there is improvement in the results, strong laboratory biases still remain in many of the test procedures.
We expect that the lab inspection process and mandatory Quality System implemented by CCIL will bring about improvements in multi-laboratory variation.
Key Words Aggregate, consensus property, correlation, laboratory, proficiency testing, soil, Superpave
Distribution Unrestricted technical audience.
Aggregate and Soil Proficiency Sample Testing Program for 2010
Technical Report Documentation Page
Ministry of Transportation
Materials Engineering and Research Office Report
MERO-040; ISSN 1917-3415 (Print) ISSN 1925-4490 (Online)
Aggregate and Soil Proficiency Sample Testing
Program for 2010
February 2011
Prepared by: Mark Vasavithasan, Carole Anne MacDonald and Stephen Senior
Materials Engineering and Research Office Soils and Aggregates Section
Ontario Ministry of Transportation
1201 Wilson Avenue Downsview, Ontario, Canada M3M 1J8
Tel: (416) 235-3735; Fax (416) 235-4101
Published without prejudice as to the
application of the findings. Crown copyright reserved

- i -
MTO Aggregate and Soil Proficiency Sample Testing Program for 2010; MERO-040
Table of Contents Executive Summary......................................................................................................... iv 1. Introduction............................................................................................................1 2. Test Results.............................................................................................................3
2.1 Table Of Test Results ......................................................................................... 3 2.2 Scatter Diagrams ................................................................................................ 4 2.3 Outliers ............................................................................................................. 10
3. Discussion..............................................................................................................12 3.1 Notes On Material Sources .............................................................................. 12 3.2 Notes On Sample Preparation .......................................................................... 12 3.3 Notes On Individual Tests................................................................................ 13 3.4 Proficiency Sample Tests ................................................................................. 14
3.4.1 Wash Pass 75 μm (Coarse Aggregate) – Test No. 1 ................................. 14 3.4.2 Sieve Analysis (Coarse Aggregate) – Test Nos. 2 to 6 ............................. 14 3.4.3 Los Angeles Abrasion Loss (Coarse Aggregate) – Test No. 8 ................. 15 3.4.4 Relative Density (Coarse Aggregate) – Test No. 9 and ............................ 15 Absorption (Coarse Aggregate) – Test No. 10.......................................... 15 3.4.5 Magnesium Sulphate Soundness (Coarse Aggregate) – Test No. 11........ 15 3.4.6 Percent Crushed Particles – Test No. 12 and ............................................ 16 Percent Cemented Particles – Test No. 7 .................................................. 16 3.4.7 Percent Flat and Elongated Particles – Test No. 13 .................................. 16 3.4.8 Petrographic Number (Concrete) – Test No. 14 ....................................... 17 3.4.9 Petrographic Analysis (Fine Aggregate) ................................................... 19 3.4.10 Micro-Deval Abrasion (Coarse Aggregate) – Test No. 16 ....................... 20 3.4.11 Freeze-Thaw Loss – Test No. 17 .............................................................. 20 3.4.12 Sieve Analysis (Fine Aggregate) – Test Nos. 20-25................................. 21 3.4.13 Relative Density (Fine Aggregate) – Test No. 27 and .............................. 21 Absorption (Fine Aggregate) – Test No. 28.............................................. 21 3.4.14 Amount of Asphalt Coated Particles in Coarse Aggregate – Test No. 30 22 3.4.15 Moisture-Density Relationship (One-Point Method) – Test Nos. 31-33 .. 22 3.4.16 Micro-Deval Abrasion (Fine Aggregate) – Test No. 34 ........................... 22 3.4.17 Accelerated Mortar Bar – Test No. 123 .................................................... 23 3.4.18 Particle Size Analysis of Soil – Test Nos. 40-45 ...................................... 24 3.4.19 Atterberg Limits of Soil – Test Nos. 46-48............................................... 24 3.4.20 Specific Gravity of Soils – Test No. 49 .................................................... 24
3.5 Superpave Consensus Property Tests............................................................... 25 3.5.1 Uncompacted Void Content (FA) – Test No. 95 ...................................... 25 3.5.2 Sand Equivalent Value of Fine Aggregate – Test No. 96 ......................... 25 3.5.3 Percent of Fractured Particles in Coarse Aggregate – Test No. 97........... 26 3.5.4 Percent Flat and Elongated Particles in Coarse Aggregate – Test No. 99 26
4. Laboratory Rating System..................................................................................27 5. Conclusions...........................................................................................................30 6. Recommendations ................................................................................................31 7. Acknowledgments ................................................................................................32
- ii -
MTO Aggregate and Soil Proficiency Sample Testing Program for 2010; MERO-040
References.........................................................................................................................33 Appendix A: Glossary of Terms .....................................................................................34 Appendix B1: List of Participants ..................................................................................36 Appendix B2: List of Participants ..................................................................................50 Appendix C: Multi-Laboratory Precision .....................................................................54 Appendix D1: Scatter Diagrams.....................................................................................60 Appendix D2: Scatter Diagrams.....................................................................................99 Appendix E1: Production Laboratory Ratings...........................................................103 Appendix E2: Full Service Aggregate Laboratory Ratings .......................................109 Appendix E3: Soil Laboratory Ratings........................................................................111 Appendix E4: Superpave Laboratory Ratings............................................................112
- iii -
MTO Aggregate and Soil Proficiency Sample Testing Program for 2010; MERO-040
List of Tables Table 1. Summary of Results for Laboratory 47 ............................................................................ 5 Table 2. Summary of Results for Laboratory 47 ............................................................................ 6 Table 3. Summary of Results for Laboratory 47 ............................................................................ 7 Table 4. Summary of Results for Laboratory 47 ............................................................................ 8
List of Figures Figure 1. Examples of Scatter Diagrams ......................................................................................... 9 Figure 2. Production Laboratory Ratings ...................................................................................... 28 Figure 3. Full Service Laboratory Ratings .................................................................................... 28 Figure 4. Soil Laboratory Ratings ................................................................................................... 29 Figure 5. Superpave Laboratory Ratings ........................................................................................ 29
-iv-
MTO Aggregate and Soil Proficiency Sample Testing Program for 2010; MERO-040
Executive Summary The Soils and Aggregates Section of the Materials Engineering and Research Office runs an annual proficiency sample testing program for aggregate and soil tests. This program provides a means for participating laboratories to see if they are performing satisfactorily. The laboratories are asked to perform a number of different tests on randomly selected pairs of samples that have been prepared by the MTO Soils and Aggregates Laboratory. The samples are delivered to the participating laboratories starting in June and the laboratories are required to report their results by the second week of August. A preliminary report issued in early September gives feedback to the participants while they are still operational in the current year. This allows them to examine their procedures or equipment and correct any problems that may exist. A final report is issued after analysis of the data has been completed. This is the final report for the 2010 MTO Aggregate and Soil Proficiency Sample Testing and the Superpave Aggregate Consensus Property Testing Programs. Proficiency test samples in duplicates were shipped to two hundred and thirty-one private, public sector and university laboratories. Two hundred and twenty-nine of the laboratories that requested samples submitted test results in 2010. Of these, one hundred and fifty were aggregate producers’ and road builders’ Quality Control (QC) laboratories. The remainder were engineering testing consultants’ and owners’ laboratories. Participation in this program is mandatory for laboratories conducting quality assurance (QA) and referee testing work for MTO contracts. However, participation is optional for laboratories that do quality control (QC) testing for contractors. In general, contractor and supplier laboratories are conducting particle size analysis, wash pass 75 μm, percent crushed particles, percent asphalt coated particles, percent flat and elongated and density tests for granular base and sub-base aggregates. In 2010, seventy-two laboratories reported results for one or more of the tests related to Superpave aggregate consensus properties. The laboratories that participate in this program conduct uncompacted void content of fine aggregate, sand equivalent value of fine aggregate, percent of fractured particles in coarse aggregate, and flat particles, elongated particles, or flat and elongated particles in coarse aggregate tests, in accordance with the ASTM/AASHTO test methods. Reports to individual laboratories contain ratings for each test method, which are based on the standardized deviate for that test (i.e. a rating of 5 for data within 1.0 standard deviation of the mean, a rating of 0 for data 3.0 or more standard deviations from the mean). Ratings of each test method are also used to calculate an overall laboratory rating for each category of tests. This rating system has acted as an incentive for laboratories to improve their performance. The rating is also used as a guide by MTO to select laboratories for its quality assurance testing and for qualifying referee laboratories. Results of the aggregate and soil tests from the 2010 program are found to be consistent with

- v -
MTO Aggregate and Soil Proficiency Sample Testing Program for 2010; MERO-040
the results from previous years and, in some of these tests, the multi-laboratory variations show noticeable improvements over the precision estimates published by AASHTO, MTO, or ASTM. Particularly, sieve analysis of coarse aggregate, percent crushed particles of coarse aggregates, percent flat and elongated particles of coarse aggregate, relative density and absorption of coarse and fine aggregates, Micro-Deval abrasion of coarse and fine aggregates, and moisture density relationship show improvements over the precision estimates published by ASTM or MTO. Although the precision of most of the test methods compares favourably in relation to the results of previous studies and the precision estimates where available, strong laboratory biases still remain in some of the test methods. The variations in soil test results are consistent with the values reported in the previous three years of study, but the scatter plots show a strong laboratory bias. The results of Superpave consensus property tests from the 2010 program do not compare favourably with the past performance of the laboratories. The variations of only one of the tests in the program were found to be lower than that of the values published in ASTM precision statements. The scatter diagrams for the Superpave tests also show strong laboratory biases. The Soils and Aggregates Section continues to carry out the inspection of laboratories providing soil testing services to the ministry. This inspection is being done at the request of laboratories. The laboratories that are inspected and accepted by MTO must request a re-inspection whenever technicians or equipment change. To date, forty-one laboratories have been inspected. Thirty-three of these laboratories are on the MTO Vendors List to do testing of soils for MTO work.
- 1 -
MTO Aggregate and Soil Proficiency Sample Testing Program for 2010; MERO-040
1. Introduction This is the final report of the 2010 interlaboratory testing program organized by MTO for aggregate and soil test methods. It is primarily intended to provide a means for laboratories used by MTO to see if they are performing satisfactorily and to qualify these laboratories to perform quality assurance and referee testing for MTO contracts1. The design of the testing program is based on procedures for determining the precision and variability of test methods. Interested readers should refer to ASTM C6702, C8023, E1774, and E1785 for further information on interlaboratory testing programs. Proficiency test samples were distributed to two hundred and thirty-one private, public sector and university laboratories. A total of two hundred and twenty-nine laboratories reported results for the Aggregate and Soil Proficiency Sample Testing Program conducted in the summer of 2010. The participants were also asked to submit results for Superpave aggregate consensus property tests, if they were equipped to perform those tests. Sixty-two laboratories submitted results for all of the tests related to the consensus properties. Participants in both testing programs included the MTO laboratory in Downsview, the remainder being from the private sector (contractors, aggregate producers, and engineering consultants), universities and municipalities. Samples were delivered to laboratories in early June. A preliminary report was issued to the participants in early September. Reports to individual laboratories contain ratings for each test method, which are based on the standardized deviate for that test (i.e. a rating of 5 for data within 1.0 standard deviation of the mean, a rating of 0 for data 3.0 or more standard deviations from the mean). Ratings of each test method are also used to calculate an overall laboratory rating. This rating system has acted as an incentive for laboratories to improve their performance. The computer program that was developed by MTO to handle the computation and presentation of test data has two statistical methods, namely the Critical Value Method and the Iterative (Jackknife) Technique, to detect outlying observations or outliers in a set of data. For details of the program, refer to the User’s Manual (report MERO-013) by Vasavithasan and Rutter, 2004. A number of statistical methods are available to test the hypothesis that the suspect observations are not outliers, but the MTO study follows the Critical Value Method recommended in Section 4 of ASTM E178. The critical value method and iterative techniques are based on two different statistical approaches. As a result, the confidence intervals yielded by these two methods differ widely depending on the number of observations (number of laboratories participating in a particular test method) and the distribution of data. The critical value used in this study is that value of the sample criterion, which would be
1 Laboratories must also be inspected and recognized by the Canadian Council of Independent Laboratories (CCIL). 2 ASTM C670 Practice for Preparing Precision and Bias Statements for Test Methods of Construction Materials. 3 ASTM C802 Practice for Conducting an Inter-laboratory Test Program to Determine the Precision of Test Methods of Construction Materials. 4 ASTM E177 Practice for Use of Terms Precision and Bias in ASTM Test Methods. 5 ASTM E178 Practice for Dealing with Outlying Observations.
- 2 -
MTO Aggregate and Soil Proficiency Sample Testing Program for 2010; MERO-040
exceeded by chance with some specified probability (significance level) on the assumption that all observations in the sample come from the same normally distributed population. The critical values provided in ASTM E178, Table 1 are limited to 147 observations, but over 200 laboratories participate in our annual testing program. The critical values that are being used for the MTO study were calculated at five percent significance level (Grubbs' test) based on Grubbs’ (1969 and 1972) recommendations for identifying outliers. The jackknife method recommended by Manchester (1979) is used where the strict application of the critical value method tends to include results that may not stand the best chance of representing the testing performed in conformance with each of the test methods.
- 3 -
MTO Aggregate and Soil Proficiency Sample Testing Program for 2010; MERO-040
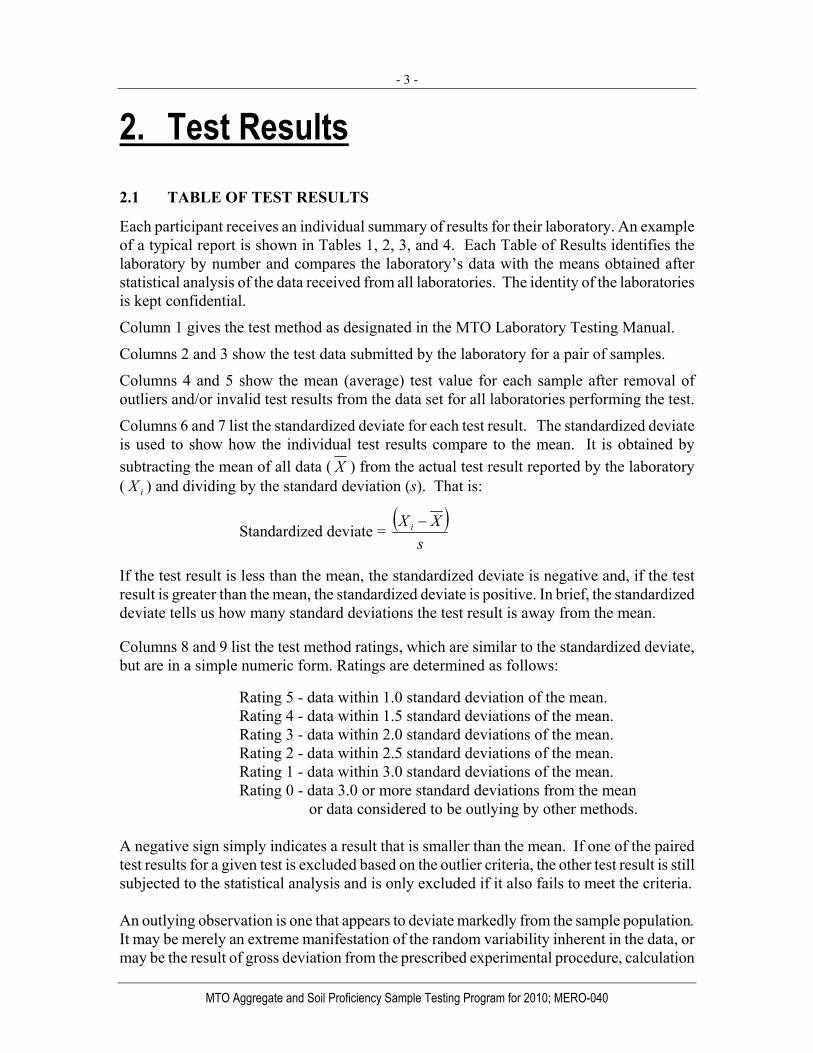
2. Test Results 2.1 TABLE OF TEST RESULTS
Each participant receives an individual summary of results for their laboratory. An example of a typical report is shown in Tables 1, 2, 3, and 4. Each Table of Results identifies the laboratory by number and compares the laboratory’s data with the means obtained after statistical analysis of the data received from all laboratories. The identity of the laboratories is kept confidential.
Column 1 gives the test method as designated in the MTO Laboratory Testing Manual.
Columns 2 and 3 show the test data submitted by the laboratory for a pair of samples.
Columns 4 and 5 show the mean (average) test value for each sample after removal of outliers and/or invalid test results from the data set for all laboratories performing the test.
Columns 6 and 7 list the standardized deviate for each test result. The standardized deviate is used to show how the individual test results compare to the mean. It is obtained by subtracting the mean of all data ( X ) from the actual test result reported by the laboratory ( iX ) and dividing by the standard deviation (s). That is:
Standardized deviate = )(
sXX i −
If the test result is less than the mean, the standardized deviate is negative and, if the test result is greater than the mean, the standardized deviate is positive. In brief, the standardized deviate tells us how many standard deviations the test result is away from the mean. Columns 8 and 9 list the test method ratings, which are similar to the standardized deviate, but are in a simple numeric form. Ratings are determined as follows:
Rating 5 - data within 1.0 standard deviation of the mean. Rating 4 - data within 1.5 standard deviations of the mean. Rating 3 - data within 2.0 standard deviations of the mean. Rating 2 - data within 2.5 standard deviations of the mean. Rating 1 - data within 3.0 standard deviations of the mean. Rating 0 - data 3.0 or more standard deviations from the mean
or data considered to be outlying by other methods. A negative sign simply indicates a result that is smaller than the mean. If one of the paired test results for a given test is excluded based on the outlier criteria, the other test result is still subjected to the statistical analysis and is only excluded if it also fails to meet the criteria. An outlying observation is one that appears to deviate markedly from the sample population. It may be merely an extreme manifestation of the random variability inherent in the data, or may be the result of gross deviation from the prescribed experimental procedure, calculation

- 4 -
MTO Aggregate and Soil Proficiency Sample Testing Program for 2010; MERO-040
errors, or errors in reporting data. The outlier criteria employed for exclusion of test results from the analysis will depend on the distribution of data and the number of participants in a test. The iterative technique is one of the methods employed in this study for the selection of outliers, and is used where the strict application of critical value method tends to include the data that does not belong to the population. In the critical value method, the standardized deviate of a lab result is compared with the critical value corresponding to the number of participants in that particular test for rejecting an outlier. The critical value is greater than 3 when the number of participants in a particular test method is 30 or more. For this reason, results with more than 3 standardized deviates may not have been identified as an outlier unless it is higher than the critical value, but a zero rating is nevertheless assigned for the test result in question. For example, if the computed standardized deviate for a lab result is 3.236 and the critical value corresponding to the number of participants in that particular test is 3.427, the lab will not be identified as an outlier but a zero rating will be assigned. Significance need not necessarily be attached to a single low rating. However, a continuing tendency to get low ratings on several pairs of samples or on a series of tests from one procedure (e.g. sieve analysis) should lead a laboratory to re-examine its equipment and test procedure. A laboratory that reports data for a specific test consistently lower or higher than the mean over a number of test periods also needs to re-examine their test procedure, because this is evidence of a systematic bias in how the laboratory conducts the procedure. Any computer program that is used by a laboratory to calculate test results should be verified as part of this examination. 2.2 SCATTER DIAGRAMS
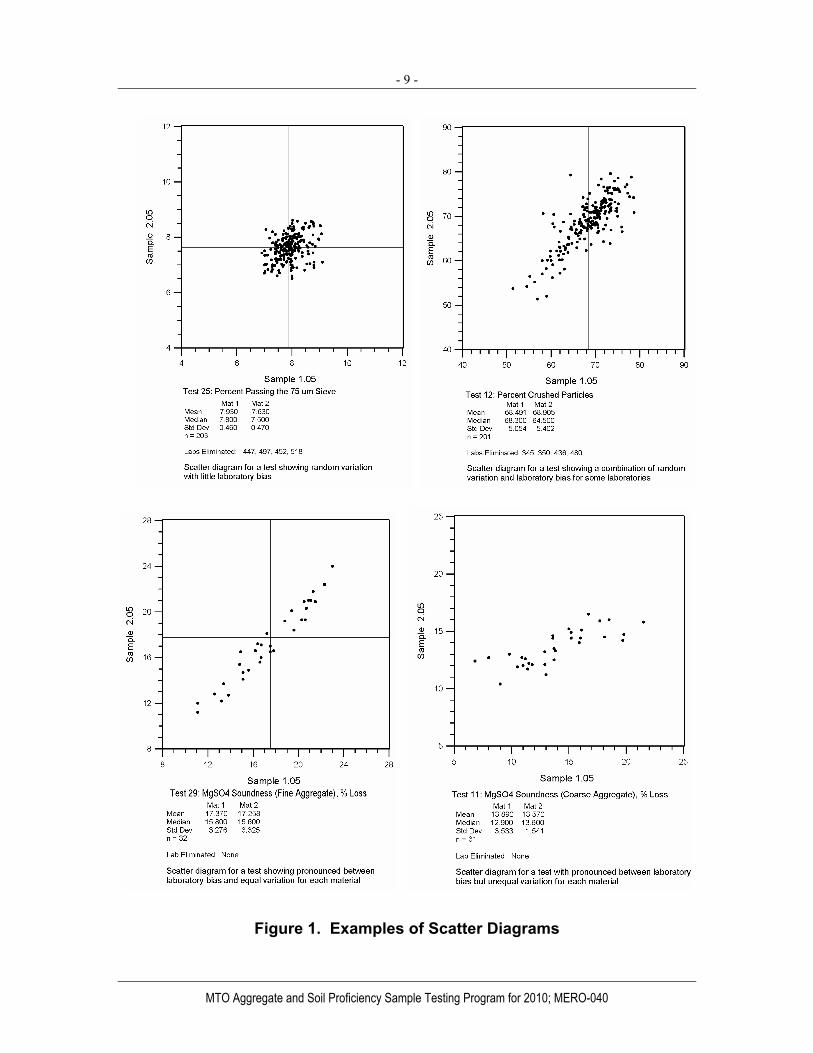
Youden scatter diagrams are supplied with this report (see Appendices D1 and D2). A laboratory can locate itself on the diagrams by plotting its test value for the first sample (1.10) on the horizontal axis, against its test value for the second sample (2.10) on the vertical axis. The horizontal and vertical axes are of equal length and are scaled to give the most informative display of the plotted points. In some cases, the outlying results plot outside the boundaries of the diagram. If the results from two or more laboratories happen to coincide, a single point is plotted. Below each scatter diagram, the test number and title are given, followed by a table of statistical calculations for both samples. Here the mean, median, and standard deviation for each sample are given. The number of laboratories reporting valid data and the laboratories eliminated by statistical analysis are also listed. The vertical and horizontal crosshairs on the plots represent the mean values for all the valid results on the first sample (1.10) and the second sample (2.10), respectively. These lines divide the diagram into four quadrants, numbered 1 through 4, beginning in the upper right-hand quadrant and continuing clockwise. In an ideal situation where only random errors occur, the points are expected to be equally numerous in all quadrants and will form a circular distribution. This follows because plus and minus errors should be equally likely. Often, however, the points tend to concentrate in quadrants 1 and 3 on the diagram. This occurs because laboratories tend to get high or low results on both samples. This gives evidence of individual laboratory biases. As the tendency to laboratory bias increases, the departure from the expected circular distribution of points towards a linear distribution from

- 5 -
MTO Aggregate and Soil Proficiency Sample Testing Program for 2010; MERO-040
quadrant 1 to 3 occurs. Such a distribution of points indicates systematic variation. Figure 1 gives examples of scatter diagrams.
Table 1. Summary of Results for Laboratory 47
TEST RESULTS FOR LABORATORY NUMBER 47 DATE PREPARED: November 9, 2010 COARSE AGGREGATE REFERENCE SAMPLES 1.10 & 2.10
LABORATORY
DATA
MEAN OF
LABORATORIES
STANDARDIZED
DEVIATE
LAB
RATING
TEST METHOD
1.10
2.10
1
2
1
2
1 2
LS-601 Wash Pass 75 μm (Coarse Agg.)
0.510
0.660
0.557
0.547
-0.245
0.582
-5 5
LS-602 – Coarse Aggregate Percent Passing 19.0 mm Percent Passing 16.0 mm Percent Passing 13.2 mm Percent Passing 9.5 mm Percent Passing 4.75 mm
96.500 89.000 82.200 70.500 52.380
96.500 89.100 83.100 73.500 54.100
95.802 89.311 82.820 71.474 53.416
96.035 89.817 83.600 72.405 54.195
0.809
-0.219 -0.359 -0.528 -0.617
0.702
-0.698 -0.395 0.718
-0.065
5 5
-5 -5 -5 -5 -5 5 -5 -5
LS-603 Los Angeles Abrasion, %
20.900
20.800
22.408
22.092
-1.052
-1.069
-4 -4
LS-607 Percent Crushed Particles Percent Cemented Particles
73.800 5.000
80.100 9.100
72.335 6.406
72.235 6.575
0.287 -0.365
1.449 0.638
5 4 -5 5
LS-608 % Flat & Elongated Particles
4.500
4.110
7.095
6.723
-1.000
-1.096
-5 -4
LS-609 Petrographic Number (Concrete)
187.60
178.60
151.6
153.5
1.741
1.117
- -
LS-614 Freeze-Thaw Loss, %
8.600
9.500
10.375
10.453
-0.858
-0.418
-5 -5
LS-618 Micro-Deval Abrasion Loss (CA)
18.300
17.400
17. 230
17.071
1.274
0.373
4 5
LS-620 Accelerated Mortar Bar (14 Days)
0.201
0.357
0.191
0.373
0.362
-0.349
5 -5
Blank spaces represent not tested. * - Calculation considered outlier
- 6 -
MTO Aggregate and Soil Proficiency Sample Testing Program for 2010; MERO-040
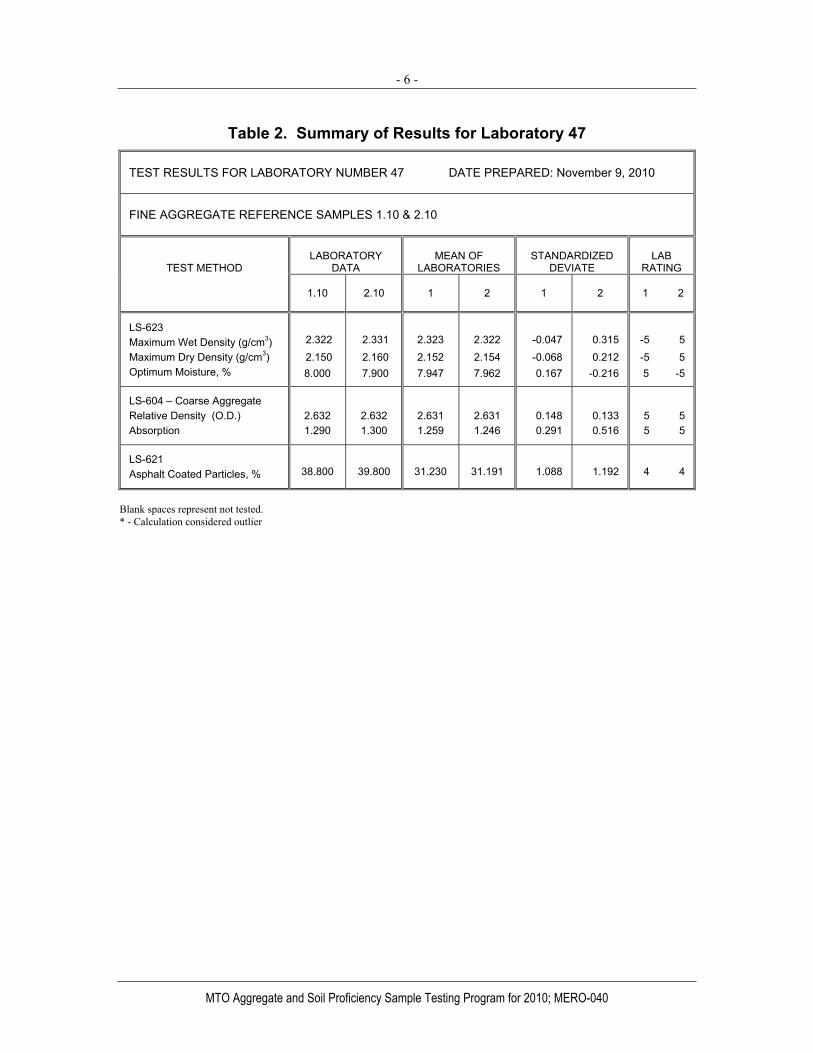
Table 2. Summary of Results for Laboratory 47
TEST RESULTS FOR LABORATORY NUMBER 47 DATE PREPARED: November 9, 2010 FINE AGGREGATE REFERENCE SAMPLES 1.10 & 2.10
LABORATORY
DATA
MEAN OF
LABORATORIES
STANDARDIZED
DEVIATE
LAB
RATING
TEST METHOD
1.10
2.10
1
2
1
2
1 2
LS-623 Maximum Wet Density (g/cm3) Maximum Dry Density (g/cm3) Optimum Moisture, %
2.322 2.150 8.000
2.331 2.160 7.900
2.323 2.152 7.947
2.322 2.154 7.962
-0.047 -0.068 0.167
0.315 0.212
-0.216
-5 5 -5 5 5 -5
LS-604 – Coarse Aggregate Relative Density (O.D.) Absorption
2.632 1.290
2.632 1.300
2.631 1.259
2.631 1.246
0.148 0.291
0.133 0.516
5 5 5 5
LS-621 Asphalt Coated Particles, %
38.800
39.800
31.230
31.191
1.088
1.192
4 4
Blank spaces represent not tested. * - Calculation considered outlier

- 7 -
MTO Aggregate and Soil Proficiency Sample Testing Program for 2010; MERO-040
Table 3. Summary of Results for Laboratory 47
TEST RESULTS FOR LABORATORY NUMBER 47 DATE PREPARED: November 9, 2010 FINE AGGREGATE REFERENCE SAMPLES 3.10 & 4.10
LABORATORY
DATA
MEAN OF
LABORATORIES
STANDARDIZED
DEVIATE
LAB
RATING
TEST METHOD
3.10
4.10
3
4
3
4
3 4
LS-605 – Fine Aggregate Relative Density (O.D.) Absorption
2.622 1.330
2.608 1.670
2.615 1.499
2.614 1.516
0.454 -0.900
-0.383 0.769
5 -5
-5 5
LS-606 – Coarse Aggregate MgSO4 Soundness Loss, %
1.900
2.800
5.900
5.457
-2.105
-1.646
-2 -3
LS-606 – Fine Aggregate MgSO4 Soundness Loss, %
-
-
-
-
-
-
-
LS-619 – Fine Aggregate Micro-Deval Abrasion
16.500
15.400
15.527
15.482
0.878
-0.073
5 -5
LS-602 – Fine Aggregate Percent Passing 2.36 mm Percent Passing 1.18 mm Percent Passing 600 μm Percent Passing 300 μm Percent Passing 150 μm Percent Passing 75 μm
36.400 23.400 15.200 11.000
8.900 7.400
41.920 29.750 20.100 14.600 11.600
9.400
38.512 26.366 17.986 12.868 10.292
8.501
39.034 26.801 18.319 13.146 10.533 8.696
-0.986 -1.403 -1.673 -1.653 -1.642 -1.669
1.254 1.305 1.047 1.215 1.208 1.078
-5 4 -4 4 -3 4 -3 4 -3 4 -3 4
Blank spaces represent not tested. * - Calculation considered outlier

- 8 -
MTO Aggregate and Soil Proficiency Sample Testing Program for 2010; MERO-040
Table 4. Summary of Results for Laboratory 47
TEST RESULTS FOR LABORATORY NUMBER 47 DATE PREPARED: November 9, 2010 SOILS REFERENCE SAMPLES 5.10 & 6.10
LABORATORY
DATA
MEAN OF
LABORATORIES
STANDARDIZED
DEVIATE
LAB
RATING
TEST METHOD
5.10
6.10
1
2
1
2
1 2
LS-702 – Sieve Analysis of Soil Percent Passing 2.00 mm
Percent Passing 425 μm
Percent Passing 75 μm
Percent Passing 20 μm
Percent Passing 5 μm
Percent Passing 2 μm
100.99 96.400 89.500 67.800 44.700 30.000
99.900 96.600
89.700 70.000 42.500 29.900
99.965 96.384 88.643 70.642 44.794 30.862
99.968 96.465
88.712 70.741 44.596 30.482
0.470 0.042 1.839 -0.645 -0.031 -0.313
-0.987 0.374
2.899 -0.175 -0.634 -0.172
- - 5 5
3 0 -5 -5 -5 -5 -5 -5
LS-703 Liquid Limit, %
28.600
28.500
27.034
27.168
1.204
0.931
4 5
LS-704 Plastic Limit, % Plasticity Index, %
16.600 12.000
16.400 12.200
15.293 11.824
15.190 11.898
1.328 0.124
1.123 0.195
4 4 5 5
LS-705 Specific Gravity of Soil
2.771
2.780
2.729
2.729
1.602
1.747
3 3
AGGREGATE CONSENSUS PROPERTIES
Uncompacted Void Content Sand Equivalent Value
Percent Fractured Particles
% Flat & Elongated Particles
43.600 29.800
78.400
1.000
43.000 31.000
89.400
1.130
43.016 35.835
74.628
1.568
42.997 35.732
75.137
1.370
0.758 -0.797
0.991
-0.683
0.005 -0.627
3. 773
-0.340
5 5 -5 -5
5 0
-5 -5
Blank spaces represent not tested. * - Calculation considered outlier
- 9 -
MTO Aggregate and Soil Proficiency Sample Testing Program for 2010; MERO-040
Figure 1. Examples of Scatter Diagrams
- 10 -
MTO Aggregate and Soil Proficiency Sample Testing Program for 2010; MERO-040
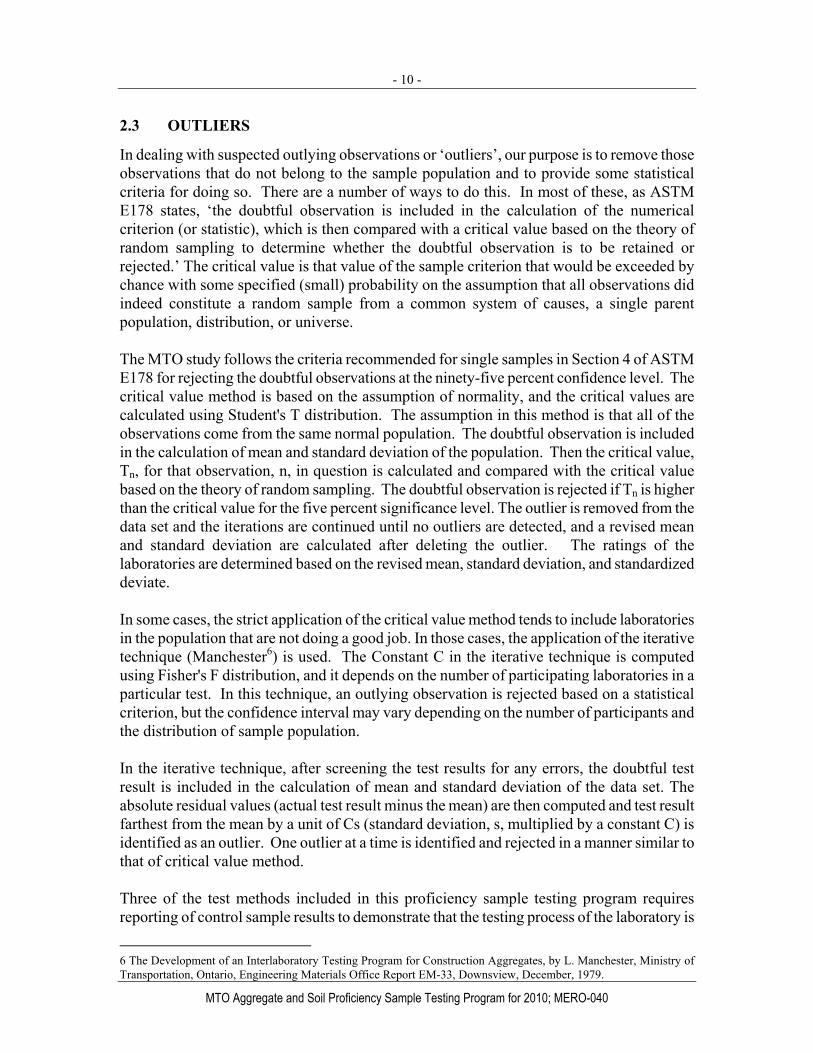
2.3 OUTLIERS
In dealing with suspected outlying observations or ‘outliers’, our purpose is to remove those observations that do not belong to the sample population and to provide some statistical criteria for doing so. There are a number of ways to do this. In most of these, as ASTM E178 states, ‘the doubtful observation is included in the calculation of the numerical criterion (or statistic), which is then compared with a critical value based on the theory of random sampling to determine whether the doubtful observation is to be retained or rejected.’ The critical value is that value of the sample criterion that would be exceeded by chance with some specified (small) probability on the assumption that all observations did indeed constitute a random sample from a common system of causes, a single parent population, distribution, or universe. The MTO study follows the criteria recommended for single samples in Section 4 of ASTM E178 for rejecting the doubtful observations at the ninety-five percent confidence level. The critical value method is based on the assumption of normality, and the critical values are calculated using Student's T distribution. The assumption in this method is that all of the observations come from the same normal population. The doubtful observation is included in the calculation of mean and standard deviation of the population. Then the critical value, Tn, for that observation, n, in question is calculated and compared with the critical value based on the theory of random sampling. The doubtful observation is rejected if Tn is higher than the critical value for the five percent significance level. The outlier is removed from the data set and the iterations are continued until no outliers are detected, and a revised mean and standard deviation are calculated after deleting the outlier. The ratings of the laboratories are determined based on the revised mean, standard deviation, and standardized deviate. In some cases, the strict application of the critical value method tends to include laboratories in the population that are not doing a good job. In those cases, the application of the iterative technique (Manchester6) is used. The Constant C in the iterative technique is computed using Fisher's F distribution, and it depends on the number of participating laboratories in a particular test. In this technique, an outlying observation is rejected based on a statistical criterion, but the confidence interval may vary depending on the number of participants and the distribution of sample population. In the iterative technique, after screening the test results for any errors, the doubtful test result is included in the calculation of mean and standard deviation of the data set. The absolute residual values (actual test result minus the mean) are then computed and test result farthest from the mean by a unit of Cs (standard deviation, s, multiplied by a constant C) is identified as an outlier. One outlier at a time is identified and rejected in a manner similar to that of critical value method. Three of the test methods included in this proficiency sample testing program requires reporting of control sample results to demonstrate that the testing process of the laboratory is
6 The Development of an Interlaboratory Testing Program for Construction Aggregates, by L. Manchester, Ministry of Transportation, Ontario, Engineering Materials Office Report EM-33, Downsview, December, 1979.
- 11 -
MTO Aggregate and Soil Proficiency Sample Testing Program for 2010; MERO-040
in control. The laboratories that report control sample results outside the range of values established for the material are identified during the screening of test results for any errors. These laboratories are manually removed from the data set during the analysis and considered as outliers.

- 12 -
MTO Aggregate and Soil Proficiency Sample Testing Program for 2010; MERO-040
3. Discussion The following discussion contains general and test-specific comments for the 2010 test period. Where ASTM, AASHTO or MTO precision statements are published for a given test, an attempt has been made to compare these with the statistics for this period. A discussion of statistical techniques is presented in the Glossary of Terms, found in Appendix A. 3.1 NOTES ON MATERIAL SOURCES
Materials used in this test period were as follows: • Coarse and fine aggregate tests, including Sieve Analysis, Percent Crushed Particles,
Petrographic Analysis (CA) , Freeze-Thaw, Moisture Density Relationship, Relative Density and Absorption (FA), Micro-Deval Abrasion Loss (FA), Uncompacted Void Content, Sand Equivalent Value, and Percent Fractured Particles – Erin Pit Granular A from James Dick Aggregates (MTO MAIDB No. O10-002).
• Coarse aggregate tests, including Wash Pass 75 μm, Percent Flat and Elongated Particles, Relative Density and Absorption (CA), Los Angeles Abrasion, Micro-Deval Abrasion Loss (CA), Magnesium Sulphate Soundness (CA), and Percent Flat, Elongated, or Flat and Elongated Particles –from James Dick Aggregates, Erin Pit (MTO MAIDB No. O10-002).
• Fine Aggregate Petrographic Examination - natural sand from James Dick Aggregates, Erin Pit (MTO MAIDB No. O10-002).
• Soil tests – “Huron Slope” Physiographic Region located near Parkhill in West Williams Township.
• Accelerated Mortar Bar test – natural sand from James Dick Aggregates, Erin Pit (MTO MAIDB No. O10-002), Spratt III control aggregate (MTO MAIDB No. O05-009), High alkali cement from Holcim (Canada) Inc., Concord, Ontario.
3.2 NOTES ON SAMPLE PREPARATION
The material processed for the coarse aggregate tests conforms approximately to the gradation requirements of Granular A. The aggregate samples were prepared using a large spinning riffler, developed and built by staff at the MTO Downsview Laboratory (refer to Figures 2 and 3 of Report MI-179, February 2000). The use of a spinning riffler ensures that, as far as possible, each sample is identical to every other sample. It has been found that this is the best technique for minimizing sample bias. A bobcat loader was used to fill an aggregate bin with small scoops from the stockpile, and the material was fed along a conveyor belt to fill 33 identical bags (fitted with funnels) on a spinning turntable. It was found that about 30 revolutions of the turntable were required to fill each bucket to 34 ± 2 kg of Granular A. This resulted in more homogeneity of the samples than would normally be the case using other techniques. In total, five hundred 34 ± 2 kg samples were prepared for
- 13 -
MTO Aggregate and Soil Proficiency Sample Testing Program for 2010; MERO-040
the tests on Granular A, and randomized for distribution to participating laboratories. The participants were responsible for the preparation of their own fine aggregate samples (3.10 and 4.10) from the two bags of Granular A supplied. In addition to Granular A, additional coarse aggregate samples consisting of almost 95% of the material retained on 4.75 mm sieve was also supplied for tests that require coarse aggregates. The number of revolutions of the turntable required for coarse aggregate to fill each bucket to approximately 26 ± 2 kg was found to be about 24 revolutions of the turntable. In total, five hundred 26 ± 2 kg samples were prepared for the coarse aggregate tests, and randomized for distribution to participating laboratories. Soil material was air-dried, processed to pass through a 2.0 mm sieve using a Fritsch Soil Mill Pulverizer, and placed in 20 kg buckets. Individual scoops were collected from each bucket and placed in a separate container. The material from the container was then transferred to the hopper of a small spinning riffle splitter. The hopper of the spinning riffler used is capable of filling 24 identical 2 kg containers per run. This method was used to create uniform 20 kg buckets. The correlation material was then prepared by obtaining representative samples from a 20 kg bucket. The material collected from the 20 kg bucket was then transferred to the hopper of the spinning riffler and the 500 g correlation samples were prepared. The samples were then randomized for distribution to participating laboratories. Insert a para on preparation of coarse and fine aggregates for mortar bar test. 3.3 NOTES ON INDIVIDUAL TESTS
For each test, comments have been made pertaining to the variation illustrated by the scatter diagram. The technique used to test for outliers is stated and, where possible, reasons for the outlying observations are offered. It is important to keep in mind that there are many variables influencing laboratory testing. A summary of the statistical data is presented in the Multi-Laboratory Precision Tables found in Appendix C. Besides the comparison made to ASTM, AASHTO or MTO precision statements, comparison of the variation between previous test periods is made for each of the tests. Because the materials usually differ from year to year, it is emphasized that the comparison between years should be used only as a guide. It is important to note that the yearly use of different materials will have some effect on the variation exhibited in some tests, while it will have relatively little effect on others. For example, the magnesium sulphate soundness test normally exhibits increased variation as higher mean loss is reported. A coarse aggregate sample having an average mean loss of twenty percent would likely show more variation than a coarse aggregate sample having an average mean loss of ten percent. On the other hand, a sieve analysis could be performed on those same two aggregates, with the percent passing each sieve and the variation being remarkably similar for the two samples.

- 14 -
MTO Aggregate and Soil Proficiency Sample Testing Program for 2010; MERO-040
3.4 PROFICIENCY SAMPLE TESTS
3.4.1 Wash Pass 75 μm (Coarse Aggregate) – Test No. 1
Two hundred and twenty-seven laboratories reported results for this test in 2010. Six outliers were identified and rejected using the critical value method. The standard deviation (0.19) obtained in 2010 is consistent with that of the values reported in the past three years and the multi-laboratory variation (0.22) published by ASTM C117 for aggregates with less than 1.5% material passing the 75 µm sieve. The mean value of the aggregate used in 2010 consisted of 0.55% material finer than 75 µm and is well within the range for which the ASTM precision statement was developed. However, the scatter diagram shows a combination of random variation and laboratory bias for some laboratories. The laboratories that are identified as outliers or with a zero rating should examine their test procedure more closely, especially the achievement of constant dry mass at the beginning and end of the test.
3.4.2 Sieve Analysis (Coarse Aggregate) – Test Nos. 2 to 6
These tests represent the coarse aggregate portion of the Granular A sample gradation. Tests 20-25 carried out on the material passing 4.75 mm sieve as prepared by the participants (samples 3.10 and 4.10) represent the remainder of the gradation. The data is presented in percent passing format and is compared to precision statements developed in the same format by Vogler and Spellenberg7. The Granular A samples supplied for the sieve analysis tests consisted of approximately 46.2% of the material retained on 4.75 mm sieve, and conform to the grading of materials (Granular A) used in the past MTO Aggregate and Soil Proficiency Sample Testing Programs. The gradings reported for Test Nos. 2- 6 represent the combined gradings of coarse and fine aggregates. The samples were prepared with a large spinning riffler that is described in Section 3.2. The variations found in 2010 for the coarse sieves are significantly higher than the values obtained in 2009. However, the variations are consistent with that of the values obtained in 2008. Further, the standard deviations obtained for all of the sieves, with the exception of 19.0 mm sieve, are also significantly lower than that of the expected variations given in the ASTM precision statements. Two hundred and twenty-seven laboratories reported results for the sieve analysis test in 2010. Outliers were eliminated using the critical value method. Successive scatter diagrams show a fairly uniform distribution of points about the mean (i.e. a random variation with little laboratory bias). The number of outliers identified varies from sieve to sieve, and ranges from none for the 19.0 mm sieve to a maximum of three for 16.0 mm and 4.75 mm sieves.
7 Vogler, R.H., Department of Transportation, Michigan, AASHTO Technical Section 1c; T27 and Spellenberg, P.A., AASHTO Materials Reference Laboratory; Unpublished Paper.

- 15 -
MTO Aggregate and Soil Proficiency Sample Testing Program for 2010; MERO-040
Possible reasons for outlying observations include factors that impact the measurement process such as sieve condition (state of repair and cleanliness), efficiency of the sieving process and apparatus, initial sample mass, and mass on a given sieve. If your laboratory has performed poorly in this test period, you should inspect your sieves (use CAN/CGSB-8.1-88 or ASTM E11 as guides) and your sieve shaker(s) thoroughly, and, once satisfied that they are in order, perform a sieving efficiency test (MTO LS-602) to pinpoint any problems.
3.4.3 Los Angeles Abrasion Loss (Coarse Aggregate) – Test No. 8
Only thirteen laboratories reported results for this test in 2010. No outlier was detected by the use of critical value method or iterative technique. Considering the number of observations (13) used, the analysis may not yield meaningful or representative statistical data. The lower left and upper right quadrants together account for ten of the thirteen points, which is evidence of significant laboratory biases. This test shows systematic variation, as was found in previous years. However, the standard deviations in 2010 are slightly lower than the values found in 2009. ASTM precision statements for 19.0 mm maximum size coarse aggregate, with percent loss in the range 10% to 45%, give a multi-laboratory coefficient of variation of 4.5%. Therefore, results from two different laboratories should not differ by more than 12.7%. The mean in this test (22.2%) is in the range of values for which ASTM C131 data was established. This year’s coefficient of variation (average 5.9%) is slightly higher than that of the value, 4.5%, given in the ASTM precision statements.
3.4.4 Relative Density (Coarse Aggregate) – Test No. 9 and Absorption (Coarse Aggregate) – Test No. 10
One hundred and eleven laboratories reported results for these tests in 2010. Six laboratories in Test No. 9 and two laboratories in Test No. 10 were eliminated using the critical value method. The standard deviations obtained for bulk relative density (Test No. 9) are consistent with the values that were reported in the past three years, and are considerably less than that of the value given in the ASTM precision statements. In the case of absorption test (Test No. 10), the coefficient of variation obtained in 2010 (8.4%) is noticeably less than that of the values (9.1% to 15.3%) reported in past three years studies and the precision estimate provided in ASTM C 127 - 88. The latest version of ASTM C127-07 does not provide precision estimate for the absorption test. The expected variation shown on the precision table in Appendix C is based on the previous publication C127-88. The scatter diagram for Test No. 9 shows random variation with little laboratory bias. However, for Test No. 10, it shows a combination of random variation and laboratory bias for some laboratories.
3.4.5 Magnesium Sulphate Soundness (Coarse Aggregate) – Test No. 11
Forty-one laboratories reported results for this test in 2010. One outlier was identified by the use of the iterative technique. The scatter diagram shows a strong laboratory bias and all the points, with the exception of five (12%), are accounted in the lower left and upper right quadrants. This test has historically shown high coefficients of variation due to the difficulty
- 16 -
MTO Aggregate and Soil Proficiency Sample Testing Program for 2010; MERO-040
of maintaining solution of the correct density and insufficient drying by some laboratories. The coefficient of variations obtained in 2010 (30.7%) is within the range of values (25.7% to 35.4%) obtained in the past three years. The mean in this test (5.7%) is lower than the range of values for which ASTM C88 precision estimate was established. However, the coefficient of variation obtained in 2010 is slightly higher than that of the value published in the ASTM precision statements. ASTM reports a multi-laboratory coefficient of variation of 25% for coarse aggregate with percent loss in the range of 9% to 20%.
3.4.6 Percent Crushed Particles – Test No. 12 and Percent Cemented Particles – Test No. 7
In conjunction, the Test Method MTO LS-607 for percent crushed particles also covers the visual determination of the percent, by mass, of cementations in processed coarse aggregate. It is important to note that the test requires reporting of results for both percent crushed particles and percent cement particles, if present in the sample. The Granular A samples supplied for 2010 Proficiency Sample Testing Program consisted of noticeable amount of cemented particles. This year, two hundred and twenty-seven laboratories submitted results for this test. Thirteen of those participants did not report results for the percent cemented particles and failed to complete the test in accordance with the procedures. These labs were excluded from the analysis and identified as outliers. In addition, eight outliers were selected by employing the critical value method. The standard deviations obtained (5.1% and 5.4%) in 2010 are slightly lower than the values (6.0% and 7.1%) reported in 2009 and the value (6.0%) obtained during the 1989 MTO workshop. The mean in this test (72.2%) is within the range of values (50% to 75%) for which the MTO precision statement was established. The scatter diagram shows a random variation and operator bias for some laboratories. ASTM has a very similar test method (D 5821) but has not conducted interlaboratory studies to determine precision and currently publishes precision data (standard deviation of 5.2% for a mean value of 76.0%) obtained from MTO study. The Granular A supplied for this test was examined prior to our material selection process for the 2010 program. Our examination of the material indicated percent of cemented particles in the range of 4% to 6%. However, the results reported by the participants, after the removal of outliers, range from 0% to as high as 18% with an average mean value of 6.5%. There is no record of past performance or precision estimate to compare with the standard deviations (3.8% and 4.0%) obtained for the cemented particle test. Same as the percent crushed particles, the scatter diagram provided for this test also shows a combination of random variation and laboratory bias for some laboratories.
3.4.7 Percent Flat and Elongated Particles – Test No. 13
The determination of a flat and/or elongated particle is dependent on operator skill and judgement in using the measurement tool. The ASTM and CSA procedures use a proportional calliper device to measure the greatest length or width to thickness ratio. The MTO procedure previously measured the ratio of mean length or width to the mean thickness (MTO Laboratory Manual Revision 15 and earlier). The MTO procedure (Revision 16 and up) has been modified to agree with the ASTM definition. All participants should be using the latest MTO version of the test.
- 17 -
MTO Aggregate and Soil Proficiency Sample Testing Program for 2010; MERO-040
Two hundred and twenty-one laboratories reported results for this test in 2010. The critical value method was used to reject four outliers. ASTM D4791 and CSA A23.2-13A do not report precision statements for this test method. MTO Test Method LS-608 provides estimates of precision for coarse aggregate passing 19.0 mm and retained on 4.75 mm. The coefficient of variation, 36.2%, obtained in 2010, is noticeably less than the values reported in 2008 (50.0%) and 2009 (41.5%), and the precision estimate of 41% published by MTO. The scatter diagram provided in the Appendix D1 shows a combination of random variation and laboratory operator bias for some laboratories. In general, laboratories that reported values in excess of 12% and below 3% should critically examine their equipment and procedure.
3.4.8 Petrographic Number (Concrete) – Test No. 14
The coarse aggregate material examined in 2010 was Granular A from the Erin Pit owned by James Dick Aggregates (MTO MAIDB No. O10 - 002). Twenty-eight submissions were received from twenty-six different analysts representing twenty-three laboratories for the 2010 program. Additional samples were supplied to the laboratories that had more than one analyst participate in the program. A unique lab number was assigned to every petrographic analyst who submitted results. Two of the twenty-three participating laboratories reported results from more than one analyst. The material for the 2010 petrographic analysis was chosen not only for the variety of rock types and range in particle quality but also to test how each laboratory prepared the sample for analysis including which fractions were examined. Approximately 47% of the Granular A in samples 1.10 and 2.10 was coarse aggregate (retained 4.75mm). It is this portion that the test is performed on. Note 1 of MTO Test Method LS-609 states that the petrographic examination is generally performed on the material passing the 19.0mm sieve and retained on the 9.5mm sieve (full fraction). The full fraction should consist of material passing 19.0mm/retained 16.0mm, passing 16.0mm/ retained 13.2mm, and passing 13.2mm/ retained 9.5mm, proportioned according to the as received coarse aggregate sample grading. If the full fraction constitutes less than 68.5 % of the retained 4.75mm portion of the sample, the material passing 9.5mm/ retained 6.7mm shall also be examined. The note further states that if these fractions together constitute less than 68.5% of the sample, then the material passing 6.7mm/ retained on 4.75mm shall also be examined. When the test is performed on more than one size fraction, a weighted average petrographic number is calculated by multiplying the percentage of each fraction by the petrographic number for that fraction, adding these products, and dividing by 100. Untested coarse aggregate fractions that represent less than 5% of the sample are considered to have the same petrographic number value as the next larger or smaller fraction tested for the purpose of calculating a weighted average petrographic number. If the untested fraction falls between two tested fractions an average of the tested fractions should be applied. Publications by MTO (EM-91) and others (ASTM STP 1061 Rogers, 1989) also indicate that where a coarse

- 18 -
MTO Aggregate and Soil Proficiency Sample Testing Program for 2010; MERO-040
aggregate fraction exceeds 5% of the as received coarse aggregate sample grading, it too should be examined. Appropriate masses for fractions to be examined are indicated in LS-609. These masses ensure a statistically representative number of particles (minimum 200) are examined for each individual fraction. The coarse aggregate gradation of the material tested in this year’s program consisted of approximately 7.4% retained 19.0mm, 15.7% retained 16.0mm, 14.3% retained 13.2mm, 24.5% retained 9.5mm, 19.6% retained 6.7mm and 18.5% retained 4.75mm. Considering this gradation the correctly proportioned 1000g full fraction should consist approximately of: 288g of material retained on 16.0mm, 262g retained on 13.2mm and 450g retained on the 9.5mm sieve. In addition, because the full fraction constitutes less than 68.5% of the sample (approximately 54.5%) ideally a minimum of 200g of the retained 6.7mm fraction (as per the table on page two of test method LS-609) should also have been examined separately and a weighted average petrographic number calculated based on the coarse aggregate gradation. The pass 22.4mm retained 19.0mm fraction (7.4%) and the pass 6.7mm retained 4.75mm fraction (18.5%) of the samples are both greater than 5% of the ‘as received’ sample. The test method is not clear if these fractions are to be examined separately or ignored. In addition the test method fails to indicate if or how these fractions are to be included within a weighted average petrographic number calculation. There is a need to rewrite and/or better clarify portions of LS-609 for its users. Similar test methods ASTM C295 and CSA A23.2-15A indicate that sieve fractions should be examined separately and weighted averages calculated for the various components present in a sample. Of the 28 submissions received, 16 participants indicated they examined the full fraction for their analyses. Of the remaining 12 participants 2 indicated that they had tested the pass 19mm/ retained 4.75mm fraction (unspecified proportions), 3 participants indicated they had tested the 19mm fraction (unspecified if this was retained or passing or in what proportions), and the remaining 7 participants did not indicate the fraction on which they performed the analysis (it is assumed that the full fraction was examined). One laboratory submitted worksheets for the retained 6.7mm fraction as per the test method but did not attempt to calculate a weighted average petrographic number. In this case the reported full fraction petrographic number (retained 9.5mm) was used. Three samples of the full fraction portion of the test material were examined by three different analysts at MTO in spring of 2010. The material was found to consist of 87-91% good aggregate, 5-8% fair aggregate and 3-5% poor aggregate with petrographic numbers ranging from 129 to 142. No deleterious aggregate was observed. The good aggregate portion consisted of 74-82% carbonate rock types 1, 20, 2 and 21; and 10-15% silicate rock types 3, 4, 5, 8, 9 and 22. Fair aggregate rock types observed included 41, 40, 30 and 52. Encrustation (rock type 52) observed ranged from 1.6-4.4%. Poor aggregate rock types observed typically consisted of partial or total cementations (rock types 53 and 54) ranging in combined amounts from 1.5-5.2% of the sample. The petrographic numbers (PN) reported as part of the 2010 program range from as low as 121.4 to as high as 195.0. The wide variation in the PN reported may have resulted partly from the inconsistency in the fractions of the samples examined by the analysts and also, not interpreting the test method uniformly. It is also suspected that some labs may have
- 19 -
MTO Aggregate and Soil Proficiency Sample Testing Program for 2010; MERO-040
performed the test on the 19mm concrete stone material supplied rather than the Granular A material. Aggregate materials present in the James Dick Erin Pit that could cause increases in the reported PN were poor and fair rock types 52, 53 and 54 (encrustation, partial and total cementation) and also type 56 (siltstone). In particular the partial and total cementation content tends to be more prevalent in the coarser particle sizes and was more abundant in the 19mm concrete stone material than in the Granular A. The results shown on the scatter diagram (Appendix D1) may be placed into three distinct groups to show the extent of the variation in the reported PN. No analysis was performed on the data to identify outliers or to provide laboratory ratings. Detailed examination of each worksheet submitted indicates that almost all laboratories correctly identified the main rock types present in the sample. The similar ASTM standard for this test, C-295, does not report a petrographic number and has no precision statement.
3.4.9 Petrographic Analysis (Fine Aggregate)
The fine aggregate examined in 2010 was natural sand from James Dick Aggregates, Erin Pit (MTO MAIDB No. O10-002). The sand contained no crusher screenings therefore the percentage of totally crushed particles should be extremely low. This material was also used as sample 1.10M for the accelerated mortar bar testing portion of this year’s Proficiency Sample Testing Program (see Test No. 123, Section 3.4.18 of this report). Twenty four worksheets were submitted from 12 laboratories with participation from 10 different analysts. Six labs did not use the worksheet provided in the test method. Eight labs did not indicate the percentage of material in the minus 75 µm fraction. Ten labs did not use the minus 75 um portion in the weighted average calculations, although this fraction is fairly insignificant. For this reason the weighted averages as reported, or calculated where not reported, were used. Based on the analyses submitted, the sample contained a weighted average of 52% silicate rocks and associated minerals, 45% carbonate rocks and associated minerals, <1% shale, < 1% mica, <<1% chert and approximately 1% cemented particles. In general the amount of silicate rocks and minerals increased with a decrease in particle size. Correspondingly the amount of carbonate rocks and minerals in the sample decreased with a decrease in particle size. Four labs indicated more silicate rocks and minerals and less carbonate rocks and minerals in the pass 4.75mm/ retained 2.36mm, pass 2.36mm/ retained 1.18mm and pass 1.18mm/ retained 0.600mm fractions as compared with other laboratories. This is not necessarily incorrect as much of the material present in the sample is derived from silty to sandy carbonates (see Test No. 14, Section 3.4.8 of this report). Therefore, it would have been a judgement call by the analyst as to whether they classified material as a sandstone to siltstone with a carbonate cement matrix or a carbonate rock with silt to sand-sized silicate grains (depending on the observed proportion of silicate grains to carbonate cement). The amounts of cemented particles decreased with decreasing particle size. An average of 4.2% cemented particles was reported in the pass 4.75 retained 2.36mm fraction, 1.8% in the

- 20 -
MTO Aggregate and Soil Proficiency Sample Testing Program for 2010; MERO-040
pass 2.36 retained 1.18mm fraction and 0.41% in the pass 1.18mm retained 600 µm fractions. Mica increased with decreasing particle size with an average of 1.5 % mica reported in the pass 0.300mm/ retained 0.150mm fraction and an average of 2.10% mica reported in the pass 0.150mm/ retained 0.075mm fraction. The similar ASTM standard for this test, C295, has no precision statement.
3.4.10 Micro-Deval Abrasion (Coarse Aggregate) – Test No. 16
Seventy-four laboratories reported results for this test in 2010. The test method requires reporting of control sample results to demonstrate that the testing process is in control. This year, three laboratories reported control sample results outside the established range and the labs were excluded from the analysis and identified as outliers. In addition, two outliers were rejected using the iterative technique. The multi-laboratory coefficient of variation of 5.6% published in the MTO LS-618 is for 19.0 mm maximum size aggregate with abrasion losses in the range from 5% to 20%. The mean loss of 17.1% in this year program is within the range of values for which the precision estimates were established. The average coefficient of variation of 5.0% obtained in 2010 is slightly lower than the value published in LS-618, and that of the values reported in the past three years (5.5% to 7.7%). The scatter plot for this test shows random variation with little laboratory bias.
3.4.11 Freeze-Thaw Loss – Test No. 17
Fifty-seven laboratories reported results for this test in 2010. The test method requires reporting of laboratory control sample losses to demonstrate that the testing process is in control. This information is used to alert the laboratory to testing deficiencies. Without testing of the reference material, the test is invalid (see MTO Test Method LS-614, Section 9.1). This year, all of the laboratories reported control sample results within the established range. Four outliers were selected using the iterative technique. The multi-laboratory coefficient of variation of 21% published in the MTO LS-614 is for coarse aggregate with freeze-thaw losses in the range of 5% to 18%. The coefficient of variation obtained in 2010 (21.9%) is in the range of value, 21%, published in the MTO precision statements and the values (16.9% to 21.3%) reported in the past three years. All of the points on the scatter plot, with the exception of nine, are accounted in the lower left and upper right quadrant, indicating a strong laboratory bias. The results reported by the four outlier laboratories deviate considerably from the mean values. It is likely that there are two main reasons for the wide spread of their data: insufficient damage caused by freezing, which may be due to freezing too rapidly or difference in sieving intensity. The laboratories identified as outliers should modify their processes to try and achieve losses closer to the mean loss of the control aggregate. Test Method LS-614 (Appendix 1) in the MTO Laboratory Testing Manual gives a procedure for determining and adjusting sieving time for quantitative analysis.
- 21 -
MTO Aggregate and Soil Proficiency Sample Testing Program for 2010; MERO-040
3.4.12 Sieve Analysis (Fine Aggregate) – Test Nos. 20-25
The test samples for this procedure were prepared by the participants from the material passing the 4.75 mm sieve of the coarse aggregate gradation. This process closely follows the normal testing procedure in which the laboratory prepares its own test samples from the field sample. The scatter diagrams for the fine aggregate sieve analysis show random variation with little laboratory bias. The standard deviations of the fine sieves, with the exception of 300 μm and 600 μm sieves, in 2010 are slightly higher than that of the values reported in the past three years of study. The multi-laboratory variations are also significantly higher than that of the values published in the ASTM C136 precision statements. As in previous interlaboratory studies, it was found that the precision of the test varies as a function of the amount of material retained on any sieve. The smaller the amount of material retained on the sieve, the more efficient the sieving process and the better the precision. When there is a small amount of material on a sieve (one layer of particles or less), the particles have a greater chance of falling through the sieve in a given time. The number of outliers identified varies from sieve to sieve, and it ranges from eleven for 2.36 mm and 1.18 mm sieves to a maximum of fourteen for the 75 μm sieve. Outlier labs with a very low percent passing the 75 μm sieve should inspect their sieves, as low percent passing may be the result of the sieve being blinded when washing the sample. An ineffective washing process will also result in a low percent passing the sieve.
3.4.13 Relative Density (Fine Aggregate) – Test No. 27 and Absorption (Fine Aggregate) – Test No. 28
MTO has identified Test Method LS-605 for determination of relative density and absorption of fine aggregates and the participants in the program were asked to test the samples according to this test procedure. This test method follows ASTM C128, except that it requires the removal of materials finer than 75 µm from the test specimen. The significant difference between the methods is that MTO LS-605 requires the test specimens to be prepared in duplicate and washed on the 75 µm sieve until all of the material finer than 75 µm is removed. The presence of material finer than 75 µm in the test specimens can result in lower relative densities and higher absorption values. One hundred and five laboratories reported results for these tests. Ten outliers for Test No. 27 and seven outliers for Test No. 28 were selected using the iterative technique. As in previous years, greater variation exists in this test compared to the relative density test on coarse aggregate. It is imperative that differential drying of the various sized particles be avoided by constant stirring of the sample under the air current during the drying process. As short as 30-second periods of rest can be detrimental to the outcome of the test results. Differential drying of the particles is known to cause premature collapse in the cone test used to judge the saturated surface dry state. The resulting test observations are lower relative densities and higher absorption values. The standard deviations obtained in 2010 for both relative density and absorption is slightly higher than the values that were reported in the past three years. However, the multi-laboratory variations obtained in 2010 are significantly lower than that of the values
- 22 -
MTO Aggregate and Soil Proficiency Sample Testing Program for 2010; MERO-040
published in the ASTM precision statements. The scatter plots for both tests show a combination of random variation and laboratory bias for some laboratories.
3.4.14 Amount of Asphalt Coated Particles in Coarse Aggregate – Test No. 30
Two hundred and twenty-seven laboratories reported results in 2010. Four laboratories were identified as outliers using the iterative technique. The scatter plot shows a combination of random variation and laboratory bias for some laboratories. The MTO Test Method LS-621 provides precision estimate for 19.0 mm maximum size coarse aggregate mixed with asphalt coated particles in the range of 25% to 45%. The coefficient of variation obtained in 2010 (22.7%) is significantly higher than the values reported in the past three years and that of the precision estimate (9.6%) published in the MTO LS-621. Laboratories that reported values of less than about 17% and above 45% should critically evaluate their interpretation of the definition and re-examine their samples. There is no comparable or similar ASTM test procedure.
3.4.15 Moisture-Density Relationship (One-Point Method) – Test Nos. 31-33
Participants were asked to perform this test on the finer portion of the Granular A (i.e. material passing the 4.75 mm sieve) supplied. The test samples were prepared by the participants from the bulk samples 1.10A and 2.10A. One hundred and sixty-one laboratories reported results for this test in 2010. Twelve outliers for Test No. 31 and seventeen outliers for Test No. 33 were rejected using the iterative technique. The standard deviations obtained in 2010 for all three tests, i.e. wet density (Test No. 31), dry density (Test No. 32), and optimum moisture content (Test No. 33), are significantly lower than the values reported in the past three years and the precision estimates published in MTO LS-623. The majority of the points in the scatter diagrams are accounted in the lower left and upper right quadrant of the plots, indicating strong laboratory bias. The possible causes for the strong laboratory bias may be operator error and the use of an improper mould, even though the participants were requested to use only the 152.4 mm diameter mould. This test also requires significant operator skill to obtain the point within the band in the first attempt. Those laboratories with poor ratings should examine their equipment and procedure to discover the causes for this variation. There is no comparable or similar ASTM test procedure. However, the Test Method ASTM D698 covers the laboratory compaction characteristics of soils and reports precision estimates from the tests conducted on clayey soils.
3.4.16 Micro-Deval Abrasion (Fine Aggregate) – Test No. 34
Participants in this test were asked to prepare their own sample from the bags of bulk Granular A supplied. Seventy-four laboratories reported results for this test in 2010. The test method requires reporting of control sample test results to demonstrate that the testing
- 23 -
MTO Aggregate and Soil Proficiency Sample Testing Program for 2010; MERO-040
process is in control. This year, five laboratories reported control sample results outside the range established for the material. These labs were identified as outliers and manually removed from the statistical analysis. MTO Test Method LS-619 provides precision estimates for fine aggregates with the abrasion loss in the range of 7% to 30%. The coefficients of variations of 7.1% obtained in 2010 is noticeably lower than the precision estimate (8.7%) published in MTO LS-619 and consistent with the values (7.2% to 8.7%) reported in the past two years. No outlier was selected by the use of critical value method or iterative technique. The majority of the data points are located in the lower left and upper right quadrant of the scatter diagram indicating a strong laboratory bias.
3.4.17 Accelerated Mortar Bar – Test No. 123
Unlike other aggregate tests, the accelerated mortar bar test is not included in the Aggregate and Soil Proficiency Sample Testing Program each year. This test was last conducted along with the MTO Proficiency Sample Testing Program in 2004. The data from 2010 program will be used to update the participants list. Twenty laboratories requested samples and nineteen of them returned their test results. The participants in this test were supplied with natural sand (Sample 1.10), coarse aggregate (Sample 2.10) from the Sprat III control aggregate and standard cement. The participants were asked to test three mortar bars made with each aggregate samples supplied. Standard cement was supplied with the expectation to reduce the variability from participants using cement from different sources or choice of their own. The participants reported expansion of the individual bars and the average of three bars after 7, 13, 14, 15, 21 and 28 days. Only the average expansion after 14 days was analysed and shown on the scatter diagram in the Appendix D1. Iterative technique was employed to reject one outlier from the data set for Sample 1.10. The scatter diagram indicates a strong laboratory bias. The laboratory bias is resulting from some of the laboratories that report high expansion value for Spratt III control aggregate tends to get a high value for the natural sand. The mean expansion at 14 days obtained from this study is 0.373% for Spratt III and 0.191% for the natural sand. The standard deviations obtained for Spratt III and natural sand are 0.045 and 0.028, respectively. The standard deviations obtained in this study are noticeably lower than that of the values (0.051 for Spratt II with a mean value of 0.410 and 0.035 for natural sand with a mean value of 0.196) found in the 2004 MTO Proficiency Sample Testing Program. The multi-laboratory standard deviations obtained in 2010 as well as in 2004 are proportional to the amount of expansion and are consistent with the findings of Rogers (1999). The coefficient of variation found in 2010 for natural sand (14.1%) and Spratt III (12.1%) with an overall average variation of 13.4% is slightly lower than the findings by Rogers (1999), and the precision statement published by ASTM C1260. A slightly lower multi-laboratory variation found in the 2010 study may be attributed to the use of standard cement. However, the study by Rogers (1999) suggests that the use of standard cement to improve the multi-laboratory precision may not be worthwhile.

- 24 -
MTO Aggregate and Soil Proficiency Sample Testing Program for 2010; MERO-040
3.4.18 Particle Size Analysis of Soil – Test Nos. 40-45
The ministry has included the MTO Test Method LS-702, in its annual proficiency sample testing program for more than ten years. Based on the data sheets submitted by the laboratories, all of the laboratories performed the test in accordance with MTO LS-702. Seventy-four laboratories participated in the hydrometer test in 2010. Test No. 40 is reported for information purposes only, because sixty-seven of the participants in this test reported 100% passing 2.00 mm sieve. Outliers were selected using the iterative technique. The number of outliers identified range from one for percent passing 20 um to as high as eleven for passing 75 µm Successive scatter diagrams for this test show significant laboratory biases. The standard deviations obtained in 2010 are consistent with the results reported in the past three years. The laboratories that are identified as outliers should examine their equipment and procedure very carefully to ensure that all is within specification and the procedure is followed exactly.
3.4.19 Atterberg Limits of Soil – Test Nos. 46-48
Ninety laboratories reported results for Atterberg limit tests in 2010. Six outlier laboratories for liquid limit (Test No. 46) and four for plastic limit test (Test No. 47) were identified using the iterative technique. The scatter plots for both liquid and plastic limit tests as well as for plasticity index (Test No. 48) show strong laboratory bias. Both liquid and plastic limit tests require significant operator skills. Liquid limit test also requires good condition and calibration of the apparatus. Close attention to the condition and calibration of the liquid limit apparatus and employing skilled technicians may reduce the laboratory biases. The variations obtained for liquid and plastic limit tests in 2010 are consistent with those of the values reported in the past three years. Further, the standard deviations obtained for plastic limit and plasticity index are consistent with the values published in the ASTM precision statements. However, the standard deviations obtained for liquid limit test are significantly higher than that of the precision estimate published in ASTM D 4318.
3.4.20 Specific Gravity of Soils – Test No. 49
The participants were requested to perform this test according to MTO Test Method LS-705. This test method requires that the test be performed on a minimum of three specimens, and the difference between the largest and smallest (range) specific gravity values of the test specimens determined is within 0.02. Further, it requires that the test be repeated if the range exceeds the specified limit. The laboratories that reported results with the range in excess of 0.02 are not capable of repeating the test within their testing environment. This year, five laboratories were removed for exceeding the specified limit of 0.02. These laboratories are manually deleted from the analysis and identified as outliers. Sixty-five laboratories reported results for this test in 2010. Two outliers were identified using the critical value method. Ninety-one percent of the plots are located in 1st and 3rd quadrants of the scatter diagram showing a strong laboratory bias. Several steps in this test procedure can influence the results, particularly the equipment and method employed for

- 25 -
MTO Aggregate and Soil Proficiency Sample Testing Program for 2010; MERO-040
preparation of test specimen and removal of entrapped air in the pycnometer or flask. Laboratories finding themselves in this situation should examine their equipment and procedure very carefully. The standard deviations obtained in 2010 are consistent with the results reported in the past three years. MTO LS-705 is similar to that of AASHTO T 100, which reports a multi-laboratory standard deviation of 0.04. As in the past three studies, the standard deviations obtained in 2010 are also significantly lower than that of the precision estimate published in the AASHTO T 100.
3.5 SUPERPAVE CONSENSUS PROPERTY TESTS
3.5.1 Uncompacted Void Content (FA) – Test No. 95
The participants were asked to perform the test in accordance with MTO Test Method LS-629, using the fine aggregate prepared by splitting the material passing 4.75 mm sieve. This test method is a modified version of AASHTO T 304. MTO LS-629 follows Method A of AASHTO T 304, except for the preparation of the test specimen to be used in the determination of bulk specific gravity of fine aggregates. The significant difference between the methods is that MTO LS-629 requires the test specimens be washed on the 75 µm sieve until all the material finer than 75 µm is removed. In addition, MTO LS-629 specifies that the bulk relative density is determined using the graded sample and not the individual size fraction method described in Clause 9.4 of AASHTO T 304. Further, the participants were advised to compute the uncompacted void contents of Samples 1.10 and 2.10 using the bulk relative densities reported for Test No. 27, determined according to MTO LS-605. Sixty-six laboratories submitted results for this test in 2010. Eight laboratories were identified as outliers using the iterative technique. The scatter diagram shows a combination of random variation and laboratory bias for some laboratories. The standard deviations obtained in 2010 (0.77 and 0.67) are slightly higher than the values obtained in the past three years. The standard deviations obtained for both samples are significantly higher than the value (0.33%) published in the ASTM precision statements for graded standard sand. The estimates of precision in ASTM C1252 are based on graded sand as described in ASTM C778, which is considered rounded, and is graded from 600 µm to 150 µm, and may not be typical of the samples that were used in this testing program. The uncompacted void contents reported are based on the bulk relative density determined by the individual laboratories and this further compounds the variations associated with the results of this test. ASTM C1252 suggests that a difference in relative density of 0.05 will change the calculated void content by about one percent. The laboratories that are identified as outliers must review their test procedures and the skill of the technician.
3.5.2 Sand Equivalent Value of Fine Aggregate – Test No. 96
Participants were asked to prepare the fine aggregate sample for this test by splitting the Granular A material passing 4.75 mm sieve. Two alternate procedures for the preparation of
- 26 -
MTO Aggregate and Soil Proficiency Sample Testing Program for 2010; MERO-040
test specimen (air-dry or pre-wet) are allowed in both ASTM and AASHTO methods. The participants were given the option of preparing the test specimen in accordance with either method. Sixty-two laboratories reported results for this test in 2010. Two outliers were identified by the use of iterative technique. The lower left and upper right quadrants of the scatter diagram together account for 97% of the points showing strong laboratory bias. The standard deviations obtained in 2010 (7.6 and 7.5) are significantly higher than the values reported in the past three years, but the values are consistent with the multi-laboratory precision value (8.0) published by ASTM for samples with sand equivalent value less than 80.
3.5.3 Percent of Fractured Particles in Coarse Aggregate – Test No. 97
The Granular A samples supplied did not contain adequate material retained on 19.0 mm sieve. For this reason, the participants were advised to perform the test on coarse aggregate passing the 19.0 mm sieve only. Seventy laboratories submitted results for this test in 2010. Three outliers were detected using the iterative technique. The scatter diagram shows a strong laboratory bias. The average mean values obtained by the ASTM D5821 method (74.8%) and MTO versions (72.2%) on the same aggregate differ by 2.6%, which is well within the acceptable limit published by ASTM for the test results from two different laboratories. However, the standard deviation obtained by ASTM (3.8%) is significantly lower than that of the MTO version (5.2%). The ASTM test method is very similar to MTO Test Method LS-607, but ASTM has not conducted interlaboratory studies to determine precision and currently publishes statistical data provided by MTO. The variations obtained in 2010 (3.8%) is significantly lower than the values obtained in 2009 and the value (5.2%) published in ASTM precision statements.
3.5.4 Percent Flat and Elongated Particles in Coarse Aggregate – Test No. 99
The coarse aggregate samples supplied did not contain adequate material retained on 19.0 mm sieve. In view of this, the participants were advised to perform the test on coarse aggregate passing the 19.0 mm sieve only, using a ratio of 5:1. Seventy-two laboratories reported results for this test in 2010. Three outliers were detected using the iterative technique. The standard deviations obtained in 2010 are consistent with the values reported in 2009 study. However, the average coefficient of variation of 52.4% obtained in 2010 is lower than the values obtained in 2008 (63.5%) and 2009 (58.7%). The majority of points on the scatter plot are located in the 1st and 3rd quarter indicating significant laboratory bias. The ASTM D 4791 provides precision estimates for three individual fractions ranging from 19.0 mm to 13.2 mm, 13.2 mm to 9.5 mm, and 9.5 mm to 4.75 mm. However, the results reported are on the basis of weighted average and a comparison cannot be made with the precision estimates published in ASTM
- 27 -
MTO Aggregate and Soil Proficiency Sample Testing Program for 2010; MERO-040
4. Laboratory Rating System The laboratory rating system assigns separate overall ratings for each category of laboratories, i.e., low complexity (Production) aggregate laboratories, high complexity (Full Service) aggregate laboratories, Soil laboratories, and for Superpave laboratories. Laboratories must participate in all of the tests that are listed under each category (i.e., Production, Full Service, Soil and Superpave) to assign overall laboratory rating. Production (CCIL Type C) laboratories are required to carry out wash pass 75 μm, sieve analysis, percent crushed particles, percent asphalt coated particles, and percent flat and elongated particles tests. In addition to those tests, Full Service laboratories (CCIL Type D) must carry out micro-Deval (coarse and fine), freeze-thaw, and/or magnesium sulphate soundness, relative density and absorption (coarse and fine) tests. Soil laboratories are required to carry out particle size analysis, Atterberg limits, and specific gravity of soil. Superpave aggregate laboratories are required to perform all four consensus property tests (i.e. uncompacted void content, sand equivalent value, percent fractured particles, and flat and elongated particles). The rating system gives a maximum rating of 10 for each test, (e.g. 5 for wash pass 75 μm on sample 1.10, plus -5 for wash pass 75 μm on sample 2.10, equals 10 (the negative sign indicating a test result less than the mean is ignored)). See Section 2.1 for explanation of test method ratings. Some tests that are normally reported together are averaged and given a maximum of 10. The relative density and absorption (coarse and fine), one-point Proctor values (maximum wet and dry density, and optimum moisture content), particle size analysis of soils, and Atterberg limits are treated in this manner. Because of the large number of individual test ratings in the sieve analysis results, the ratings are modified so as not to unduly bias the overall balance between various tests. The ratings for each sieve size are added and then divided by eleven coarse and fine sieves for which results were reported, and multiplied by 3 to give a laboratory rating with a maximum of 30 for this test. Individual laboratory ratings are calculated by adding the ratings of each test in the appropriate lab category (i.e. Production, Full Service, Soil, or Superpave) and converting the sum to a percentage of the maximum available rating for the category. The spread of laboratory ratings for Production, Full Service, Soil, and Superpave laboratories are given in the form of histograms in Figures 2 to 5. The laboratory rating system data is reported in the Appendices E1, E2, E3, and E4. Laboratory ratings for each category are given to participants in the covering letter accompanying the individual laboratory results. A poor or good rating for a laboratory in one year is an indication of how that laboratory performed in the proficiency study, and may not be a reflection of how the laboratory performs year round. A consistently poor rating over two or more years may be cause for serious concern.

- 28 -
MTO Aggregate and Soil Proficiency Sample Testing Program for 2010; MERO-040
2010 MTO AGGREGATE AND SOIL PROFICIENCY SAMPLES PRODUCTION LABORATORY RATINGS
0
20
40
60
80
25-3
0
30-3
5
35-4
0
40-4
5
45-5
0
50-5
5
55-6
0
60-6
5
65-7
0
70-7
5
75-8
0
80-8
5
85-9
0
90-9
5
95-1
00
Production Laboratory Ratings
Num
ber o
f Lab
orat
orie
sTotal Number of Laboratories (n) = 221
Figure 2. Production Laboratory Ratings
2010 MTO AGGREGATE AND SOIL PROFICIENCY SAMPLES FULL SERVICE AGGREGATE LABORATORY RATINGS
0
5
10
15
20
25-3
0
30-3
5
35-4
0
40-4
5
45-5
0
50-5
5
55-6
0
60-6
5
65-7
0
70-7
5
75-8
0
80-8
5
85-9
0
90-9
5
95-1
00
Full Service Laborartory Ratings
Num
ber o
f Lab
orat
orie
s
Total Number of Laboratories (n) = 56
Figure 3. Full Service Laboratory Ratings
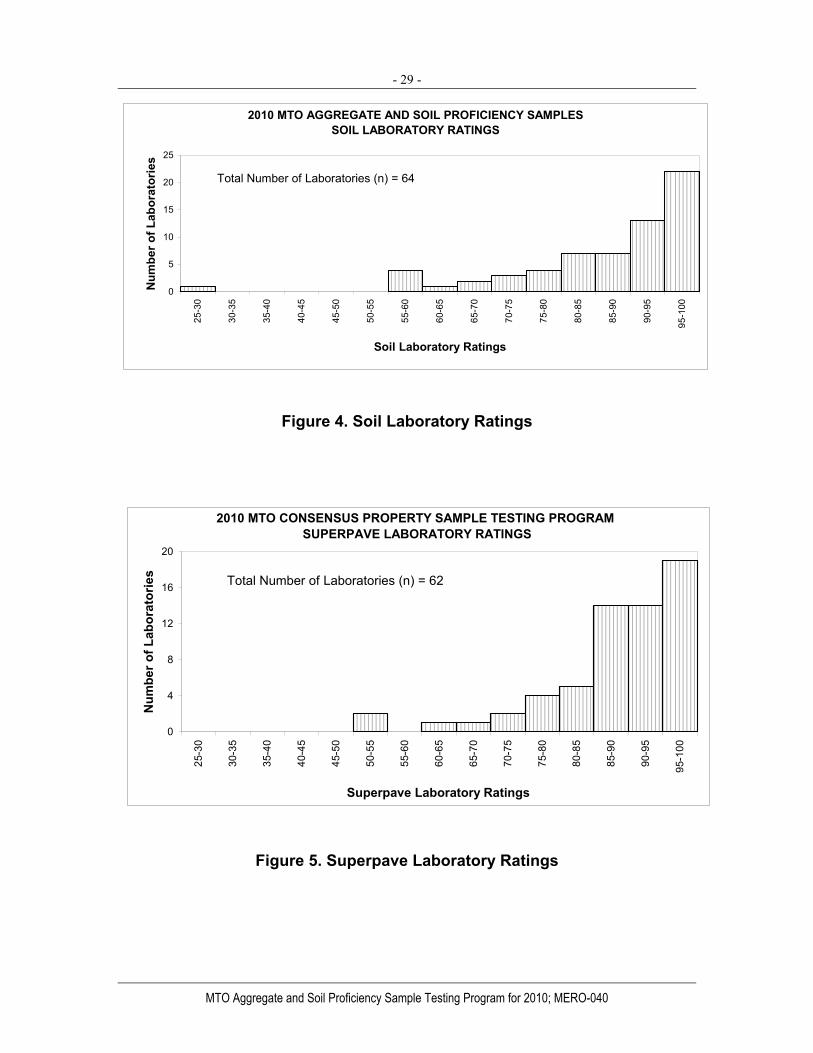
- 29 -
MTO Aggregate and Soil Proficiency Sample Testing Program for 2010; MERO-040
2010 MTO AGGREGATE AND SOIL PROFICIENCY SAMPLESSOIL LABORATORY RATINGS
0
5
10
15
20
25
25-3
0
30-3
5
35-4
0
40-4
5
45-5
0
50-5
5
55-6
0
60-6
5
65-7
0
70-7
5
75-8
0
80-8
5
85-9
0
90-9
5
95-1
00
Soil Laboratory Ratings
Num
ber o
f Lab
orat
orie
s
Total Number of Laboratories (n) = 64
Figure 4. Soil Laboratory Ratings
2010 MTO CONSENSUS PROPERTY SAMPLE TESTING PROGRAM SUPERPAVE LABORATORY RATINGS
0
4
8
12
16
20
25-3
0
30-3
5
35-4
0
40-4
5
45-5
0
50-5
5
55-6
0
60-6
5
65-7
0
70-7
5
75-8
0
80-8
5
85-9
0
90-9
5
95-1
00
Superpave Laboratory Ratings
Num
ber o
f Lab
orat
orie
s Total Number of Laboratories (n) = 62
Figure 5. Superpave Laboratory Ratings
- 30 -
MTO Aggregate and Soil Proficiency Sample Testing Program for 2010; MERO-040
5. Conclusions The method of proficiency sample preparation employed by MTO resulted in almost identical mean gradation values for samples 1.10 and 2.10. The differences in mean, as well as in the standard deviations between pairs of samples for both coarse and fine sieves are negligible. Based on the results, it may be concluded that the sample preparation method employed is very effective and capable of producing a uniform and nearly identical material at reasonable cost. The majority of the aggregate and soil test results of the 2010 Aggregate and Soil Proficiency Sample Testing Program compare favourably with the results of previous studies. In some cases, the variations show noticeable improvement over previous years’ results and the precision estimates of those tests where MTO or ASTM precision statements are available. The scatter diagrams for the majority of the aggregate tests show either random variation or a combination of random variation and laboratory bias for some laboratories. Two hundred and twenty of the laboratories that participated in the aggregate tests are CCIL Type C (Production) certified, and fifty-six of those are also CCIL Type D (Full Service) certified. CCIL inspects the certified laboratories for quality control procedures, ability of technicians, and condition and calibration of the equipment at about eighteen month intervals. The performance of laboratories in most of the aggregate tests (Type C and Type D) is consistent with the results in the past and a large number of these tests show improvement in multi-laboratory variation over the established precision estimates. The improvements noted may be due to the on-site laboratory inspection by CCIL at regular intervals, proficiency sample testing, and due to an increased awareness of the importance of proper testing and quality control procedures implemented by CCIL. Sixty-four laboratories participated in all three soil tests. The variations found in 2010 for the soil tests are consistent with the values reported in the last three years’ studies, but the scatter diagrams still show strong laboratory biases. The results of soil tests are significantly influenced by operator skills, testing environment, and the condition and calibration of the equipment. Thirty-three of the sixty-four laboratories that participated in the soil tests are on the MTO Vendors List. Most of the laboratories approved were inspected more than eight years ago by MTO staff by request and few re-inspections8 have been done to date. Sixty-two laboratories participated in all four Superpave consensus property tests. The results of 2010 for uncompacted void content and sand equivalent value do not compare favourably with the results of past three years. However, the multi-laboratory precisions obtained in 2010, except uncompacted void content, show improvement over the ASTM precision estimates. As in the past, the scatter diagrams show strong laboratory biases. It is expected that the quality control program implemented by CCIL will bring about improvements in multi-laboratory variation.
8 To arrange an inspection of your Soil Laboratory, please contact Mark Vasavithasan, Soils and Aggregates Section, Ministry of Transportation, phone (416) 235-4901, fax (416) 235-4101, [email protected].

- 31 -
MTO Aggregate and Soil Proficiency Sample Testing Program for 2010; MERO-040
6. Recommendations Although, there are improvements in the multi-laboratory variations over the precision estimates established by ASTM and MTO, strong laboratory biases still remain in a number of aggregate tests and all of the soil test procedures. The laboratories that were identified as outliers and obtained zero ratings should examine their quality control practices, the condition and calibration of equipment, testing procedures, and skills of the technicians. Laboratories must investigate the causes and prepare corrective action reports as required by the quality system whenever a rating of 2 or less is obtained for each sample in a test. In 2010, the Ministry will request a written response with respect to the action taken to address the low rating(s) and to prevent future occurrence, from the laboratories that are on MTO Vendors List for QA and referee testing. The results of the 2010 MTO Aggregate and Soil Proficiency Sample Testing Program suggest that most laboratories have performed satisfactorily. Laboratories that obtained relatively low ratings must focus on quality control practices, operator training, standardization and calibration of equipment, and improvements to laboratory environment in order to improve their performance. For all of the tests that were included in this study, the equipment to be used is regulated by the test method itself. A good state of equipment maintenance, repair, and correct calibration is required in order to achieve improvements. It is hoped that the mandatory Quality System implemented by CCIL will encourage laboratories to conduct a review of their internal quality control practices to ensure that they have the correct equipment and properly trained technicians. Laboratories will find that a well-documented and regular program of internal inspection, calibration, and testing of control or reference samples is beneficial to maintaining a high level of confidence in their results.

- 32 -
MTO Aggregate and Soil Proficiency Sample Testing Program for 2010; MERO-040
7. Acknowledgments The authors wish to acknowledge the assistance and dedicated work of the laboratory staff of the Soils and Aggregates Section and MERO in the preparation of samples and performing the tests. We received considerable assistance from the laboratory staff of the Bituminous, Concrete and Pavement and Foundation Sections in the preparation of correlation samples for distribution.

- 33 -
MTO Aggregate and Soil Proficiency Sample Testing Program for 2010; MERO-040
References 1. American Society for Testing and Materials. Annual Book of ASTM Standards, Vol.
04.02, Concrete and Aggregate.
2. American Society for Testing and Materials. Annual Book of ASTM Standards, Vol. 14.02, Statistical Methods.
3. Grubbs, F.E. and Beck, G., “Extension of Sample Sizes and Percentage Points for Significance Tests of Outlying Observations”, Technometrics, TCMTA, Vol. 14, No. 4, November 1972, pp. 847–854.
4. Grubbs, F.E., “Procedures for Detecting Outlying Observations in Samples”, Technometrics, TCMTA, Vol. 11, No. 4, February 1969, pp. 1–21.
5. Manchester, L., 1979, “The Development of an Interlaboratory Testing Program for Construction Aggregates”, Engineering Materials Office Report EM-33, Ministry of Transportation, Ontario.
6. Rogers, C. A., 1999, “Multi-Laboratory Study of the Accelerated Mortar Bar Test (ASTM C 1260) for Alkali-Silica Reaction”, Cement, Concrete, and Aggregates, CCAGDP, Vol. 21, No. 2, December 1999, pp. 185 – 194.
7. Vasavithasan, M. and Rutter, B., 2004, “User’s Manual for Soils and Aggregates Sample Testing (SASTP) Computer Program”, Materials Engineering and Research Office Report MERO-013, Ministry of Transportation, Ontario.
8. Vogler, R.H. and Spellenberg, P.A., “AASHTO T 27 – Sieve Analysis of Fine and Coarse Aggregate”, AASHTO Technical Section 1c, Unpublished Paper.
- 34 -
MTO Aggregate and Soil Proficiency Sample Testing Program for 2010; MERO-040
Appendix A: Glossary of Terms
Precision refers to the degree of mutual agreement between individual measurements on the same material. In other words, precision is a measure of how well the individual test results of a series agree with each other.
Accuracy refers to the degree of mutual agreement between a set of measurements with an accepted reference or ‘true value’. This ‘true’ or reference value can be an assigned value arrived at by actual experiments.
Bias of a measurement process is a consistent and systematic difference between a set of test results derived from using the process and an accepted reference value of the property being measured. For the majority of aggregate and soil tests, there is no acceptable reference material, so bias is impossible to compute.
Critical Value is that value of the sample criterion which would be exceeded by chance with some specified probability (significance level) on the assumption that all the observations did indeed constitute a random sample from a common system of causes.
Coefficient of Variation expresses the standard deviation as a percentage of the mean, where: C.V. = std dev x 100 mean Single operator precision (one-sigma limit (1s)) indicates the variability, as measured by the deviations above and below the average, of a large group of individual test results when the tests have been made on the same material by a single operator using the same apparatus in the same laboratory over a relatively short time.
Multi-laboratory precision is a quantitative estimate of the variability of a large group of individual test results when each test has been made in a different laboratory and every effort has been made to make test portions of the material as nearly identical as possible. Under normal circumstances, the estimates of the one-sigma limit (1s) for multi-laboratory precision are usually larger than those for single-operator precision because different operators and different equipment are being used in different laboratories.
Acceptable difference between two results (difference two-sigma limit (d2s)) as an index of precision is the maximum acceptable difference between two results obtained on test portions of the same material tested by two different laboratories. The index, d2s, is the difference between two individual test results that would be equalled or exceeded in only one case in twenty in the normal and correct operation of the method. The index is calculated by multiplying the multi-laboratory standard deviation (1s) by the factor 2√2 (2.83).
Sample mean or average is the sum of all observations divided by the total number of observations.
- 35 -
MTO Aggregate and Soil Proficiency Sample Testing Program for 2010; MERO-040
Median is synonymous with the middle and the sample median is the middle value of a list of test results when the observations are ordered from smallest to largest in magnitude. After rearranging the observations in increasing order (from most negative to most positive), the sample median is the single middle value in the ordered list, if n is odd, or the average of the two middle values in the ordered list, if n is even, where n equals the number of observations. Standard deviation is the most usual measure of the dispersion of observed values or results expressed as the positive square root of the variance.
Variance is a measure of the squared dispersion of observed values or measurements expressed as a function of the sum of the squared deviations from the population mean or sample average.
Outlier is a measurement that, for a specific degree of confidence, is not part of the population. In this study, an outlier is generally three or more standard deviations from the mean, giving a confidence level of ninety-nine percent. If a laboratory test result is classified as an outlier, it means that something went wrong either with the sample or in the laboratory.

- 36 -
MTO Aggregate and Soil Proficiency Sample Testing Program for 2010; MERO-040
Appendix B1: List of Participants
2010 Participants List Ministry of Transportation
Aggregate and Soil Proficiency Sample
Testing Program
For further information on this program, contact:
Mark Vasavithasan (416) 235-4901, or Stephen Senior (416) 235-3734
LS-6
01 W
ash
Pas
s 75
μm
LS-6
02 S
ieve
Ana
lysi
s
LS-6
03 L
os A
ngel
es A
bras
ion
LS-6
04/5
Rel
ativ
e D
ensi
ty
LS-6
06 S
ulph
ate
Soun
dnes
s
LS-6
07 P
erce
nt C
rush
ed P
artic
les
LS-6
08 P
erce
nt F
lat a
nd E
long
ated
LS-6
09 P
etro
grap
hic
Num
ber -
Con
cret
e
LS-6
16 P
etro
grap
hic
Anal
ysis
– F
ine
LS-6
14 F
reez
e-Th
aw
LS-6
18 M
icro
-Dev
al C
A
LS-6
19 M
icro
-Dev
al F
A
LS-6
20 A
ccel
erat
ed M
orta
r Bar
LS-6
21 A
spha
lt C
oate
d P
artic
les
LS- 6
23 O
ne P
oint
Pro
ctor
Den
sity
LS-7
02 P
artic
le S
ize
Ana
lysi
s
LS-7
03/4
Atte
rber
g Li
mits
LS-7
05 S
peci
fic G
ravi
ty o
f Soi
ls
A. L. Blair Construction Limited Moose Creek, ON Mr. Bryan Blanshard Tel: 613 538-2271
AGS Associates Inc. Scarborough, ON Mr. Abid Chohan Tel: 416 299-3655
AME - Materials Engineering Caledon, ON Mr. Scott Crowley Tel: 905 840-5914
AME - Materials Engineering Gormley, ON Mr. Jordan Gadjanov Tel: 905 640-7772
AME - Materials Engineering - Ottawa Ottawa, ON Mr. Steve Goodman Tel: 613 726-3039
AME - Materials Engineering (24-165) Caledon, ON Mr. Scott Crowley Tel: 905 840-5914
AME - Materials Engineering (24-270) Caledon, ON Mr. Scott Crowley Tel: 905 840-5914
AME - Materials Engineering (24-271) Caledon, ON Mr. Scott Crowley Tel: 905 840-5914
AME - Materials Engineering (24-297) Caledon, ON Mr. Scott Crowley Tel: 905 840-5914
AME - Materials Engineering (24-298) Caledon, ON Mr. Scott Crowley Tel: 905 840-5914
AME - Materials Engineering (24-384) Caledon, ON Mr. Scott Crowley Tel: 905 840-5914
AME - Materials Engineering (24-911) Caledon, ON Mr. Scott Crowley Tel: 905 840-5914
AME - Materials Engineering (24-912) Caledon, ON Mr. Scott Crowley Tel: 905 840-5914
AMEC Earth & Environmental Ltd. Scarborough, ON Mr. Mohammadsarif Sufi Tel: 416 751-6565
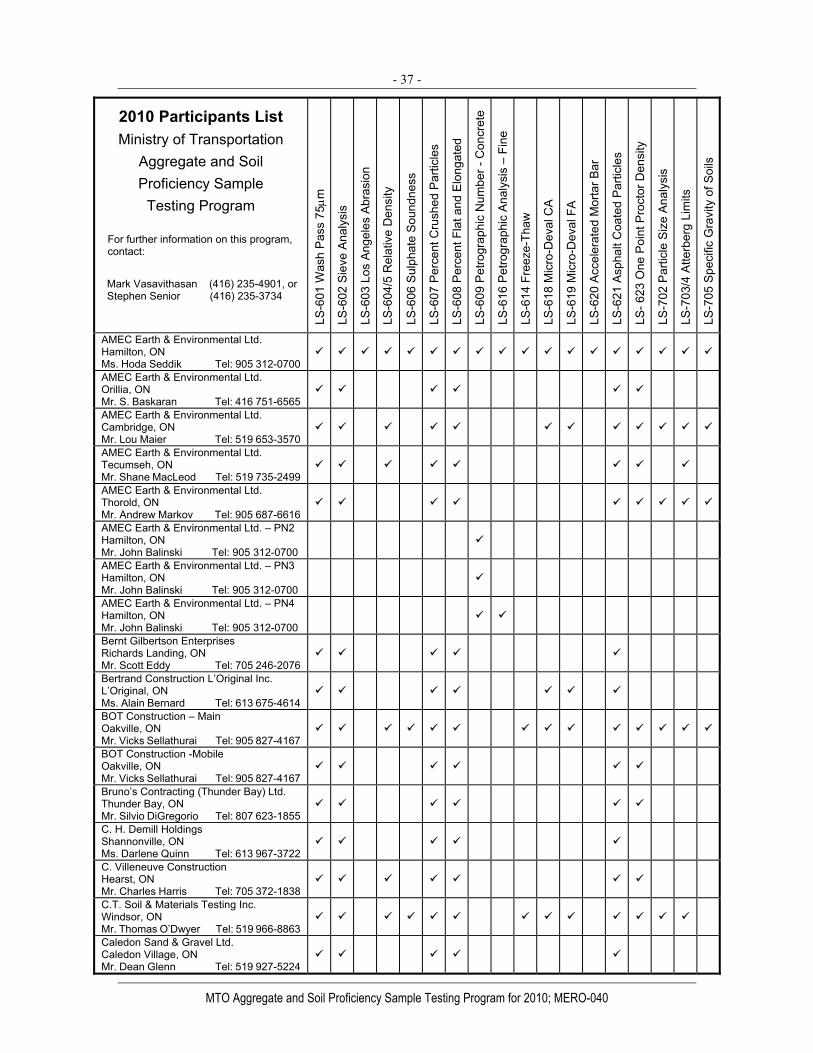
- 37 -
MTO Aggregate and Soil Proficiency Sample Testing Program for 2010; MERO-040
2010 Participants List Ministry of Transportation
Aggregate and Soil Proficiency Sample
Testing Program
For further information on this program, contact:
Mark Vasavithasan (416) 235-4901, or Stephen Senior (416) 235-3734
LS-6
01 W
ash
Pas
s 75
μm
LS-6
02 S
ieve
Ana
lysi
s
LS-6
03 L
os A
ngel
es A
bras
ion
LS-6
04/5
Rel
ativ
e D
ensi
ty
LS-6
06 S
ulph
ate
Soun
dnes
s
LS-6
07 P
erce
nt C
rush
ed P
artic
les
LS-6
08 P
erce
nt F
lat a
nd E
long
ated
LS-6
09 P
etro
grap
hic
Num
ber -
Con
cret
e
LS-6
16 P
etro
grap
hic
Anal
ysis
– F
ine
LS-6
14 F
reez
e-Th
aw
LS-6
18 M
icro
-Dev
al C
A
LS-6
19 M
icro
-Dev
al F
A
LS-6
20 A
ccel
erat
ed M
orta
r Bar
LS-6
21 A
spha
lt C
oate
d P
artic
les
LS- 6
23 O
ne P
oint
Pro
ctor
Den
sity
LS-7
02 P
artic
le S
ize
Ana
lysi
s
LS-7
03/4
Atte
rber
g Li
mits
LS-7
05 S
peci
fic G
ravi
ty o
f Soi
ls
AMEC Earth & Environmental Ltd. Hamilton, ON Ms. Hoda Seddik Tel: 905 312-0700
AMEC Earth & Environmental Ltd. Orillia, ON Mr. S. Baskaran Tel: 416 751-6565
AMEC Earth & Environmental Ltd. Cambridge, ON Mr. Lou Maier Tel: 519 653-3570
AMEC Earth & Environmental Ltd. Tecumseh, ON Mr. Shane MacLeod Tel: 519 735-2499
AMEC Earth & Environmental Ltd. Thorold, ON Mr. Andrew Markov Tel: 905 687-6616
AMEC Earth & Environmental Ltd. – PN2 Hamilton, ON Mr. John Balinski Tel: 905 312-0700
AMEC Earth & Environmental Ltd. – PN3 Hamilton, ON Mr. John Balinski Tel: 905 312-0700
AMEC Earth & Environmental Ltd. – PN4 Hamilton, ON Mr. John Balinski Tel: 905 312-0700
Bernt Gilbertson Enterprises Richards Landing, ON Mr. Scott Eddy Tel: 705 246-2076
Bertrand Construction L’Original Inc. L’Original, ON Ms. Alain Bernard Tel: 613 675-4614
BOT Construction – Main Oakville, ON Mr. Vicks Sellathurai Tel: 905 827-4167
BOT Construction -Mobile Oakville, ON Mr. Vicks Sellathurai Tel: 905 827-4167
Bruno’s Contracting (Thunder Bay) Ltd. Thunder Bay, ON Mr. Silvio DiGregorio Tel: 807 623-1855
C. H. Demill Holdings Shannonville, ON Ms. Darlene Quinn Tel: 613 967-3722
C. Villeneuve Construction Hearst, ON Mr. Charles Harris Tel: 705 372-1838
C.T. Soil & Materials Testing Inc. Windsor, ON Mr. Thomas O’Dwyer Tel: 519 966-8863
Caledon Sand & Gravel Ltd. Caledon Village, ON Mr. Dean Glenn Tel: 519 927-5224

- 38 -
MTO Aggregate and Soil Proficiency Sample Testing Program for 2010; MERO-040
2010 Participants List Ministry of Transportation
Aggregate and Soil Proficiency Sample
Testing Program
For further information on this program, contact:
Mark Vasavithasan (416) 235-4901, or Stephen Senior (416) 235-3734
LS-6
01 W
ash
Pas
s 75
μm
LS-6
02 S
ieve
Ana
lysi
s
LS-6
03 L
os A
ngel
es A
bras
ion
LS-6
04/5
Rel
ativ
e D
ensi
ty
LS-6
06 S
ulph
ate
Soun
dnes
s
LS-6
07 P
erce
nt C
rush
ed P
artic
les
LS-6
08 P
erce
nt F
lat a
nd E
long
ated
LS-6
09 P
etro
grap
hic
Num
ber -
Con
cret
e
LS-6
16 P
etro
grap
hic
Anal
ysis
– F
ine
LS-6
14 F
reez
e-Th
aw
LS-6
18 M
icro
-Dev
al C
A
LS-6
19 M
icro
-Dev
al F
A
LS-6
20 A
ccel
erat
ed M
orta
r Bar
LS-6
21 A
spha
lt C
oate
d P
artic
les
LS- 6
23 O
ne P
oint
Pro
ctor
Den
sity
LS-7
02 P
artic
le S
ize
Ana
lysi
s
LS-7
03/4
Atte
rber
g Li
mits
LS-7
05 S
peci
fic G
ravi
ty o
f Soi
ls
Capital Paving Inc. Guelph, ON Mr. Mark Latyn Tel: 519 822-4511
Carillion Canada Inc. Concord, ON Ms. Holly Hampton Tel: 905 532-5235
CBM Aggregates - Aberfoyle Toronto, ON Mr. Leigh Mugford Tel: 416 806-3590
CBM Aggregates – Brighton Toronto, ON Mr. Leigh Mugford Tel: 416 806-3590
CBM Aggregates – Cambridge Toronto, ON Mr. Leigh Mugford Tel: 416 806-3590
CBM Aggregates – Sunderland Toronto, ON Mr. Leigh Mugford Tel: 416 806-3590
CBM Aggregates – Westwood Toronto, ON Mr. Leigh Mugford Tel: 416 806-3590
CBM Leaside Lab Toronto, ON Mr. Stephen Parkes Tel: 416 423-2439
Chung & Vander Dollen Engineering Limited, Kitchener, ON Mr. William Evans Tel: 519 742-8979
City of Sault Ste Marie Sault Ste Marie, ON Mr. John Sloan Tel: 705 946-9918
CMT Engineering Inc. St. Clements, ON Mr. Dale Bender Tel: 519 699-5775
COCO Paving Inc. – Belleville Belleville, ON Mr. Michael Haisma Tel: 613 962-3461
COCO Paving Inc. – Hamilton Hamilton, ON Mr. Yogi Sellathurai Tel: 905 522-7735
COCO Paving Inc. – Moodie Ottawa, ON Mr. Brad Gooderham Tel: 613 829-1770
COCO Paving Inc. - Toronto Toronto, ON Mr. Andrew Pahalan Tel: 416 633-9670
COCO Paving Inc. - Windsor Windsor, ON Mr. Ishaq Syed Tel: 519 948-7133
Coffey Geotechnics Inc. Toronto, ON Mr. Andrew Mendonca Tel: 416 213-1255
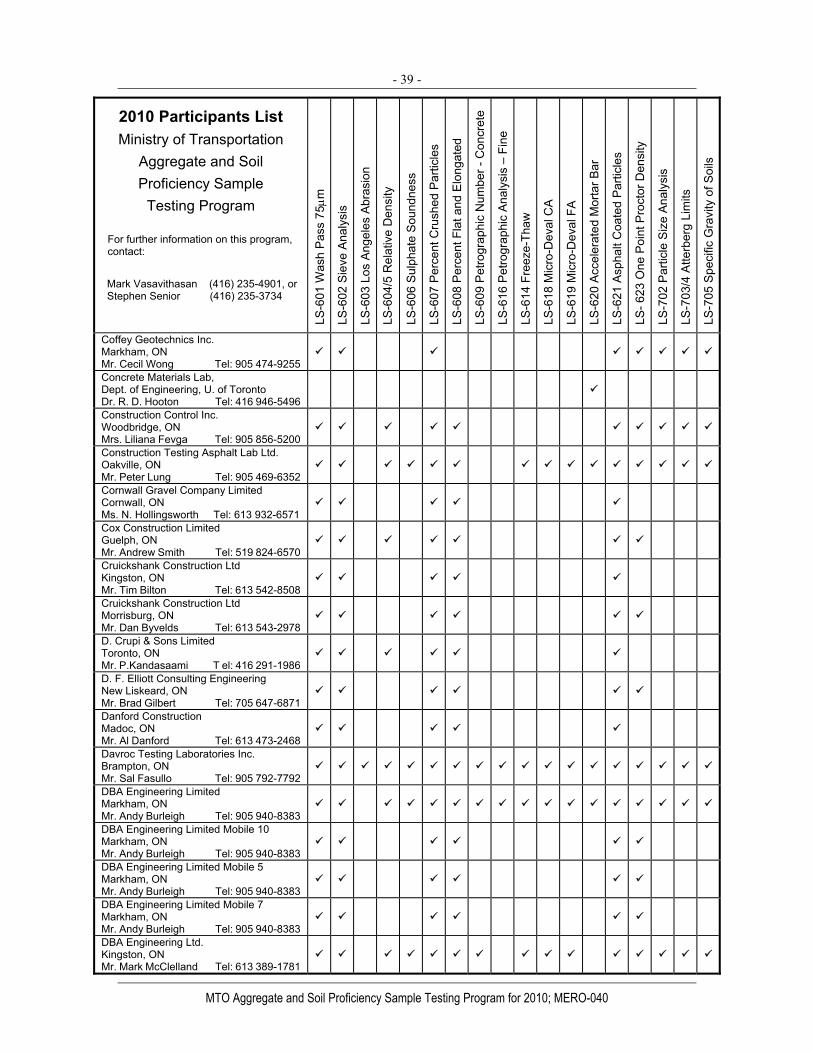
- 39 -
MTO Aggregate and Soil Proficiency Sample Testing Program for 2010; MERO-040
2010 Participants List Ministry of Transportation
Aggregate and Soil Proficiency Sample
Testing Program
For further information on this program, contact:
Mark Vasavithasan (416) 235-4901, or Stephen Senior (416) 235-3734
LS-6
01 W
ash
Pas
s 75
μm
LS-6
02 S
ieve
Ana
lysi
s
LS-6
03 L
os A
ngel
es A
bras
ion
LS-6
04/5
Rel
ativ
e D
ensi
ty
LS-6
06 S
ulph
ate
Soun
dnes
s
LS-6
07 P
erce
nt C
rush
ed P
artic
les
LS-6
08 P
erce
nt F
lat a
nd E
long
ated
LS-6
09 P
etro
grap
hic
Num
ber -
Con
cret
e
LS-6
16 P
etro
grap
hic
Anal
ysis
– F
ine
LS-6
14 F
reez
e-Th
aw
LS-6
18 M
icro
-Dev
al C
A
LS-6
19 M
icro
-Dev
al F
A
LS-6
20 A
ccel
erat
ed M
orta
r Bar
LS-6
21 A
spha
lt C
oate
d P
artic
les
LS- 6
23 O
ne P
oint
Pro
ctor
Den
sity
LS-7
02 P
artic
le S
ize
Ana
lysi
s
LS-7
03/4
Atte
rber
g Li
mits
LS-7
05 S
peci
fic G
ravi
ty o
f Soi
ls
Coffey Geotechnics Inc. Markham, ON Mr. Cecil Wong Tel: 905 474-9255
Concrete Materials Lab, Dept. of Engineering, U. of Toronto Dr. R. D. Hooton Tel: 416 946-5496
Construction Control Inc. Woodbridge, ON Mrs. Liliana Fevga Tel: 905 856-5200
Construction Testing Asphalt Lab Ltd. Oakville, ON Mr. Peter Lung Tel: 905 469-6352
Cornwall Gravel Company Limited Cornwall, ON Ms. N. Hollingsworth Tel: 613 932-6571
Cox Construction Limited Guelph, ON Mr. Andrew Smith Tel: 519 824-6570
Cruickshank Construction Ltd Kingston, ON Mr. Tim Bilton Tel: 613 542-8508
Cruickshank Construction Ltd Morrisburg, ON Mr. Dan Byvelds Tel: 613 543-2978
D. Crupi & Sons Limited Toronto, ON Mr. P.Kandasaami T el: 416 291-1986
D. F. Elliott Consulting Engineering New Liskeard, ON Mr. Brad Gilbert Tel: 705 647-6871
Danford Construction Madoc, ON Mr. Al Danford Tel: 613 473-2468
Davroc Testing Laboratories Inc. Brampton, ON Mr. Sal Fasullo Tel: 905 792-7792
DBA Engineering Limited Markham, ON Mr. Andy Burleigh Tel: 905 940-8383
DBA Engineering Limited Mobile 10 Markham, ON Mr. Andy Burleigh Tel: 905 940-8383
DBA Engineering Limited Mobile 5 Markham, ON Mr. Andy Burleigh Tel: 905 940-8383
DBA Engineering Limited Mobile 7 Markham, ON Mr. Andy Burleigh Tel: 905 940-8383
DBA Engineering Ltd. Kingston, ON Mr. Mark McClelland Tel: 613 389-1781

- 40 -
MTO Aggregate and Soil Proficiency Sample Testing Program for 2010; MERO-040
2010 Participants List Ministry of Transportation
Aggregate and Soil Proficiency Sample
Testing Program
For further information on this program, contact:
Mark Vasavithasan (416) 235-4901, or Stephen Senior (416) 235-3734
LS-6
01 W
ash
Pas
s 75
μm
LS-6
02 S
ieve
Ana
lysi
s
LS-6
03 L
os A
ngel
es A
bras
ion
LS-6
04/5
Rel
ativ
e D
ensi
ty
LS-6
06 S
ulph
ate
Soun
dnes
s
LS-6
07 P
erce
nt C
rush
ed P
artic
les
LS-6
08 P
erce
nt F
lat a
nd E
long
ated
LS-6
09 P
etro
grap
hic
Num
ber -
Con
cret
e
LS-6
16 P
etro
grap
hic
Anal
ysis
– F
ine
LS-6
14 F
reez
e-Th
aw
LS-6
18 M
icro
-Dev
al C
A
LS-6
19 M
icro
-Dev
al F
A
LS-6
20 A
ccel
erat
ed M
orta
r Bar
LS-6
21 A
spha
lt C
oate
d P
artic
les
LS- 6
23 O
ne P
oint
Pro
ctor
Den
sity
LS-7
02 P
artic
le S
ize
Ana
lysi
s
LS-7
03/4
Atte
rber
g Li
mits
LS-7
05 S
peci
fic G
ravi
ty o
f Soi
ls
Department of Civil Engineering Ryerson University, Toronto Dr. Medhat Shehata Tel: 416 979-5000
District Municipality of Muskoka Bracebridge, ON Mr. Dave Wood Tel: 705 645-6764
Doughty Aggregates (Peterborough) Ltd. Lakefield, ON Mr. Wayne Rayfuse Tel: 705 652-3016
Drain Bros Excavating Ltd. Lakefield, ON Mr. Elton Neuman Tel: 705 639-2301
DST Consulting Engineers Inc. Kenora, ON Mr. Neil Johnson Tel: 807 548-2383
DST Consulting Engineers Inc. Thunder Bay, ON Dr. Myint Win Bo Tel: 807 623-2929
DST Consulting Engineers Inc. Ottawa, ON Mr. Hesham Dief Tel: 613 748-1415
Dufferin Aggregates - Acton Milton, ON Ms. Kelly Mercer Tel: 416 453-3268
Dufferin Aggregates - Blair Pit Blair, ON Mr. Gord Taylor Tel: 905 308-5324
Dufferin Aggregates - Carden Milton, ON Ms. Kelly Mercer Tel: 416 453-3268
Dufferin Aggregates - Cayuga Cayuga, ON Mr. Gord Taylor Tel: 905 308-5324
Dufferin Aggregates - Flamborough Dundas, ON Mr. Gord Taylor Tel: 905 308-5324
Dufferin Aggregates - Milton Milton, ON Ms. Kelly Mercer Tel: 416 453-3268
Dufferin Aggregates - Mosport Orono, ON Ms. Kelly Mercer Tel: 416 453-3268
Dufferin Aggregates - Putnam Putnam, ON Mr. Gord Taylor Tel: 905 308-5324
Dufferin Construction Limited - Cayuga Oakville, ON Mr. Waqas Syed Tel: 905 827-5750
Dufferin Construction Limited - Mobile 1 Oakville, ON Mr. Waqas Syed Tel: 905 827-5750
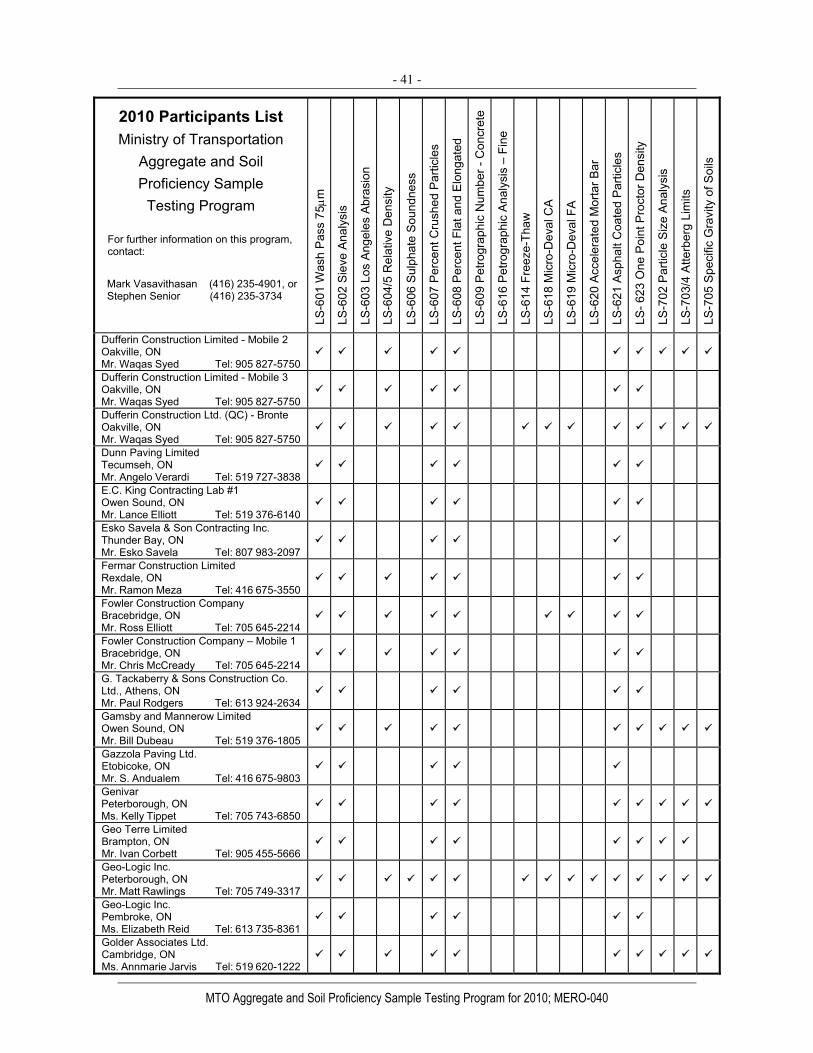
- 41 -
MTO Aggregate and Soil Proficiency Sample Testing Program for 2010; MERO-040
2010 Participants List Ministry of Transportation
Aggregate and Soil Proficiency Sample
Testing Program
For further information on this program, contact:
Mark Vasavithasan (416) 235-4901, or Stephen Senior (416) 235-3734
LS-6
01 W
ash
Pas
s 75
μm
LS-6
02 S
ieve
Ana
lysi
s
LS-6
03 L
os A
ngel
es A
bras
ion
LS-6
04/5
Rel
ativ
e D
ensi
ty
LS-6
06 S
ulph
ate
Soun
dnes
s
LS-6
07 P
erce
nt C
rush
ed P
artic
les
LS-6
08 P
erce
nt F
lat a
nd E
long
ated
LS-6
09 P
etro
grap
hic
Num
ber -
Con
cret
e
LS-6
16 P
etro
grap
hic
Anal
ysis
– F
ine
LS-6
14 F
reez
e-Th
aw
LS-6
18 M
icro
-Dev
al C
A
LS-6
19 M
icro
-Dev
al F
A
LS-6
20 A
ccel
erat
ed M
orta
r Bar
LS-6
21 A
spha
lt C
oate
d P
artic
les
LS- 6
23 O
ne P
oint
Pro
ctor
Den
sity
LS-7
02 P
artic
le S
ize
Ana
lysi
s
LS-7
03/4
Atte
rber
g Li
mits
LS-7
05 S
peci
fic G
ravi
ty o
f Soi
ls
Dufferin Construction Limited - Mobile 2 Oakville, ON Mr. Waqas Syed Tel: 905 827-5750
Dufferin Construction Limited - Mobile 3 Oakville, ON Mr. Waqas Syed Tel: 905 827-5750
Dufferin Construction Ltd. (QC) - Bronte Oakville, ON Mr. Waqas Syed Tel: 905 827-5750
Dunn Paving Limited Tecumseh, ON Mr. Angelo Verardi Tel: 519 727-3838
E.C. King Contracting Lab #1 Owen Sound, ON Mr. Lance Elliott Tel: 519 376-6140
Esko Savela & Son Contracting Inc. Thunder Bay, ON Mr. Esko Savela Tel: 807 983-2097
Fermar Construction Limited Rexdale, ON Mr. Ramon Meza Tel: 416 675-3550
Fowler Construction Company Bracebridge, ON Mr. Ross Elliott Tel: 705 645-2214
Fowler Construction Company – Mobile 1 Bracebridge, ON Mr. Chris McCready Tel: 705 645-2214
G. Tackaberry & Sons Construction Co. Ltd., Athens, ON Mr. Paul Rodgers Tel: 613 924-2634
Gamsby and Mannerow Limited Owen Sound, ON Mr. Bill Dubeau Tel: 519 376-1805
Gazzola Paving Ltd. Etobicoke, ON Mr. S. Andualem Tel: 416 675-9803
Genivar Peterborough, ON Ms. Kelly Tippet Tel: 705 743-6850
Geo Terre Limited Brampton, ON Mr. Ivan Corbett Tel: 905 455-5666
Geo-Logic Inc. Peterborough, ON Mr. Matt Rawlings Tel: 705 749-3317
Geo-Logic Inc. Pembroke, ON Ms. Elizabeth Reid Tel: 613 735-8361
Golder Associates Ltd. Cambridge, ON Ms. Annmarie Jarvis Tel: 519 620-1222
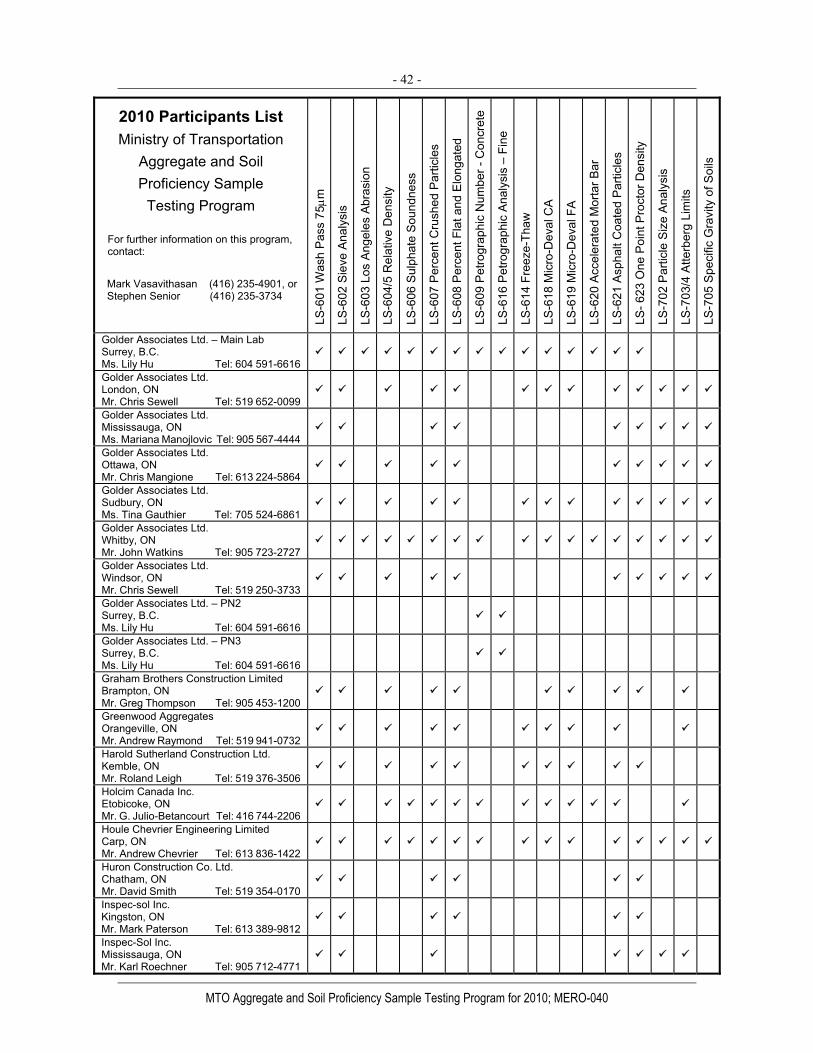
- 42 -
MTO Aggregate and Soil Proficiency Sample Testing Program for 2010; MERO-040
2010 Participants List Ministry of Transportation
Aggregate and Soil Proficiency Sample
Testing Program
For further information on this program, contact:
Mark Vasavithasan (416) 235-4901, or Stephen Senior (416) 235-3734
LS-6
01 W
ash
Pas
s 75
μm
LS-6
02 S
ieve
Ana
lysi
s
LS-6
03 L
os A
ngel
es A
bras
ion
LS-6
04/5
Rel
ativ
e D
ensi
ty
LS-6
06 S
ulph
ate
Soun
dnes
s
LS-6
07 P
erce
nt C
rush
ed P
artic
les
LS-6
08 P
erce
nt F
lat a
nd E
long
ated
LS-6
09 P
etro
grap
hic
Num
ber -
Con
cret
e
LS-6
16 P
etro
grap
hic
Anal
ysis
– F
ine
LS-6
14 F
reez
e-Th
aw
LS-6
18 M
icro
-Dev
al C
A
LS-6
19 M
icro
-Dev
al F
A
LS-6
20 A
ccel
erat
ed M
orta
r Bar
LS-6
21 A
spha
lt C
oate
d P
artic
les
LS- 6
23 O
ne P
oint
Pro
ctor
Den
sity
LS-7
02 P
artic
le S
ize
Ana
lysi
s
LS-7
03/4
Atte
rber
g Li
mits
LS-7
05 S
peci
fic G
ravi
ty o
f Soi
ls
Golder Associates Ltd. – Main Lab Surrey, B.C. Ms. Lily Hu Tel: 604 591-6616
Golder Associates Ltd. London, ON Mr. Chris Sewell Tel: 519 652-0099
Golder Associates Ltd. Mississauga, ON Ms. Mariana Manojlovic Tel: 905 567-4444
Golder Associates Ltd. Ottawa, ON Mr. Chris Mangione Tel: 613 224-5864
Golder Associates Ltd. Sudbury, ON Ms. Tina Gauthier Tel: 705 524-6861
Golder Associates Ltd. Whitby, ON Mr. John Watkins Tel: 905 723-2727
Golder Associates Ltd. Windsor, ON Mr. Chris Sewell Tel: 519 250-3733
Golder Associates Ltd. – PN2 Surrey, B.C. Ms. Lily Hu Tel: 604 591-6616
Golder Associates Ltd. – PN3 Surrey, B.C. Ms. Lily Hu Tel: 604 591-6616
Graham Brothers Construction Limited Brampton, ON Mr. Greg Thompson Tel: 905 453-1200
Greenwood Aggregates Orangeville, ON Mr. Andrew Raymond Tel: 519 941-0732
Harold Sutherland Construction Ltd. Kemble, ON Mr. Roland Leigh Tel: 519 376-3506
Holcim Canada Inc. Etobicoke, ON Mr. G. Julio-Betancourt Tel: 416 744-2206
Houle Chevrier Engineering Limited Carp, ON Mr. Andrew Chevrier Tel: 613 836-1422
Huron Construction Co. Ltd. Chatham, ON Mr. David Smith Tel: 519 354-0170
Inspec-sol Inc. Kingston, ON Mr. Mark Paterson Tel: 613 389-9812
Inspec-Sol Inc. Mississauga, ON Mr. Karl Roechner Tel: 905 712-4771

- 43 -
MTO Aggregate and Soil Proficiency Sample Testing Program for 2010; MERO-040
2010 Participants List Ministry of Transportation
Aggregate and Soil Proficiency Sample
Testing Program
For further information on this program, contact:
Mark Vasavithasan (416) 235-4901, or Stephen Senior (416) 235-3734
LS-6
01 W
ash
Pas
s 75
μm
LS-6
02 S
ieve
Ana
lysi
s
LS-6
03 L
os A
ngel
es A
bras
ion
LS-6
04/5
Rel
ativ
e D
ensi
ty
LS-6
06 S
ulph
ate
Soun
dnes
s
LS-6
07 P
erce
nt C
rush
ed P
artic
les
LS-6
08 P
erce
nt F
lat a
nd E
long
ated
LS-6
09 P
etro
grap
hic
Num
ber -
Con
cret
e
LS-6
16 P
etro
grap
hic
Anal
ysis
– F
ine
LS-6
14 F
reez
e-Th
aw
LS-6
18 M
icro
-Dev
al C
A
LS-6
19 M
icro
-Dev
al F
A
LS-6
20 A
ccel
erat
ed M
orta
r Bar
LS-6
21 A
spha
lt C
oate
d P
artic
les
LS- 6
23 O
ne P
oint
Pro
ctor
Den
sity
LS-7
02 P
artic
le S
ize
Ana
lysi
s
LS-7
03/4
Atte
rber
g Li
mits
LS-7
05 S
peci
fic G
ravi
ty o
f Soi
ls
Inspec-sol Inc. Ottawa, ON Mr. Daniel Boateng Tel: 613 727-0895
Inspec-Sol Inc. Waterloo, ON Mr. Bruce Polan Tel: 519 725-9328
Interpaving Asphalt & Aggregate Supply Ltd., Sudbury, ON Ms. Ashley Edwards Tel: 705 694-6210
Intratech Engineering Laboratories Inc. Scarborough, ON Mr. Frank Miles Tel: 416 754-2077
J & P Leveque Bros. Haulage Ltd. Bancroft, ON Mr. Shawn Fransky Tel: 613 332-5533
J & P Leveque Bros. Ltd. - Mobile 1 Bancroft, ON Mr. Shawn Fransky Tel: 613 332-5533
John D. Paterson & Associates Nepean, ON Mr. Curtis Beadow Tel: 613 226-7381
John D. Paterson & Associates North Bay, ON Mr. Shawn Nelson Tel: 707 472-5331
K. J. Beamish Construction - Mobile 1 King City, ON Mr. Chad Henderson Tel: 905 833-4666
K. J. Beamish Construction - Mobile 2 King City, ON Mr. Chad Henderson Tel: 905 833-4666
K.J. Beamish Construction King City, ON Mr. Chad Henderson Tel: 905 833-4666
Lafarge Canada - Brechin Plant Brechin, ON Ms. Sarah Brown Tel: 705 484-5225
Lafarge Canada - Coldwater Plant Cold Water, ON Mr. Jim Leonard Tel: 705 686-7262
Lafarge Canada - Orillia Lab Cold Water, ON Mr. Jim Leonard Tel: 705 686-7262
Lafarge Canada - Orono Orono, ON Mr. Peter Hill Tel: 905 983-9260
Lafarge Canada Inc - Dundas Quarry Dundas, ON Mr. Chris Thomas Tel: 905 527-3671
Lafarge Canada Inc. - Caledon Caledon, ON Mr. John Kroeze Tel: 519 927-1113

- 44 -
MTO Aggregate and Soil Proficiency Sample Testing Program for 2010; MERO-040
2010 Participants List Ministry of Transportation
Aggregate and Soil Proficiency Sample
Testing Program
For further information on this program, contact:
Mark Vasavithasan (416) 235-4901, or Stephen Senior (416) 235-3734
LS-6
01 W
ash
Pas
s 75
μm
LS-6
02 S
ieve
Ana
lysi
s
LS-6
03 L
os A
ngel
es A
bras
ion
LS-6
04/5
Rel
ativ
e D
ensi
ty
LS-6
06 S
ulph
ate
Soun
dnes
s
LS-6
07 P
erce
nt C
rush
ed P
artic
les
LS-6
08 P
erce
nt F
lat a
nd E
long
ated
LS-6
09 P
etro
grap
hic
Num
ber -
Con
cret
e
LS-6
16 P
etro
grap
hic
Anal
ysis
– F
ine
LS-6
14 F
reez
e-Th
aw
LS-6
18 M
icro
-Dev
al C
A
LS-6
19 M
icro
-Dev
al F
A
LS-6
20 A
ccel
erat
ed M
orta
r Bar
LS-6
21 A
spha
lt C
oate
d P
artic
les
LS- 6
23 O
ne P
oint
Pro
ctor
Den
sity
LS-7
02 P
artic
le S
ize
Ana
lysi
s
LS-7
03/4
Atte
rber
g Li
mits
LS-7
05 S
peci
fic G
ravi
ty o
f Soi
ls
Lafarge Canada Inc. - Cambridge Cambridge, ON Mr. Walter Day Tel: 519 319-9128
Lafarge Canada Inc. - Fonthill Fonthill, ON Mr. Jim Vingerhoets Tel: 905 892-2686
Lafarge Canada Inc. - Hamilton Hamilton, ON Mr. Mike Koch Tel: 905 522-7735
Lafarge Canada Inc. - London London, ON Mr. Walter Day Tel: 519 319-9128
Lafarge Canada Inc. - Meldrum Meldrum Bay, ON Mr. Jeff Middleton Tel: 705 283-3011
Lafarge Canada Inc. - Ottawa Ottawa, ON Mr. Fred Douglas Tel: 613 837-4223
Lafarge Canada Inc. – Pt. Anne Quarry Belleville, ON Mr. Jason Malcolm Tel: 613 813-4857
Lafarge Canada Inc. - Stouffville Stouffville, ON Ms. Christine Crumbie Tel: 905 640-7092
Lafarge Construction Materials Ltd. Brockville, ON Mr. Paul Arkeveld Tel: 613 349-7422
Lafarge Construction Materials Ltd. Glenburnie, ON Mr. Paul Arkeveld Tel: 613 349-7422
Landtek Limited Hamilton, ON Mr. Paul Anderson Tel: 905 383-3733
Lavis Contracting Co. Limited Clinton, ON Mr. Allan Gardner Tel: 519 482-3694
Law Engineering (London) Inc. London, ON Mr. Joe Law Tel: 519 680-9991
Leo Alarie and Sons Ltd. - Mobile 10060 Timmins, ON Mr. John Corkill Tel: 705 268-2106
LVM Inc. Kitchener, ON Mr. Dave Naylor Tel: 519 741-1313
LVM Inc. Branford, ON Mr. Dave Baillie Tel: 519 720-0078
LVM Inc. Stratford, ON Mr. Mathew Smith Tel: 519 271-0101
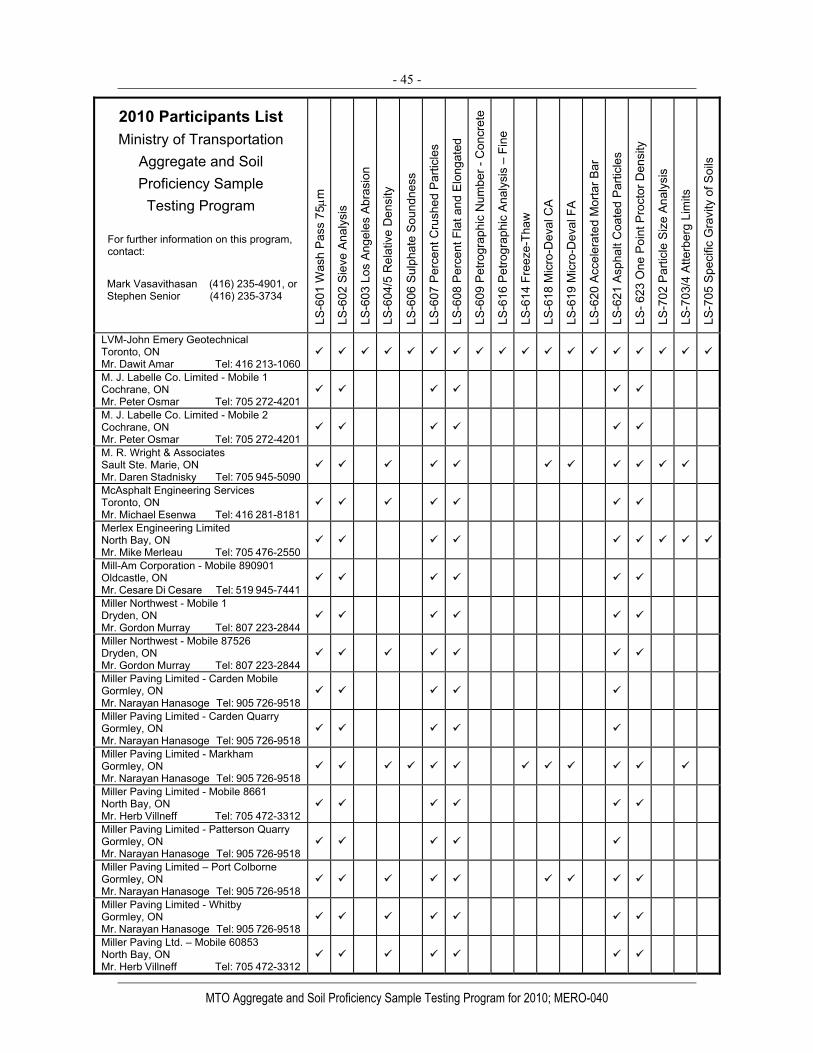
- 45 -
MTO Aggregate and Soil Proficiency Sample Testing Program for 2010; MERO-040
2010 Participants List Ministry of Transportation
Aggregate and Soil Proficiency Sample
Testing Program
For further information on this program, contact:
Mark Vasavithasan (416) 235-4901, or Stephen Senior (416) 235-3734
LS-6
01 W
ash
Pas
s 75
μm
LS-6
02 S
ieve
Ana
lysi
s
LS-6
03 L
os A
ngel
es A
bras
ion
LS-6
04/5
Rel
ativ
e D
ensi
ty
LS-6
06 S
ulph
ate
Soun
dnes
s
LS-6
07 P
erce
nt C
rush
ed P
artic
les
LS-6
08 P
erce
nt F
lat a
nd E
long
ated
LS-6
09 P
etro
grap
hic
Num
ber -
Con
cret
e
LS-6
16 P
etro
grap
hic
Anal
ysis
– F
ine
LS-6
14 F
reez
e-Th
aw
LS-6
18 M
icro
-Dev
al C
A
LS-6
19 M
icro
-Dev
al F
A
LS-6
20 A
ccel
erat
ed M
orta
r Bar
LS-6
21 A
spha
lt C
oate
d P
artic
les
LS- 6
23 O
ne P
oint
Pro
ctor
Den
sity
LS-7
02 P
artic
le S
ize
Ana
lysi
s
LS-7
03/4
Atte
rber
g Li
mits
LS-7
05 S
peci
fic G
ravi
ty o
f Soi
ls
LVM-John Emery Geotechnical Toronto, ON Mr. Dawit Amar Tel: 416 213-1060
M. J. Labelle Co. Limited - Mobile 1 Cochrane, ON Mr. Peter Osmar Tel: 705 272-4201
M. J. Labelle Co. Limited - Mobile 2 Cochrane, ON Mr. Peter Osmar Tel: 705 272-4201
M. R. Wright & Associates Sault Ste. Marie, ON Mr. Daren Stadnisky Tel: 705 945-5090
McAsphalt Engineering Services Toronto, ON Mr. Michael Esenwa Tel: 416 281-8181
Merlex Engineering Limited North Bay, ON Mr. Mike Merleau Tel: 705 476-2550
Mill-Am Corporation - Mobile 890901 Oldcastle, ON Mr. Cesare Di Cesare Tel: 519 945-7441
Miller Northwest - Mobile 1 Dryden, ON Mr. Gordon Murray Tel: 807 223-2844
Miller Northwest - Mobile 87526 Dryden, ON Mr. Gordon Murray Tel: 807 223-2844
Miller Paving Limited - Carden Mobile Gormley, ON Mr. Narayan Hanasoge Tel: 905 726-9518
Miller Paving Limited - Carden Quarry Gormley, ON Mr. Narayan Hanasoge Tel: 905 726-9518
Miller Paving Limited - Markham Gormley, ON Mr. Narayan Hanasoge Tel: 905 726-9518
Miller Paving Limited - Mobile 8661 North Bay, ON Mr. Herb Villneff Tel: 705 472-3312
Miller Paving Limited - Patterson Quarry Gormley, ON Mr. Narayan Hanasoge Tel: 905 726-9518
Miller Paving Limited – Port Colborne Gormley, ON Mr. Narayan Hanasoge Tel: 905 726-9518
Miller Paving Limited - Whitby Gormley, ON Mr. Narayan Hanasoge Tel: 905 726-9518
Miller Paving Ltd. – Mobile 60853 North Bay, ON Mr. Herb Villneff Tel: 705 472-3312
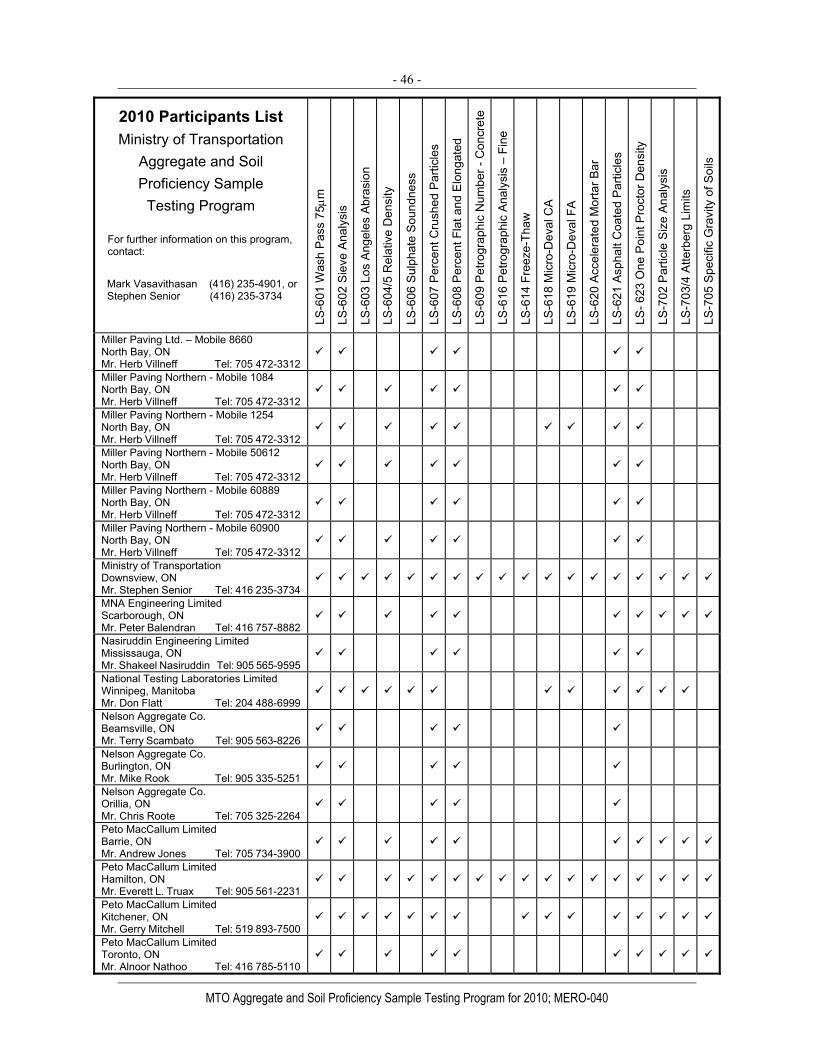
- 46 -
MTO Aggregate and Soil Proficiency Sample Testing Program for 2010; MERO-040
2010 Participants List Ministry of Transportation
Aggregate and Soil Proficiency Sample
Testing Program
For further information on this program, contact:
Mark Vasavithasan (416) 235-4901, or Stephen Senior (416) 235-3734
LS-6
01 W
ash
Pas
s 75
μm
LS-6
02 S
ieve
Ana
lysi
s
LS-6
03 L
os A
ngel
es A
bras
ion
LS-6
04/5
Rel
ativ
e D
ensi
ty
LS-6
06 S
ulph
ate
Soun
dnes
s
LS-6
07 P
erce
nt C
rush
ed P
artic
les
LS-6
08 P
erce
nt F
lat a
nd E
long
ated
LS-6
09 P
etro
grap
hic
Num
ber -
Con
cret
e
LS-6
16 P
etro
grap
hic
Anal
ysis
– F
ine
LS-6
14 F
reez
e-Th
aw
LS-6
18 M
icro
-Dev
al C
A
LS-6
19 M
icro
-Dev
al F
A
LS-6
20 A
ccel
erat
ed M
orta
r Bar
LS-6
21 A
spha
lt C
oate
d P
artic
les
LS- 6
23 O
ne P
oint
Pro
ctor
Den
sity
LS-7
02 P
artic
le S
ize
Ana
lysi
s
LS-7
03/4
Atte
rber
g Li
mits
LS-7
05 S
peci
fic G
ravi
ty o
f Soi
ls
Miller Paving Ltd. – Mobile 8660 North Bay, ON Mr. Herb Villneff Tel: 705 472-3312
Miller Paving Northern - Mobile 1084 North Bay, ON Mr. Herb Villneff Tel: 705 472-3312
Miller Paving Northern - Mobile 1254 North Bay, ON Mr. Herb Villneff Tel: 705 472-3312
Miller Paving Northern - Mobile 50612 North Bay, ON Mr. Herb Villneff Tel: 705 472-3312
Miller Paving Northern - Mobile 60889 North Bay, ON Mr. Herb Villneff Tel: 705 472-3312
Miller Paving Northern - Mobile 60900 North Bay, ON Mr. Herb Villneff Tel: 705 472-3312
Ministry of Transportation Downsview, ON Mr. Stephen Senior Tel: 416 235-3734
MNA Engineering Limited Scarborough, ON Mr. Peter Balendran Tel: 416 757-8882
Nasiruddin Engineering Limited Mississauga, ON Mr. Shakeel Nasiruddin Tel: 905 565-9595
National Testing Laboratories Limited Winnipeg, Manitoba Mr. Don Flatt Tel: 204 488-6999
Nelson Aggregate Co. Beamsville, ON Mr. Terry Scambato Tel: 905 563-8226
Nelson Aggregate Co. Burlington, ON Mr. Mike Rook Tel: 905 335-5251
Nelson Aggregate Co. Orillia, ON Mr. Chris Roote Tel: 705 325-2264
Peto MacCallum Limited Barrie, ON Mr. Andrew Jones Tel: 705 734-3900
Peto MacCallum Limited Hamilton, ON Mr. Everett L. Truax Tel: 905 561-2231
Peto MacCallum Limited Kitchener, ON Mr. Gerry Mitchell Tel: 519 893-7500
Peto MacCallum Limited Toronto, ON Mr. Alnoor Nathoo Tel: 416 785-5110

- 47 -
MTO Aggregate and Soil Proficiency Sample Testing Program for 2010; MERO-040
2010 Participants List Ministry of Transportation
Aggregate and Soil Proficiency Sample
Testing Program
For further information on this program, contact:
Mark Vasavithasan (416) 235-4901, or Stephen Senior (416) 235-3734
LS-6
01 W
ash
Pas
s 75
μm
LS-6
02 S
ieve
Ana
lysi
s
LS-6
03 L
os A
ngel
es A
bras
ion
LS-6
04/5
Rel
ativ
e D
ensi
ty
LS-6
06 S
ulph
ate
Soun
dnes
s
LS-6
07 P
erce
nt C
rush
ed P
artic
les
LS-6
08 P
erce
nt F
lat a
nd E
long
ated
LS-6
09 P
etro
grap
hic
Num
ber -
Con
cret
e
LS-6
16 P
etro
grap
hic
Anal
ysis
– F
ine
LS-6
14 F
reez
e-Th
aw
LS-6
18 M
icro
-Dev
al C
A
LS-6
19 M
icro
-Dev
al F
A
LS-6
20 A
ccel
erat
ed M
orta
r Bar
LS-6
21 A
spha
lt C
oate
d P
artic
les
LS- 6
23 O
ne P
oint
Pro
ctor
Den
sity
LS-7
02 P
artic
le S
ize
Ana
lysi
s
LS-7
03/4
Atte
rber
g Li
mits
LS-7
05 S
peci
fic G
ravi
ty o
f Soi
ls
Pioneer Construction Inc. Sault Ste. Marie, ON Mrs. Shelley Geiling Tel: 705 541-2280
Pioneer Construction Inc. Copper Cliff, ON Mr. David Pilkey Tel: 705 693-1363
Pioneer Construction Inc. - Mobile 1 Garson, ON Mr. David Pilkey Tel: 705 693-1363
Pioneer Construction Inc. – Mobile 2 Garson, ON Mr. David Pilkey Tel: 705 693-1363
Pioneer Construction Inc. - Mobile 3 Thunder Bay, ON Mr. Tony Fazio Tel: 807 345-2338
Pioneer Construction Inc. - Mobile C 1 Sault Ste. Marie, ON Mrs. Shelley Geiling Tel: 705 541-2280
Pioneer Construction Inc. - Mobile C 2 Thunder Bay, ON Mr. Tony Fazio Tel: 807 345-2338
Pioneer Construction Inc. - Thunder Bay Thunder Bay, ON Mr. Tony Fazio Tel: 807 345-2338
Port Colborne Quarries Inc. Port Colborne, ON Mr. Tim Cassibo Tel: 905 834-3647
Preston Sand & Gravel Kitchener, ON Mr. Matthew Bell Tel: 519 579-1248
R. W. Tomlinson Limited Ottawa, ON Mr. Bert Hendriks Tel: 613 822-1867
R. W. Tomlinson Limited – Mobile No. 1 Gloucester, ON Mr. Bert Hendriks Tel: 613 822-1867
R.S Wilson Materials Testing & Inspection Sault Ste. Marie, ON Mr. Robert Wilson Tel: 705 759-2881
Regional Municipality of Durham Whitby, ON Mr. Joeman Ng Tel: 905 655-3344
Sarafinchin Associates Limited Rexdale, ON Mr. Scott Jeffrey Tel: 416 674-1770
Shaba Testing Services Limited Chaput Hughes, ON Mr. Lad Shaba Tel: 705 567-4187
Shaheen Peaker Thompson Limited Oshawa ON Mr. Dave Thompson Tel: 905 436-9028

- 48 -
MTO Aggregate and Soil Proficiency Sample Testing Program for 2010; MERO-040
2010 Participants List Ministry of Transportation
Aggregate and Soil Proficiency Sample
Testing Program
For further information on this program, contact:
Mark Vasavithasan (416) 235-4901, or Stephen Senior (416) 235-3734
LS-6
01 W
ash
Pas
s 75
μm
LS-6
02 S
ieve
Ana
lysi
s
LS-6
03 L
os A
ngel
es A
bras
ion
LS-6
04/5
Rel
ativ
e D
ensi
ty
LS-6
06 S
ulph
ate
Soun
dnes
s
LS-6
07 P
erce
nt C
rush
ed P
artic
les
LS-6
08 P
erce
nt F
lat a
nd E
long
ated
LS-6
09 P
etro
grap
hic
Num
ber -
Con
cret
e
LS-6
16 P
etro
grap
hic
Anal
ysis
– F
ine
LS-6
14 F
reez
e-Th
aw
LS-6
18 M
icro
-Dev
al C
A
LS-6
19 M
icro
-Dev
al F
A
LS-6
20 A
ccel
erat
ed M
orta
r Bar
LS-6
21 A
spha
lt C
oate
d P
artic
les
LS- 6
23 O
ne P
oint
Pro
ctor
Den
sity
LS-7
02 P
artic
le S
ize
Ana
lysi
s
LS-7
03/4
Atte
rber
g Li
mits
LS-7
05 S
peci
fic G
ravi
ty o
f Soi
ls
Smelter Bay Aggregates Inc. Thessalon, ON Mr. Charles Hernden Tel: 705 842-2597
Soil Engineers Limited Scarborough, ON Mr. S. Sanjeevan Tel: 416 754-8515
St Lawrence Testing & Inspection Co. Ltd. Cornwall, ON Mr. Gib McIntee Tel: 613 938-2521
Stantec Consulting Limited Ottawa, ON Mr. Jeff Weng Tel: 613 738-0708
Stantec Consulting Limited Markham, ON Ms. Brani Vujanovic Tel: 905 944-7777
Stantec Consulting Limited Burlington, ON Mr. Eric Theriault Tel: 905 631-3927
Steed and Evans Limited Heidelberg, ON Mr. Richard Marco Tel: 519 699-4646
Teranorth Construction & Engineering Limited, Sudbury, ON Mr. James Bot Tel: 705 523-1540
Terraprobe Testing Limited Brampton, ON Mr. Chris Elvidge Tel: 905 796-2650
Terraprobe Testing Limited Barrie, ON Mr. Brian Jackson Tel: 705 739-8355
Terraprobe Testing Limited Stoney Creek, ON Mr. Gerry Muckle Tel: 905 643-7560
Terraprobe Testing Limited Sudbury, ON Mr. Dennis Paquette Tel: 705 670-0460
Terraspec Engineering Peterborough, ON Mr. Shane Galloway Tel: 705 743-7880
The Karson Group Carp, ON Mr. Cam MacDonald Tel: 613 831-0717
The Miller Group Materials Research Lab Gormley, ON Mr. Narayan Hanasoge Tel: 905 726-9518
The Murray Group Moorefield, ON Mr. Chris Hodgson Tel: 519 323-4411
Thomas Cavanagh Construction Ltd. Ashton, ON Mr. Phil White Tel: 613 259-2670
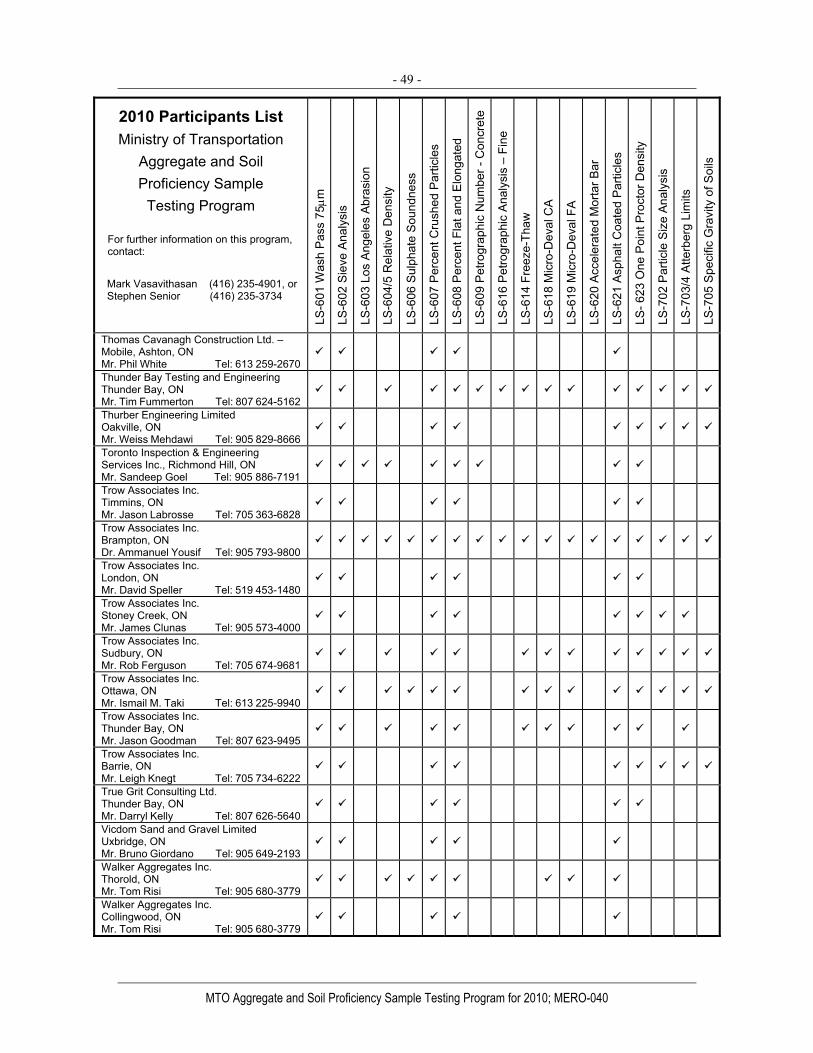
- 49 -
MTO Aggregate and Soil Proficiency Sample Testing Program for 2010; MERO-040
2010 Participants List Ministry of Transportation
Aggregate and Soil Proficiency Sample
Testing Program
For further information on this program, contact:
Mark Vasavithasan (416) 235-4901, or Stephen Senior (416) 235-3734
LS-6
01 W
ash
Pas
s 75
μm
LS-6
02 S
ieve
Ana
lysi
s
LS-6
03 L
os A
ngel
es A
bras
ion
LS-6
04/5
Rel
ativ
e D
ensi
ty
LS-6
06 S
ulph
ate
Soun
dnes
s
LS-6
07 P
erce
nt C
rush
ed P
artic
les
LS-6
08 P
erce
nt F
lat a
nd E
long
ated
LS-6
09 P
etro
grap
hic
Num
ber -
Con
cret
e
LS-6
16 P
etro
grap
hic
Anal
ysis
– F
ine
LS-6
14 F
reez
e-Th
aw
LS-6
18 M
icro
-Dev
al C
A
LS-6
19 M
icro
-Dev
al F
A
LS-6
20 A
ccel
erat
ed M
orta
r Bar
LS-6
21 A
spha
lt C
oate
d P
artic
les
LS- 6
23 O
ne P
oint
Pro
ctor
Den
sity
LS-7
02 P
artic
le S
ize
Ana
lysi
s
LS-7
03/4
Atte
rber
g Li
mits
LS-7
05 S
peci
fic G
ravi
ty o
f Soi
ls
Thomas Cavanagh Construction Ltd. – Mobile, Ashton, ON Mr. Phil White Tel: 613 259-2670
Thunder Bay Testing and Engineering Thunder Bay, ON Mr. Tim Fummerton Tel: 807 624-5162
Thurber Engineering Limited Oakville, ON Mr. Weiss Mehdawi Tel: 905 829-8666
Toronto Inspection & Engineering Services Inc., Richmond Hill, ON Mr. Sandeep Goel Tel: 905 886-7191
Trow Associates Inc. Timmins, ON Mr. Jason Labrosse Tel: 705 363-6828
Trow Associates Inc. Brampton, ON Dr. Ammanuel Yousif Tel: 905 793-9800
Trow Associates Inc. London, ON Mr. David Speller Tel: 519 453-1480
Trow Associates Inc. Stoney Creek, ON Mr. James Clunas Tel: 905 573-4000
Trow Associates Inc. Sudbury, ON Mr. Rob Ferguson Tel: 705 674-9681
Trow Associates Inc. Ottawa, ON Mr. Ismail M. Taki Tel: 613 225-9940
Trow Associates Inc. Thunder Bay, ON Mr. Jason Goodman Tel: 807 623-9495
Trow Associates Inc. Barrie, ON Mr. Leigh Knegt Tel: 705 734-6222
True Grit Consulting Ltd. Thunder Bay, ON Mr. Darryl Kelly Tel: 807 626-5640
Vicdom Sand and Gravel Limited Uxbridge, ON Mr. Bruno Giordano Tel: 905 649-2193
Walker Aggregates Inc. Thorold, ON Mr. Tom Risi Tel: 905 680-3779
Walker Aggregates Inc. Collingwood, ON Mr. Tom Risi Tel: 905 680-3779

- 50 -
MTO Aggregate and Soil Proficiency Sample Testing Program for 2010; MERO-040
Appendix B2: List of Participants
2010 Participants List Ministry of Transportation
Superpave Aggregate Consensus Property Testing Program
For further information on this program, contact: Mark Vasavithasan (416) 235-4901 or
Stephen Senior (416) 235-3734
AS
TM D
125
2/A
AS
HTO
T 3
04 -
Unc
ompa
cted
Voi
d C
onte
nt o
f Fin
e Ag
greg
ate
AS
TM D
421
9/A
AS
HTO
T 1
76 –
Sa
nd E
quiv
alen
t Val
ue o
f Fin
e A
tA
STM
D 5
821
– P
erce
nt o
f Fra
ctur
ed
Par
ticle
s in
Coa
rse
Agg
rega
te
AS
TM D
479
1 –
Per
cent
Fla
t P
artic
les,
Elo
ngat
ed P
artic
les
or F
lat
& E
long
ated
Par
ticle
s in
Coa
rse
Aggr
egat
e
AME -Materials Engineering Gormley, ON Mr. Jordan Gadjanov Tel: 905 640-7772
AME -Materials Engineering Caledon, ON Mr. Scott Crowley Tel: 905 840-5914
AMEC Earth & Environmental Limited Cambridge, ON Mr. Lou Maier Tel: 519 653-3570
AMEC Earth & Environmental Limited Hamilton, ON Ms. Hoda Seddik Tel: 905 312-0700
AMEC Earth & Environmental Limited Scarborough, ON Mr. Mohammadsarif. Sufi Tel: 416 751-6565
AMEC Earth & Environmental Limited Tecumseh, ON Mr. Shane MacLeod Tel: 519 735-2499
BOT Construction Oakville, ON Mr. Vicks Sellathurai Tel: 905 827-4167
C. Villeneuve Construction Hearst, ON Mr. Charles Harris Tel: 705 372-1838
COCO Paving Inc. Windsor, ON Mr. Ishaq Syed Tel: 519 948-7133
COCO Paving Inc. Belleville, ON Mr. Michael Haisma Tel: 613 962-3461
COCO Paving Inc. Hamilton, ON Mr. Yogi Sellathurai Tel: 905 522-7735
COCO Paving Inc. Ottawa, ON Mr. Brad Gooderham Tel: 613 829-1770
COCO Paving Inc. Toronto, ON Mr. Andrew Pahalan Tel: 416 633-9670
Construction Testing Asphalt Lab Oakville, ON Mr. Peter Lung Tel: 905 469-6352
Cox Construction Limited Guelph, ON Mr. Andrew Smith Tel: 519 824-6570
DBA Engineering Limited Kingston, ON Mr. Mark McClelland Tel: 613 389-1781
DBA Engineering Limited Markham, ON Mr. Andy Burleigh Tel: 905 940-8383
DST Consulting Engineers Inc. Thunder Bay, ON Dr. Myint Win Bo Tel: 807 623-2929
Dufferin Construction Ltd. - Mobile 3 Oakville, ON Mr. Waqas Syed Tel: 905 827-5750
Dufferin Construction Ltd. (QC) - Bronte Oakville, ON Mr. Waqas Syed Tel: 905 827-5750

- 51 -
MTO Aggregate and Soil Proficiency Sample Testing Program for 2010; MERO-040
2010 Participants List Ministry of Transportation
Superpave Aggregate Consensus Property Testing Program
For further information on this program, contact: Mark Vasavithasan (416) 235-4901 or
Stephen Senior (416) 235-3734
AS
TM D
125
2/A
AS
HTO
T 3
04 -
Unc
ompa
cted
Voi
d C
onte
nt o
f Fin
e Ag
greg
ate
AS
TM D
421
9/A
AS
HTO
T 1
76 –
Sa
nd E
quiv
alen
t Val
ue o
f Fin
e A
tA
STM
D 5
821
– P
erce
nt o
f Fra
ctur
ed
Par
ticle
s in
Coa
rse
Agg
rega
te
AS
TM D
479
1 –
Per
cent
Fla
t P
artic
les,
Elo
ngat
ed P
artic
les
or F
lat
& E
long
ated
Par
ticle
s in
Coa
rse
Aggr
egat
e
Fermar Construction Limited Rexdale, ON Mr. Ramon Meza Tel: 416 675-3550
Fowler Construction Company Bracebridge, ON Mr. Ross Elliott Tel: 705 645-2214
Geo-Logic Inc. Peterborough, ON Mr. Matt Rawlings Tel: 705 749-3317
Golder Associates Limited Surrey, BC Mrs. Lily Hu Tel: 604 591-6616
Golder Associates Limited Cambridge, ON Ms. Annmarie Jarvis Tel: 519 620-1222
Golder Associates Limited London, ON Mr. Chris Sewell Tel: 519 652-0099
Golder Associates Limited Sudbury, ON Ms. Tina Gauthier Tel: 705 524-6861
Golder Associates Limited Windsor, ON Mr. Chris Sewell Tel: 519 250-3733
Golder Associates Limited Whitby, ON Mr. John Watkins Tel: 905 723-2727
Graham Bros. Construction Limited Brampton, ON Mr. Greg Thompson Tel: 905 453-1200
Greenwood Aggregates Orangeville, ON Mr. Andrew Raymond Tel: 519 941-0732
Harold Sutherland Construction Limited Kemble, ON Mr. Roland Leigh Tel: 519 376-3506
Houle Chevrier Engineering Limited Carp, ON Mr. Andrew Chevrier Tel: 613 836-1422
John D. Paterson & Associates North Bay, ON Mr. Shawn Nelson Tel: 705 472-5331
K.J. Beamish Construction King City, ON Mr. Chad Henderson Tel: 905 833-4666
Lafarge Canada Inc. Hamilton, ON Mr. Mike Koch Tel: 905 522-7735
Lafarge Canada Inc. Dundas, ON Mr. Chris Thomas Tel: 905 527-3671
Landtek Limited Hamilton, ON Mr. Paul Anderson Tel: 905 383-3733
Lavis Contracting Co. Limited Clinton, ON Mr. Allan Gardner Tel: 519 482-3694
LVM-Division of John Emery Geotechnical Toronto, ON Mr. Dawit Amar Tel: 416 213-1060
McAsphalt Engineering Services Toronto, ON Mr. Michael Esenwa Tel: 416 282-8181
Mill-Am Corporation - Mobile 890901 Oldcastle, ON Mr. Cesare Di Cesare Tel: 519 945-7441
Miller Northwest - Mobile 1 Dryden, ON Mr. Gordon Murray Tel: 807 223-2844
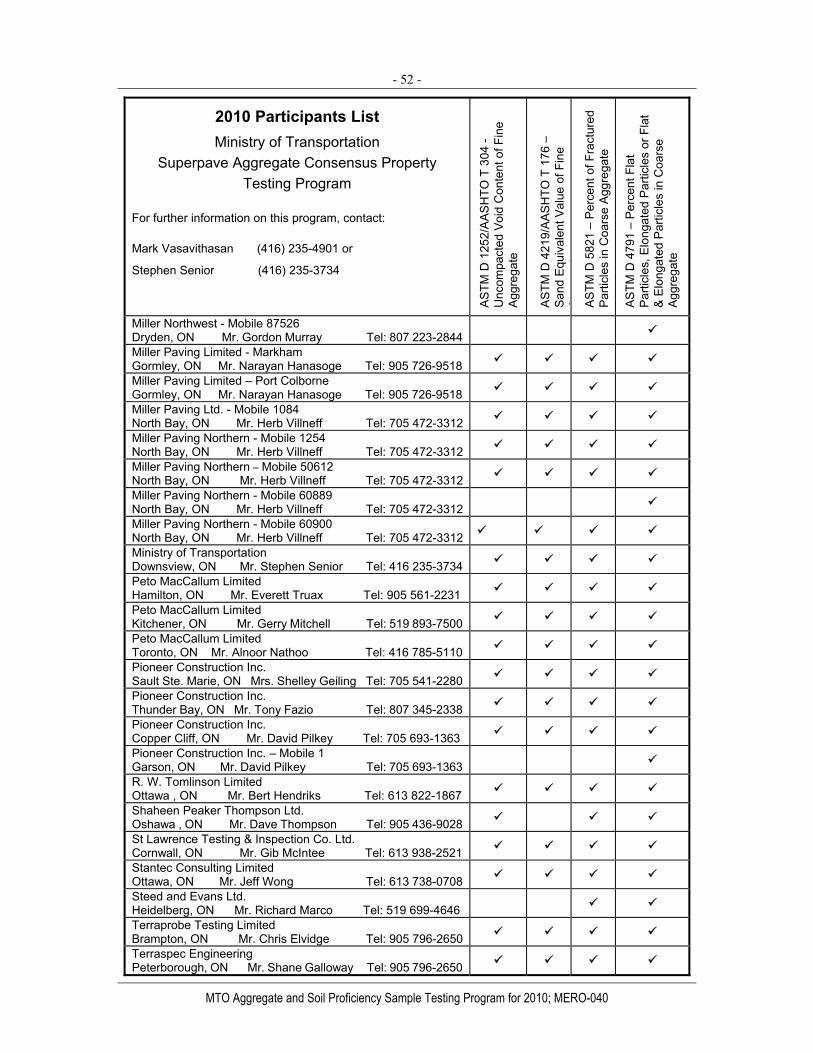
- 52 -
MTO Aggregate and Soil Proficiency Sample Testing Program for 2010; MERO-040
2010 Participants List Ministry of Transportation
Superpave Aggregate Consensus Property Testing Program
For further information on this program, contact: Mark Vasavithasan (416) 235-4901 or
Stephen Senior (416) 235-3734
AS
TM D
125
2/A
AS
HTO
T 3
04 -
Unc
ompa
cted
Voi
d C
onte
nt o
f Fin
e Ag
greg
ate
AS
TM D
421
9/A
AS
HTO
T 1
76 –
Sa
nd E
quiv
alen
t Val
ue o
f Fin
e A
tA
STM
D 5
821
– P
erce
nt o
f Fra
ctur
ed
Par
ticle
s in
Coa
rse
Agg
rega
te
AS
TM D
479
1 –
Per
cent
Fla
t P
artic
les,
Elo
ngat
ed P
artic
les
or F
lat
& E
long
ated
Par
ticle
s in
Coa
rse
Aggr
egat
e
Miller Northwest - Mobile 87526 Dryden, ON Mr. Gordon Murray Tel: 807 223-2844
Miller Paving Limited - Markham Gormley, ON Mr. Narayan Hanasoge Tel: 905 726-9518
Miller Paving Limited – Port Colborne Gormley, ON Mr. Narayan Hanasoge Tel: 905 726-9518
Miller Paving Ltd. - Mobile 1084 North Bay, ON Mr. Herb Villneff Tel: 705 472-3312
Miller Paving Northern - Mobile 1254 North Bay, ON Mr. Herb Villneff Tel: 705 472-3312
Miller Paving Northern – Mobile 50612 North Bay, ON Mr. Herb Villneff Tel: 705 472-3312
Miller Paving Northern - Mobile 60889 North Bay, ON Mr. Herb Villneff Tel: 705 472-3312
Miller Paving Northern - Mobile 60900 North Bay, ON Mr. Herb Villneff Tel: 705 472-3312
Ministry of Transportation Downsview, ON Mr. Stephen Senior Tel: 416 235-3734
Peto MacCallum Limited Hamilton, ON Mr. Everett Truax Tel: 905 561-2231
Peto MacCallum Limited Kitchener, ON Mr. Gerry Mitchell Tel: 519 893-7500
Peto MacCallum Limited Toronto, ON Mr. Alnoor Nathoo Tel: 416 785-5110
Pioneer Construction Inc. Sault Ste. Marie, ON Mrs. Shelley Geiling Tel: 705 541-2280
Pioneer Construction Inc. Thunder Bay, ON Mr. Tony Fazio Tel: 807 345-2338
Pioneer Construction Inc. Copper Cliff, ON Mr. David Pilkey Tel: 705 693-1363
Pioneer Construction Inc. – Mobile 1 Garson, ON Mr. David Pilkey Tel: 705 693-1363
R. W. Tomlinson Limited Ottawa , ON Mr. Bert Hendriks Tel: 613 822-1867
Shaheen Peaker Thompson Ltd. Oshawa , ON Mr. Dave Thompson Tel: 905 436-9028
St Lawrence Testing & Inspection Co. Ltd. Cornwall, ON Mr. Gib McIntee Tel: 613 938-2521
Stantec Consulting Limited Ottawa, ON Mr. Jeff Wong Tel: 613 738-0708
Steed and Evans Ltd. Heidelberg, ON Mr. Richard Marco Tel: 519 699-4646
Terraprobe Testing Limited Brampton, ON Mr. Chris Elvidge Tel: 905 796-2650
Terraspec Engineering Peterborough, ON Mr. Shane Galloway Tel: 905 796-2650
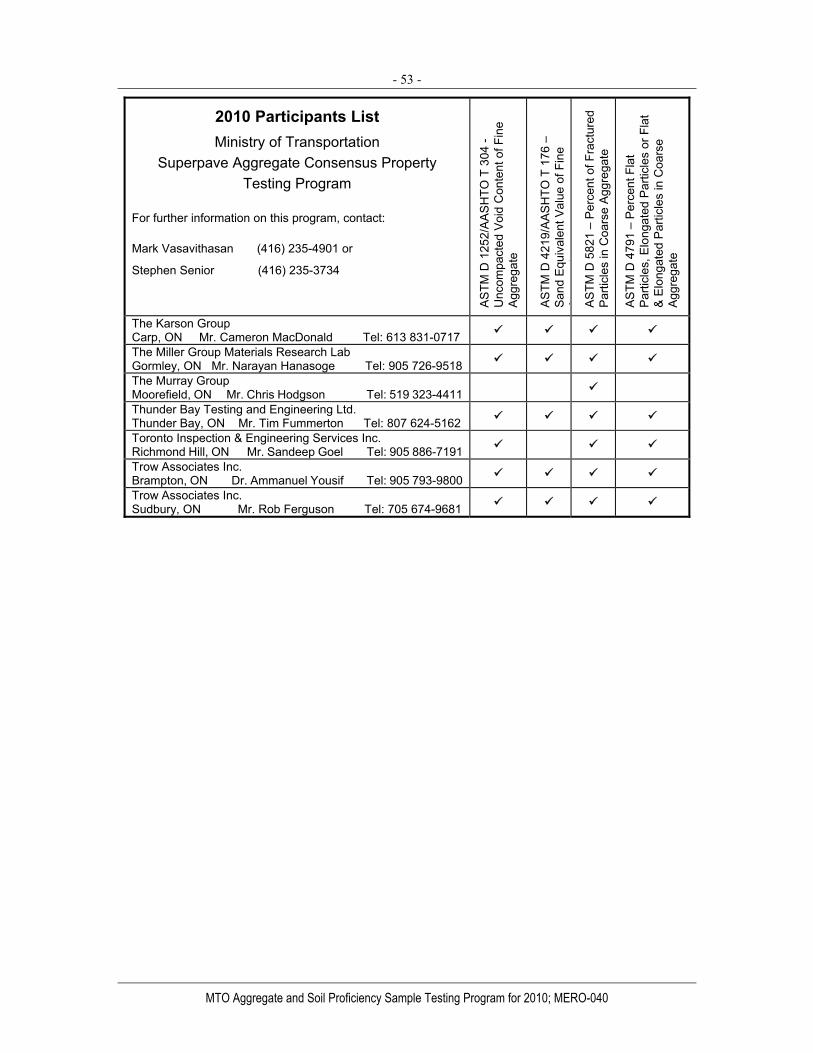
- 53 -
MTO Aggregate and Soil Proficiency Sample Testing Program for 2010; MERO-040
2010 Participants List Ministry of Transportation
Superpave Aggregate Consensus Property Testing Program
For further information on this program, contact: Mark Vasavithasan (416) 235-4901 or
Stephen Senior (416) 235-3734
AS
TM D
125
2/A
AS
HTO
T 3
04 -
Unc
ompa
cted
Voi
d C
onte
nt o
f Fin
e Ag
greg
ate
AS
TM D
421
9/A
AS
HTO
T 1
76 –
Sa
nd E
quiv
alen
t Val
ue o
f Fin
e A
tA
STM
D 5
821
– P
erce
nt o
f Fra
ctur
ed
Par
ticle
s in
Coa
rse
Agg
rega
te
AS
TM D
479
1 –
Per
cent
Fla
t P
artic
les,
Elo
ngat
ed P
artic
les
or F
lat
& E
long
ated
Par
ticle
s in
Coa
rse
Aggr
egat
e
The Karson Group Carp, ON Mr. Cameron MacDonald Tel: 613 831-0717
The Miller Group Materials Research Lab Gormley, ON Mr. Narayan Hanasoge Tel: 905 726-9518
The Murray Group Moorefield, ON Mr. Chris Hodgson Tel: 519 323-4411
Thunder Bay Testing and Engineering Ltd. Thunder Bay, ON Mr. Tim Fummerton Tel: 807 624-5162
Toronto Inspection & Engineering Services Inc. Richmond Hill, ON Mr. Sandeep Goel Tel: 905 886-7191
Trow Associates Inc. Brampton, ON Dr. Ammanuel Yousif Tel: 905 793-9800
Trow Associates Inc. Sudbury, ON Mr. Rob Ferguson Tel: 705 674-9681
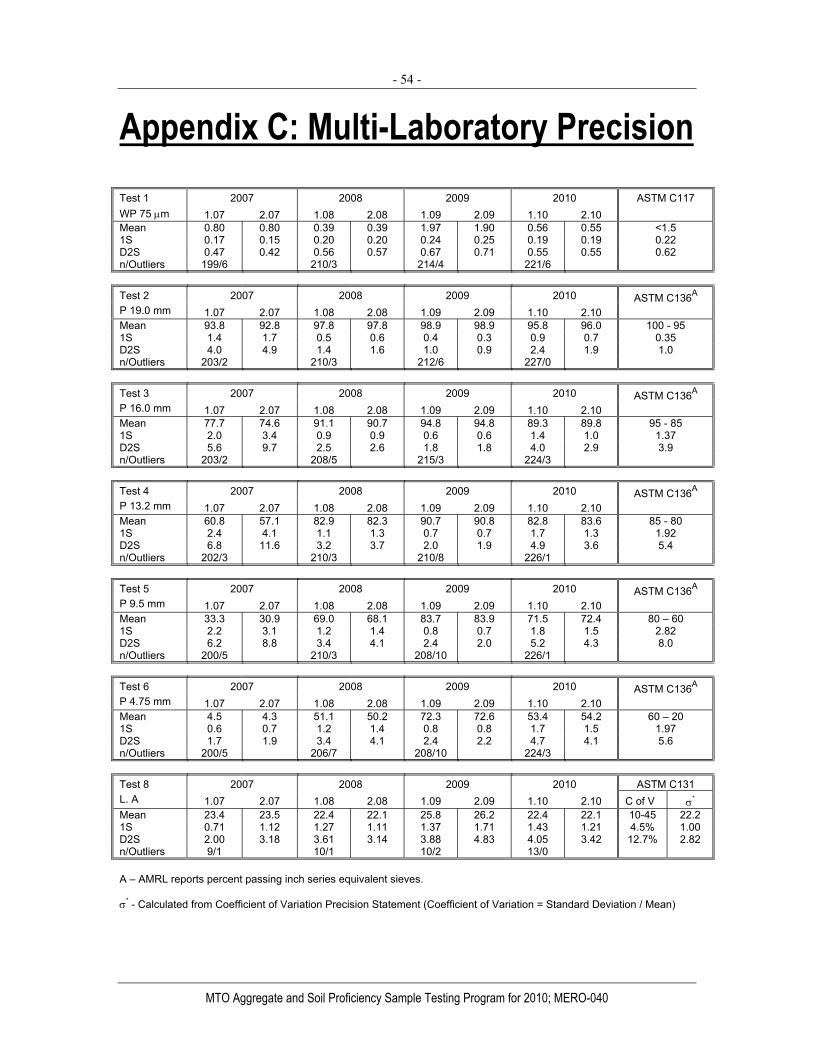
- 54 -
MTO Aggregate and Soil Proficiency Sample Testing Program for 2010; MERO-040
Appendix C: Multi-Laboratory Precision 2007 2008 2009 2010 Test 1
WP 75 μm 1.07 2.07 1.08 2.08 1.09 2.09 1.10 2.10 ASTM C117
Mean 0.80 0.80 0.39 0.39 1.97 1.90 0.56 0.55 <1.5 1S 0.17 0.15 0.20 0.20 0.24 0.25 0.19 0.19 0.22 D2S 0.47 0.42 0.56 0.57 0.67 0.71 0.55 0.55 0.62 n/Outliers 199/6 210/3 214/4 221/6
2007 2008 2009 2010 Test 2 P 19.0 mm 1.07 2.07 1.08 2.08 1.09 2.09 1.10 2.10
ASTM C136A
Mean 93.8 92.8 97.8 97.8 98.9 98.9 95.8 96.0 100 - 95 1S 1.4 1.7 0.5 0.6 0.4 0.3 0.9 0.7 0.35 D2S 4.0 4.9 1.4 1.6 1.0 0.9 2.4 1.9 1.0 n/Outliers 203/2 210/3 212/6 227/0
2007 2008 2009 2010 Test 3 P 16.0 mm 1.07 2.07 1.08 2.08 1.09 2.09 1.10 2.10
ASTM C136A
Mean 77.7 74.6 91.1 90.7 94.8 94.8 89.3 89.8 95 - 85 1S 2.0 3.4 0.9 0.9 0.6 0.6 1.4 1.0 1.37 D2S 5.6 9.7 2.5 2.6 1.8 1.8 4.0 2.9 3.9 n/Outliers 203/2 208/5 215/3 224/3
2007 2008 2009 2010 Test 4
P 13.2 mm 1.07 2.07 1.08 2.08 1.09 2.09 1.10 2.10 ASTM C136A
Mean 60.8 57.1 82.9 82.3 90.7 90.8 82.8 83.6 85 - 80 1S 2.4 4.1 1.1 1.3 0.7 0.7 1.7 1.3 1.92 D2S 6.8 11.6 3.2 3.7 2.0 1.9 4.9 3.6 5.4 n/Outliers 202/3 210/3 210/8 226/1
2007 2008 2009 2010 Test 5
P 9.5 mm 1.07 2.07 1.08 2.08 1.09 2.09 1.10 2.10 ASTM C136A
Mean 33.3 30.9 69.0 68.1 83.7 83.9 71.5 72.4 80 – 60 1S 2.2 3.1 1.2 1.4 0.8 0.7 1.8 1.5 2.82 D2S 6.2 8.8 3.4 4.1 2.4 2.0 5.2 4.3 8.0 n/Outliers 200/5 210/3 208/10 226/1
2007 2008 2009 2010 Test 6 P 4.75 mm 1.07 2.07 1.08 2.08 1.09 2.09 1.10 2.10
ASTM C136A
Mean 4.5 4.3 51.1 50.2 72.3 72.6 53.4 54.2 60 – 20 1S 0.6 0.7 1.2 1.4 0.8 0.8 1.7 1.5 1.97 D2S 1.7 1.9 3.4 4.1 2.4 2.2 4.7 4.1 5.6 n/Outliers 200/5 206/7 208/10 224/3
2007 2008 2009 2010 ASTM C131 Test 8
L. A 1.07 2.07 1.08 2.08 1.09 2.09 1.10 2.10 C of V σ*
Mean 23.4 23.5 22.4 22.1 25.8 26.2 22.4 22.1 10-45 22.2 1S 0.71 1.12 1.27 1.11 1.37 1.71 1.43 1.21 4.5% 1.00 D2S 2.00 3.18 3.61 3.14 3.88 4.83 4.05 3.42 12.7% 2.82 n/Outliers 9/1 10/1 10/2 13/0
A – AMRL reports percent passing inch series equivalent sieves. σ* - Calculated from Coefficient of Variation Precision Statement (Coefficient of Variation = Standard Deviation / Mean)
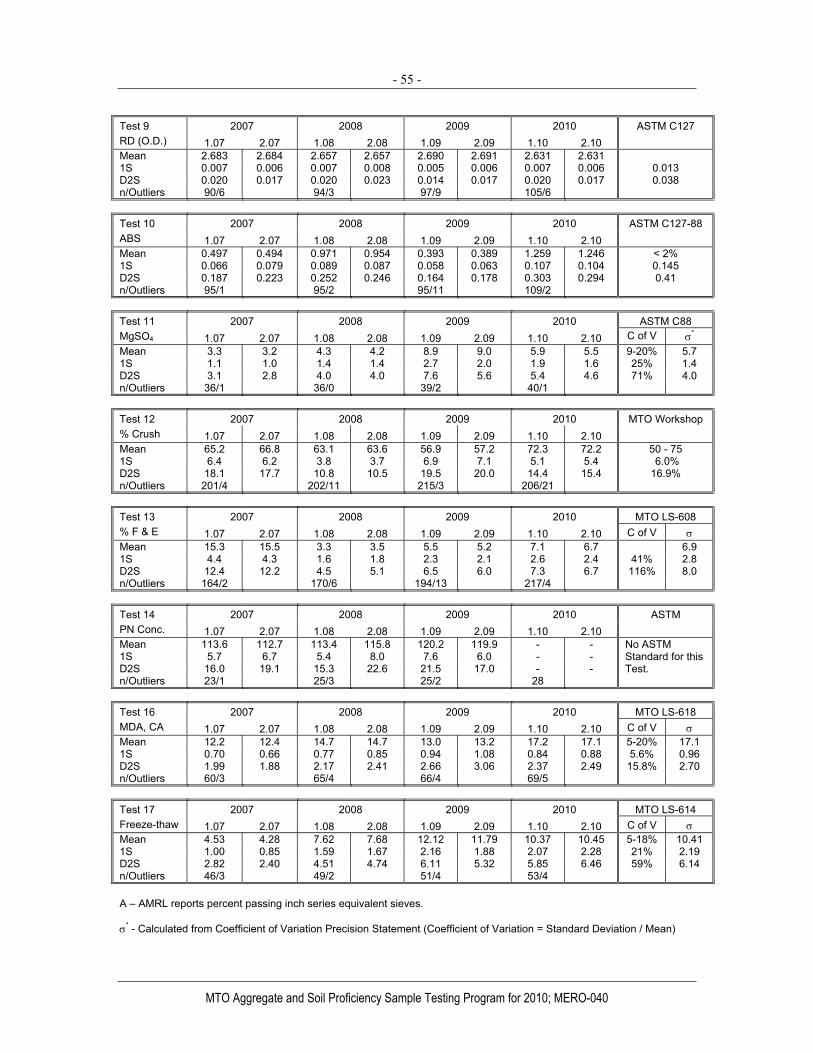
- 55 -
MTO Aggregate and Soil Proficiency Sample Testing Program for 2010; MERO-040
2007 2008 2009 2010 Test 9
RD (O.D.) 1.07 2.07 1.08 2.08 1.09 2.09 1.10 2.10 ASTM C127
Mean 2.683 2.684 2.657 2.657 2.690 2.691 2.631 2.631 1S 0.007 0.006 0.007 0.008 0.005 0.006 0.007 0.006 0.013 D2S 0.020 0.017 0.020 0.023 0.014 0.017 0.020 0.017 0.038 n/Outliers 90/6 94/3 97/9 105/6
2007 2008 2009 2010 Test 10 ABS 1.07 2.07 1.08 2.08 1.09 2.09 1.10 2.10
ASTM C127-88
Mean 0.497 0.494 0.971 0.954 0.393 0.389 1.259 1.246 < 2% 1S 0.066 0.079 0.089 0.087 0.058 0.063 0.107 0.104 0.145 D2S 0.187 0.223 0.252 0.246 0.164 0.178 0.303 0.294 0.41 n/Outliers 95/1 95/2 95/11 109/2
2007 2008 2009 2010 ASTM C88 Test 11 MgSO4 1.07 2.07 1.08 2.08 1.09 2.09 1.10 2.10 C of V σ* Mean 3.3 3.2 4.3 4.2 8.9 9.0 5.9 5.5 9-20% 5.7 1S 1.1 1.0 1.4 1.4 2.7 2.0 1.9 1.6 25% 1.4 D2S 3.1 2.8 4.0 4.0 7.6 5.6 5.4 4.6 71% 4.0 n/Outliers 36/1 36/0 39/2 40/1
2007 2008 2009 2010 Test 12
% Crush 1.07 2.07 1.08 2.08 1.09 2.09 1.10 2.10 MTO Workshop
Mean 65.2 66.8 63.1 63.6 56.9 57.2 72.3 72.2 50 - 75 1S 6.4 6.2 3.8 3.7 6.9 7.1 5.1 5.4 6.0% D2S 18.1 17.7 10.8 10.5 19.5 20.0 14.4 15.4 16.9% n/Outliers 201/4 202/11 215/3 206/21
2007 2008 2009 2010 MTO LS-608 Test 13
% F & E 1.07 2.07 1.08 2.08 1.09 2.09 1.10 2.10 C of V σ Mean 15.3 15.5 3.3 3.5 5.5 5.2 7.1 6.7 6.9 1S 4.4 4.3 1.6 1.8 2.3 2.1 2.6 2.4 41% 2.8 D2S 12.4 12.2 4.5 5.1 6.5 6.0 7.3 6.7 116% 8.0 n/Outliers 164/2 170/6 194/13 217/4
2007 2008 2009 2010 Test 14 PN Conc. 1.07 2.07 1.08 2.08 1.09 2.09 1.10 2.10
ASTM
Mean 113.6 112.7 113.4 115.8 120.2 119.9 - - No ASTM 1S 5.7 6.7 5.4 8.0 7.6 6.0 - - Standard for this D2S 16.0 19.1 15.3 22.6 21.5 17.0 - - Test. n/Outliers 23/1 25/3 25/2 28
2007 2008 2009 2010 MTO LS-618 Test 16
MDA, CA 1.07 2.07 1.08 2.08 1.09 2.09 1.10 2.10 C of V σ Mean 12.2 12.4 14.7 14.7 13.0 13.2 17.2 17.1 5-20% 17.1 1S 0.70 0.66 0.77 0.85 0.94 1.08 0.84 0.88 5.6% 0.96 D2S 1.99 1.88 2.17 2.41 2.66 3.06 2.37 2.49 15.8% 2.70 n/Outliers 60/3 65/4 66/4 69/5
2007 2008 2009 2010 MTO LS-614 Test 17
Freeze-thaw 1.07 2.07 1.08 2.08 1.09 2.09 1.10 2.10 C of V σ Mean 4.53 4.28 7.62 7.68 12.12 11.79 10.37 10.45 5-18% 10.41 1S 1.00 0.85 1.59 1.67 2.16 1.88 2.07 2.28 21% 2.19 D2S 2.82 2.40 4.51 4.74 6.11 5.32 5.85 6.46 59% 6.14 n/Outliers 46/3 49/2 51/4 53/4
A – AMRL reports percent passing inch series equivalent sieves. σ* - Calculated from Coefficient of Variation Precision Statement (Coefficient of Variation = Standard Deviation / Mean)
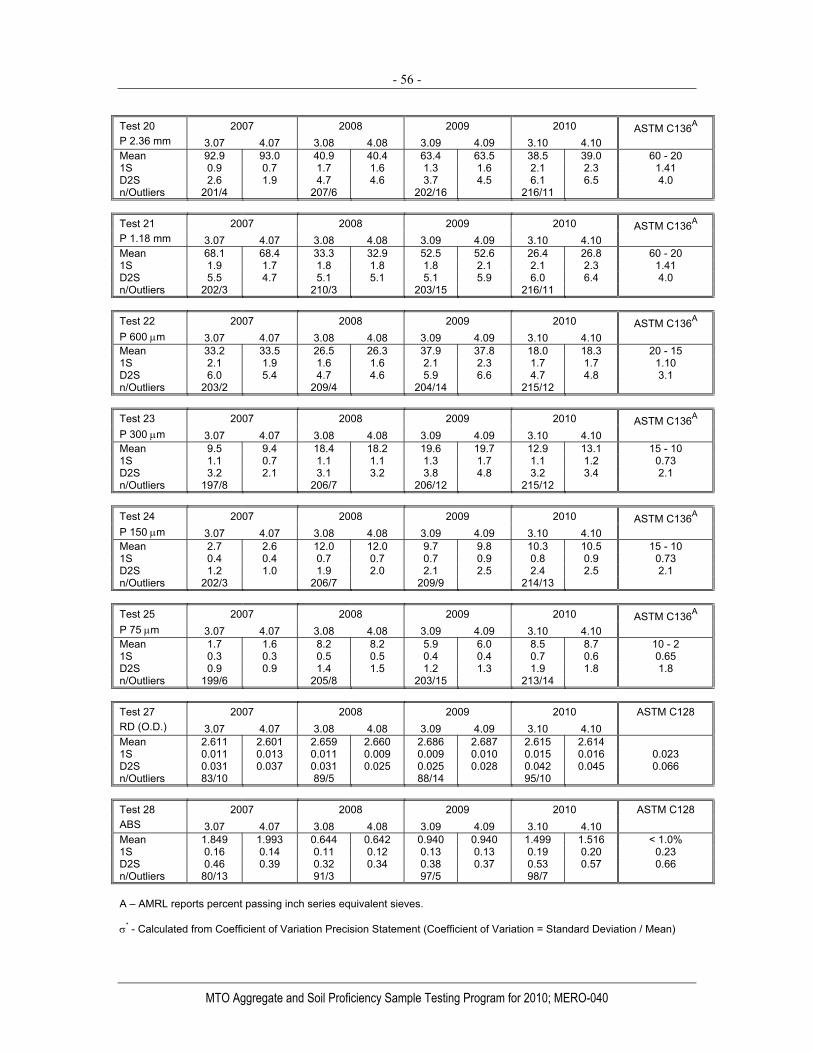
- 56 -
MTO Aggregate and Soil Proficiency Sample Testing Program for 2010; MERO-040
2007 2008 2009 2010 Test 20
P 2.36 mm 3.07 4.07 3.08 4.08 3.09 4.09 3.10 4.10 ASTM C136A
Mean 92.9 93.0 40.9 40.4 63.4 63.5 38.5 39.0 60 - 20 1S 0.9 0.7 1.7 1.6 1.3 1.6 2.1 2.3 1.41 D2S 2.6 1.9 4.7 4.6 3.7 4.5 6.1 6.5 4.0 n/Outliers 201/4 207/6 202/16 216/11
2007 2008 2009 2010 Test 21
P 1.18 mm 3.07 4.07 3.08 4.08 3.09 4.09 3.10 4.10 ASTM C136A
Mean 68.1 68.4 33.3 32.9 52.5 52.6 26.4 26.8 60 - 20 1S 1.9 1.7 1.8 1.8 1.8 2.1 2.1 2.3 1.41 D2S 5.5 4.7 5.1 5.1 5.1 5.9 6.0 6.4 4.0 n/Outliers 202/3 210/3 203/15 216/11
2007 2008 2009 2010 Test 22
P 600 μm 3.07 4.07 3.08 4.08 3.09 4.09 3.10 4.10 ASTM C136A
Mean 33.2 33.5 26.5 26.3 37.9 37.8 18.0 18.3 20 - 15 1S 2.1 1.9 1.6 1.6 2.1 2.3 1.7 1.7 1.10 D2S 6.0 5.4 4.7 4.6 5.9 6.6 4.7 4.8 3.1 n/Outliers 203/2 209/4 204/14 215/12
2007 2008 2009 2010 Test 23 P 300 μm 3.07 4.07 3.08 4.08 3.09 4.09 3.10 4.10
ASTM C136A
Mean 9.5 9.4 18.4 18.2 19.6 19.7 12.9 13.1 15 - 10 1S 1.1 0.7 1.1 1.1 1.3 1.7 1.1 1.2 0.73 D2S 3.2 2.1 3.1 3.2 3.8 4.8 3.2 3.4 2.1 n/Outliers 197/8 206/7 206/12 215/12
2007 2008 2009 2010 Test 24 P 150 μm 3.07 4.07 3.08 4.08 3.09 4.09 3.10 4.10
ASTM C136A
Mean 2.7 2.6 12.0 12.0 9.7 9.8 10.3 10.5 15 - 10 1S 0.4 0.4 0.7 0.7 0.7 0.9 0.8 0.9 0.73 D2S 1.2 1.0 1.9 2.0 2.1 2.5 2.4 2.5 2.1 n/Outliers 202/3 206/7 209/9 214/13
2007 2008 2009 2010 Test 25
P 75 μm 3.07 4.07 3.08 4.08 3.09 4.09 3.10 4.10 ASTM C136A
Mean 1.7 1.6 8.2 8.2 5.9 6.0 8.5 8.7 10 - 2 1S 0.3 0.3 0.5 0.5 0.4 0.4 0.7 0.6 0.65 D2S 0.9 0.9 1.4 1.5 1.2 1.3 1.9 1.8 1.8 n/Outliers 199/6 205/8 203/15 213/14
2007 2008 2009 2010 Test 27
RD (O.D.) 3.07 4.07 3.08 4.08 3.09 4.09 3.10 4.10 ASTM C128
Mean 2.611 2.601 2.659 2.660 2.686 2.687 2.615 2.614 1S 0.011 0.013 0.011 0.009 0.009 0.010 0.015 0.016 0.023 D2S 0.031 0.037 0.031 0.025 0.025 0.028 0.042 0.045 0.066 n/Outliers 83/10 89/5 88/14 95/10
2007 2008 2009 2010 Test 28 ABS 3.07 4.07 3.08 4.08 3.09 4.09 3.10 4.10
ASTM C128
Mean 1.849 1.993 0.644 0.642 0.940 0.940 1.499 1.516 < 1.0% 1S 0.16 0.14 0.11 0.12 0.13 0.13 0.19 0.20 0.23 D2S 0.46 0.39 0.32 0.34 0.38 0.37 0.53 0.57 0.66 n/Outliers 80/13 91/3 97/5 98/7
A – AMRL reports percent passing inch series equivalent sieves. σ* - Calculated from Coefficient of Variation Precision Statement (Coefficient of Variation = Standard Deviation / Mean)
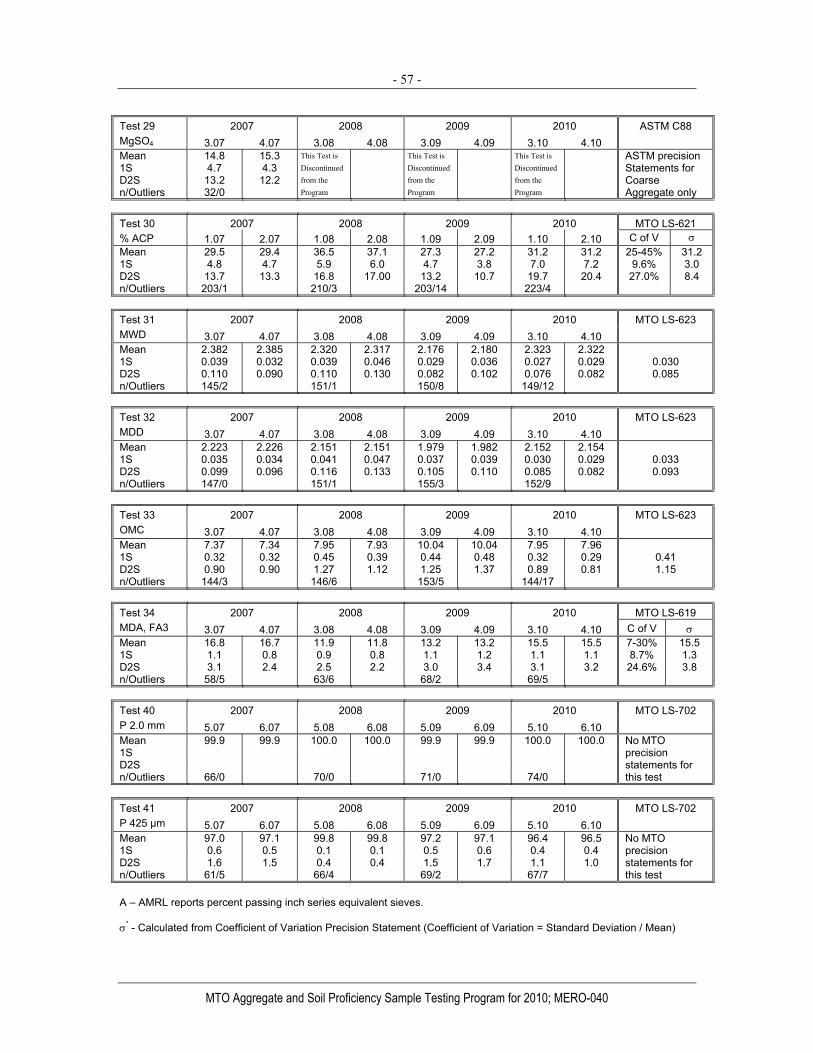
- 57 -
MTO Aggregate and Soil Proficiency Sample Testing Program for 2010; MERO-040
2007 2008 2009 2010 Test 29
MgSO4 3.07 4.07 3.08 4.08 3.09 4.09 3.10 4.10 ASTM C88
Mean 14.8 15.3 This Test is This Test is This Test is
1S 4.7 4.3 Discontinued Discontinued Discontinued
D2S 13.2 12.2 from the from the from the n/Outliers 32/0 Program Program Program
ASTM precision Statements for Coarse Aggregate only
2007 2008 2009 2010 MTO LS-621 Test 30
% ACP 1.07 2.07 1.08 2.08 1.09 2.09 1.10 2.10 C of V σ Mean 29.5 29.4 36.5 37.1 27.3 27.2 31.2 31.2 25-45% 31.2 1S 4.8 4.7 5.9 6.0 4.7 3.8 7.0 7.2 9.6% 3.0 D2S 13.7 13.3 16.8 17.00 13.2 10.7 19.7 20.4 27.0% 8.4 n/Outliers 203/1 210/3 203/14 223/4
2007 2008 2009 2010 Test 31
MWD 3.07 4.07 3.08 4.08 3.09 4.09 3.10 4.10 MTO LS-623
Mean 2.382 2.385 2.320 2.317 2.176 2.180 2.323 2.322 1S 0.039 0.032 0.039 0.046 0.029 0.036 0.027 0.029 0.030 D2S 0.110 0.090 0.110 0.130 0.082 0.102 0.076 0.082 0.085 n/Outliers 145/2 151/1 150/8 149/12
2007 2008 2009 2010 Test 32 MDD 3.07 4.07 3.08 4.08 3.09 4.09 3.10 4.10
MTO LS-623
Mean 2.223 2.226 2.151 2.151 1.979 1.982 2.152 2.154 1S 0.035 0.034 0.041 0.047 0.037 0.039 0.030 0.029 0.033 D2S 0.099 0.096 0.116 0.133 0.105 0.110 0.085 0.082 0.093 n/Outliers 147/0 151/1 155/3 152/9
2007 2008 2009 2010 Test 33 OMC 3.07 4.07 3.08 4.08 3.09 4.09 3.10 4.10
MTO LS-623
Mean 7.37 7.34 7.95 7.93 10.04 10.04 7.95 7.96 1S 0.32 0.32 0.45 0.39 0.44 0.48 0.32 0.29 0.41 D2S 0.90 0.90 1.27 1.12 1.25 1.37 0.89 0.81 1.15 n/Outliers 144/3 146/6 153/5 144/17
2007 2008 2009 2010 MTO LS-619 Test 34
MDA, FA3 3.07 4.07 3.08 4.08 3.09 4.09 3.10 4.10 C of V σ Mean 16.8 16.7 11.9 11.8 13.2 13.2 15.5 15.5 7-30% 15.5 1S 1.1 0.8 0.9 0.8 1.1 1.2 1.1 1.1 8.7% 1.3 D2S 3.1 2.4 2.5 2.2 3.0 3.4 3.1 3.2 24.6% 3.8 n/Outliers 58/5 63/6 68/2 69/5
2007 2008 2009 2010 Test 40
P 2.0 mm 5.07 6.07 5.08 6.08 5.09 6.09 5.10 6.10 MTO LS-702
Mean 99.9 99.9 100.0 100.0 99.9 99.9 100.0 100.0 1S D2S n/Outliers 66/0 70/0 71/0 74/0
No MTO precision statements for this test
2007 2008 2009 2010 Test 41
P 425 µm 5.07 6.07 5.08 6.08 5.09 6.09 5.10 6.10 MTO LS-702
Mean 97.0 97.1 99.8 99.8 97.2 97.1 96.4 96.5 1S 0.6 0.5 0.1 0.1 0.5 0.6 0.4 0.4 D2S 1.6 1.5 0.4 0.4 1.5 1.7 1.1 1.0 n/Outliers 61/5 66/4 69/2 67/7
No MTO precision statements for this test
A – AMRL reports percent passing inch series equivalent sieves. σ* - Calculated from Coefficient of Variation Precision Statement (Coefficient of Variation = Standard Deviation / Mean)

- 58 -
MTO Aggregate and Soil Proficiency Sample Testing Program for 2010; MERO-040
2007 2008 2009 2010 Test 42
P 75 µm 5.07 6.07 5.08 6.08 5.09 6.09 5.10 6.10 MTO LS-702
Mean 91.6 91.7 99.1 99.1 91.8 91.4 88.6 88.7 1S 0.8 0.8 0.3 0.3 1.0 0.9 0.5 0.3 D2S 2.3 2.2 1.0 1.0 2.9 2.6 1.3 1.0 n/Outliers 62/4 66/4 66/5 63/11
No MTO precision statements for this test
2007 2008 2009 2010 Test 43
P 20 µm 5.07 6.07 5.08 6.08 5.09 6.09 5.10 6.10 MTO LS-702
Mean 78.7 78.7 80.4 80.1 79.1 78.5 70.6 70.7 1S 3.5 4.1 4.6 4.5 3.9 3.5 4.4 4.2 D2S 9.8 11.5 12.9 12.7 11.0 10.0 12.5 12.0 n/Outliers 63/3 69/1 71/0 73/1
No MTO precision statements for this test
2007 2008 2009 2010 Test 44
P 5 µm 5.07 6.07 5.08 6.08 5.09 6.09 5.10 6.10 MTO LS-702
Mean 59.2 59.4 44.8 44.2 58.9 58.8 44.8 44.6 1S 2.8 3.2 3.8 3.0 3.6 3.5 3.0 3.3 D2S 8.0 9.1 10.8 8.6 10.1 9.9 8.5 9.4 n/Outliers 60/6 66/4 69/2 69/5
No MTO precision statements for this test
2007 2008 2009 2010 Test 45
P 2 µm 5.07 6.07 5.08 6.08 5.09 6.09 5.10 6.10 MTO LS-702
Mean 44.0 44.6 29.9 29.4 44.4 44.0 30.9 30.5 1S 3.4 3.3 3.3 3.2 2.9 3.1 2.7 3.4 D2S 9.7 9.5 9.5 9.0 8.3 8.8 7.8 9.6 n/Outliers 63/3 67/3 69/2 68/6
No MTO precision statements for this test
2007 2008 2009 2010 Test 46
L. L 5.07 6.07 5.08 6.08 5.09 6.09 5.10 6.10 ASTM D4318
Mean 37.0 37.2 32.6 32.7 36.9 36.7 27.0 27.2 33.3 1S 1.6 1.5 1.4 1.4 1.3 1.7 1.3 1.4 0.8 D2S 4.5 4.2 3.9 4.1 3.7 4.8 3.7 4.0 2 n/Outliers 76/3 77/3 79/6 84/6
2007 2008 2009 2010 Test 47 P. L 5.07 6.07 5.08 6.08 5.09 6.09 5.10 6.10
ASTM D4318
Mean 18.9 19.1 19.0 18.9 18.9 18.8 15.3 15.2 19.9 1S 1.3 0.9 1.1 1.0 1.2 1.3 1.0 1.1 1.3 D2S 3.8 2.7 3.1 2.9 3.5 3.7 2.8 3.0 4 n/Outliers 77/2 76/4 81/4 86/4
2007 2008 2009 2010 Test 48 P. I 5.07 6.07 5.08 6.08 5.09 6.09 5.10 6.10
ASTM D4318
Mean 18.1 18.1 13.8 13.8 17.9 17.8 11.8 11.9 13.4 1S 1.3 1.4 1.8 1.5 1.9 2.0 1.4 1.5 1.6 D2S 3.8 4.0 5.2 4.3 5.5 5.8 4.0 4.4 4 n/Outliers 70/9 75/5 84/1 86/4
2007 2008 2009 2010 Test 49 SG of Soils 5.07 6.07 5.08 6.08 5.09 6.09 5.10 6.10
AASHTO T 100
Mean 2.731 2.732 2.719 2.724 2.734 2.735 2.729 2.729 1S 0.027 0.026 0.029 0.023 0.031 0.029 0.026 0.029 0.04 D2S 0.076 0.074 0.082 0.065 0.088 0.082 0.074 0.082 0.11 n/Outliers 44/11 54/4 54/6 58/7
A – AMRL reports percent passing inch series equivalent sieves. σ* - Calculated from Coefficient of Variation Precision Statement (Coefficient of Variation = Standard Deviation / Mean)

- 59 -
MTO Aggregate and Soil Proficiency Sample Testing Program for 2010; MERO-040
2007 2008 2009 2010 Test 95
UC Void 3.07 4.07 3.08 4.08 3.09 4.09 3.10 4.10 ASTM C1252
Mean 41.32 41.21 41.86 41.91 41.97 41.92 43.02 43.00 1S 0.70 0.52 0.57 0.54 0.68 0.56 0.77 0.67 D2S 1.97 1.48 1.63 1.52 1.92 1.58 2.18 1.90 n/Outliers 54/3 52/6 59/4 58/8
ASTM C1252A 0.33% 0.93%
2007 2008 2009 2010 Test 96
SE Value 3.07 4.07 3.08 4.08 3.09 4.09 3.10 4.10 ASTM D2419
Mean 90.6 90.8 35.5 35.2 69.4 68.7 35.8 35.7 1S 3.49 3.75 4.01 3.95 5.12 5.33 7.6 7.5 D2S 9.89 10.63 11.34 11.19 14.48 15.09 21.43 21.36 n/Outliers 54/0 56/0 58/1 60/2
< 80 8.0
22.6
2007 2008 2009 2010 Test 97
% Fractured 1.07 2.07 1.08 2.08 1.09 2.09 1.10 2.10 ASTM D5821
Mean 67.0 67.8 63.6 64.4 58.3 58.8 74.6 75.1 1S 3.7 4.6 3.9 3.7 6.8 6.8 3.8 3.8 D2S 10.4 12.9 11.1 10.5 19.4 19.3 10.8 10.7 n/Outliers 54/4 58/2 61/3 67/3
76.0% 5.2% 14.7%
2007 2008 2009 2010 Test 99
% F & E 1.07 2.07 1.08 2.08 1.09 2.09 1.10 2.10 ASTM D4791
Mean 4.42 4.53 0.48 0.56 1.10 1.02 1.57 1.37 1S 1.86 1.99 0.35 0.31 0.68 0.67 0.83 0.71 D2S 5.27 5.63 1.00 0.89 1.92 1.90 2.35 2.00 n/Outliers 55/2 56/4 60/6 69/3
19.0 -12.5 mm 88.5%
250.4%
2007 2008 2009 2010 Test 123
Mortar Bar 1.07 2.07 1.08 2.08 1.09 2.09 1.10 2.10 ASTM C1260
Mean Not Not Not 0.191 0.373 1S Conducted Conducted Conducted 0.028 0.045 D2S 0.079 0.127 n/Outliers 19/1
Expansion >0.1% 15.2% 43%
A – AMRL reports percent passing inch series equivalent sieves. σ* - Calculated from Coefficient of Variation Precision Statement (Coefficient of Variation = Standard Deviation / Mean)
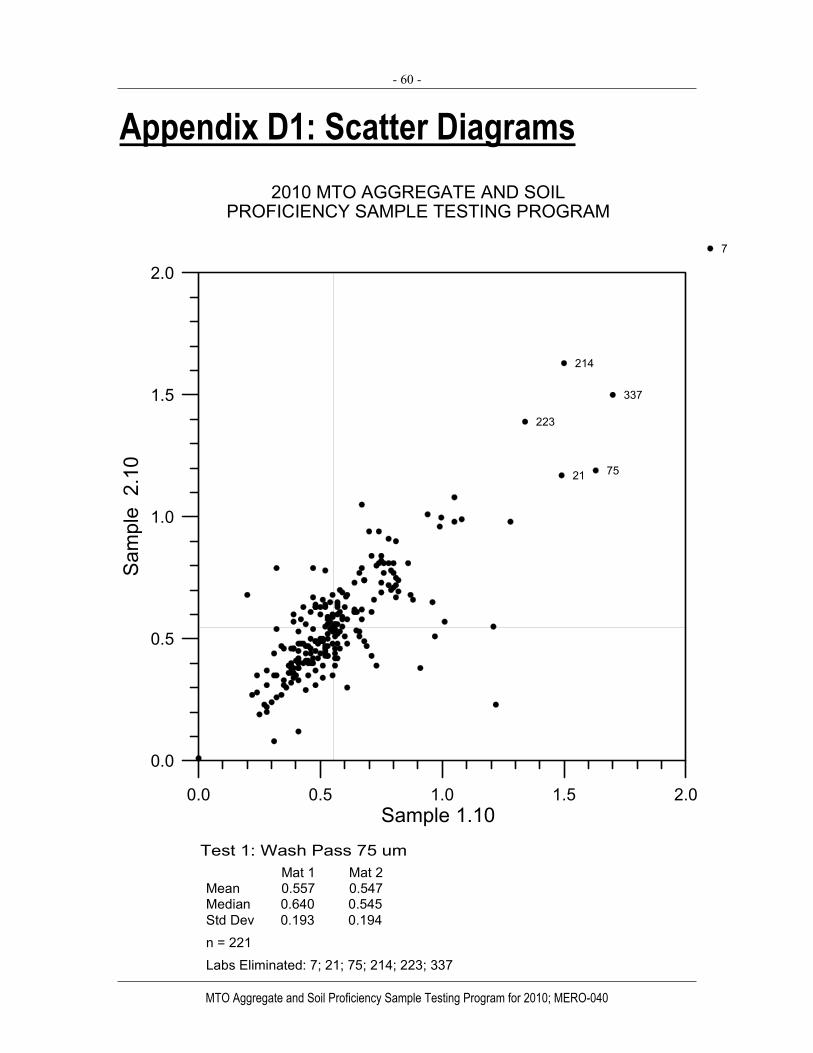
- 60 -
MTO Aggregate and Soil Proficiency Sample Testing Program for 2010; MERO-040
Appendix D1: Scatter Diagrams
Test 1: Wash Pass 75 um Mat 1 Mat 2Mean 0.557 0.547 Median 0.640 0.545Std Dev 0.193 0.194 n = 221Labs Eliminated: 7; 21; 75; 214; 223; 337
2010 MTO AGGREGATE AND SOILPROFICIENCY SAMPLE TESTING PROGRAM
0.0 0.5 1.0 1.5 2.0Sample 1.10
0.0
0.5
1.0
1.5
2.0
Sam
ple
2.1
0
7
21 75
214
223
337
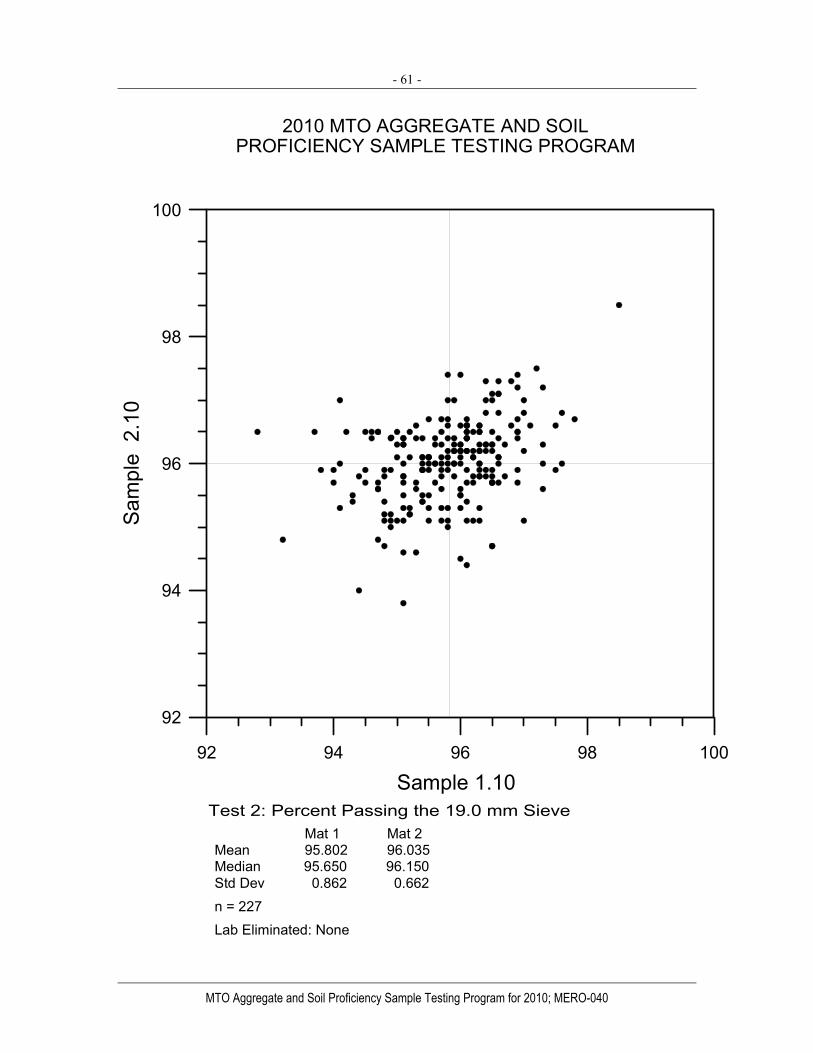
- 61 -
MTO Aggregate and Soil Proficiency Sample Testing Program for 2010; MERO-040
Test 2: Percent Passing the 19.0 mm Sieve Mat 1 Mat 2Mean 95.802 96.035 Median 95.650 96.150Std Dev 0.862 0.662 n = 227Lab Eliminated: None
2010 MTO AGGREGATE AND SOILPROFICIENCY SAMPLE TESTING PROGRAM
92 94 96 98 100
Sample 1.10
92
94
96
98
100
Sam
ple
2.1
0

- 62 -
MTO Aggregate and Soil Proficiency Sample Testing Program for 2010; MERO-040
Test 3: Percent Passing the 16.0 mm Sieve Mat 1 Mat 2Mean 89.311 89.817Median 89.850 90.000Std Dev 1.421 1.027n = 224Lab Eliminated: 34; 126; 287
2010 MTO AGGREGATE AND SOILPROFICIENCY SAMPLE TESTING PROGRAM
80 85 90 95 100
Sample 1.10
80
85
90
95
100
Sam
ple
2.1
0
34
126 287
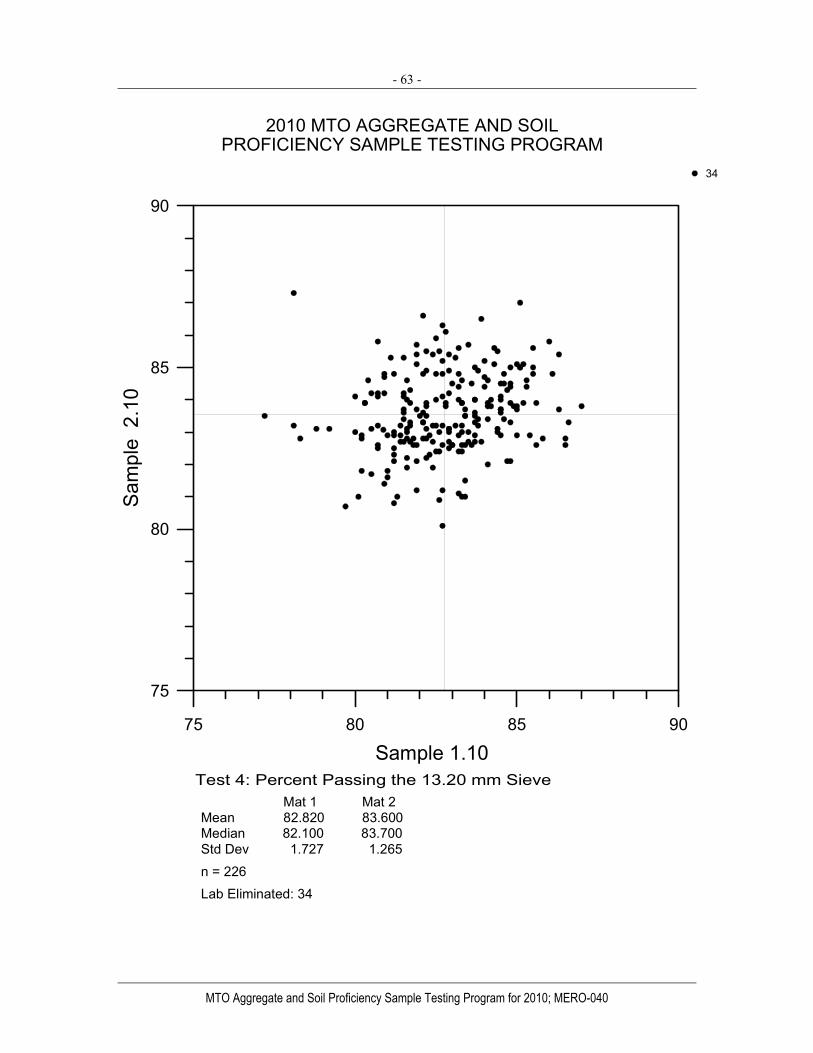
- 63 -
MTO Aggregate and Soil Proficiency Sample Testing Program for 2010; MERO-040
Test 4: Percent Passing the 13.20 mm Sieve Mat 1 Mat 2Mean 82.820 83.600Median 82.100 83.700Std Dev 1.727 1.265
n = 226Lab Eliminated: 34
2010 MTO AGGREGATE AND SOILPROFICIENCY SAMPLE TESTING PROGRAM
75 80 85 90
Sample 1.10
75
80
85
90
Sam
ple
2.1
0
34
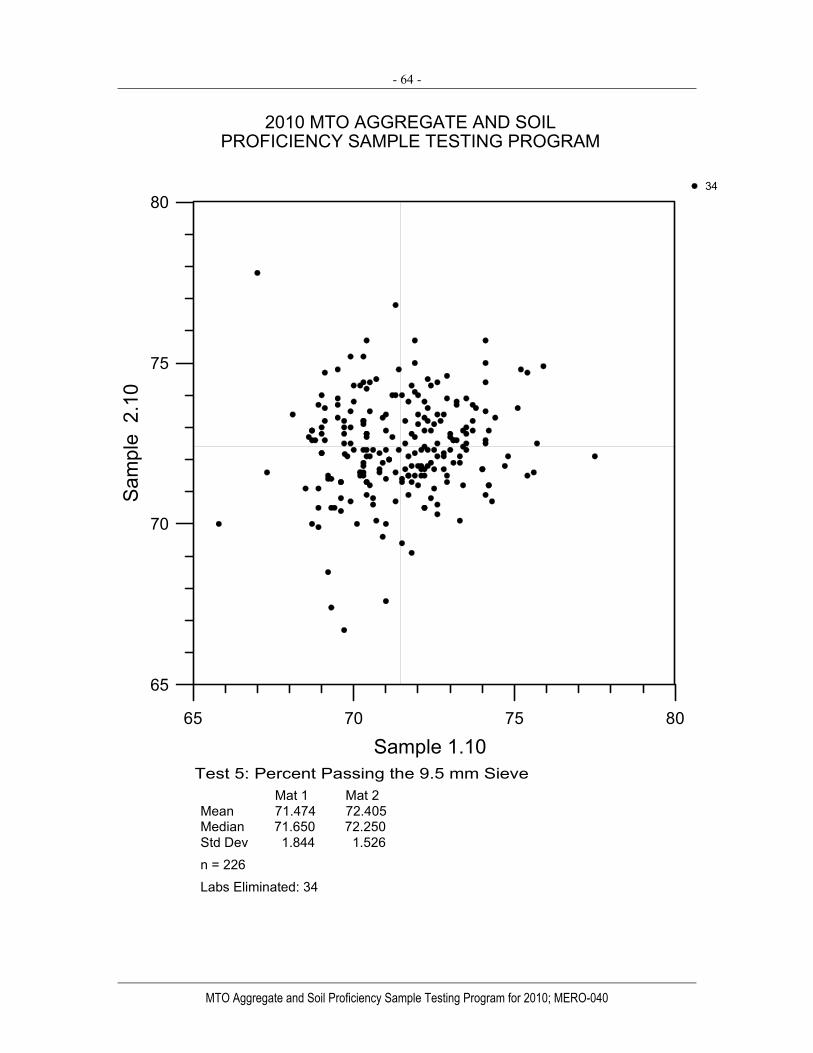
- 64 -
MTO Aggregate and Soil Proficiency Sample Testing Program for 2010; MERO-040
Test 5: Percent Passing the 9.5 mm Sieve Mat 1 Mat 2Mean 71.474 72.405 Median 71.650 72.250Std Dev 1.844 1.526n = 226Labs Eliminated: 34
2010 MTO AGGREGATE AND SOILPROFICIENCY SAMPLE TESTING PROGRAM
65 70 75 80
Sample 1.10
65
70
75
80
Sam
ple
2.1
0
34

- 65 -
MTO Aggregate and Soil Proficiency Sample Testing Program for 2010; MERO-040
Test 6: Percent Passing the 4.75 mm Sieve Mat 1 Mat 2Mean 53.416 54.195 Median 53.750 54.365Std Dev 1.679 1.462
n = 224Lab Eliminated: 4; 34; 172
2010 MTO AGGREGATE AND SOILPROFICIENCY SAMPLE TESTING PROGRAM
45 50 55 60
Sample 1.10
45
50
55
60
Sam
ple
2.1
0
434
172
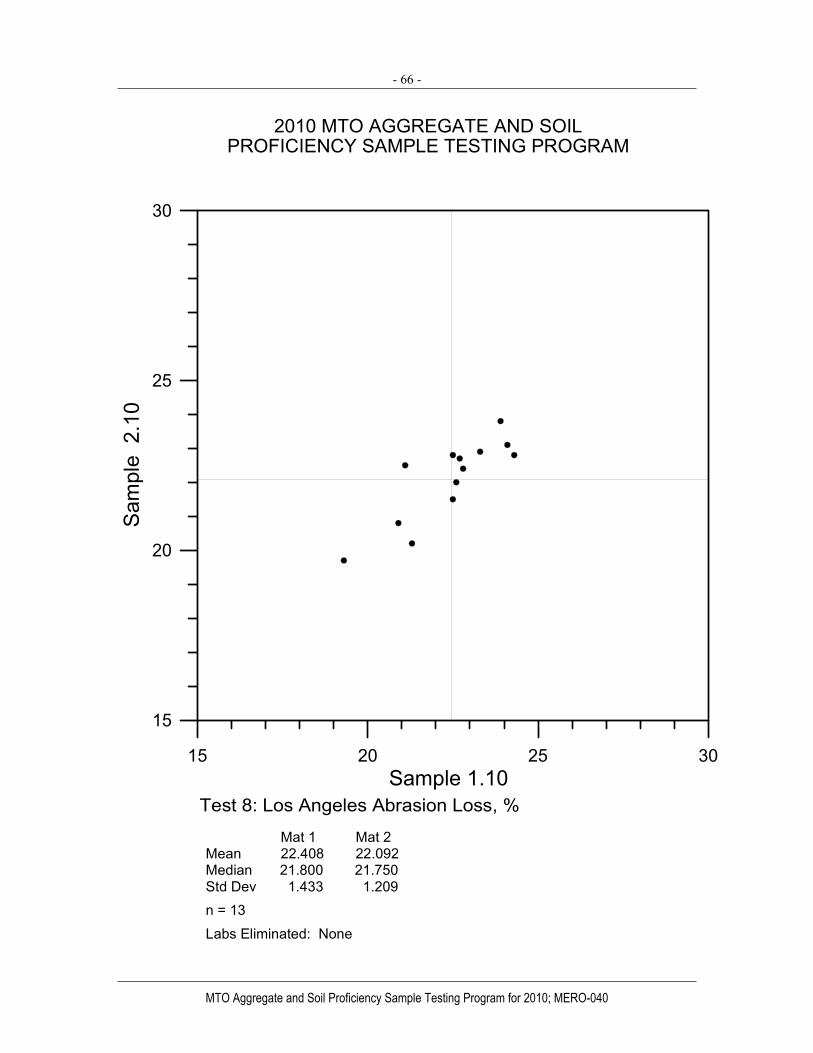
- 66 -
MTO Aggregate and Soil Proficiency Sample Testing Program for 2010; MERO-040
Test 8: Los Angeles Abrasion Loss, %
Mat 1 Mat 2Mean 22.408 22.092 Median 21.800 21.750Std Dev 1.433 1.209n = 13
Labs Eliminated: None
2010 MTO AGGREGATE AND SOILPROFICIENCY SAMPLE TESTING PROGRAM
15 20 25 30Sample 1.10
15
20
25
30
Sam
ple
2.1
0

- 67 -
MTO Aggregate and Soil Proficiency Sample Testing Program for 2010; MERO-040
Test 9: Relative Density of Coarse Aggregate (O. D) Mat 1 Mat 2Mean 2.631 2.631 Median 2.630 2.632Std Dev 0.007 0.006n = 105Labs Eliminated: 6; 77; 108; 113; 186; 205
2010 MTO AGGREGATE AND SOILPROFICIENCY SAMPLE TESTING PROGRAM
2.55 2.60 2.65 2.70
Sample 1.10
2.55
2.60
2.65
2.70
Sam
ple
2.1
0
6
77
108
113
186
205
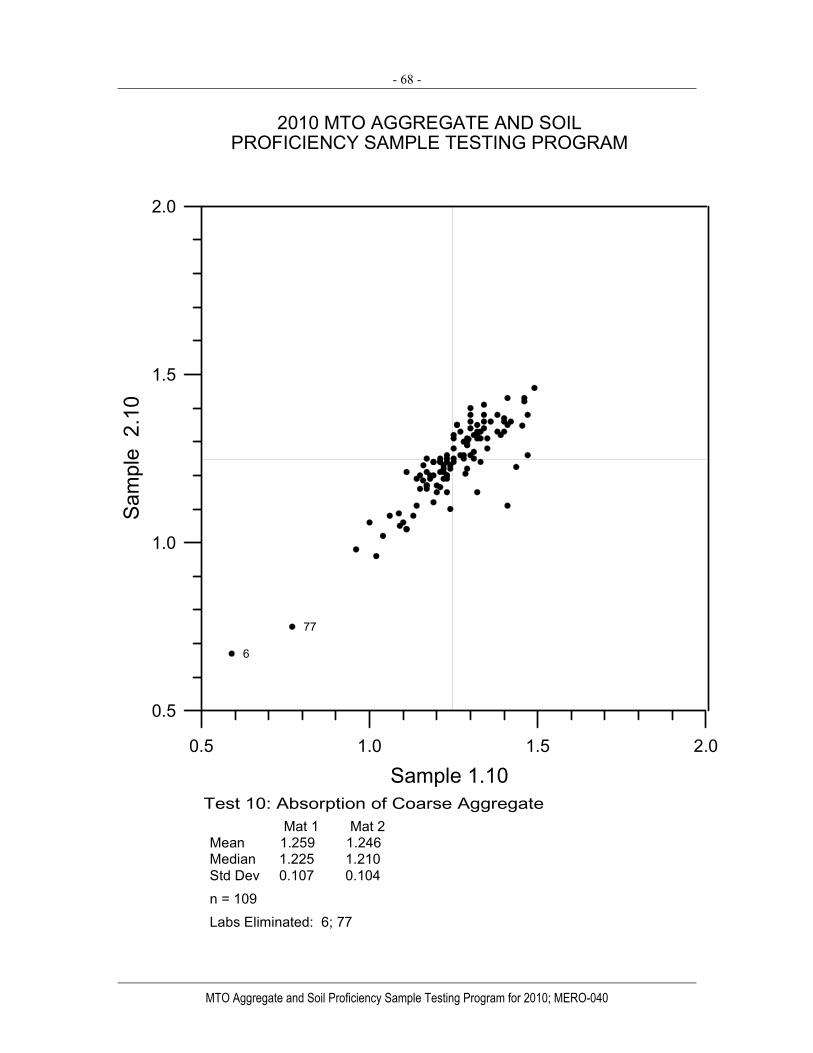
- 68 -
MTO Aggregate and Soil Proficiency Sample Testing Program for 2010; MERO-040
Test 10: Absorption of Coarse Aggregate Mat 1 Mat 2Mean 1.259 1.246Median 1.225 1.210Std Dev 0.107 0.104n = 109Labs Eliminated: 6; 77
2010 MTO AGGREGATE AND SOILPROFICIENCY SAMPLE TESTING PROGRAM
0.5 1.0 1.5 2.0
Sample 1.10
0.5
1.0
1.5
2.0
Sam
ple
2.1
0
6
77
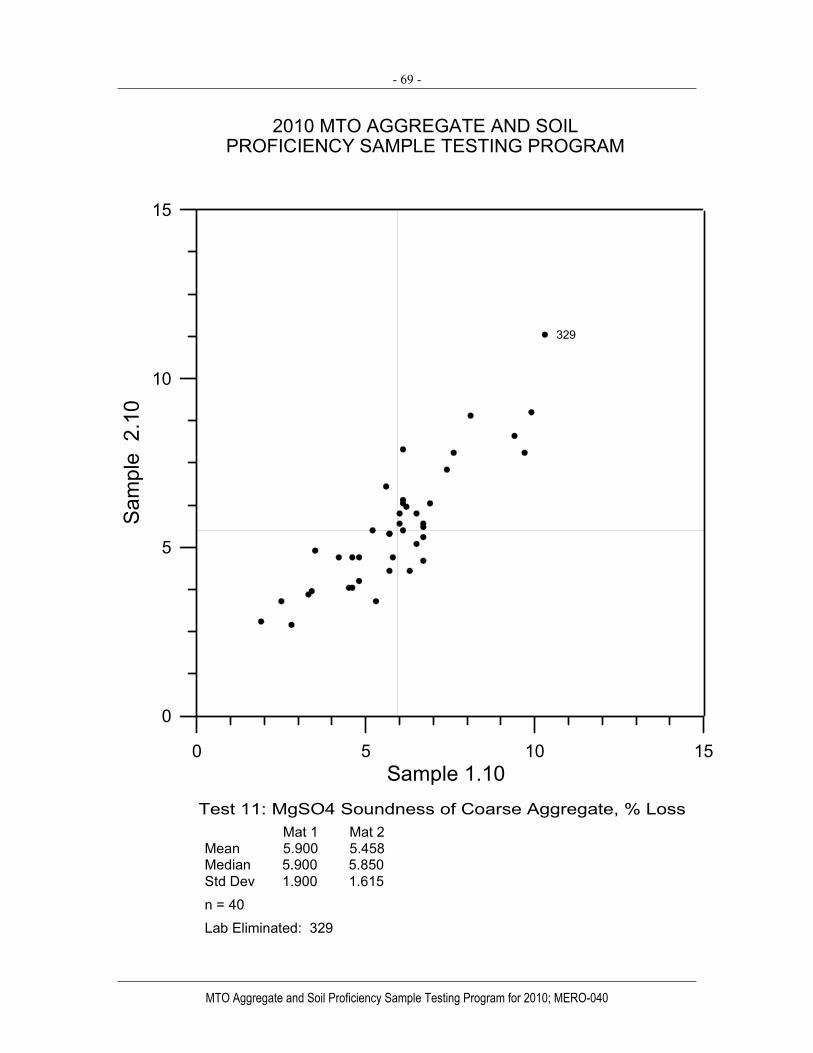
- 69 -
MTO Aggregate and Soil Proficiency Sample Testing Program for 2010; MERO-040
Test 11: MgSO4 Soundness of Coarse Aggregate, % Loss Mat 1 Mat 2Mean 5.900 5.458Median 5.900 5.850Std Dev 1.900 1.615n = 40Lab Eliminated: 329
2010 MTO AGGREGATE AND SOILPROFICIENCY SAMPLE TESTING PROGRAM
0 5 10 15Sample 1.10
0
5
10
15
Sam
ple
2.1
0
329
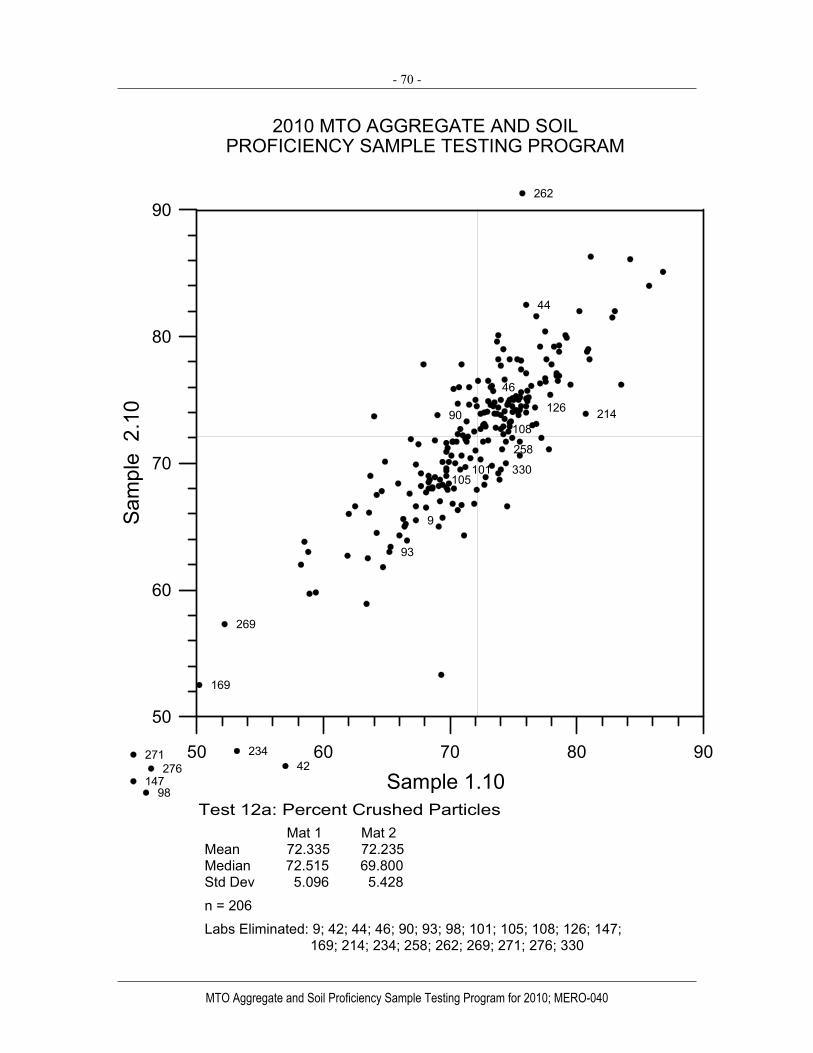
- 70 -
MTO Aggregate and Soil Proficiency Sample Testing Program for 2010; MERO-040
Test 12a: Percent Crushed Particles Mat 1 Mat 2Mean 72.335 72.235Median 72.515 69.800Std Dev 5.096 5.428
n = 206Labs Eliminated: 9; 42; 44; 46; 90; 93; 98; 101; 105; 108; 126; 147; 169; 214; 234; 258; 262; 269; 271; 276; 330
2010 MTO AGGREGATE AND SOILPROFICIENCY SAMPLE TESTING PROGRAM
50 60 70 80 90
Sample 1.10
50
60
70
80
90
Sam
ple
2.1
0
9
42
44
46
90
93
98
101105
108
126
147
169
214
234
258
262
269
271276
330

- 71 -
MTO Aggregate and Soil Proficiency Sample Testing Program for 2010; MERO-040
Test 12b: Percent Cemented Particles Mat 1 Mat 2Mean 6.406 6.575Median 10.150 9.650Std Dev 3.855 3.958
n = 208
Labs Eliminated: 7; 24; 38; 72; 169; 285
2010 MTO AGGREGATE AND SOILPROFICIENCY SAMPLE TESTING PROGRAM
0 5 10 15 20 25Sample 1.10
0
5
10
15
20
25
Sam
ple
2.1
0 7
24
38 72
169285

- 72 -
MTO Aggregate and Soil Proficiency Sample Testing Program for 2010; MERO-040
Test 13: Percent Flat and Elongated Particles Mat 1 Mat 2Mean 7.095 6.723Median 8.850 7.380Std Dev 2.596 2.383
n = 217Labs Eliminated: 23; 44; 74; 176
2010 MTO AGGREGATE AND SOILPROFICIENCY SAMPLE TESTING PROGRAM
0 4 8 12 16 20Sample 1.10
0
4
8
12
16
20
Sam
ple
2.1
0
23
4474
176

- 73 -
MTO Aggregate and Soil Proficiency Sample Testing Program for 2010; MERO-040
Test 14: Petrographic Number (Concrete) Mat 1 Mat 2Mean - - Median 157.4 158.2Std Dev - - n = 28Lab Eliminated: None
2010 MTO AGGREGATE AND SOILPROFICIENCY SAMPLE TESTING PROGRAM
100 120 140 160 180 200
Sample 1.10
100
120
140
160
180
200
Sam
ple
2.1
0
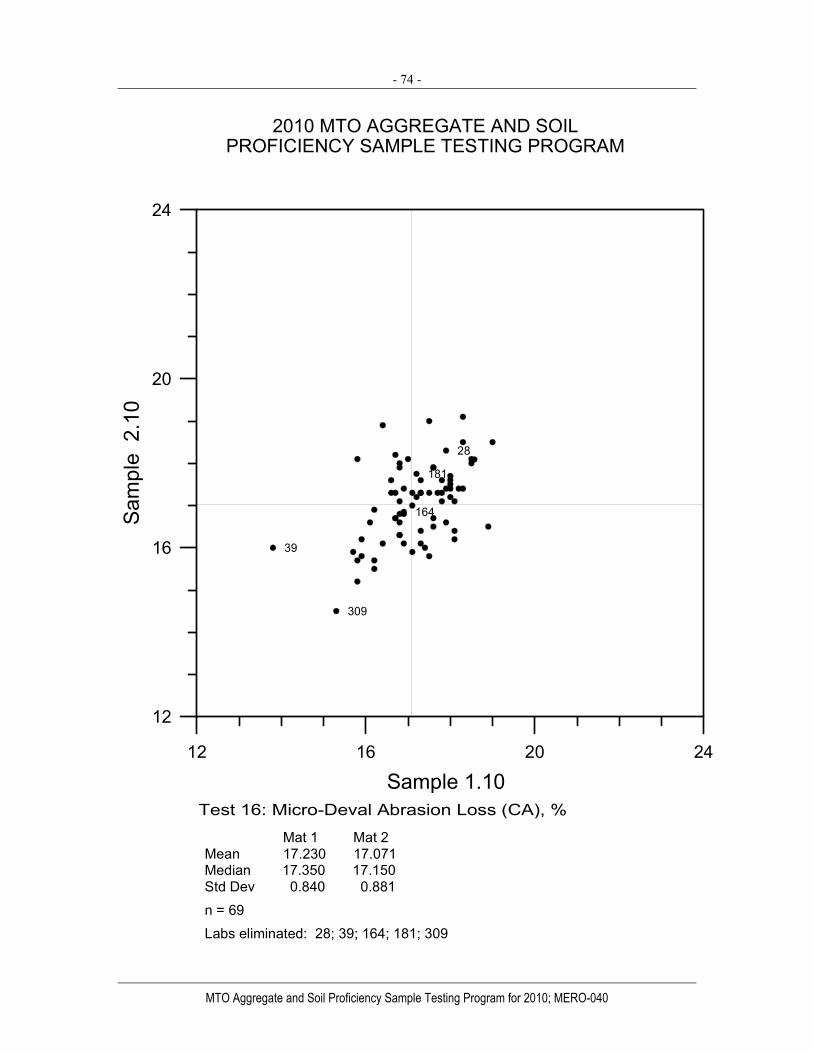
- 74 -
MTO Aggregate and Soil Proficiency Sample Testing Program for 2010; MERO-040
Test 16: Micro-Deval Abrasion Loss (CA), %
Mat 1 Mat 2Mean 17.230 17.071Median 17.350 17.150Std Dev 0.840 0.881
n = 69Labs eliminated: 28; 39; 164; 181; 309
2010 MTO AGGREGATE AND SOILPROFICIENCY SAMPLE TESTING PROGRAM
12 16 20 24
Sample 1.10
12
16
20
24
Sam
ple
2.1
0
28
39
164
181
309
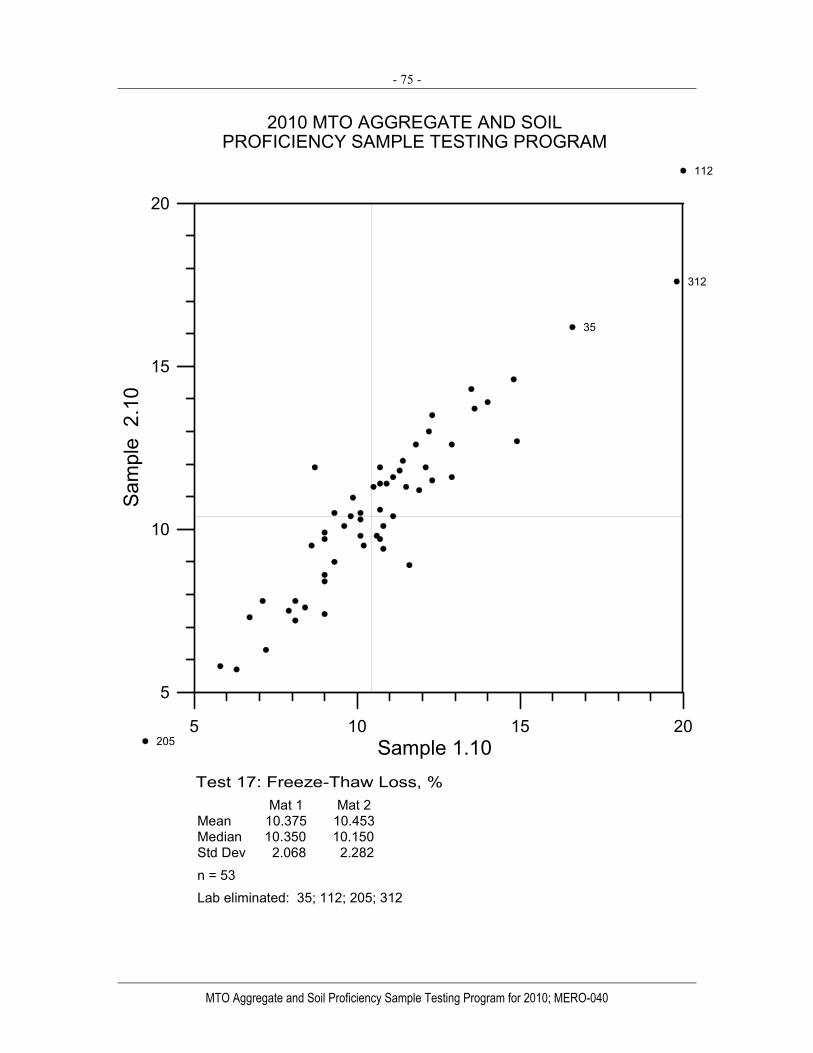
- 75 -
MTO Aggregate and Soil Proficiency Sample Testing Program for 2010; MERO-040
Test 17: Freeze-Thaw Loss, % Mat 1 Mat 2Mean 10.375 10.453Median 10.350 10.150Std Dev 2.068 2.282
n = 53Lab eliminated: 35; 112; 205; 312
2010 MTO AGGREGATE AND SOILPROFICIENCY SAMPLE TESTING PROGRAM
5 10 15 20Sample 1.10
5
10
15
20
Sam
ple
2.1
0
35
112
205
312

- 76 -
MTO Aggregate and Soil Proficiency Sample Testing Program for 2010; MERO-040
Test 20: Percent Passing the 2.36 mm Sieve Mat 1 Mat 2Mean 38.512 39.034Median 39.700 37.600Std Dev 2.141 2.300n = 216Labs Eliminated: 7; 29; 34; 73; 182; 186; 201; 202; 280; 312; 331
2010 MTO AGGREGATE AND SOILPROFICIENCY SAMPLE TESTING PROGRAM
30 35 40 45 50Sample 1.10
30
35
40
45
50
Sam
ple
2.1
0
729
3473
182186
201
202
280
312
331
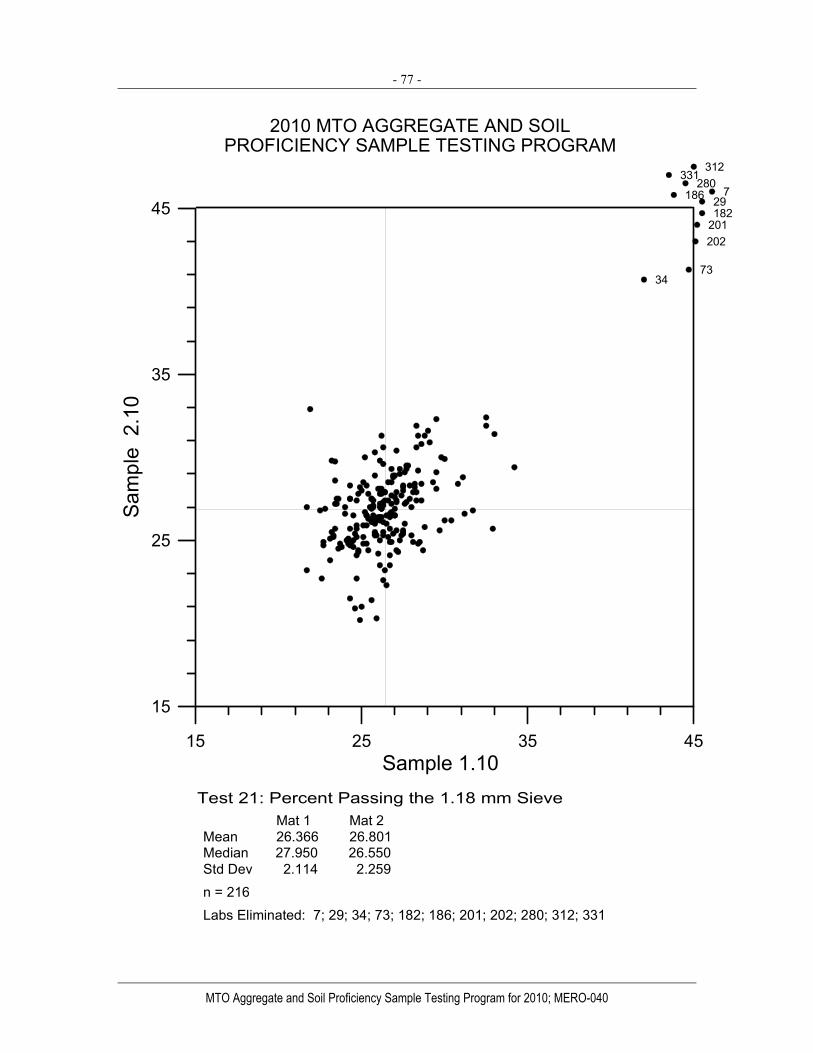
- 77 -
MTO Aggregate and Soil Proficiency Sample Testing Program for 2010; MERO-040
Test 21: Percent Passing the 1.18 mm Sieve Mat 1 Mat 2Mean 26.366 26.801Median 27.950 26.550Std Dev 2.114 2.259n = 216Labs Eliminated: 7; 29; 34; 73; 182; 186; 201; 202; 280; 312; 331
2010 MTO AGGREGATE AND SOILPROFICIENCY SAMPLE TESTING PROGRAM
15 25 35 45Sample 1.10
15
25
35
45
Sam
ple
2.1
0
729
3473
182186
201202
280312
331
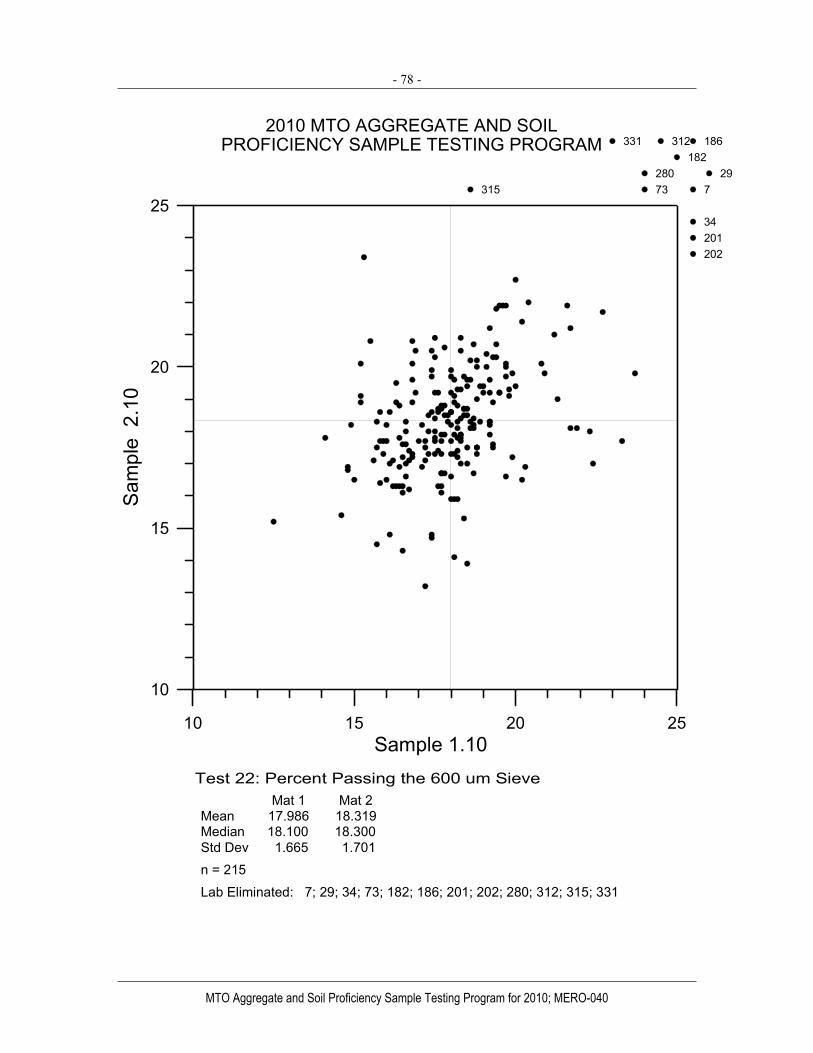
- 78 -
MTO Aggregate and Soil Proficiency Sample Testing Program for 2010; MERO-040
Test 22: Percent Passing the 600 um Sieve Mat 1 Mat 2Mean 17.986 18.319Median 18.100 18.300Std Dev 1.665 1.701n = 215Lab Eliminated: 7; 29; 34; 73; 182; 186; 201; 202; 280; 312; 315; 331
2010 MTO AGGREGATE AND SOILPROFICIENCY SAMPLE TESTING PROGRAM
10 15 20 25Sample 1.10
10
15
20
25
Sam
ple
2.1
0
729
34
73
182186
201202
280
312
315
331
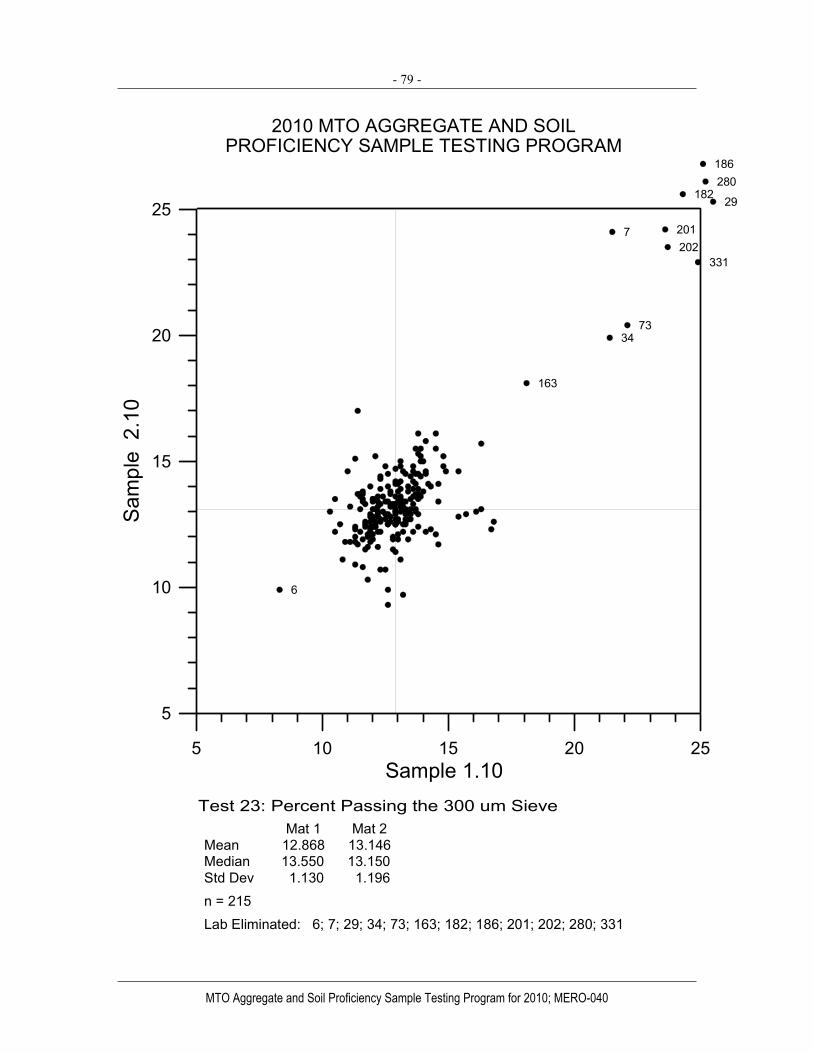
- 79 -
MTO Aggregate and Soil Proficiency Sample Testing Program for 2010; MERO-040
Test 23: Percent Passing the 300 um Sieve Mat 1 Mat 2Mean 12.868 13.146Median 13.550 13.150Std Dev 1.130 1.196n = 215Lab Eliminated: 6; 7; 29; 34; 73; 163; 182; 186; 201; 202; 280; 331
2010 MTO AGGREGATE AND SOILPROFICIENCY SAMPLE TESTING PROGRAM
5 10 15 20 25Sample 1.10
5
10
15
20
25
Sam
ple
2.1
0
6
7
29
3473
163
182
186
201202
280
331

- 80 -
MTO Aggregate and Soil Proficiency Sample Testing Program for 2010; MERO-040
Test 24: Percent Passing the 150 um Sieve Mat 1 Mat 2Mean 10.292 10.533Median 11.000 10.750Std Dev 0.848 0.883n = 214Lab Eliminated: 6; 7; 29; 34; 73; 164; 182; 186; 201; 202; 280; 312; 331
2010 MTO AGGREGATE AND SOILPROFICIENCY SAMPLE TESTING PROGRAM
0 5 10 15 20Sample 1.10
0
5
10
15
20
Sam
ple
2.1
0
6
729
34
73
164
182
186
201202
280
312
331
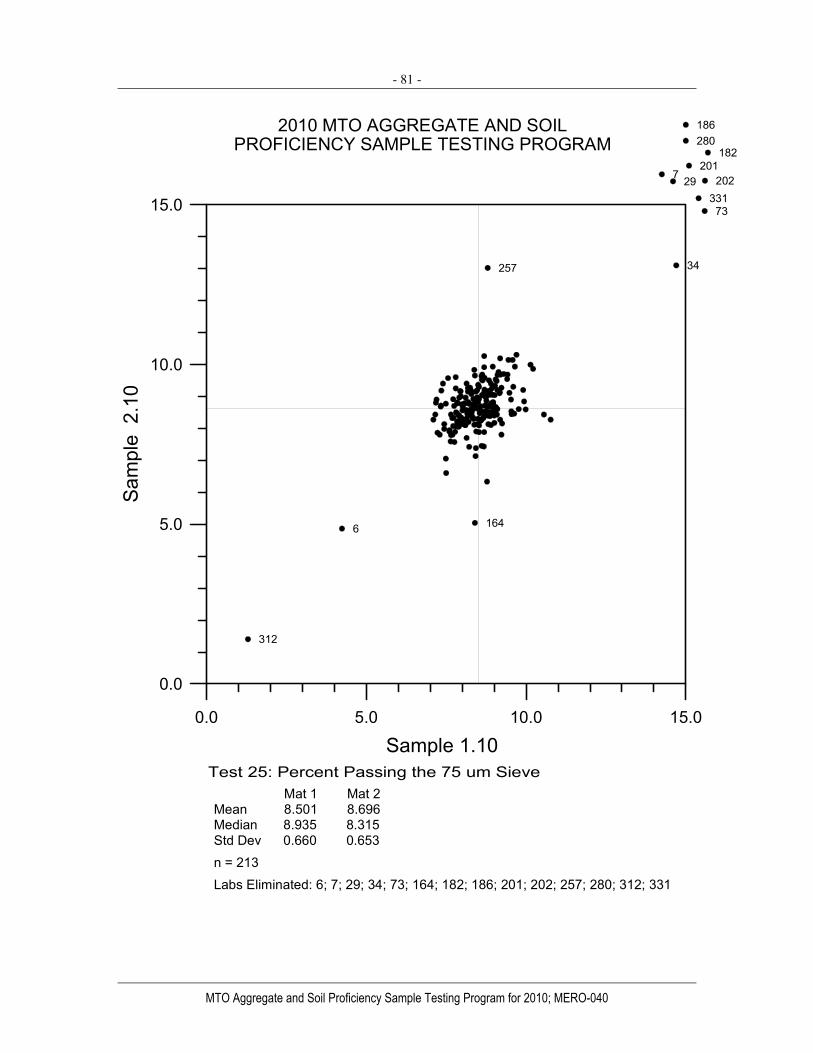
- 81 -
MTO Aggregate and Soil Proficiency Sample Testing Program for 2010; MERO-040
Test 25: Percent Passing the 75 um Sieve Mat 1 Mat 2Mean 8.501 8.696 Median 8.935 8.315Std Dev 0.660 0.653n = 213Labs Eliminated: 6; 7; 29; 34; 73; 164; 182; 186; 201; 202; 257; 280; 312; 331
2010 MTO AGGREGATE AND SOILPROFICIENCY SAMPLE TESTING PROGRAM
0.0 5.0 10.0 15.0
Sample 1.10
0.0
5.0
10.0
15.0
Sam
ple
2.1
0
6
7 29
34
73
164
182
186
201202
257
280
312
331
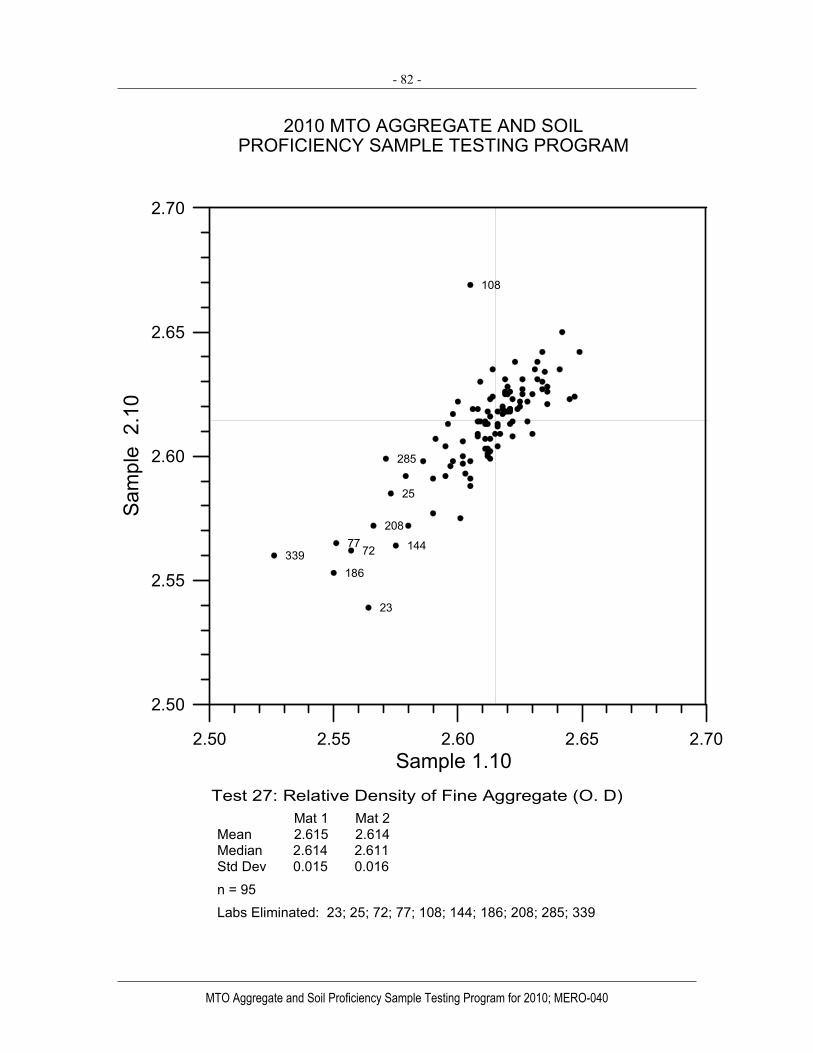
- 82 -
MTO Aggregate and Soil Proficiency Sample Testing Program for 2010; MERO-040
Test 27: Relative Density of Fine Aggregate (O. D) Mat 1 Mat 2Mean 2.615 2.614 Median 2.614 2.611Std Dev 0.015 0.016
n = 95Labs Eliminated: 23; 25; 72; 77; 108; 144; 186; 208; 285; 339
2010 MTO AGGREGATE AND SOILPROFICIENCY SAMPLE TESTING PROGRAM
2.50 2.55 2.60 2.65 2.70Sample 1.10
2.50
2.55
2.60
2.65
2.70
Sam
ple
2.1
0
23
25
7277
108
144
186
208
285
339
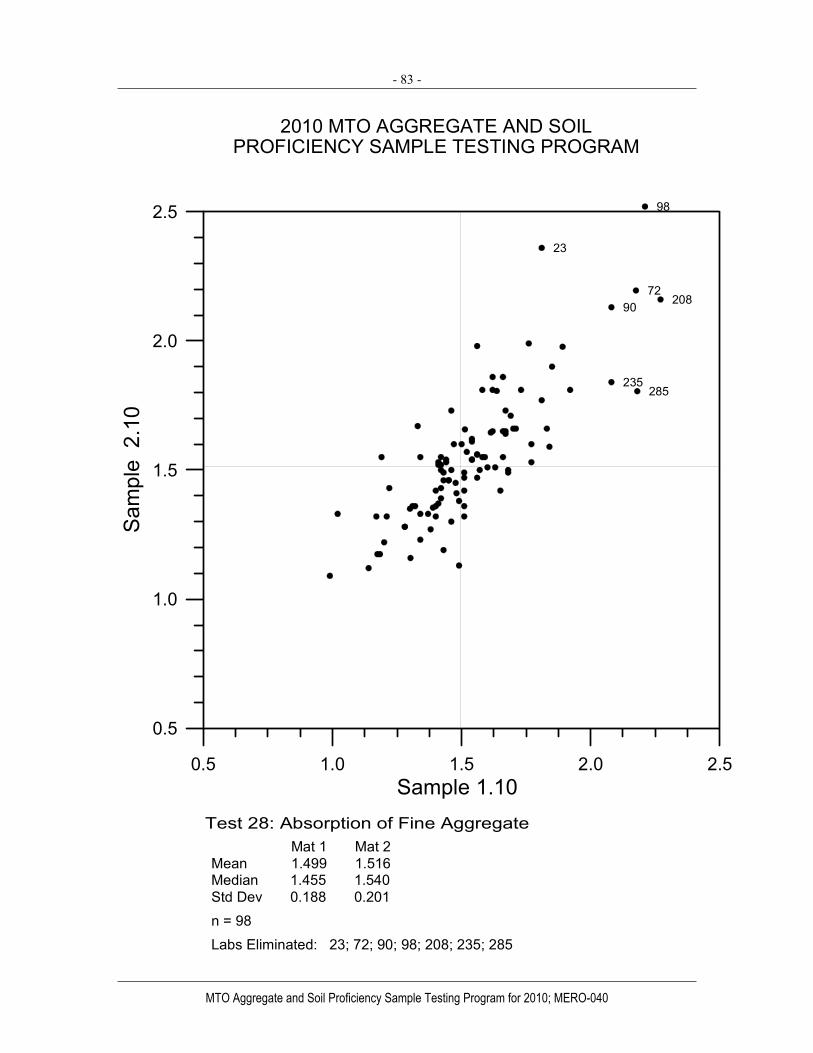
- 83 -
MTO Aggregate and Soil Proficiency Sample Testing Program for 2010; MERO-040
Test 28: Absorption of Fine Aggregate Mat 1 Mat 2Mean 1.499 1.516 Median 1.455 1.540Std Dev 0.188 0.201n = 98Labs Eliminated: 23; 72; 90; 98; 208; 235; 285
2010 MTO AGGREGATE AND SOILPROFICIENCY SAMPLE TESTING PROGRAM
0.5 1.0 1.5 2.0 2.5Sample 1.10
0.5
1.0
1.5
2.0
2.5
Sam
ple
2.1
0
23
7290
98
208
235285
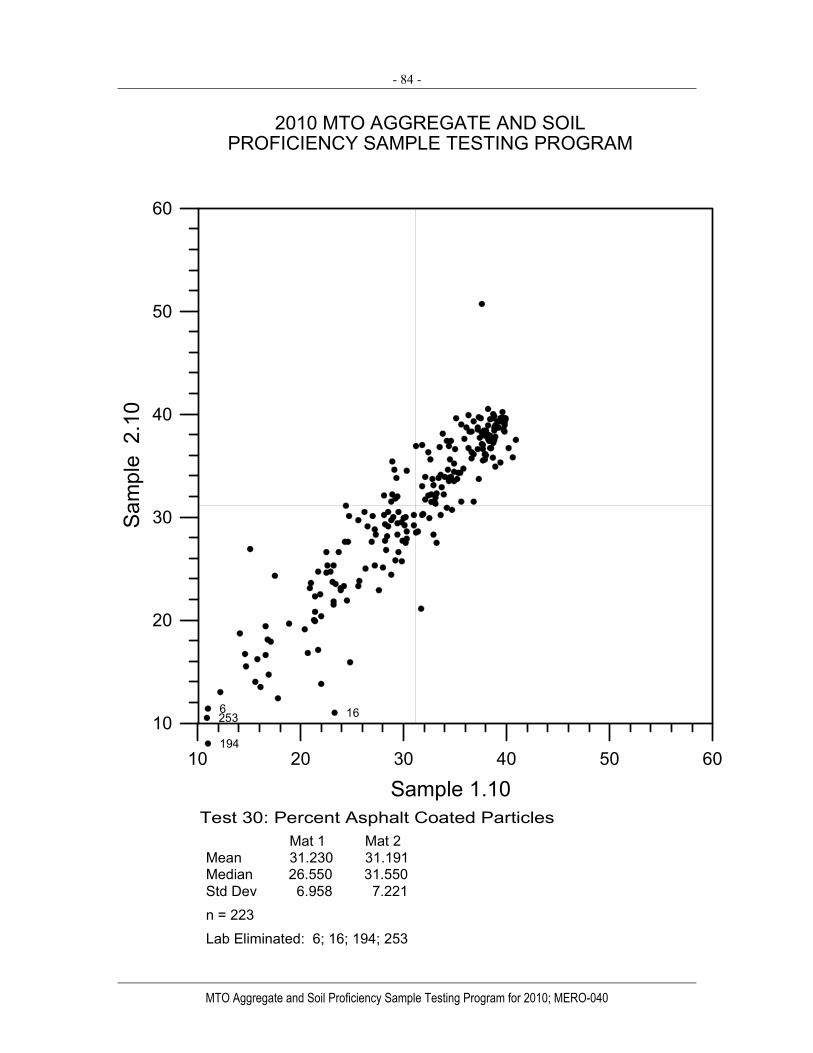
- 84 -
MTO Aggregate and Soil Proficiency Sample Testing Program for 2010; MERO-040
Test 30: Percent Asphalt Coated Particles Mat 1 Mat 2Mean 31.230 31.191Median 26.550 31.550Std Dev 6.958 7.221n = 223Lab Eliminated: 6; 16; 194; 253
2010 MTO AGGREGATE AND SOILPROFICIENCY SAMPLE TESTING PROGRAM
10 20 30 40 50 60
Sample 1.10
10
20
30
40
50
60
Sam
ple
2.1
0
6 16
194
253
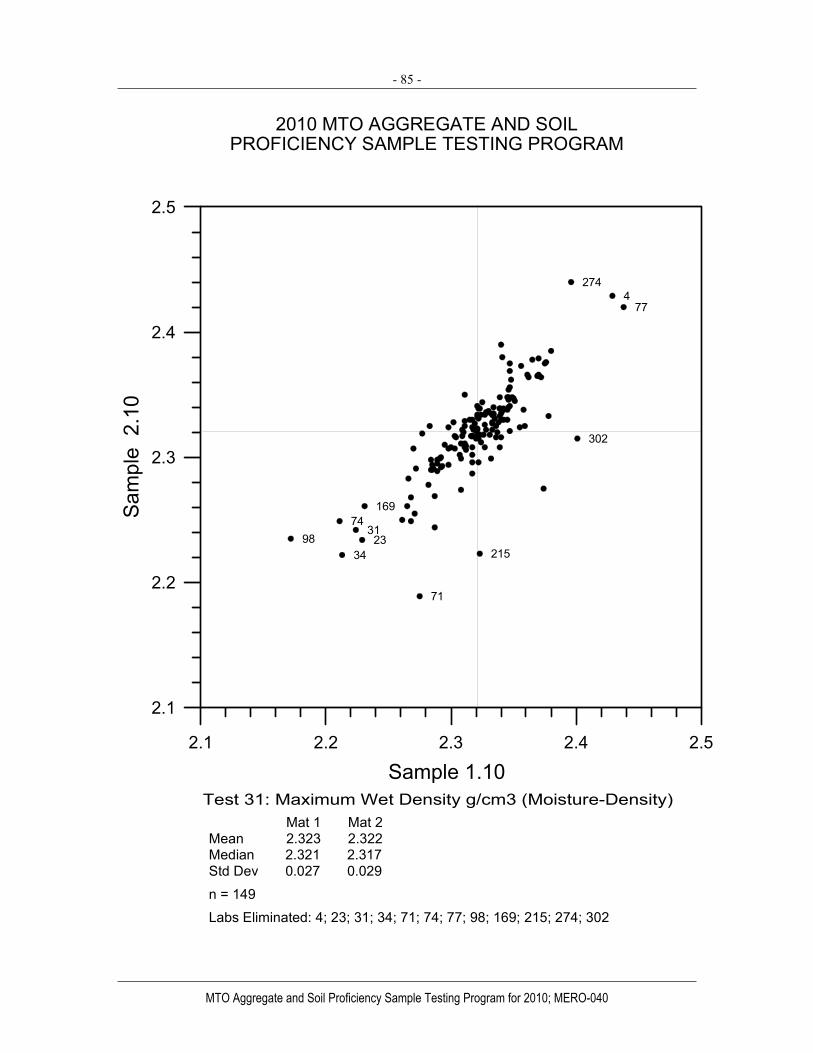
- 85 -
MTO Aggregate and Soil Proficiency Sample Testing Program for 2010; MERO-040
Test 31: Maximum Wet Density g/cm3 (Moisture-Density) Mat 1 Mat 2Mean 2.323 2.322Median 2.321 2.317Std Dev 0.027 0.029
n = 149
Labs Eliminated: 4; 23; 31; 34; 71; 74; 77; 98; 169; 215; 274; 302
2010 MTO AGGREGATE AND SOILPROFICIENCY SAMPLE TESTING PROGRAM
2.1 2.2 2.3 2.4 2.5
Sample 1.10
2.1
2.2
2.3
2.4
2.5
Sam
ple
2.1
0
4
2331
34
71
74
77
98
169
215
274
302
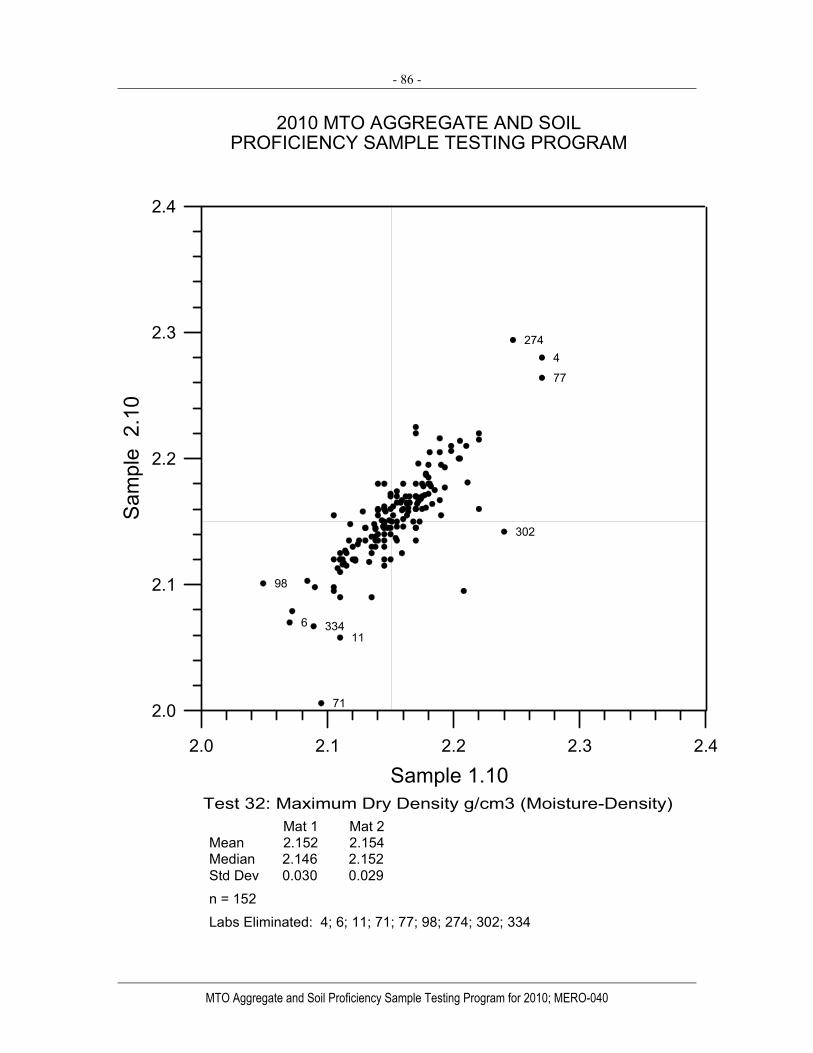
- 86 -
MTO Aggregate and Soil Proficiency Sample Testing Program for 2010; MERO-040
Test 32: Maximum Dry Density g/cm3 (Moisture-Density) Mat 1 Mat 2Mean 2.152 2.154Median 2.146 2.152Std Dev 0.030 0.029n = 152Labs Eliminated: 4; 6; 11; 71; 77; 98; 274; 302; 334
2010 MTO AGGREGATE AND SOILPROFICIENCY SAMPLE TESTING PROGRAM
2.0 2.1 2.2 2.3 2.4
Sample 1.10
2.0
2.1
2.2
2.3
2.4
Sam
ple
2.1
0
4
611
71
77
98
274
302
334
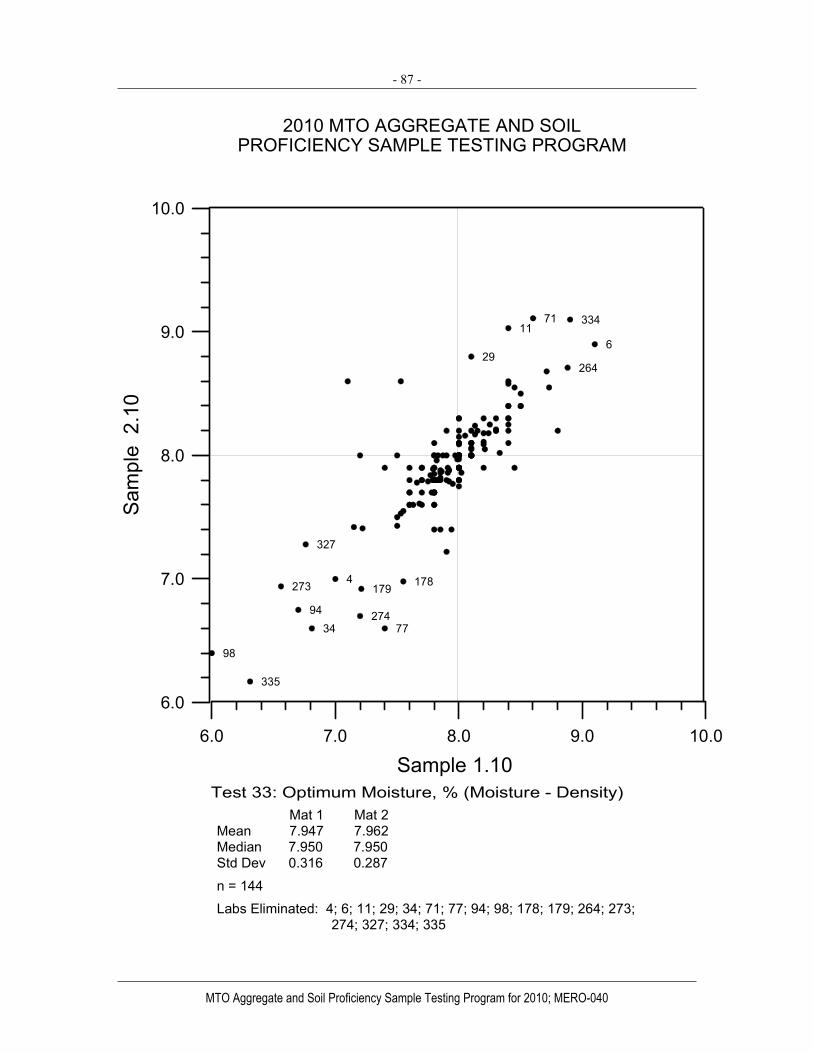
- 87 -
MTO Aggregate and Soil Proficiency Sample Testing Program for 2010; MERO-040
Test 33: Optimum Moisture, % (Moisture - Density) Mat 1 Mat 2Mean 7.947 7.962Median 7.950 7.950Std Dev 0.316 0.287
n = 144Labs Eliminated: 4; 6; 11; 29; 34; 71; 77; 94; 98; 178; 179; 264; 273; 274; 327; 334; 335
2010 MTO AGGREGATE AND SOILPROFICIENCY SAMPLE TESTING PROGRAM
6.0 7.0 8.0 9.0 10.0
Sample 1.10
6.0
7.0
8.0
9.0
10.0
Sam
ple
2.1
0
4
611
29
34
71
7794
98
178179
264
273
274
327
334
335

- 88 -
MTO Aggregate and Soil Proficiency Sample Testing Program for 2010; MERO-040
Test 34: Micro-Deval Abrasion Loss (FA), % Mat 1 Mat 2Mean 15.527 15.482Median 15.350 15.190Std Dev 1.108 1.124
n = 69Lab eliminated: 113; 181; 262; 280; 312
2010 MTO AGGREGATE AND SOILPROFICIENCY SAMPLE TESTING PROGRAM
12 14 16 18 20Sample 1.10
12
14
16
18
20
Sam
ple
2.1
0
113
181
262
280
312

- 89 -
MTO Aggregate and Soil Proficiency Sample Testing Program for 2010; MERO-040
Test 123: Accelerated Mortar Bar - 14 Days in NaOH Mat 1 Mat 2Mean 0.191 0.373 Median 0.193 0.386Std Dev 0.028 0.045
n = 19Labs Eliminated: 91
2010 MTO AGGREGATE AND SOILPROFICIENCY SAMPLE TESTING PROGRAM
0.10 0.15 0.20 0.25 0.30 0.35Sample 1.10 (Natural Sand)
0.25
0.30
0.35
0.40
0.45
0.50
Sam
ple
2.1
0 (S
prat
t-III)
91
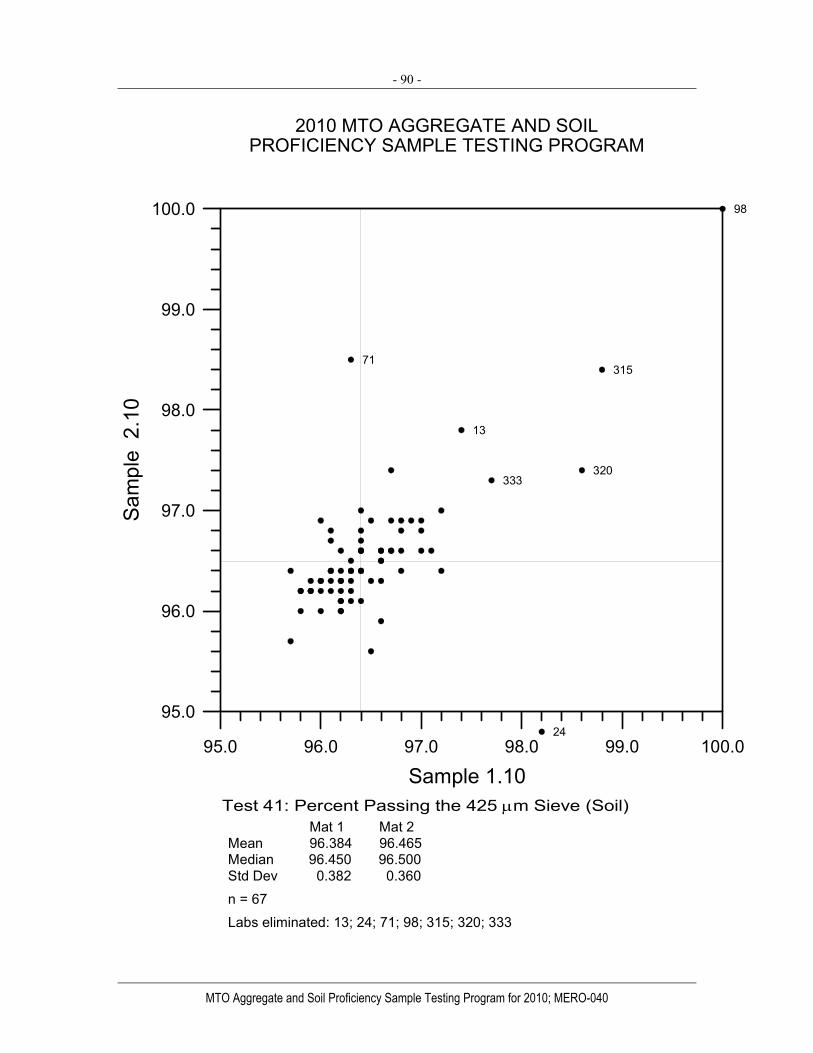
- 90 -
MTO Aggregate and Soil Proficiency Sample Testing Program for 2010; MERO-040
Test 41: Percent Passing the 425 μm Sieve (Soil) Mat 1 Mat 2Mean 96.384 96.465Median 96.450 96.500Std Dev 0.382 0.360n = 67Labs eliminated: 13; 24; 71; 98; 315; 320; 333
2010 MTO AGGREGATE AND SOILPROFICIENCY SAMPLE TESTING PROGRAM
95.0 96.0 97.0 98.0 99.0 100.0
Sample 1.10
95.0
96.0
97.0
98.0
99.0
100.0
Sam
ple
2.1
0
13
24
71
98
315
320333

- 91 -
MTO Aggregate and Soil Proficiency Sample Testing Program for 2010; MERO-040
Test 42: Percent Passing the 75 μm Sieve (Soil) Mat 1 Mat 2Mean 88.643 88.712Median 88.650 88.750Std Dev 0.466 0.341n = 63Labs eliminated: 8; 9; 24; 47; 79; 86; 98; 108; 120; 284; 326
2010 MTO AGGREGATE AND SOILPROFICIENCY SAMPLE TESTING PROGRAM
84 86 88 90 92 94 96
Sample 1.10
84
86
88
90
92
94
96
Sam
ple
2.1
0
8
9
24
47
79
86
98
108
120
284
326

- 92 -
MTO Aggregate and Soil Proficiency Sample Testing Program for 2010; MERO-040
Test 43: Percent Passing the 20 μm Sieve (Soil) Mat 1 Mat 2Mean 70.642 70.741Median 71.000 71.000Std Dev 4.409 4.246n = 73Labs eliminated: 15
2010 MTO AGGREGATE AND SOILPROFICIENCY SAMPLE TESTING PROGRAM
60 65 70 75 80 85
Sample 1.10
60
65
70
75
80
85
Sam
ple
2.1
0
15
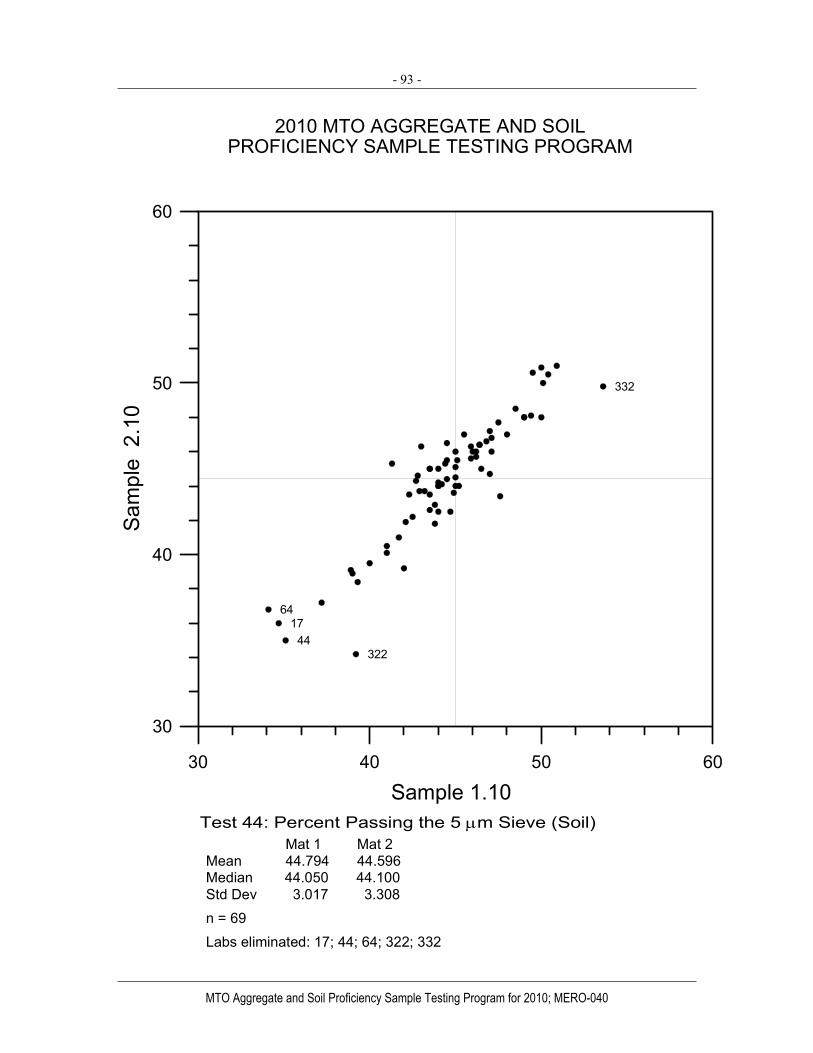
- 93 -
MTO Aggregate and Soil Proficiency Sample Testing Program for 2010; MERO-040
Test 44: Percent Passing the 5 μm Sieve (Soil) Mat 1 Mat 2Mean 44.794 44.596Median 44.050 44.100Std Dev 3.017 3.308n = 69Labs eliminated: 17; 44; 64; 322; 332
2010 MTO AGGREGATE AND SOILPROFICIENCY SAMPLE TESTING PROGRAM
30 40 50 60
Sample 1.10
30
40
50
60
Sam
ple
2.1
0
1744
64
322
332

- 94 -
MTO Aggregate and Soil Proficiency Sample Testing Program for 2010; MERO-040
Test 45: Percent Passing the 2 μm Sieve (Soil) Mat 1 Mat 2Mean 30.862 30.482Median 31.250 29.450Std Dev 2.756 3.388
n = 68
LabsEliminated: 9; 17; 44; 64; 208; 332
2010 MTO AGGREGATE AND SOILPROFICIENCY SAMPLE TESTING PROGRAM
20 25 30 35 40
Sample 1.10
20
25
30
35
40
Sam
ple
2.1
0
9
17
44
64
208
332

- 95 -
MTO Aggregate and Soil Proficiency Sample Testing Program for 2010; MERO-040
Test 46: Liquid Limit, % Mat 1 Mat 2Mean 27.034 27.168Median 27.400 27.270Std Dev 1.301 1.430
n = 84Lab eliminated: 9; 17; 77; 108; 205; 300
2010 MTO AGGREGATE AND SOILPROFICIENCY SAMPLE TESTING PROGRAM
20 25 30 35 40Sample 1.10
20
25
30
35
40
Sam
ple
2.1
0
917
77
108
205
300
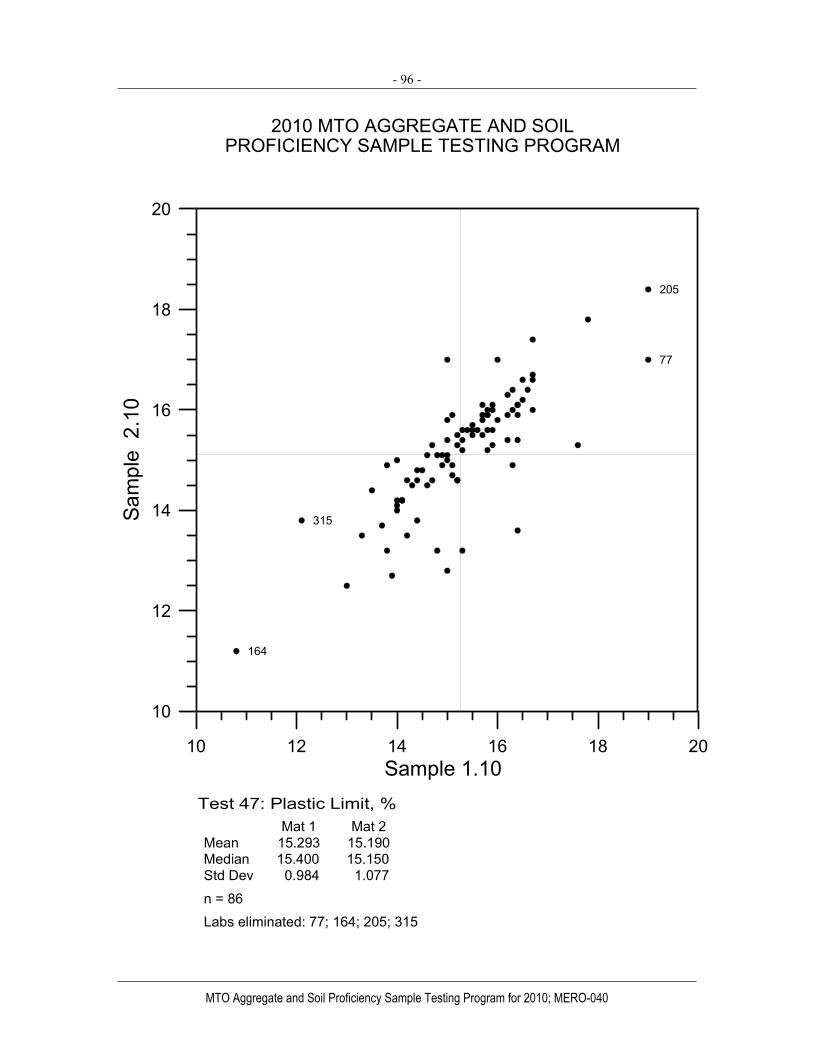
- 96 -
MTO Aggregate and Soil Proficiency Sample Testing Program for 2010; MERO-040
Test 47: Plastic Limit, % Mat 1 Mat 2Mean 15.293 15.190Median 15.400 15.150Std Dev 0.984 1.077
n = 86Labs eliminated: 77; 164; 205; 315
2010 MTO AGGREGATE AND SOILPROFICIENCY SAMPLE TESTING PROGRAM
10 12 14 16 18 20Sample 1.10
10
12
14
16
18
20
Sam
ple
2.1
0
77
164
205
315

- 97 -
MTO Aggregate and Soil Proficiency Sample Testing Program for 2010; MERO-040
Test 48: Plasticity Index, % Mat 1 Mat 2Mean 11.824 11.898Median 11.600 11.820Std Dev 1.416 1.550
n = 86Lab eliminated: 9; 24; 108; 205
2010 MTO AGGREGATE AND SOILPROFICIENCY SAMPLE TESTING PROGRAM
5 10 15 20Sample 1.10
5
10
15
20
Sam
ple
2.1
0
9
24
108
205
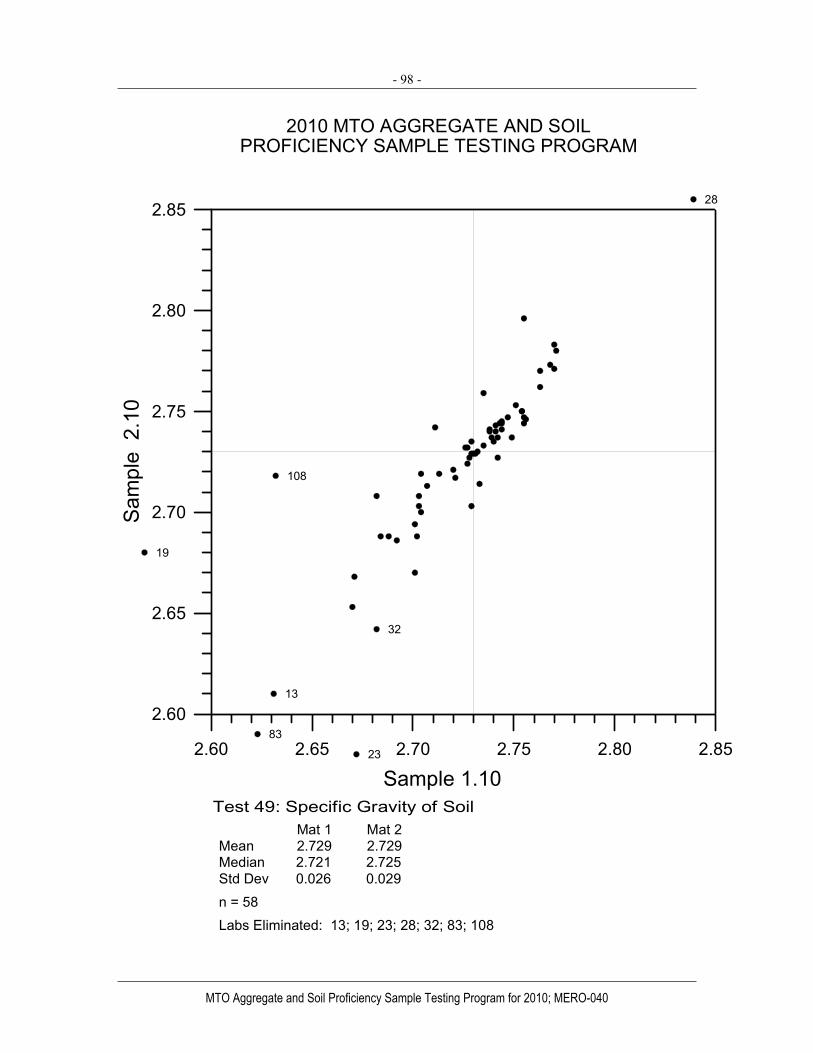
- 98 -
MTO Aggregate and Soil Proficiency Sample Testing Program for 2010; MERO-040
Test 49: Specific Gravity of Soil Mat 1 Mat 2Mean 2.729 2.729Median 2.721 2.725Std Dev 0.026 0.029n = 58Labs Eliminated: 13; 19; 23; 28; 32; 83; 108
2010 MTO AGGREGATE AND SOILPROFICIENCY SAMPLE TESTING PROGRAM
2.60 2.65 2.70 2.75 2.80 2.85
Sample 1.10
2.60
2.65
2.70
2.75
2.80
2.85
Sam
ple
2.1
0
13
19
23
28
32
83
108
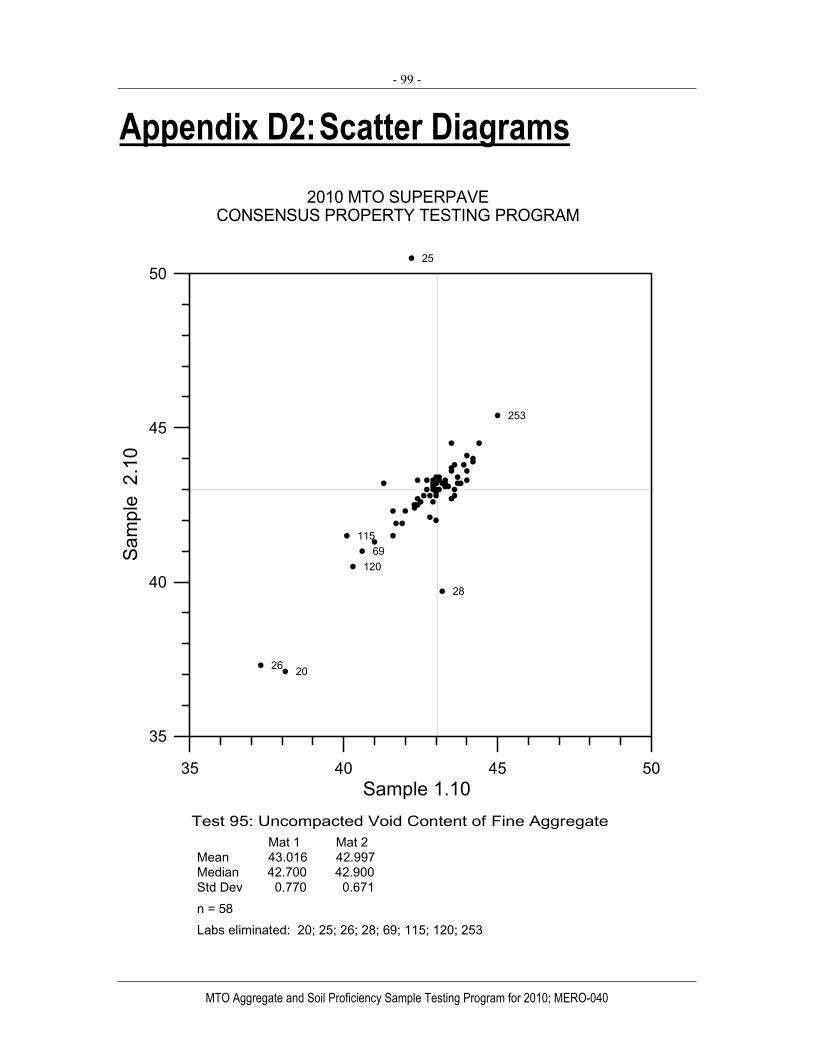
- 99 -
MTO Aggregate and Soil Proficiency Sample Testing Program for 2010; MERO-040
Appendix D2: Scatter Diagrams
Test 95: Uncompacted Void Content of Fine Aggregate Mat 1 Mat 2Mean 43.016 42.997Median 42.700 42.900Std Dev 0.770 0.671
n = 58Labs eliminated: 20; 25; 26; 28; 69; 115; 120; 253
2010 MTO SUPERPAVECONSENSUS PROPERTY TESTING PROGRAM
35 40 45 50Sample 1.10
35
40
45
50
Sam
ple
2.1
0
20
25
26
28
69115
120
253

- 100 -
MTO Aggregate and Soil Proficiency Sample Testing Program for 2010; MERO-040
Test 96: Sand Equivalent Value of Fine Aggregate Mat 1 Mat 2Mean 35.853 35.732Median 40.650 41.050Std Dev 7.571 7.547
n = 60Labs eliminated: 86; 253
2010 MTO SUPERPAVECONSENSUS PROPERTY TESTING PROGRAM
20 30 40 50 60Sample 1.10
20
30
40
50
60
Sam
ple
2.1
0
86253
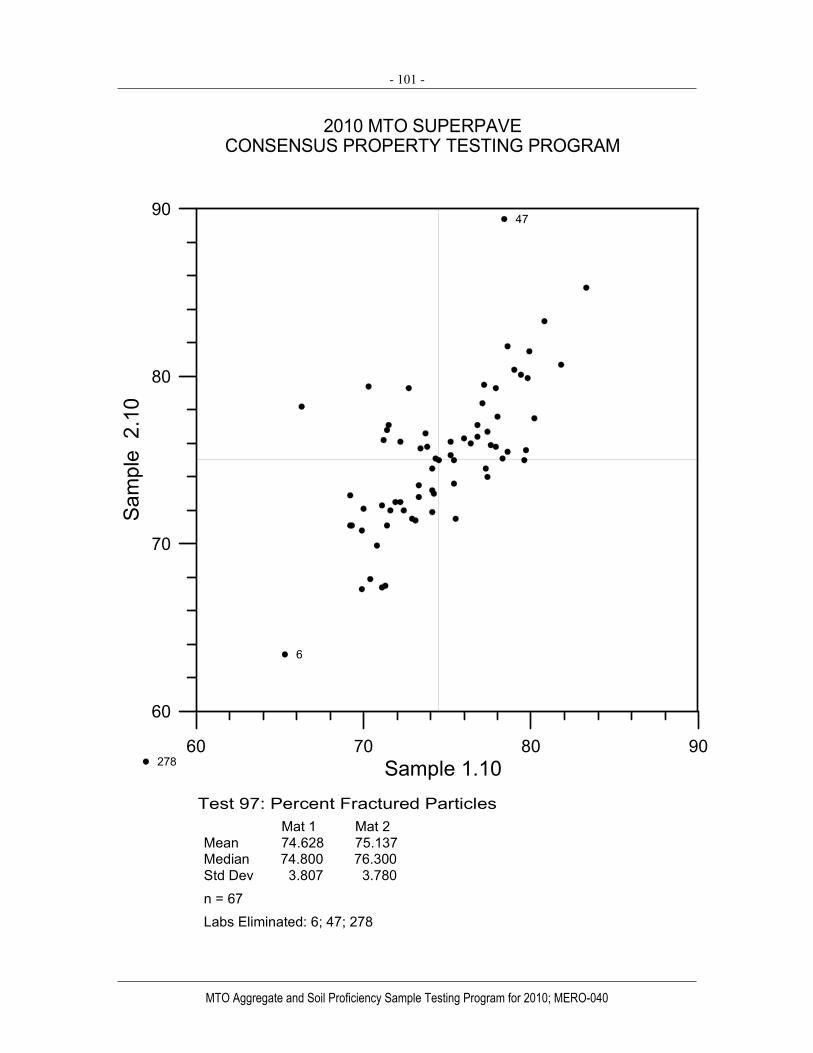
- 101 -
MTO Aggregate and Soil Proficiency Sample Testing Program for 2010; MERO-040
Test 97: Percent Fractured Particles Mat 1 Mat 2Mean 74.628 75.137Median 74.800 76.300Std Dev 3.807 3.780
n = 67Labs Eliminated: 6; 47; 278
2010 MTO SUPERPAVECONSENSUS PROPERTY TESTING PROGRAM
60 70 80 90Sample 1.10
60
70
80
90
Sam
ple
2.1
0
6
47
278
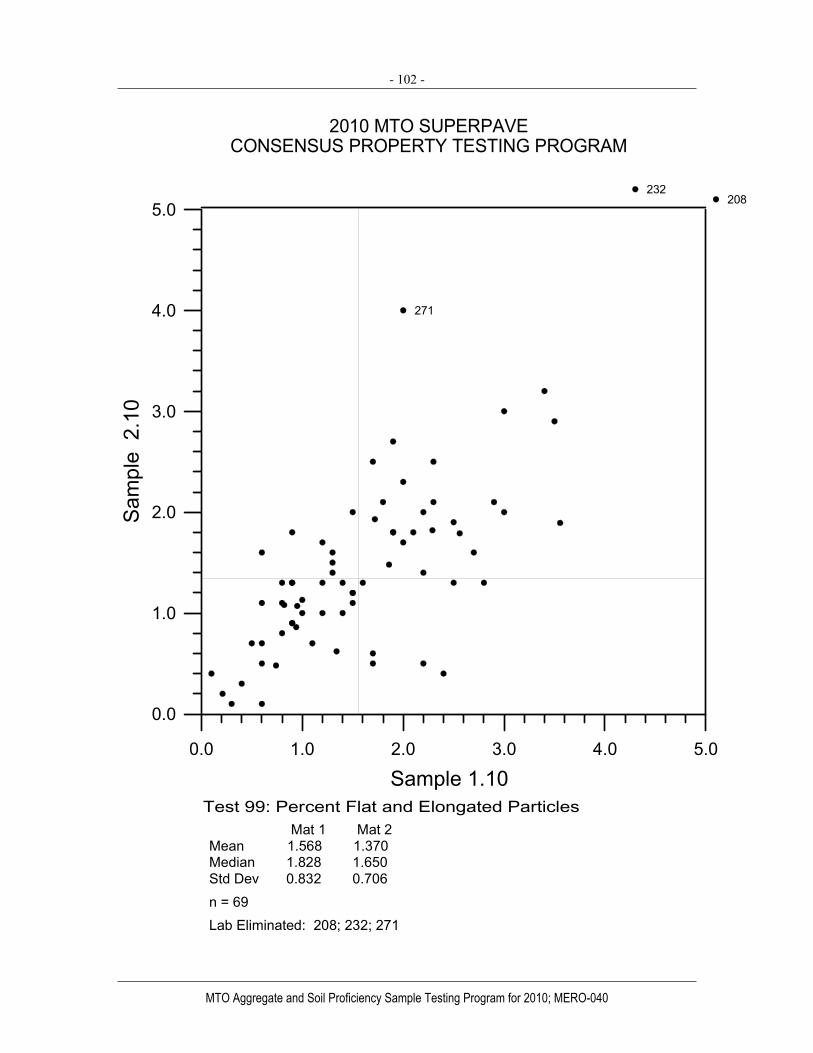
- 102 -
MTO Aggregate and Soil Proficiency Sample Testing Program for 2010; MERO-040
Test 99: Percent Flat and Elongated Particles Mat 1 Mat 2Mean 1.568 1.370Median 1.828 1.650Std Dev 0.832 0.706n = 69Lab Eliminated: 208; 232; 271
2010 MTO SUPERPAVECONSENSUS PROPERTY TESTING PROGRAM
0.0 1.0 2.0 3.0 4.0 5.0
Sample 1.10
0.0
1.0
2.0
3.0
4.0
5.0
Sam
ple
2.1
0
208232
271
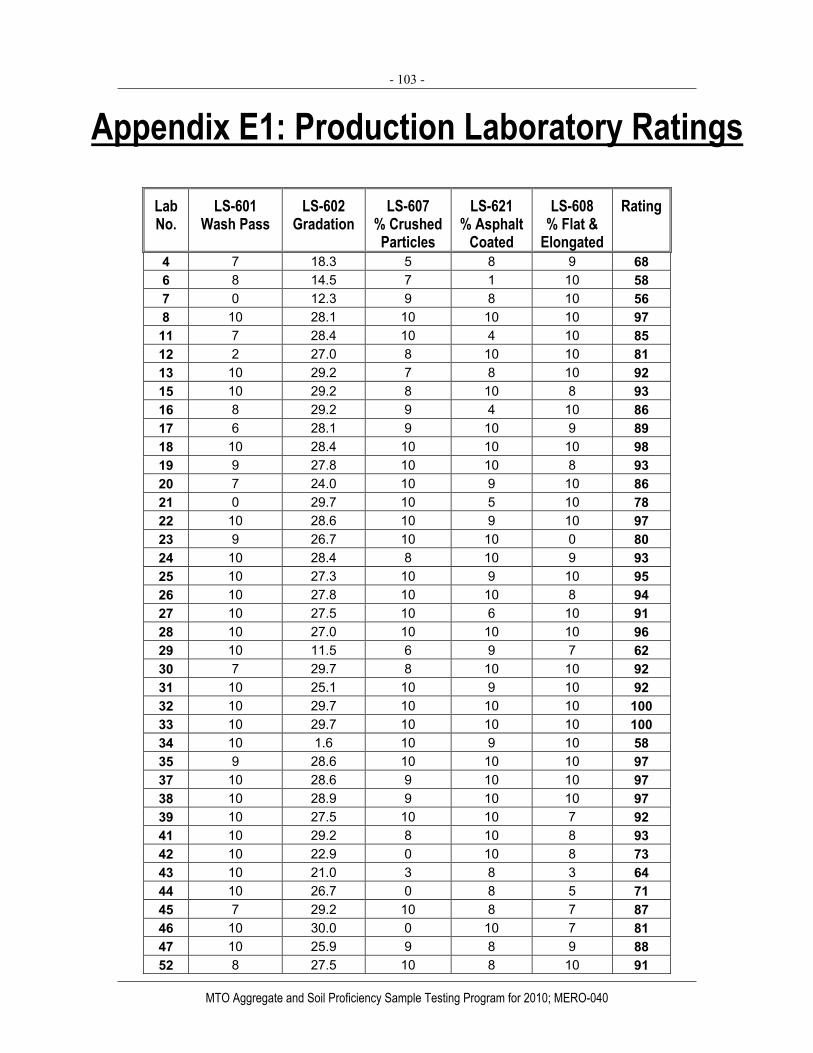
- 103 -
MTO Aggregate and Soil Proficiency Sample Testing Program for 2010; MERO-040
Appendix E1: Production Laboratory Ratings
Lab No.
LS-601 Wash Pass
LS-602 Gradation
LS-607 % Crushed Particles
LS-621 % Asphalt
Coated
LS-608 % Flat &
Elongated
Rating
4 7 18.3 5 8 9 68 6 8 14.5 7 1 10 58 7 0 12.3 9 8 10 56 8 10 28.1 10 10 10 97 11 7 28.4 10 4 10 85 12 2 27.0 8 10 10 81 13 10 29.2 7 8 10 92 15 10 29.2 8 10 8 93 16 8 29.2 9 4 10 86 17 6 28.1 9 10 9 89 18 10 28.4 10 10 10 98 19 9 27.8 10 10 8 93 20 7 24.0 10 9 10 86 21 0 29.7 10 5 10 78 22 10 28.6 10 9 10 97 23 9 26.7 10 10 0 80 24 10 28.4 8 10 9 93 25 10 27.3 10 9 10 95 26 10 27.8 10 10 8 94 27 10 27.5 10 6 10 91 28 10 27.0 10 10 10 96 29 10 11.5 6 9 7 62 30 7 29.7 8 10 10 92 31 10 25.1 10 9 10 92 32 10 29.7 10 10 10 100 33 10 29.7 10 10 10 100 34 10 1.6 10 9 10 58 35 9 28.6 10 10 10 97 37 10 28.6 9 10 10 97 38 10 28.9 9 10 10 97 39 10 27.5 10 10 7 92 41 10 29.2 8 10 8 93 42 10 22.9 0 10 8 73 43 10 21.0 3 8 3 64 44 10 26.7 0 8 5 71 45 7 29.2 10 8 7 87 46 10 30.0 0 10 7 81 47 10 25.9 9 8 9 88 52 8 27.5 10 8 10 91

- 104 -
MTO Aggregate and Soil Proficiency Sample Testing Program for 2010; MERO-040
Lab No.
LS-601 Wash Pass
LS-602 Gradation
LS-607 % Crushed Particles
LS-621 % Asphalt
Coated
LS-608 % Flat &
Elongated
Rating
54 10 26.5 10 10 8 92 56 3 29.2 10 10 10 89 58 10 25.1 9 10 10 92 59 10 29.2 10 10 10 99 60 9 30.0 10 10 2 87 61 10 28.6 10 10 10 98 62 9 28.6 10 9 9 94 64 10 29.5 10 10 5 92 65 10 28.9 10 9 7 93 69 8 26.2 10 8 10 89 70 7 30.0 9 10 6 89 71 8 25.9 10 8 8 86 72 10 22.4 10 8 10 86 73 10 11.2 4 4 4 47 74 9 27.0 10 10 5 87 75 0 29.7 5 10 10 78 76 10 29.2 9 10 10 97 77 10 30.0 10 10 10 100 78 8 29.2 10 10 10 96 79 9 29.5 10 10 8 95 80 10 27.5 9 9 9 92 81 5 29.5 10 10 6 86 83 8 28.4 10 9 9 92 85 10 27.5 10 10 10 96 86 10 26.2 9 10 9 92 89 10 27.5 10 9 3 85 90 10 29.2 0 9 10 83 93 10 23.7 0 10 8 74 98 10 24.5 0 9 4 68 100 6 29.5 9 9 8 88 101 10 28.9 0 10 10 84 102 7 29.2 10 9 10 93 103 10 24.3 10 10 8 89 107 10 27.0 10 10 10 96 108 10 25.4 0 8 10 76 110 10 30.0 10 4 10 91 112 6 27.3 8 10 9 86 113 10 26.7 9 10 10 94 115 10 26.5 10 10 10 95 116 9 28.4 10 10 5 89 117 9 24.0 10 8 10 87 120 10 27.0 9 8 7 87 124 10 25.1 6 10 10 87 126 9 23.7 0 8 10 72
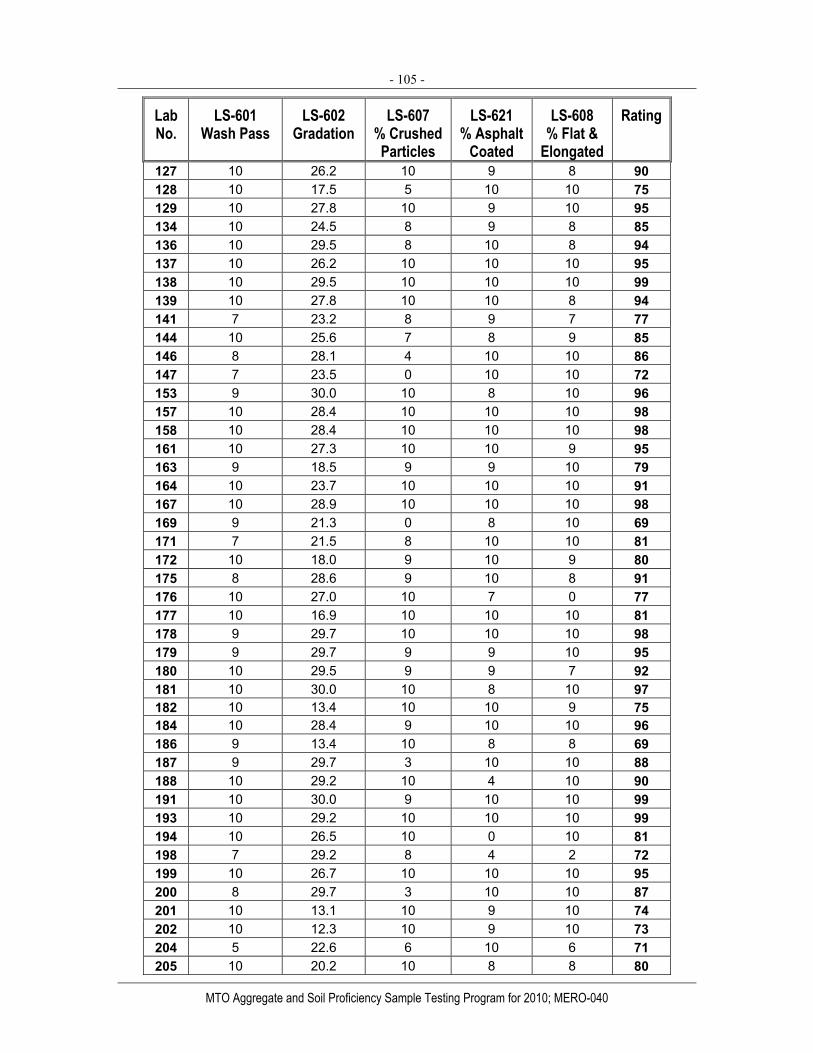
- 105 -
MTO Aggregate and Soil Proficiency Sample Testing Program for 2010; MERO-040
Lab No.
LS-601 Wash Pass
LS-602 Gradation
LS-607 % Crushed Particles
LS-621 % Asphalt
Coated
LS-608 % Flat &
Elongated
Rating
127 10 26.2 10 9 8 90 128 10 17.5 5 10 10 75 129 10 27.8 10 9 10 95 134 10 24.5 8 9 8 85 136 10 29.5 8 10 8 94 137 10 26.2 10 10 10 95 138 10 29.5 10 10 10 99 139 10 27.8 10 10 8 94 141 7 23.2 8 9 7 77 144 10 25.6 7 8 9 85 146 8 28.1 4 10 10 86 147 7 23.5 0 10 10 72 153 9 30.0 10 8 10 96 157 10 28.4 10 10 10 98 158 10 28.4 10 10 10 98 161 10 27.3 10 10 9 95 163 9 18.5 9 9 10 79 164 10 23.7 10 10 10 91 167 10 28.9 10 10 10 98 169 9 21.3 0 8 10 69 171 7 21.5 8 10 10 81 172 10 18.0 9 10 9 80 175 8 28.6 9 10 8 91 176 10 27.0 10 7 0 77 177 10 16.9 10 10 10 81 178 9 29.7 10 10 10 98 179 9 29.7 9 9 10 95 180 10 29.5 9 9 7 92 181 10 30.0 10 8 10 97 182 10 13.4 10 10 9 75 184 10 28.4 9 10 10 96 186 9 13.4 10 8 8 69 187 9 29.7 3 10 10 88 188 10 29.2 10 4 10 90 191 10 30.0 9 10 10 99 193 10 29.2 10 10 10 99 194 10 26.5 10 0 10 81 198 7 29.2 8 4 2 72 199 10 26.7 10 10 10 95 200 8 29.7 3 10 10 87 201 10 13.1 10 9 10 74 202 10 12.3 10 9 10 73 204 5 22.6 6 10 6 71 205 10 20.2 10 8 8 80

- 106 -
MTO Aggregate and Soil Proficiency Sample Testing Program for 2010; MERO-040
Lab No.
LS-601 Wash Pass
LS-602 Gradation
LS-607 % Crushed Particles
LS-621 % Asphalt
Coated
LS-608 % Flat &
Elongated
Rating
208 10 25.4 7 10 10 89 210 10 25.1 10 10 10 93 214 0 28.1 0 8 8 63 215 10 28.4 9 9 8 92 216 10 29.7 10 8 9 95 217 10 28.4 5 9 10 89 218 2 26.5 9 10 9 81 219 9 25.1 10 10 9 90 221 10 29.5 10 10 9 98 223 0 30.0 9 10 10 84 224 10 28.1 8 10 8 92 232 8 27.5 10 6 8 85 234 10 29.2 0 8 5 75 235 10 27.5 10 7 10 92 236 4 25.4 10 8 10 82 245 10 25.6 10 9 10 92 246 9 29.2 10 10 10 97 247 10 27.0 10 8 9 91 248 7 25.9 10 10 10 90 249 10 27.0 10 10 10 96 250 10 27.0 3 9 7 80 251 10 27.0 10 10 9 94 252 8 25.9 9 7 8 83 253 10 25.6 7 0 8 72 254 10 23.7 10 9 10 90 255 10 30.0 3 7 9 84 256 10 20.5 10 9 10 85 257 8 19.6 10 10 10 82 258 10 29.7 0 10 10 85 260 10 23.5 10 5 8 81 262 8 16.6 5 8 10 68 263 10 28.6 9 10 8 94 264 10 28.1 7 10 10 93 267 10 26.7 10 8 10 92 268 9 28.1 10 10 9 94 269 10 26.7 1 6 8 74 271 10 28.1 0 10 10 83 272 10 28.9 7 10 8 91 273 9 29.7 10 8 10 95 274 9 27.8 10 10 10 95 275 8 28.1 10 10 10 94 276 10 23.7 0 5 10 70 277 7 25.6 8 9 9 84 278 8 28.9 10 6 10 90

- 107 -
MTO Aggregate and Soil Proficiency Sample Testing Program for 2010; MERO-040
Lab No.
LS-601 Wash Pass
LS-602 Gradation
LS-607 % Crushed Particles
LS-621 % Asphalt
Coated
LS-608 % Flat &
Elongated
Rating
279 4 25.6 10 10 10 85 280 9 11.7 8 7 10 65 282 10 27.5 10 10 4 88 284 10 30.0 10 10 9 99 285 9 24.5 10 8 9 86 286 10 27.5 7 10 6 86 288 3 29.7 10 9 10 88 290 9 24.8 10 8 10 88 291 7 29.2 10 10 10 95 293 10 23.5 10 6 9 84 294 10 28.6 10 8 10 95 295 9 29.7 10 9 10 97 296 7 29.2 10 10 10 95 297 10 29.7 10 8 10 97 299 10 28.9 10 9 10 97 300 10 28.6 10 10 10 98 301 10 28.6 4 10 3 79 302 8 29.5 10 2 10 85 303 7 26.7 10 10 4 82 305 10 28.6 8 10 9 94 308 10 28.1 10 10 10 97 309 8 26.2 10 10 10 92 310 10 28.4 9 10 10 96 311 10 29.5 10 10 10 99 312 10 16.1 7 9 8 72 313 10 28.9 4 9 10 88 314 8 28.6 10 8 10 92 315 3 25.4 10 8 9 79 316 10 29.2 10 10 10 99 317 10 29.7 10 10 10 100 318 10 22.4 9 5 10 81 320 10 28.6 9 8 7 89 321 10 29.2 10 10 10 99 322 10 29.2 10 10 8 96 323 2 22.6 9 10 10 77 324 10 29.5 10 4 6 85 325 10 29.2 5 9 10 90 326 10 25.4 10 10 10 93 327 10 29.5 10 10 10 99 328 10 29.2 10 8 10 96 329 9 24.3 10 10 10 90 330 8 27.0 0 10 10 79 331 9 8.2 10 10 9 66 332 10 27.3 10 4 10 88

- 108 -
MTO Aggregate and Soil Proficiency Sample Testing Program for 2010; MERO-040
Lab No.
LS-601 Wash Pass
LS-602 Gradation
LS-607 % Crushed Particles
LS-621 % Asphalt
Coated
LS-608 % Flat &
Elongated
Rating
333 10 24.3 10 10 9 90 334 8 30.0 8 10 10 94 335 10 24.3 7 10 10 88 337 0 26.5 7 10 10 76 339 10 27.8 10 9 10 95 340 10 26.7 9 10 10 94
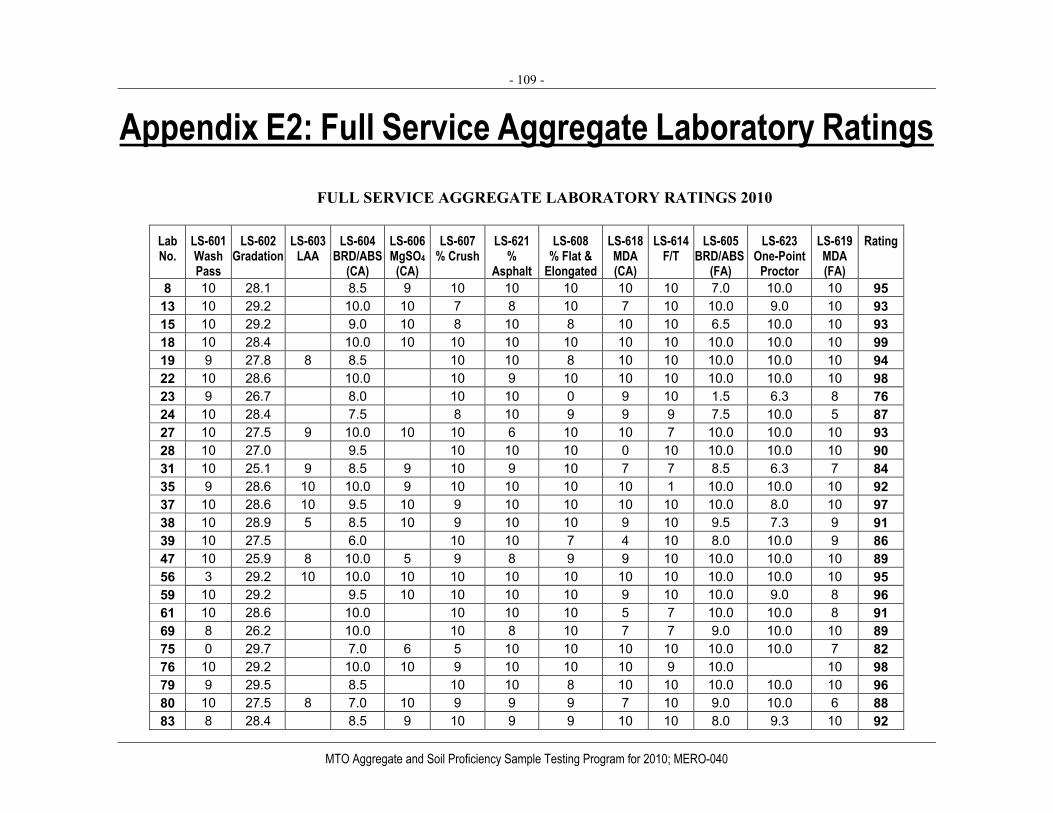
- 109 -
MTO Aggregate and Soil Proficiency Sample Testing Program for 2010; MERO-040
Appendix E2: Full Service Aggregate Laboratory Ratings FULL SERVICE AGGREGATE LABORATORY RATINGS 2010
Lab No.
LS-601 Wash Pass
LS-602 Gradation
LS-603 LAA
LS-604 BRD/ABS
(CA)
LS-606 MgSO4
(CA)
LS-607 % Crush
LS-621 %
Asphalt
LS-608 % Flat &
Elongated
LS-618 MDA (CA)
LS-614 F/T
LS-605 BRD/ABS
(FA)
LS-623 One-Point
Proctor
LS-619 MDA (FA)
Rating
8 10 28.1 8.5 9 10 10 10 10 10 7.0 10.0 10 95 13 10 29.2 10.0 10 7 8 10 7 10 10.0 9.0 10 93 15 10 29.2 9.0 10 8 10 8 10 10 6.5 10.0 10 93 18 10 28.4 10.0 10 10 10 10 10 10 10.0 10.0 10 99 19 9 27.8 8 8.5 10 10 8 10 10 10.0 10.0 10 94 22 10 28.6 10.0 10 9 10 10 10 10.0 10.0 10 98 23 9 26.7 8.0 10 10 0 9 10 1.5 6.3 8 76 24 10 28.4 7.5 8 10 9 9 9 7.5 10.0 5 87 27 10 27.5 9 10.0 10 10 6 10 10 7 10.0 10.0 10 93 28 10 27.0 9.5 10 10 10 0 10 10.0 10.0 10 90 31 10 25.1 9 8.5 9 10 9 10 7 7 8.5 6.3 7 84 35 9 28.6 10 10.0 9 10 10 10 10 1 10.0 10.0 10 92 37 10 28.6 10 9.5 10 9 10 10 10 10 10.0 8.0 10 97 38 10 28.9 5 8.5 10 9 10 10 9 10 9.5 7.3 9 91 39 10 27.5 6.0 10 10 7 4 10 8.0 10.0 9 86 47 10 25.9 8 10.0 5 9 8 9 9 10 10.0 10.0 10 89 56 3 29.2 10 10.0 10 10 10 10 10 10 10.0 10.0 10 95 59 10 29.2 9.5 10 10 10 10 9 10 10.0 9.0 8 96 61 10 28.6 10.0 10 10 10 5 7 10.0 10.0 8 91 69 8 26.2 10.0 10 8 10 7 7 9.0 10.0 10 89 75 0 29.7 7.0 6 5 10 10 10 10 10.0 10.0 7 82 76 10 29.2 10.0 10 9 10 10 10 9 10.0 10 98 79 9 29.5 8.5 10 10 8 10 10 10.0 10.0 10 96 80 10 27.5 8 7.0 10 9 9 9 7 10 9.0 10.0 6 88 83 8 28.4 8.5 9 10 9 9 10 10 8.0 9.3 10 92

- 110 -
MTO Aggregate and Soil Proficiency Sample Testing Program for 2010; MERO-040
Lab No.
LS-601 Wash Pass
LS-602 Gradation
LS-603 LAA
LS-604 BRD/ABS
(CA)
LS-606 MgSO4
(CA)
LS-607 % Crush
LS-621 %
Asphalt
LS-608 % Flat &
Elongated
LS-618 MDA (CA)
LS-614 F/T
LS-605 BRD/ABS
(FA)
LS-623 One-Point
Proctor
LS-619 MDA (FA)
Rating
86 10 26.2 9.0 9 10 9 9 9 6.5 10.0 10 91 90 10 29.2 7.0 10 0 9 10 9 1.5 9 79 98 10 24.5 7.5 10 0 9 4 10 5 2.5 1.0 10 67 101 10 28.9 10 7.5 10 0 10 10 7 10 10.0 10.0 10 89 107 10 27.0 9.0 10 10 10 10 9 4 7.5 9 89 108 10 25.4 5.0 8 0 8 10 9 7.0 10.0 7 76 110 10 30.0 10.0 9 10 4 10 10 10 10.0 10.0 4 91 112 6 27.3 10.0 7 8 10 9 8 0 8.5 6.3 10 79 120 10 27.0 8.0 9 8 7 10 6 9.5 7.3 8 84 124 10 25.1 7.0 6 10 10 10 9 7.5 10.0 10 88 157 10 28.4 10.0 10 10 10 10 9 10 10.0 10 98 164 10 23.7 8.5 8 10 10 10 0 10 4.0 10 80 172 10 18.0 8.5 6 9 10 9 10 10 9.5 10.0 10 86 188 10 29.2 10 9.5 10 10 4 10 10 10 9.5 10.0 10 95 199 10 26.7 7.5 10 10 10 10 10 10.0 6.3 10 93 205 10 20.2 1.5 10 8 8 10 0 7.0 7.3 7 68 216 10 29.7 10.0 10 10 8 9 10 10 10.0 9.0 8 96 245 10 25.6 7.5 10 9 10 10 5 9.5 10.0 10 90 260 10 23.5 10.0 4 10 5 8 10 10 9.5 10.0 10 86 263 10 28.6 10.0 10 9 10 8 10 9 9.0 10.0 9 95 285 9 24.5 9.5 10 10 8 9 5 10 4.5 8.7 9 84 295 9 29.7 10.0 8 10 9 10 10 8 10.0 10.0 10 96 296 7 29.2 10.0 10 10 10 10 9 10 8.5 6.3 7 91 301 10 28.6 10.0 10 4 10 3 7 10 10.0 10.0 9 87 309 8 26.2 7.0 6 10 10 10 2 9.5 10.0 9 83 312 10 16.1 9.5 10 7 9 8 6 0 10.0 9.0 0 68 316 10 29.2 8.0 10 10 10 10 10 6 7.0 10.0 4 89 321 10 29.2 10.0 10 10 10 10 8 10.0 10 98 325 10 29.2 10.0 5 9 10 10 10 6.5 10.0 10 92 326 10 25.4 10.0 10 10 10 10 10 10.0 10.0 8 95 340 10 26.7 10.0 9 10 10 9 9 9.0 9 93

- 111 -
MTO Aggregate and Soil Proficiency Sample Testing Program for 2010; MERO-040
Appendix E3: Soil Laboratory Ratings
Lab No.
LS-702 Hydrometer
Analysis
LS-703 & 4 Atterberg
Limits
LS-705 Specific Gravity
Rat ing Lab No.
LS-702 Hydrometer
Analysis
LS-703 & 4 Atterberg
Limits
LS-705 Specific Gravity
Rating
8 6.8 9.3 10 87 102 9.8 10.0 10 99 9 5.8 6.0 6 59 108 6.8 1.7 0 28 12 10.0 9.3 10 98 112 9.6 9.7 3 74 13 8.0 9.7 0 59 120 7.6 9.0 9 85 15 8.0 9.7 8 86 138 9.4 9.3 10 96 18 9.8 7.7 10 92 139 10.0 5.3 8 78 19 7.2 10.0 4 71 146 10.0 9.3 8 91 20 9.8 9.3 10 97 171 9.6 10.0 10 99 22 9.4 10.0 10 98 172 8.6 10.0 10 95 23 8.8 9.0 2 66 188 10.0 8.7 10 96 24 7.0 5.7 10 76 208 8.8 10.0 10 96 28 9.4 10.0 0 65 210 9.8 10.0 10 99 29 10.0 9.3 10 98 216 10.0 10.0 10 100 30 8.6 10.0 7 85 253 8.2 7.0 10 84 31 9.4 8.3 10 92 260 10.0 10.0 8 93 32 8.6 9.0 0 59 276 9.6 9.3 7 86 35 8.6 9.0 10 92 284 5.2 10.0 4 64 37 8.2 10.0 10 94 285 7.6 9.0 7 79 38 9.8 9.3 10 97 295 10.0 9.0 10 97 44 5.0 9.0 10 80 296 9.6 7.3 10 90 46 7.6 9.7 9 88 299 9.0 9.3 10 94 47 8.6 9.0 6 79 300 9.6 7.0 8 82 54 9.2 8.3 10 92 301 9.8 9.3 10 97 56 8.6 10.0 6 82 315 7.2 7.0 10 81 58 9.8 10.0 10 99 320 7.6 8.3 8 80 59 9.8 9.7 10 98 326 8.4 9.3 10 92 62 9.4 10.0 10 98 64 5.8 9.0 10 83 68 9.6 9.7 10 98 69 9.8 10.0 7 89 71 8.8 8.7 10 92 72 9.8 10.0 10 99 79 7.2 10.0 10 91 80 9.6 10.0 10 99 83 8.6 9.0 0 59 86 5.2 10.0 7 74 94 9.6 9.7 9 94 101 9.2 9.3 10 95
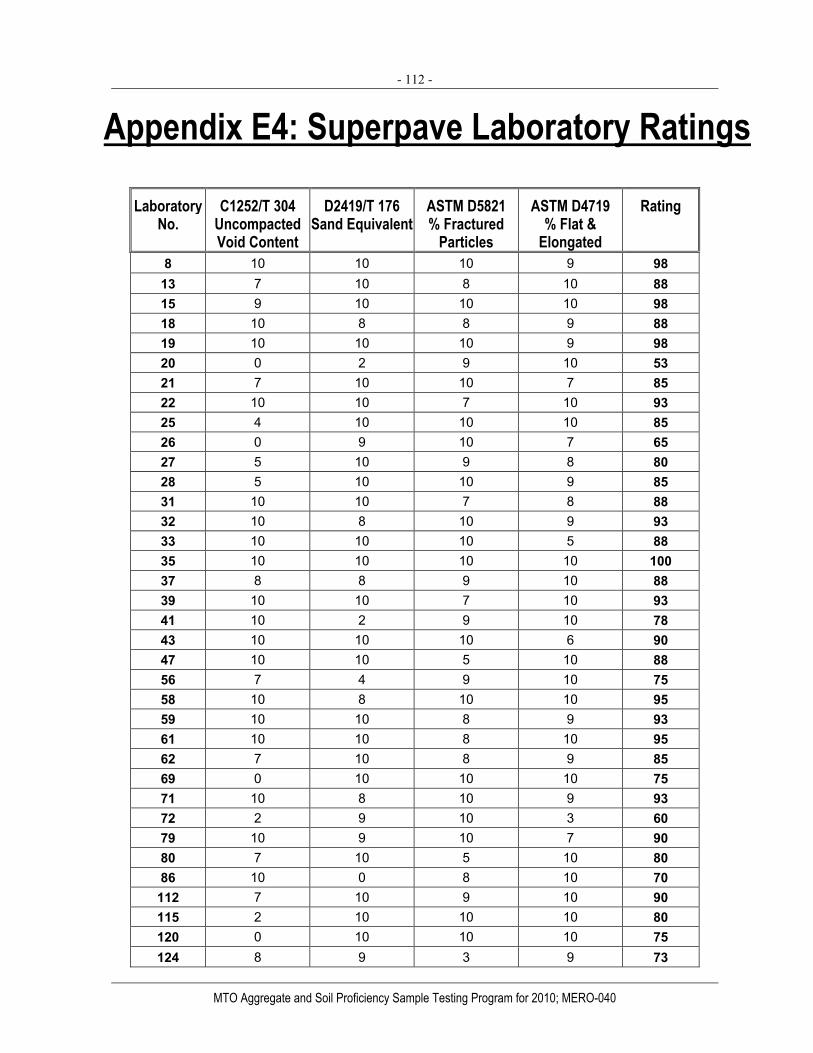
- 112 -
MTO Aggregate and Soil Proficiency Sample Testing Program for 2010; MERO-040
Appendix E4: Superpave Laboratory Ratings
Laboratory No.
C1252/T 304 Uncompacted Void Content
D2419/T 176 Sand Equivalent
ASTM D5821 % Fractured
Particles
ASTM D4719 % Flat &
Elongated
Rating
8 10 10 10 9 98 13 7 10 8 10 88 15 9 10 10 10 98 18 10 8 8 9 88 19 10 10 10 9 98 20 0 2 9 10 53 21 7 10 10 7 85 22 10 10 7 10 93 25 4 10 10 10 85 26 0 9 10 7 65 27 5 10 9 8 80 28 5 10 10 9 85 31 10 10 7 8 88 32 10 8 10 9 93 33 10 10 10 5 88 35 10 10 10 10 100 37 8 8 9 10 88 39 10 10 7 10 93 41 10 2 9 10 78 43 10 10 10 6 90 47 10 10 5 10 88 56 7 4 9 10 75 58 10 8 10 10 95 59 10 10 8 9 93 61 10 10 8 10 95 62 7 10 8 9 85 69 0 10 10 10 75 71 10 8 10 9 93 72 2 9 10 3 60 79 10 9 10 7 90 80 7 10 5 10 80 86 10 0 8 10 70 112 7 10 9 10 90 115 2 10 10 10 80 120 0 10 10 10 75 124 8 9 3 9 73

- 113 -
MTO Aggregate and Soil Proficiency Sample Testing Program for 2010; MERO-040
Laboratory No.
C1252/T 304 Uncompacted Void Content
D2419/T 176 Sand Equivalent
ASTM D5821 % Fractured
Particles
ASTM D4719 % Flat &
Elongated
Rating
157 9 10 10 10 98 172 10 5 10 10 88 181 10 9 10 10 98 188 10 10 10 9 98 193 10 10 10 9 98 199 10 10 10 7 93 215 10 10 9 7 90 216 10 10 10 9 98 236 10 10 10 10 100 245 10 10 10 9 98 253 1 0 10 10 53 255 9 10 7 9 88 263 9 3 10 10 80 271 10 10 10 5 88 272 10 10 10 10 100 273 10 10 10 9 98 285 10 10 6 10 90 293 9 10 10 10 98 295 10 10 7 10 93 296 10 8 8 8 85 316 9 3 10 10 80 325 10 10 7 9 90 326 9 10 10 9 95 327 10 10 10 10 100 328 10 10 7 10 93 340 10 10 10 10 100