agf overview - february 2016
TRANSCRIPT

Growing Africa, One great idea at a time.
2 AGF OVERVIEW
CONTENT
What is AGF?
I. ROLE OF AGF
II. LEGAL STRUCTURE &
GOVERNANCE
II. AGF FIVE PILLARS
IV. FINANCIAL MODEL
V. ACHIEVEMENTS

3 AGF OVERVIEW
https://www.youtube.com/watch?v=eV9CjHbKb8g
THE MISSING LINK TO SMEs FINANCING

4 AGF OVERVIEW
AGF credit
guarantees enable
financial
institutions to
finance SMEs for
developmentally
important projects
by reducing the
risks to doing so.

5 AGF OVERVIEW
ROLE OF AGF Importance of SMEs in Africa
SMEs make up approx. 81%
of Africa’s (registered) private
sector firms.
SMEs contribute to over 50%
of new jobs creation.
SMEs contribute to only 20% of
the GDP (40-60% in the EU and
the US).
The SMEs are the drivers of:
Job Creation + Economic Growth + Poverty Reduction

6 AGF OVERVIEW
Main obstacles to finance access Constraints to Growth
of SMEs in Africa
Regulatory environment
Access to markets
Infrastructure
Access to finance
ROLE OF AGF

7 AGF OVERVIEW
ROLE OF AGF

8 AGF OVERVIEW
A blended
instrument
to catalyse
Africa
sustainable
growth.

9 AGF OVERVIEW
LEGAL STRUCTURE
• Limited liability company – non-bank financial institution;
• Incorporation in Mauritius under Company Law, with
Global Business License (type 1);
• Governance structure including:
o Annual Meeting & Shareholders approvals
o Board of Directors (BoD); o BoD appointing board committees and CEO;
• CEO and staff based in Kenya and Togo.

10 AGF OVERVIEW
• Three risk tranches and shareholding:
o Junior/first-risk shares: Bilateral donors through grants;
o Mezzanine: DFIs;
o Senior: Private social and commercial investors
• Junior and mezzanine tranches always in absolute majority.
CAPITAL STRUCTURE

11 AGF OVERVIEW
Class A (Senior)
Class B (Mezzanine)
Class C (Junior)
First loss
Blending
Mechanism
The highest risk tranche is the first loss tranche that absorbs initial
losses, limiting the losses of other investors, thereby enhancing their
credit worthiness and improving the financial profile of their equity
investment.
• Different obligations, but same rights
Private
Sector
CAPITAL STRUCTURE

12 AGF OVERVIEW
• Capital: USD 80,5 million, of which:
o Denmark: USD 36,5 million;
o Spain: USD 20 million;
o AFD: USD 14 million;
o AfDB: USD 10 million.
• Further capital increases needed to sustain the growth of the business.
CAPITALISATION

13 AGF OVERVIEW
Framework crafted based on best practices to:
o Define the overall relationship between the Board, the
Management, the Shareholder and other stakeholders;
o Describe mechanisms to direct, supervise and monitor
AGF’s operations;
o Ensuring appropriate level of authority, leadership, direction
and control exist;
o Overall objective: ensure appropriate environment is set for
AGF to accomplish its mission.
CORPORATE GOVERNANCE
14 AGF OVERVIEW
The following Board Committees are created:
o The Investment/Guarantee Committee;
o The Treasury Management Committee;
o The Audit Committee.
o The Capacity Development Committee;
o The Human Resource Committee.
CORPORATE GOVERNANCE

15 AGF OVERVIEW

16 AGF OVERVIEW
AGF FIVE PILLARS

17 AGF OVERVIEW
AGF’s products help to:
PILLAR 1– PRODUCTS
Diversify the
source of
financing
Deal with the insufficient
shareholders fund of
SMEs
Strengthen the
management of SMEs
Help the banking
system to mobilize
long term funding
Provide solid and
liquid guarantee

18 AGF OVERVIEW
Loan Guarantees
Portfolio or individual guarantees
Support long term business loans
Support acquisition of equipment
Support working capital facilities
PILLAR 1– PRODUCTS

19 AGF OVERVIEW
Bank Fund Raising Guarantees
Address regulatory requirements of Banks' limited use of
short-term resources to finance medium and long-term
facilities;
Enable Banks to mobilize long-term saving to finance
SMEs ;
Enable banks to issue bonds to raise long-term
resources to finance SMEs.
PILLAR 1– PRODUCTS

20 AGF OVERVIEW
Equity Guarantees
Guarantee equity or mezzanine financing to
SMEs;
Counter or direct guarantees to intermediaries
providing equity to SMEs.
PILLAR 1– PRODUCTS

21 AGF OVERVIEW
Pricing Model
o A risk-based pricing;
o Not too high to discourage borrowers;
o Acceptable level to cover operational costs;
o Periodically adjusted based on the quality of the portfolio.
PILLAR 1– PRODUCTS

22 AGF OVERVIEW
Common Features of AGF Guarantees
o Fees o Origination Fee;
o Utilization Fee;
o Commitment Fee.
o Tenor: up to 8 years;
o Coverage: up to 75%;
o Size o Individual Guarantee: up to USD 1 million;
o Loan Portfolio Guarantee: up to 25% of AGF Capital;
o Bank Fund Raising Guarantee: up to USD 5 million;
o Equity Guarantee: up to USD 1 million.
o Monitoring: quarterly reporting on the portfolio performance.
PILLAR 1– PRODUCTS

23 AGF OVERVIEW
Financial Institutions SMEs
Objectives Assist FI to improve their SMEs capabilities Assist SMEs to improve their management capacity
Examples Product development Business strategy
Risk management procedures Financial management
Risk management tools Governance & Compliance
Portfolio monitoring tools Reporting standards
Environmental issues
Principles
Objectives
Ensure local ownership of the capacity development effort;
Promote good governance and social and environmental standards;
Robust procurement process to select service providers.
PILLAR 2 – CAPACITY DEVELOPMENT

24 AGF OVERVIEW
Robust Risk Management to reduce exposure to default
o A systematic Risk Assessment
Partner selection process;
Scoring process;
Pricing methodology.
o Portfolio Diversification
Region limit & Country limit;
Sector limit & Single borrower limit;
Partner lending institution limit;
Product limit & Coverage limit.
o Frequent Portfolio Monitoring & Reporting
Monitoring plans (Reporting frequency & Bank visits);
Qualifying Loan Schedules (QLS);
Portfolio-at-Risk Analysis.
o Social & Environmental Responsibility
Sectors and activities excluded;
Equator Principles;
Industry-Specific Environmental, Health and Safety (EHS) Guidelines.
PILLAR 3 – RISK MANAGEMENT

25 AGF OVERVIEW
Partner Selection Process
AGF identifies and selects partners based on a set of criteria, including (but not limited to):
o Demonstrated interest in expanding services to SMEs,
o Geographical reach, and
o Overall fit with AGF’s portfolio strategy.
Strategic Planning Partner Generation Pipeline of Partners
Define Portfolio Objectives
Network, Referrals & Research
Origination Transaction DD StructuringOutreach Contact Review Memo Close
Identify Potential Financial
InstitutionPartners
fit with overall AGF portfolio in
terms of diversification
and risk
Due diligence of Partners
demonstrated commitment
to SMEs
Approval
Renewal
Finalize Structure
Agreement
Monitoring Servicing
Partner
Track
PILLAR 3 – RISK MANAGEMENT
26 AGF OVERVIEW
Claims Management Process
PILLAR 3 – RISK MANAGEMENT
The Guaranteed Party shall make a claim with respect to a Qualifying Facility by submitting to AGF a
claims form in prescribed format for each such Qualifying Facility;
AGF communicates its decision (approval or denial) of any claim within Seven (7) Days of receipt of the
claim;
Upon approval of a claim for payment by AGF, AGF pays to the Guaranteed Party the approved amount of
the claim in the currency of guarantee payment specified in the guarantee agreement, as follows:
o 50% of the covered & approved principal amount outstanding within fourteen (14) days from the date a claim is approved
by AGF; and
o 50% of the covered and approved principal amount outstanding within fourteen (14) days of receipt by AGF of a notice of
exhaustion of available remedies and procedures to recover the principal amount outstanding from the defaulting
borrower.

27 AGF OVERVIEW
Liquidity Management & Investment Management
Objectives
Policy & Principles
o Ensure necessary access to liquidity at
all time to settle AGF obligations.
o Earn the maximum risk-adjusted return
on AGF capital.
o Counterparty credit risk : BBB and above, with at least 54% invested in AA and above;
o Market risk : Immediate reporting to the Board of Directors, if the annual standard deviation of the
investment portfolio exceed 5%;
o Liquidity risk : No more than five trading days to liquidate a security;
o Concentration risk: Single obligor limit (maximum 10% of the investment portfolio);
o Currency risk : Investment portfolio should aim to mitigate currency risk arising from the guarantees;
o Monitoring : Quarterly review of the financial investments by the Treasury Management Committee.
PILLAR 4 – TREASURY MANAGEMENT

28 AGF OVERVIEW
AGF
theory of
Change

29 AGF OVERVIEW
If AGF mobilized
sufficient…………
…partner with
Banks/Financial
Institutions to….
…..this would lead
to……..
…which in turn
leads to………
…..and this will
contribute to
the…..
Extend
Financial
Guarantees &
Capacity
Development
to PFIs &
SMEs
Increased
SMEs Access
to financial
guarantees
Resources
(Financial,
Human,
Material & CD
Grants)
National
Economic
growth &
poverty
reduction in
target
countries
Increased
Job creation
Increased
Return on
investments for
SMEs
Enhanced
productivity
INPUTS OUTPUTS
INTERMEDIATE
OUTCOMES
HIGH LEVEL
OUTCOMES IMPACTS
PILLAR 5 – IMPACT MEASUREMENT

30 AGF OVERVIEW
PILLAR 5 – IMPACT MEASUREMENT
M&E Framework: Guarantee Products
M&E Levels
Main Indicator
Specific Indicators
How the Indicators will be collected
Source Documents
Frequency
Output Increased financing
(Loans/Equity) available to SMEs
1. Number of PFIs benefiting from AGF facilities AGF Internal Reports AGF Database Quarterly
2. Additional loans disbursed to SMEs by PFIs benefiting from AGF facilities
Quarterly reports from PFIs
Quarterly Loan Schedules (QLS)
Quarterly
Additional loans provided by PFIs to Women-owned SMEs
Surveys Surveys Annually
Additional loans provided by PFIs to youth-owned SMEs
Surveys Surveys Annually
3. Overall volume of loans disbursed to SMEs by PFIs benefiting from AGF facilities
Reports from PFIs PFIs Report Semi/Annually
4. Breakdown of SME loan portfolio by sector Reports from PFIs PFIs Report Semi/Annually
5. Number of SMEs benefiting from AGF facilities
Quarterly reports from PFIs
Quarterly Loan Schedules (QLS)
Quarterly
No. of SMEs owned by women Surveys Surveys Annually
No. of SMEs owned by Youth (age bracket 15-24)
Surveys Surveys Annually
Input Volume of guarantees
issued
1. Loan Guarantees AGF Internal Reports Financial Statements
Quarterly
2. Equity Guarantees AGF Internal Reports Financial Statements
Quarterly
3. Bank Fund Raising Guarantee AGF Internal Reports Financial Statements
Quarterly

31 AGF OVERVIEW
PILLAR 5 – IMPACT MEASUREMENT
M&E Framework: Guarantee Products M&E
Levels Main
Indicator Specific
Indicators How the Indicators
will be collected Source
Documents Frequency
Impact
Lasting effect on the landscape of financial markets and products
1. Average tenor of loans to SMEs in countries where AGF operates
Survey Surveys Every 3 years
2. Average cost of loans to SMEs in countries where AGF operates
Survey Surveys Every 3 years
3. Collateral requirements in countries where AGF operates
Survey Surveys Every 3 years
Expansion of resources available for SME
financing
4. Share of loan amounts allocated to SMEs by PFIs in countries where AGF operates
Survey Surveys Every 3 years
5. Local capital raised in countries where AGF operates
Survey Surveys Every 3 years
Outcome
PFIs behavioral changes induced by AGF facilities
1. Average tenor of loans under AGF Guarantee Quarterly reports from PFIs
Quarterly Loan Schedules (QLS)
Quarterly
2. Number of loans under AGF Guarantee granted to first time SME borrowers
Quarterly reports from PFIs
Quarterly Loan Schedules (QLS)
Quarterly
Growth of SMEs benefiting from AGF
facilities
1. Incremental revenue created by SMEs benefiting from AGF facilities
Reports from PFIs
Quarterly Loan Schedules (QLS)
Survey
Quarterly
Annually
2. Number of jobs supported by SMEs under AGF Guarantees
Reports from PFIs
Quarterly Loan Schedules (QLS)
Survey
Quarterly
Annually No. of jobs supported among women Surveys Surveys Annually
No. of jobs supported among the youth (age bracket 15-24)
Surveys Surveys Annually

32 AGF OVERVIEW
PILLAR 5 – IMPACT MEASUREMENT
M&E Framework: Capacity Development
M&E Levels
Main Indicator
Specific Indicators
How the Indicators
will be collected
Source Documents
Frequency
Output
Capacity of PFIs strengthened through well-targeted Capacity Development Initiatives.
1. Number of PFIs benefiting from AGF Capacity Development Initiatives.
AGF's CD Team AGF's CD Team Reports
Quarterly
2. Number of trainings supported CD Providers CD Providers Reports
Quarterly
3. Number of PFIs employees trained CD Providers CD Providers Reports
Quarterly
4. Number & Value of systems co-financed AGF's CD Team AGF's CD Team Reports
Quarterly
Assisting Business Development Support (BDS) services firms, enhance their capacity to assist
SMEs improve their business management skills such as governance, general management,
financial management and marketing.
5. Number of BDS benefiting from AGF Capacity Development Initiatives.
AGF's CD Team AGF's CD Team Reports
Quarterly
6. Number of trainings supported AGF's CD Team AGF's CD Team Reports
Quarterly
Assisting SMEs enhance their business managerial capabilities.
7. Number of SMEs benefiting from AGF Capacity Development Initiatives.
CD Providers CD Providers Reports
Quarterly
8. Number of SME trained owned by Women CD Providers CD Providers Reports
Quarterly
9. Number of SME trained owned by Youth (age bracket 15-24)
CD Providers CD Providers Reports
Quarterly
10. Number of trainings supported CD Providers CD Providers Reports
Quarterly
Input Capacity development (CD) initiatives for the
benefits of AGF's partners
1. Value of CD programs in favor of PFIs AGF Internal Reports
Financial Statements
Quarterly
2. Value of CD assistance to Business Development Support (BDS) services firms
AGF Internal Reports
Financial Statements
Quarterly
3. Value of CD assistance to SMEs AGF Internal Reports
Financial Statements
Quarterly

33 AGF OVERVIEW
PILLAR 5 – IMPACT MEASUREMENT
M&E Framework: Capacity Development
M&E Levels
Main Indicator
Specific Indicators
How the Indicators will be collected
Source Documents
Frequency
Impact Expansion of resources
available for SME financing
1. Share of loan amounts allocated to SMEs by PFIs in countries where AGF operates
Survey Surveys Annually
2. Local capital raised in countries where AGF operates
Survey Surveys Annually
Outcome Improved managerial
practices
1. % of non-performing loans (NPLs) for the trained SMEs
AGF Internal Reports AGF Database Quarterly
2. Incremental revenue created by SMEs benefiting from AGF facilities
AGF Internal Reports AGF Database Quarterly
3. % of non-performing loans (NPLs) for the trained PFIs
Reports from PFIs
Quarterly Loan Schedules (QLS)
Survey
Quarterly
Annually
4. % of non-performing loans (NPLs) for the trained PFIs
Reports from PFIs
Quarterly Loan Schedules (QLS)
Survey
Quarterly
Annually
5. Volume of guaranteed loans disbursed to SMEs by PFIs benefiting from AGF CD Initiatives
AGF Internal Reports AGF Database Quarterly

34 AGF OVERVIEW
Placing sustainability
at the heart of all
decisions.

35 AGF OVERVIEW
Operating Sustainability
Credit Sustainability
Treasury Income + Origination Income ≥ Operating Expenses + Return on Equity
Utilization Income ≥ Cost of Credit
FINANCIAL MODEL

36 AGF OVERVIEW
Financial &
Development as
indicators of
success.
37 AGF OVERVIEW
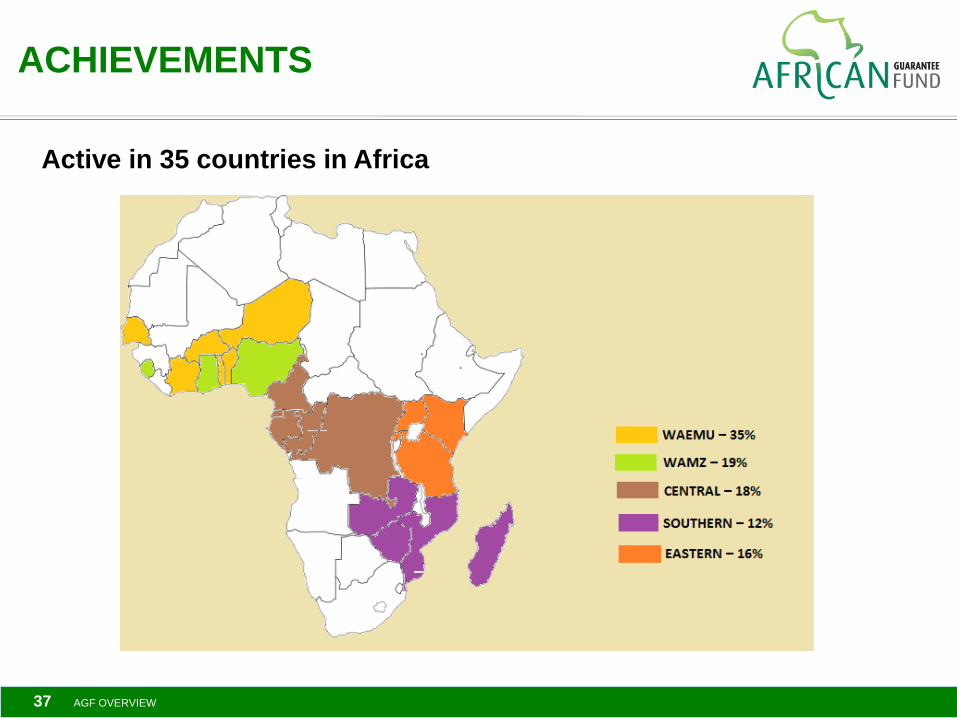
Active in 35 countries in Africa
ACHIEVEMENTS

38 AGF OVERVIEW
USD 210 million of guarantees signed
=> Up to USD 450 million of finance available for the SMEs.
850 SMEs Impacted & Estimated 5,200 Additional Jobs Created
Agriculture
Agro
industry Telecommunication
Transport
Building and
construction
Tourism
Trade Energy
ACHIEVEMENTS

39 AGF OVERVIEW
Deals Signed with 62 Partner Financial Institutions
ACHIEVEMENTS

40 AGF OVERVIEW
3 Re-guarantee Partners
2 Strategic Partners (to catalyze SMEs financial inclusion)
ACHIEVEMENTS

41 AGF OVERVIEW
3 Awards
1 Annual Continental Event
o Financial Inclusion Award by The African Banker
o Best Financial Institution for SMEs Award by The International Finance
o World Finance 100 Award by The World Finance
To praise
o The best SMEs in Africa
o And the Best SME Financial Institutions
ACHIEVEMENTS

42 AGF OVERVIEW
THANK YOU