"agent-based service analysis, forecasting, simulation and optimisation - from origin to...
TRANSCRIPT

Agent-Based Service Analysis, Forecasting, Simulation and Optimisation – From Origin to Pioneering Industry Applications
Dr Yang Li
Research and Innovation
Technology, Service and Operation
British Telecom
Email: [email protected]
© British Telecommunications plc
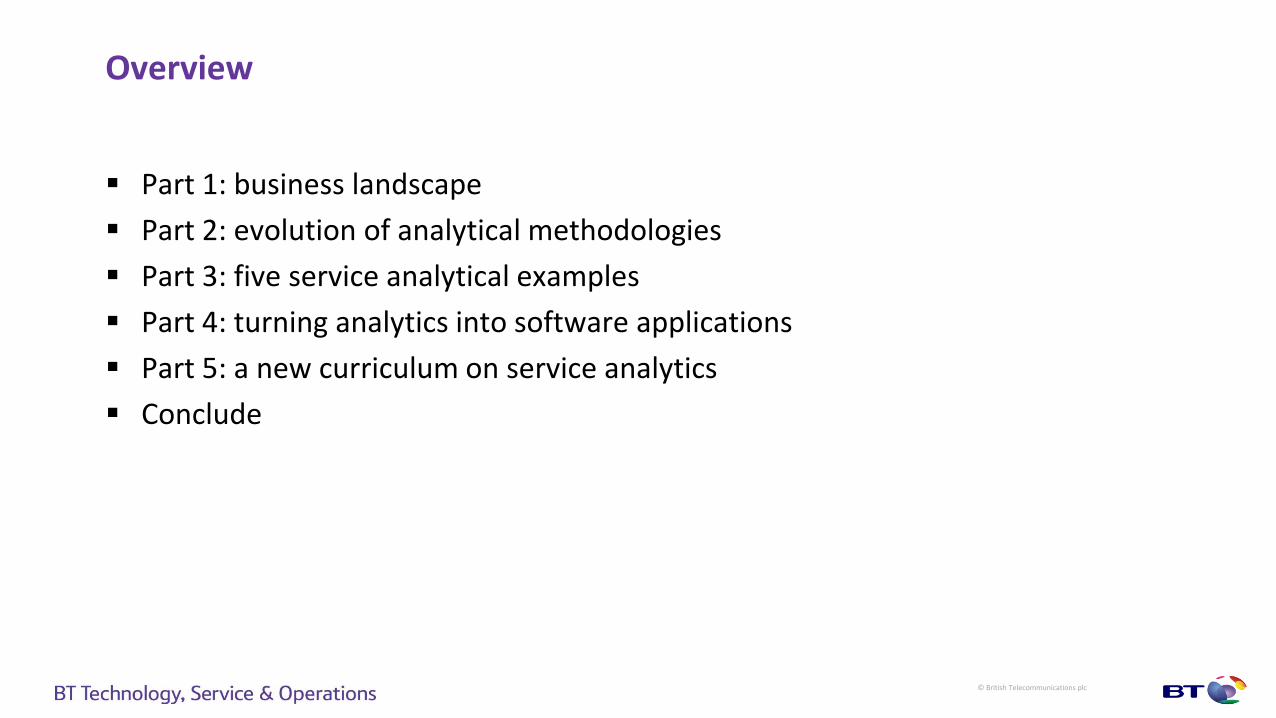
Overview
Part 1: business landscape
Part 2: evolution of analytical methodologies
Part 3: five service analytical examples
Part 4: turning analytics into software applications
Part 5: a new curriculum on service analytics
Conclude

© British Telecommunications plc
Part 1: Business Landscape

© British Telecommunications plc
Why “Service”?
UK GDP Industry Weights (%)
1948 to 2012
People Employed in UK Industry Weight (%)
1948 to 2012
Top 2 GDP Countries (2012)
UK GDP (2012)

© British Telecommunications plc
Telecommunications Industry, BT, and Field Service
BT quick facts
- Revenue: $26 billion (2012)
- Operates in 170 countries
- 88,500 employees
- Responsible for 20 million
telephone lines in the UK
Telecommunications Industry
- 4~5% of UK GDP
- One of the top 10 sectors
as “Critical National
Infrastructure”
A telecommunications
network consists of
- Telephone exchanges
- Trunk network
- Local / access network
- Mobile phone network
Types of engineering work
- New build
- New provision
- Routine maintenance
- Fault repair
Network + People
(25,000 field workers is a multi-billion-pound business)
Key questions
- What is the exact field service demand for future?
- How to best match up demand and resource?

© British Telecommunications plc
Value Chain in Telecommunications Field and Customer Services
Faults
Productivity
Weather
Non-
Weather
Forecast
Actual
Accuracy Rules
Time
Horizon
Org
Hierarchy
Service API
& Web PortalBackend
Engines
• Propose and downstream innovations
• Research into new algorithms
• Pilot, trial and live deployment
• Timescale: Day 1 to
Day 14
• Accurate fault and
productivity forecast
leads to committable
provision books
• Timescale: Day 1 to Year 3
• Accurate demand forecast leads to sound
resourcing plan (location, skill, productivity)
• Timescale: on-the-day
and next day
• Accurate fault forecast
leads to lean
resourcing plan
• Timescale: on-the-day
• Reduced faults and
on-time delivery lead
to improved customer
care and satisfaction
• Timescale: on-the-day
• Predictive demand and
accurate scheduling
leads to less travel and
over time
Maximise
Revenue
Minimise
Cost
Field Forecast
/ Planners
Job
Controllers
Customer
Services
Field
DirectorsSOM
Managers
Research &
Innovation
Business
Specialists
Field
Engineers

© British Telecommunications plc
Telecom Fault Prevention and Forecasting
Five Examples
Scenarios Both inside and outside BT Anonymised for illustration purpose
Cover Work force: location, skill, process Infrastructure: network, vehicle
Key question: what is the most
suitable analytical approach?
Strategic Workforce Co-Location
(1)
Tactical Field Force Re-Skilling
(2)
Complex Service Production Simulation and Management
(3)
Corporate Fleet Analysis and Deployment
(4)
(5)
© British Telecommunications plc
Part 2: Evolution of Analytical Methodologies
© British Telecommunications plc
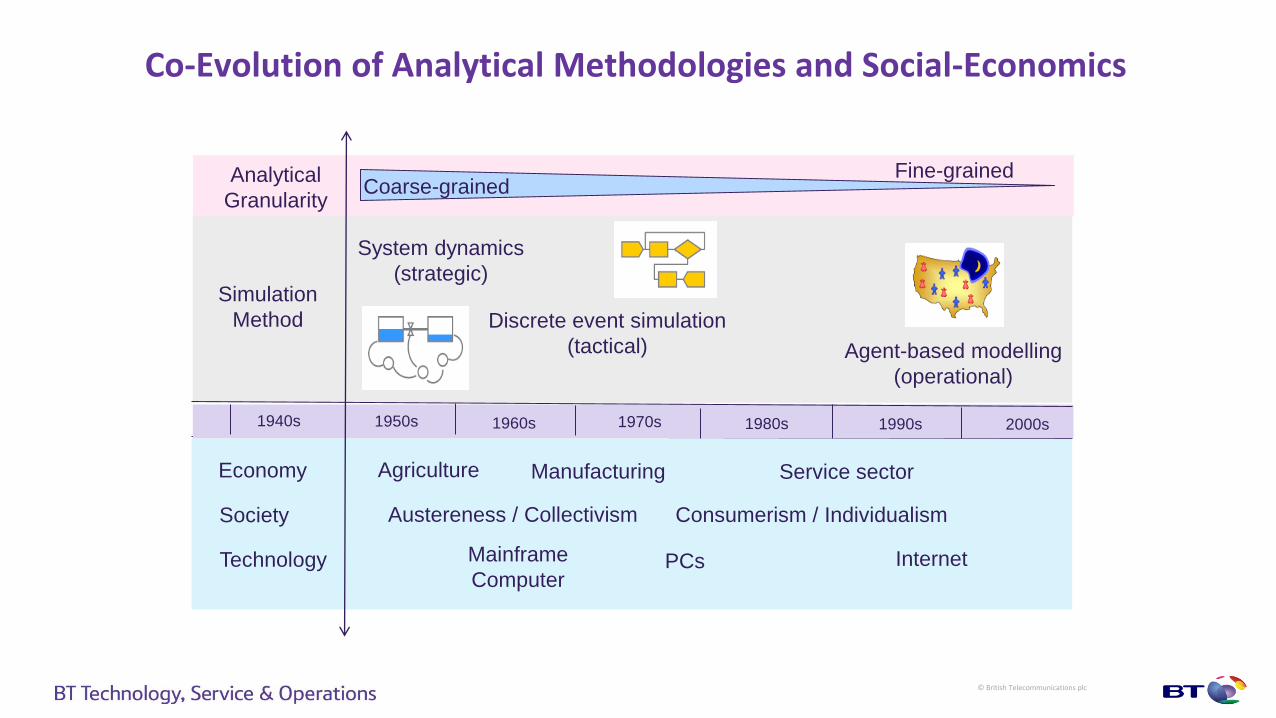
Co-Evolution of Analytical Methodologies and Social-Economics
Economy
Technology
Society
Agriculture Manufacturing Service sector
PCsMainframe
ComputerInternet
Austereness / Collectivism Consumerism / Individualism
Simulation
Method
System dynamics
(strategic)
Discrete event simulation
(tactical) Agent-based modelling
(operational)
1950s 2000s1990s1980s1970s1960s1940s
Analytical
GranularityCoarse-grained
Fine-grained

© British Telecommunications plc
System Dynamics
Definition: an approach to understanding the nonlinear behaviour of complex
systems over time using stocks, flows, internal feedback loops, and time delays.
Equations in Discrete Time:
1) Potential_Adopters(t) = Potential_Adopters(t-1) - New_Adopters(t)
2) Adopters(t) = Adopters(t-1) + New_Adopters(t)
3) New_Adopters(t) = AdoptionFromAd(t) + AdoptionFromWOM(t)
4) AdoptionFromAd(t) = Potential_Adopters(t-1) Χ AdEffectiveness
5) AdoptionFromWOM(t) = Adopters(t-1) Χ PotentialAdopters(t-1) Χ ContactRate Χ AdoptionFraction / TotalPopulation
Weather Forecast
Agricultural Throughput
Epidemic Disease Propagation
Chemical Process

© British Telecommunications plc
Discrete Event Simulation
Definition: an approach to model the operation of a system as a discrete sequence of events in time.
Formulae:
Source1 ::= ArrivalRate1 / Second
Source2 ::= ArrivalRate2 / Second
Service1 ::= (Triangular(ServiceTime11/2, ServiceTime11, ServiceTime11 Χ 2), 1/AbandonMeanTime1)
Service2 ::= (Triangular(ServiceTime21/2, ServiceTime21, ServiceTime21 Χ 2) |
Triangular(ServiceTime22/2, ServiceTime22, ServiceTime22 Χ 2),
1/AbandonMeanTime1 | 1/AbandonMeanTime2)
Operator1 ::= NOperators1
Operator2 ::= NOperators2
Manufacturing Factory Hospital theatre Network SimulatorCall Centre

© British Telecommunications plc
Agent-Based Modelling and Simulation
Definition: an approach to simulating the actions and interactions of autonomous
agents with a view to accessing their effects on the system as a whole.
Formulae:
Ad ::= AdEffect / Day
WOM ::= ContactRate Χ AdoptionFraction
Biology Ecology Sociology
Key question: why ABM has not
been used for real-world service
operation domain?
ABM
Tools
Time
1990 1995 2000 2005 2010
StarLogo Swarm
NetLogoRepast
Anylogic
Gama
© British Telecommunications plc
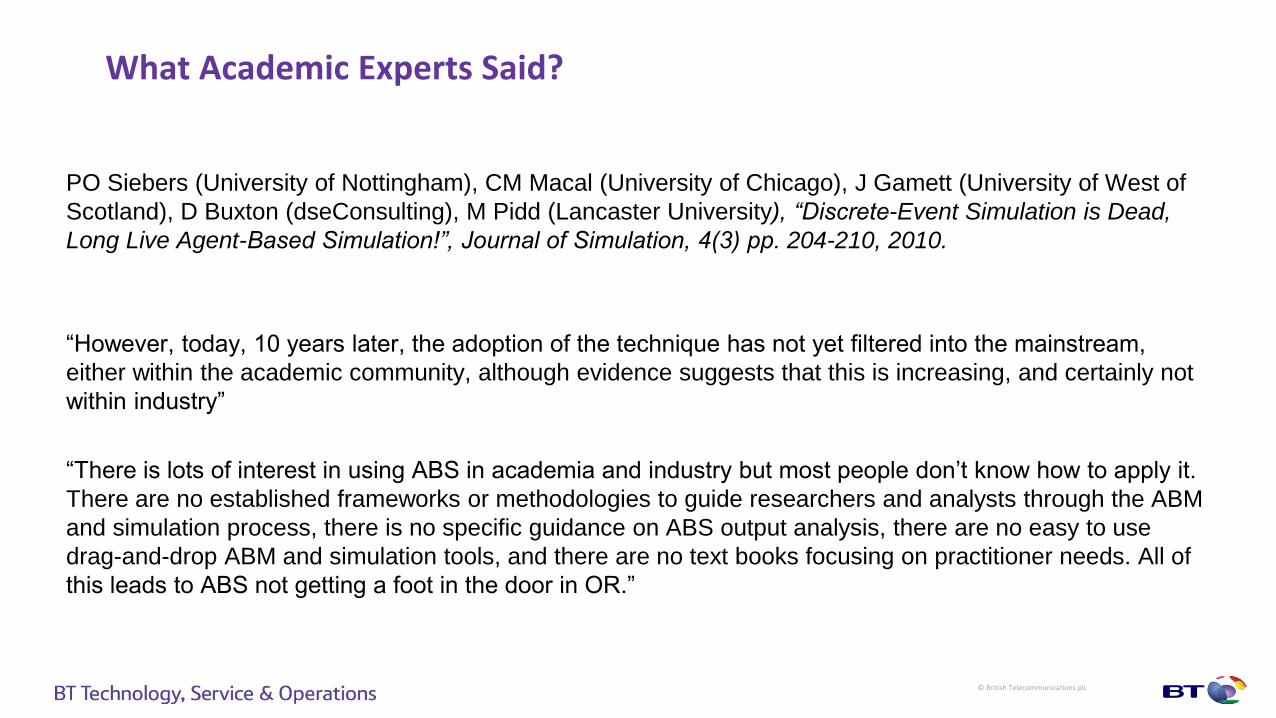
What Academic Experts Said?
PO Siebers (University of Nottingham), CM Macal (University of Chicago), J Gamett (University of West of
Scotland), D Buxton (dseConsulting), M Pidd (Lancaster University), “Discrete-Event Simulation is Dead,
Long Live Agent-Based Simulation!”, Journal of Simulation, 4(3) pp. 204-210, 2010.
“However, today, 10 years later, the adoption of the technique has not yet filtered into the mainstream,
either within the academic community, although evidence suggests that this is increasing, and certainly not
within industry”
“There is lots of interest in using ABS in academia and industry but most people don’t know how to apply it.
There are no established frameworks or methodologies to guide researchers and analysts through the ABM
and simulation process, there is no specific guidance on ABS output analysis, there are no easy to use
drag-and-drop ABM and simulation tools, and there are no text books focusing on practitioner needs. All of
this leads to ABS not getting a foot in the door in OR.”

© British Telecommunications plc
What Best Vendor Said?
Responses from Anylogic support team on issues related to Oracle database adapter and visual
map:
“Different databases supports different SQL standards. So ‘Insert’ and ‘Query’ components can work
incorrectly in some cases. There are several bugs in our databases concerning this issue. I hope they will
be resolved in near future”
“We plan to release new Anylogic this autumn. Most likely it will include some kind of maps (Google,
OpenStreetMaps, Bing or others)”
“We’re trying to answer in 24 hours. But some questions/problems may require more time because we
need to check something or ask our Developing Team to do this if the source of the problem is in
AnyLogic source code”

© British Telecommunications plc
What I Said?
Y. Li, “Agent-based service analytics”, Encyclopedia of
Business Analytics and Optimisation, 2014.
ABS for service and DES for manufacturing
Keep away from CS and OR agent definition debate
Use actual data instead of abstract data
ABSA as an end-to-end framework
ABSA as a software engineering project
Set up a new curriculum
John Wang, Editor-in-Chief, Encyclopedia of Business
Analytics and Optimisation
Double-blind review comment:
“I think the manuscript is very well written and clearly states
the point. The authors have good understanding of the
subject”

© British Telecommunications plc
Part 3: Five Service Analytical Examples

© British Telecommunications plc
Example 1: Tactical Field Force Re-Skilling
o Business context
o Traditional approach
o Architecture of an agent-based analytical toolkit
o Use case 1
o Use case 2
o Use case 3

© British Telecommunications plc
Tactical Field Force Re-Skilling – Business Context
Fleet Map
Business scenario A national business organisation with a large field
service workforce
Available data
o Historical jobs
• Type of work, location, date and time
o People details
• Type of skill, work area, productivity
Business objectives1) Can we find optimal skill mix for a given number
of field engineers?
2) What is the benefit of optimising skill mix?
3) What is the impact on service performance, if a
field engineer is re-trained to a specific skill?

© British Telecommunications plc
Tactical Field Force Re-Skilling – Traditional Approach
Skill 1 Skill 2 Skill 3 Skill 4
Area 1 (10, 5) (20, 10) (30, 15) (40, 20)
Area 2 (20, 10) (40, 20) (60, 30) (80, 40)
Area 3 (40, 20) (80, 40) (120, 60) (160, 80)
Demand Profile by Area and Skill
(Mean, Standard Deviation)
Skill 1 Skill 2 Skill 3 Skill 4
Area 1 10 20 30 40
Area 2 20 40 60 80
Area 3 40 80 120 160
Resource Profile by Area and Skill
(Actual)
Monte-Carlo-Based DES model ?
<
<
Historical Job Details
Historical Engineer Details
Traditional statistical approach
(Drawbacks)
Loss of data fidelity
o Job (location, travel time,
task time, service level)
o People (patch, attendance
pattern, skill code)
Cannot scale up
o 800 skill codes
o 1800 work areas
o 90 days
Cannot give actionable insight
o To which specific skill
codes should one engineer
be re-trained?
o What will be the benefit
after re-skilling?
Step (a)
Step (b)
Step (c)
© British Telecommunications plc
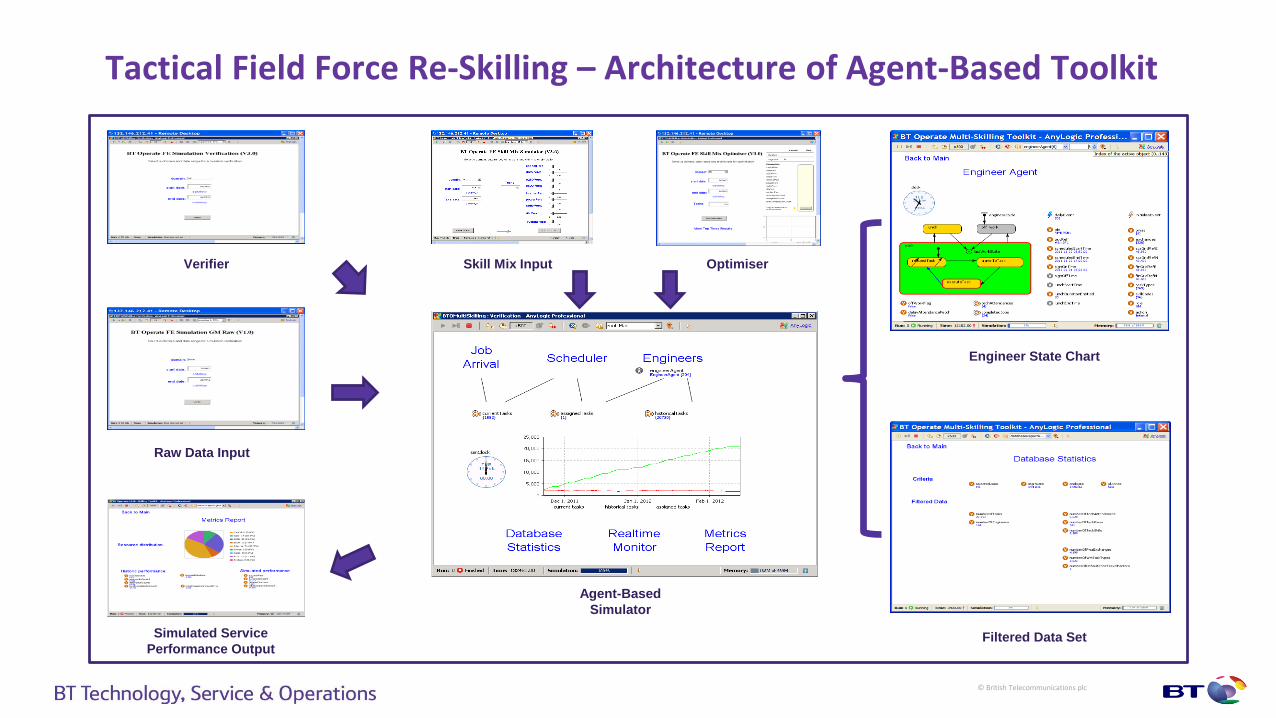
Tactical Field Force Re-Skilling – Architecture of Agent-Based Toolkit
Engineer State Chart
Filtered Data Set
Agent-Based
Simulator
Simulated Service
Performance Output
Raw Data Input
Skill Mix InputVerifier Optimiser

© British Telecommunications plc
Tactical Field Force Re-Skilling – Use Case 1: Improving Service Performance
Action Balance
capital 0
data 0
e250 1
e500 -19
internal 15
power 0
radio 0
rits 3
evotam 0
Source Action Target Action Shift
e500 e250 1
e500 internal 15
e500 rits 3
Skill Balancing and Re-training Plan
Workflow1) Calibrate simulator via “Verifier”
2) Run “Skill Mix Optimiser”
3) Run “Skill Mix” simulator twice:
i. Use original skill mix
ii. Use optimal skill mix
4) Record benefit of skill
optimisation
5) Record recommended re-
skilling
Acceptable Errors
Simulation Verifier
1)
Skill Mix Optimiser
Optimal Skill Mix
2)
Original skill
mix
Optimal skill
mix
•Success rate: +2%
•Completed tasks:
+6.1%
Skill Mix
Simulator
3)
4)
© British Telecommunications plc
Tactical Field Force Re-Skilling – Use Case 2: Head Count Reduction
Workflow1) Run “Skill Mix” simulator for
original skill mix and record
service performance
2) Run “Skill Mix Optimiser”
a) using original head
count and record service
performance
b) Using original head
count minus 1 and
record service
performance
c) And so on …
133 techs vs 128 techs
No significant
difference in
productivity and RFT
0
2000
4000
6000
8000
10000
12000
14000
Total Completed
0
0.1
0.2
0.3
0.4
0.5
0.6
0.7
0.8
RFT
Resulto Identify 5 FTEs reduction
opportunity
© British Telecommunications plc
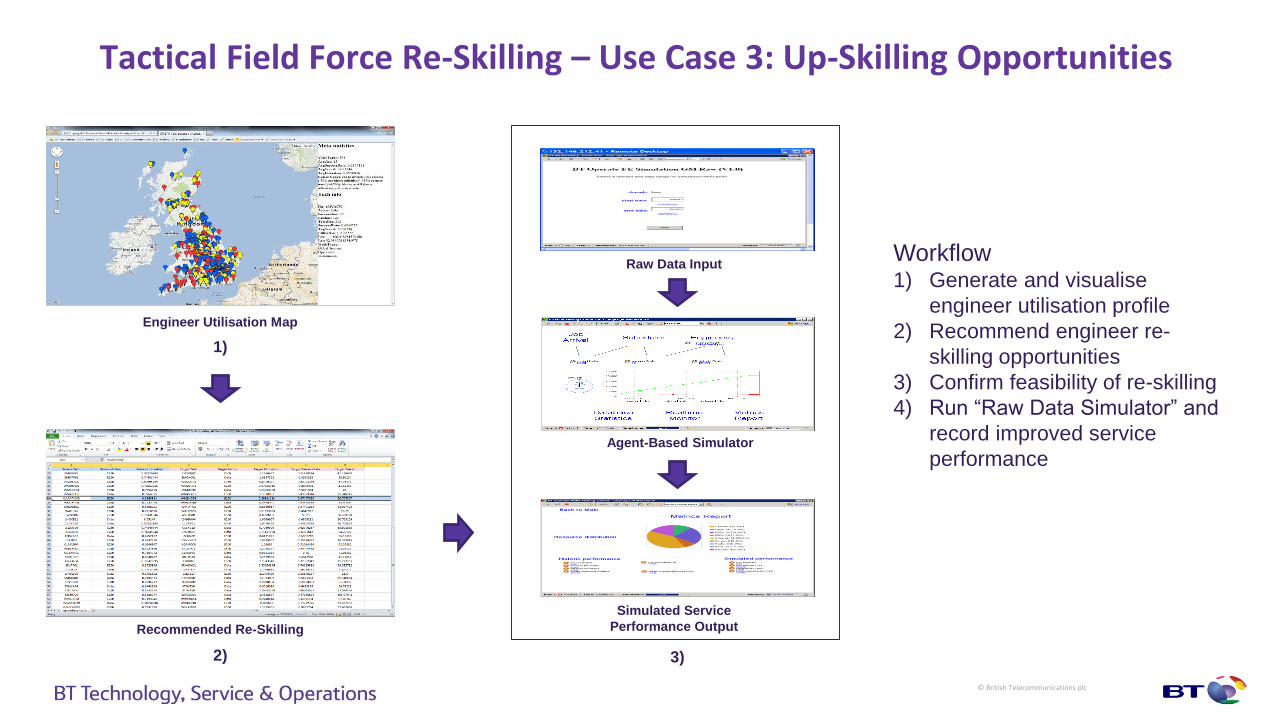
Tactical Field Force Re-Skilling – Use Case 3: Up-Skilling Opportunities
Workflow1) Generate and visualise
engineer utilisation profile
2) Recommend engineer re-
skilling opportunities
3) Confirm feasibility of re-skilling
4) Run “Raw Data Simulator” and
record improved service
performance
3)
Simulated Service
Performance Output
Agent-Based Simulator
Raw Data Input
1)
Engineer Utilisation Map
2)
Recommended Re-Skilling
© British Telecommunications plc
Example 2: Strategic Workforce Co-Location
o Business context
o Analytical skill gap
o Agent-based analytical approach
© British Telecommunications plc
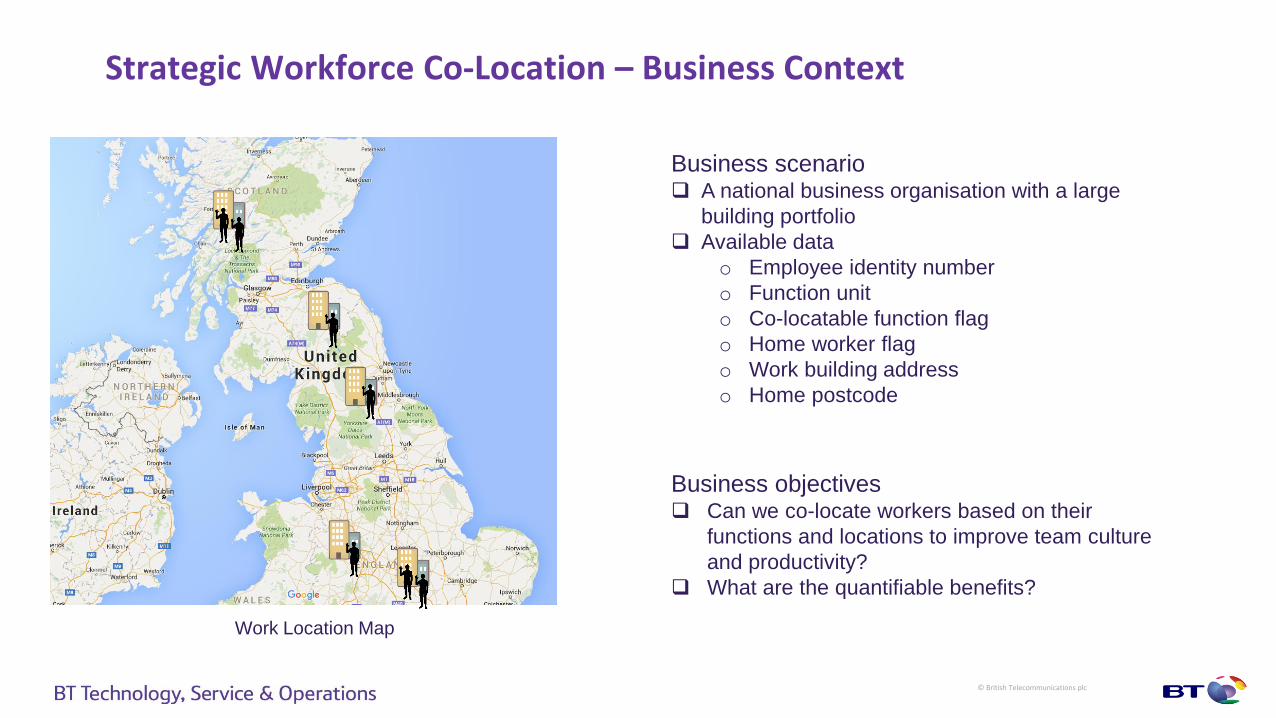
Strategic Workforce Co-Location – Business Context
Work Location Map
Business scenario A national business organisation with a large
building portfolio
Available data
o Employee identity number
o Function unit
o Co-locatable function flag
o Home worker flag
o Work building address
o Home postcode
Business objectives Can we co-locate workers based on their
functions and locations to improve team culture
and productivity?
What are the quantifiable benefits?
© British Telecommunications plc
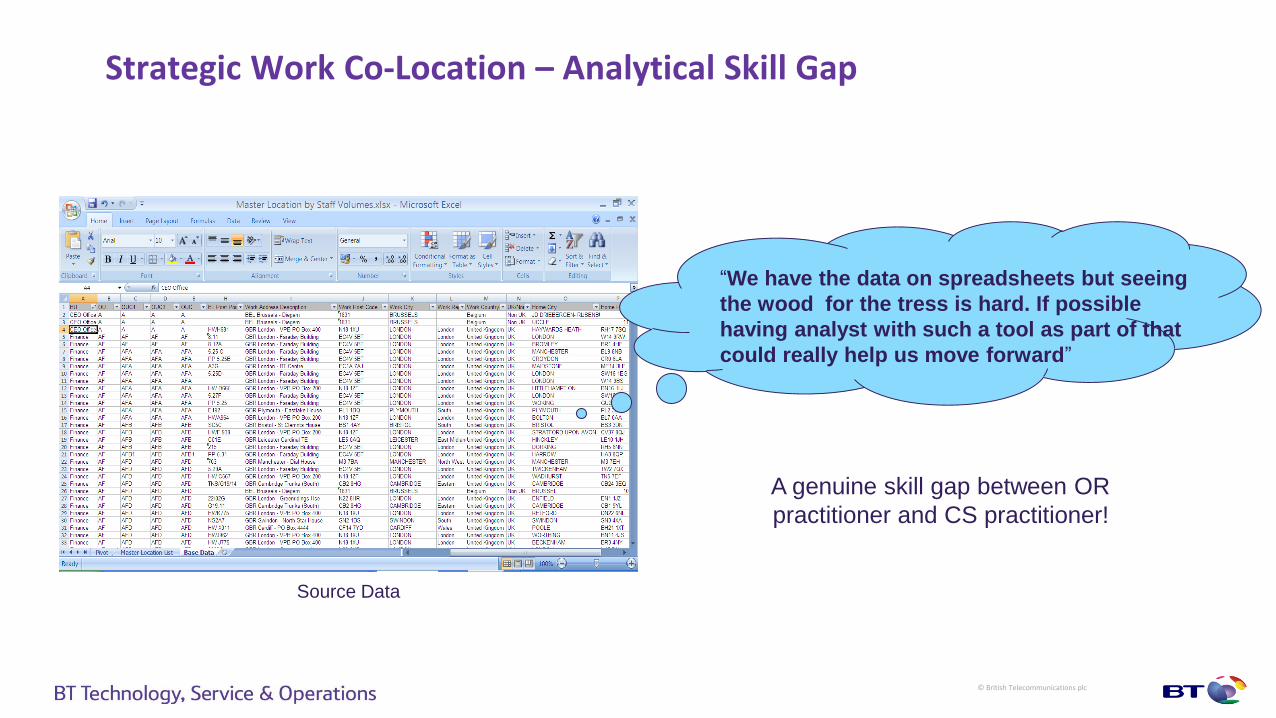
Source Data
Strategic Work Co-Location – Analytical Skill Gap
“We have the data on spreadsheets but seeing
the wood for the tress is hard. If possible
having analyst with such a tool as part of that
could really help us move forward”
A genuine skill gap between OR
practitioner and CS practitioner!
© British Telecommunications plc
Strategic Work Co-Location – Agent-Based Service Analytics
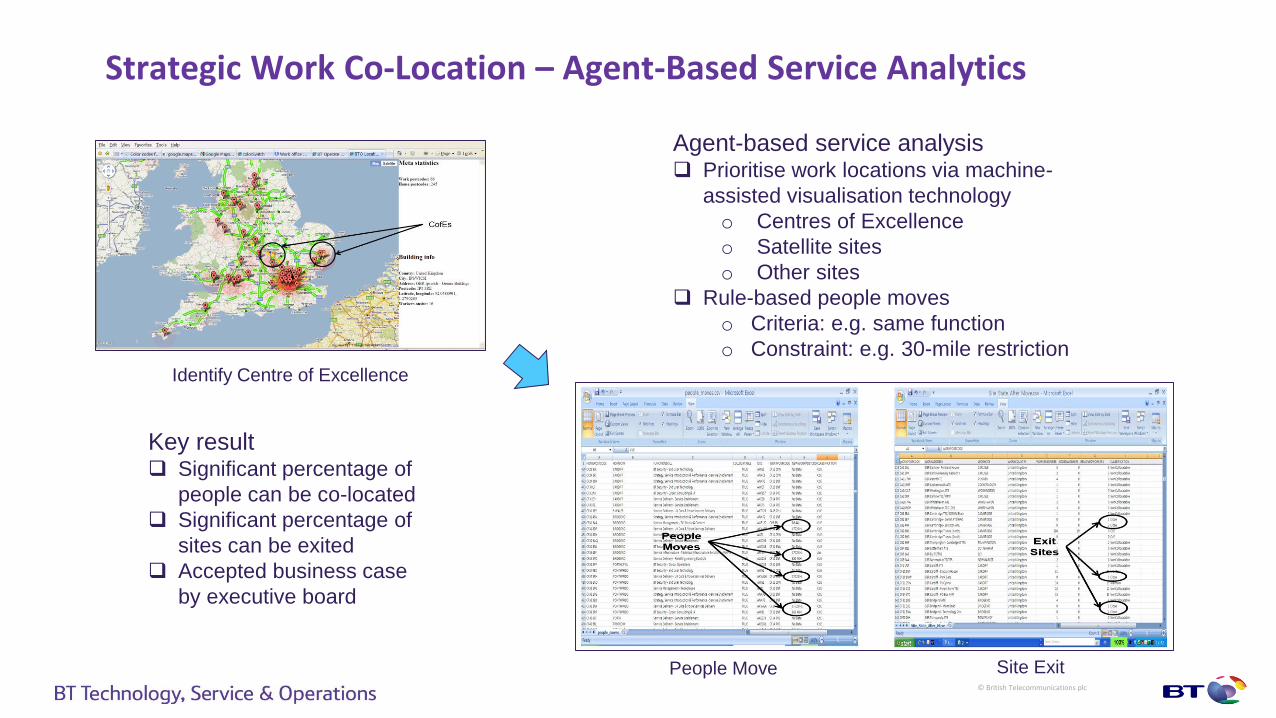
Identify Centre of Excellence
People Move Site Exit
Agent-based service analysis Prioritise work locations via machine-
assisted visualisation technology
o Centres of Excellence
o Satellite sites
o Other sites
Rule-based people moves
o Criteria: e.g. same function
o Constraint: e.g. 30-mile restriction
Key result Significant percentage of
people can be co-located
Significant percentage of
sites can be exited
Accepted business case
by executive board

© British Telecommunications plc
Example 3: Complex Service Production Management
o Business context
o Limitation of DES Toolkit
o Agent-based process model
© British Telecommunications plc
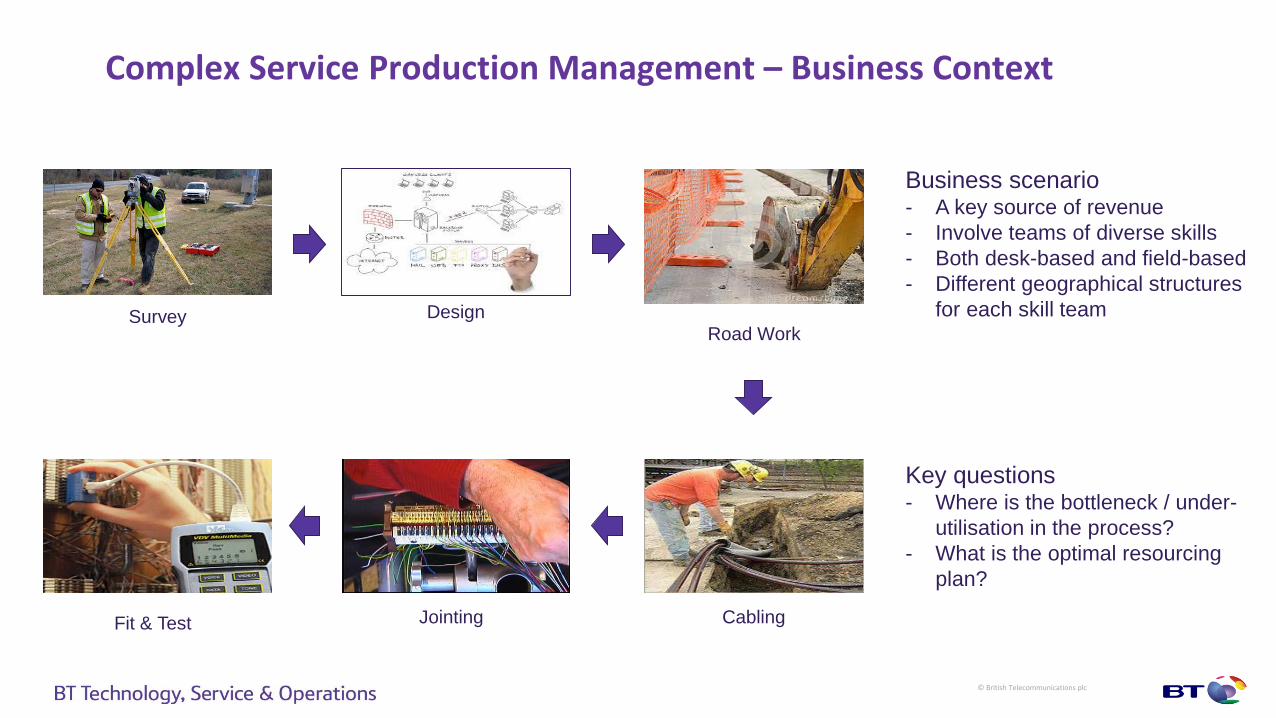
Complex Service Production Management – Business Context
Survey Design
JointingFit & Test
Road Work
Cabling
Business scenario- A key source of revenue
- Involve teams of diverse skills
- Both desk-based and field-based
- Different geographical structures
for each skill team
Key questions- Where is the bottleneck / under-
utilisation in the process?
- What is the optimal resourcing
plan?
© British Telecommunications plc
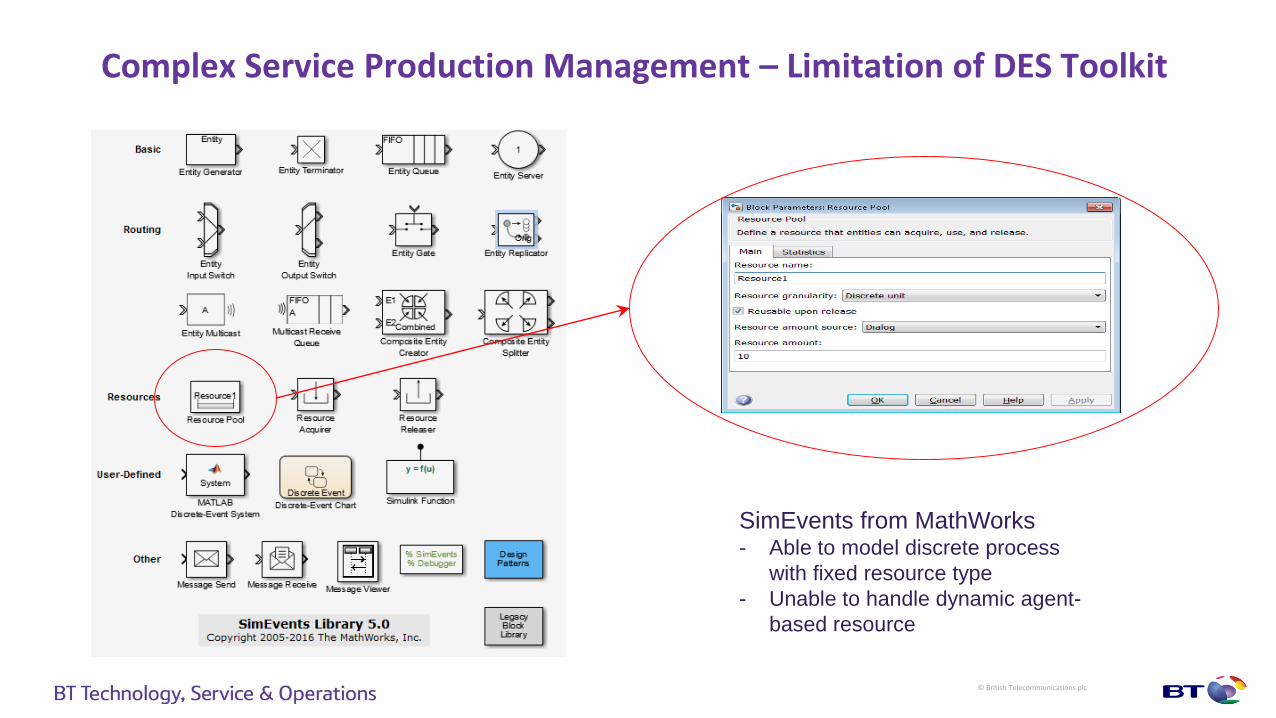
Complex Service Production Management – Limitation of DES Toolkit
SimEvents from MathWorks- Able to model discrete process
with fixed resource type
- Unable to handle dynamic agent-
based resource
© British Telecommunications plc
Demand
Resource
Resource
Utilisation
Job
Completions
Process
Bottlenecks
Process
Model
Agent
Model
Complex Service Production Management – Agent-Based Process Model
New solutions- Anylogic as agent-based process
modelling platform
- Oracle database and APEX as data
manipulation and visualisation platform
- Better configurability and scalability,
ease of re-orgs, seamless operation
New findings- Significant cost saving opportunity from under-utilised resource
- Three worst process bottlenecks activities could be improved
by either injecting new resource or re-aligning resource by area
- The throughput of two process activities could be best
improved via increasing productivity rather than injecting new
resource

© British Telecommunications plc
Example 4: Corporate Fleet Optimisation
o Business context
o Traditional statistical approach
o Agent-based analytical approach
© British Telecommunications plc
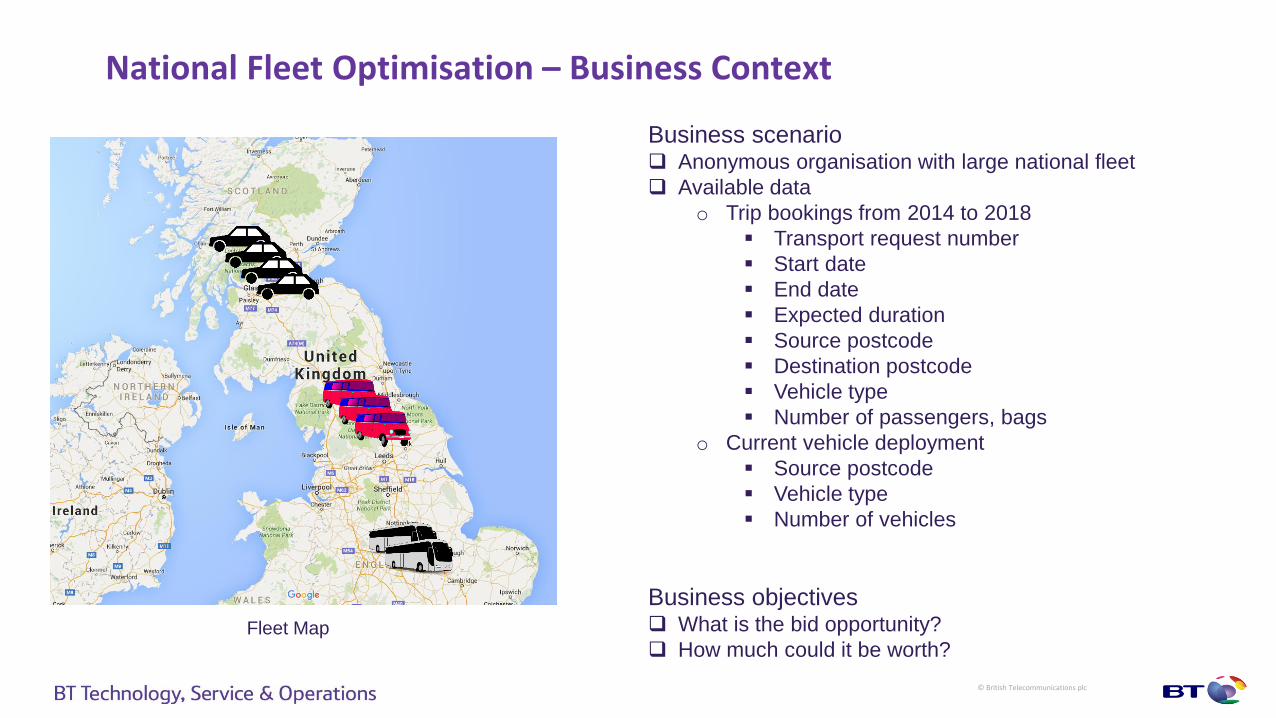
National Fleet Optimisation – Business Context
Business scenario Anonymous organisation with large national fleet
Available data
o Trip bookings from 2014 to 2018
Transport request number
Start date
End date
Expected duration
Source postcode
Destination postcode
Vehicle type
Number of passengers, bags
o Current vehicle deployment
Source postcode
Vehicle type
Number of vehicles
Fleet Map
Business objectives What is the bid opportunity?
How much could it be worth?

© British Telecommunications plc
Corporate Fleet Optimisation – Traditional Approach
Classic Analytical Result via Pure Statistical Approach
Drawback of pure statistical approach
- Coarse-grained
- Not verifiable
- Not trustable
- Not actionable
Typical questions on the analysis
- Are these genuine opportunities of
business optimisation?
- To what extent can we increase
utilisation time for these vehicles?
Need finer-grained analysis across
- Geographical dimension
- Time dimension

© British Telecommunications plc
Corporate Fleet Optimisation – Agent-Based Analytical Approach
Refined Geography
Refined Time
Optimised Vehicle Profile
National Vehicle Balance
Optimise
From local
to national
Bottom-up approach
Agent-based service analytics to
provide convincing evidence
o Verifiable
o Trustable
o Actionable
Real-time data processing,
visualisation, intelligent optimisation
Key result
Significant cost saving opportunity
from reducing under-utilised
vehicles
Accepted input to a bid project

© British Telecommunications plc
Example 5: Telecom Fault Prevention and Forecasting
o Business context
o Traditional statistical approach
o Rule-based analytical approach
© British Telecommunications plc
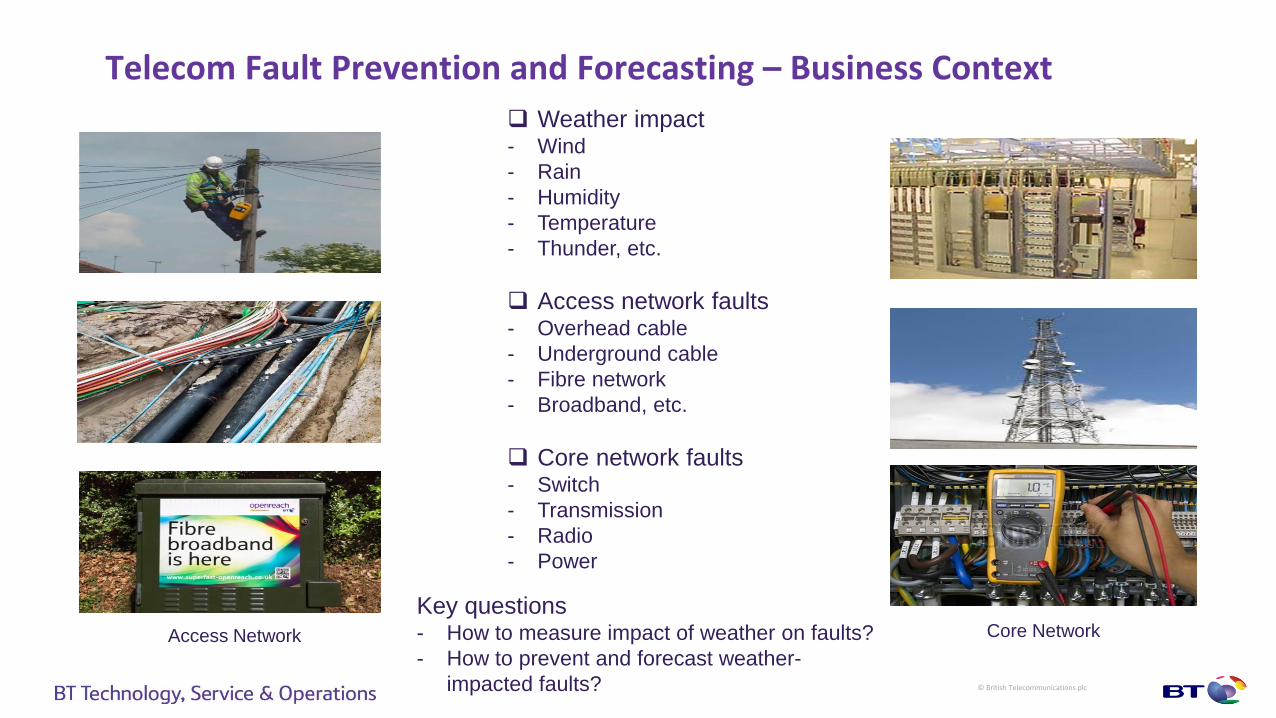
Telecom Fault Prevention and Forecasting – Business Context
Weather impact- Wind
- Rain
- Humidity
- Temperature
- Thunder, etc.
Access network faults- Overhead cable
- Underground cable
- Fibre network
- Broadband, etc.
Core network faults- Switch
- Transmission
- Radio
- Power
Key questions- How to measure impact of weather on faults?
- How to prevent and forecast weather-
impacted faults?
Access Network Core Network

© British Telecommunications plc
Telecom Fault Prevention and Forecasting – Statistics-Based Approach
Traditional regression models Explain normal weekly and
daily variation in fault counts
quite well
But difficult to
o get clear correlation
between weather and
faults
o get most extreme peaks
right
weather
faults
Because it is too broad a brush
that cannot reveal subtle details!

© British Telecommunications plc
Telecom Fault Prevention and Forecasting – Rule-Based Approach
Rule-based approach
- Identify root cause of network faults by weather
- Extract rules for both fault prevention and forecasting
Initial result
- New discovery on humidity as one of the key drivers
- Significant improvement in forecast accuracy
0
20
40
60
80
100
120
140
3-Summer Baseline Fault for CAL in Southampton
Source_Actual Avg_Actual
Rule-Based Forecasting
Seasonal Weather-Fault PatternsRoot Cause Analysis for Network Fault
Example rule: IF X in (B1, B2) during Season Y, THEN
Raise fault volume by Z% above baseline forecast
© British Telecommunications plc
Part 4: Turning Analytics into Software Applications
o Operational applications
o Strategic applications

© British Telecommunications plc
Operational Applications
(a) Operational Forecasting Dashboard
(c) Override Engine Forecast
(b) Diagnose Historical Forecast
(d) Adjust Model Parameters
General process1) Develop / enhance model in Testbed
2) Trial by business users
3) Adopt the new model in Live platform
4) Go back to 1)
Engineering attributes Transparency
Responsiveness
Scalability
Interpretability
Controllability
Agility

© British Telecommunications plc
Strategic Applications
Identify Centre of
Excellence
Complex Service Production Simulator
(c) Model Tuning for
Future Temperature
(d) Multi-Factor Fault
Volume Forecast
(a) Strategic Forecasting
Workflow
(b) Multiple Regression for
Historical data
Strategic Fault Forecasting
Optimised Vehicle ProfileNational Vehicle Balance
Strategic Vehicle Balancer
Identify Engineer
Utilisation
Engineering attributes Transparency
Responsiveness
Scalability
Interpretability
Controllability
Agility
Seamlessness
Actionability
Replacability
General process1) Develop / enhance
model in Testbed
2) Trial by business users
3) Adopt the new model
in Live platform
4) Go back to 1)
© British Telecommunications plc
Part 5: A New Curriculum on Agent-Based Service Analytics
o Comparison between current curriculum and new curriculum
o Selected papers
o Recent recognitions

© British Telecommunications plc
Comparison between Current Curriculum and New Curriculum
Mancester Business School
MSc Business AnalyticsNew Agent-Based Service Analytics R&D Advantage Examplar Tools
Draw on approach from Operational Research and Statistics Operational Research and Computer Science Service-Oriented, i.e. Individuality
Mathematical OptimisationLinear, Non-Linear, Dynamic Programming
(Excel / Solver)
Agent-Based Analysis, Simulation &
Optimisation
(Anylogic + Oracle PL/SQL/APEX)
Insightable, Actionable, Scalable
Business ForecastingMultivariate statistics
(Excel)
Rule-Based Approach
(Oracle PL/SQL/APEX)Insightable, Actionable, Scalable
Simulation and Risk AnalysisDiscrete-Event, System Dynamics
(Excel)
Agent-Based Simulation
(Anylogic + Oracle PL/SQL/APEX)Service-Oriented, i.e. Individuality
Data Analytics
Classification, Clustering, Predictive Modelling, Text
Mining, Visual Analytics
(SAS)
Integrated human intelligence / decision with
programmable machine intelligence
(Oracle PL/SQL/APEX + Java + HTML)
Flexible, Agile, Scalable, Engagable
© British Telecommunications plc
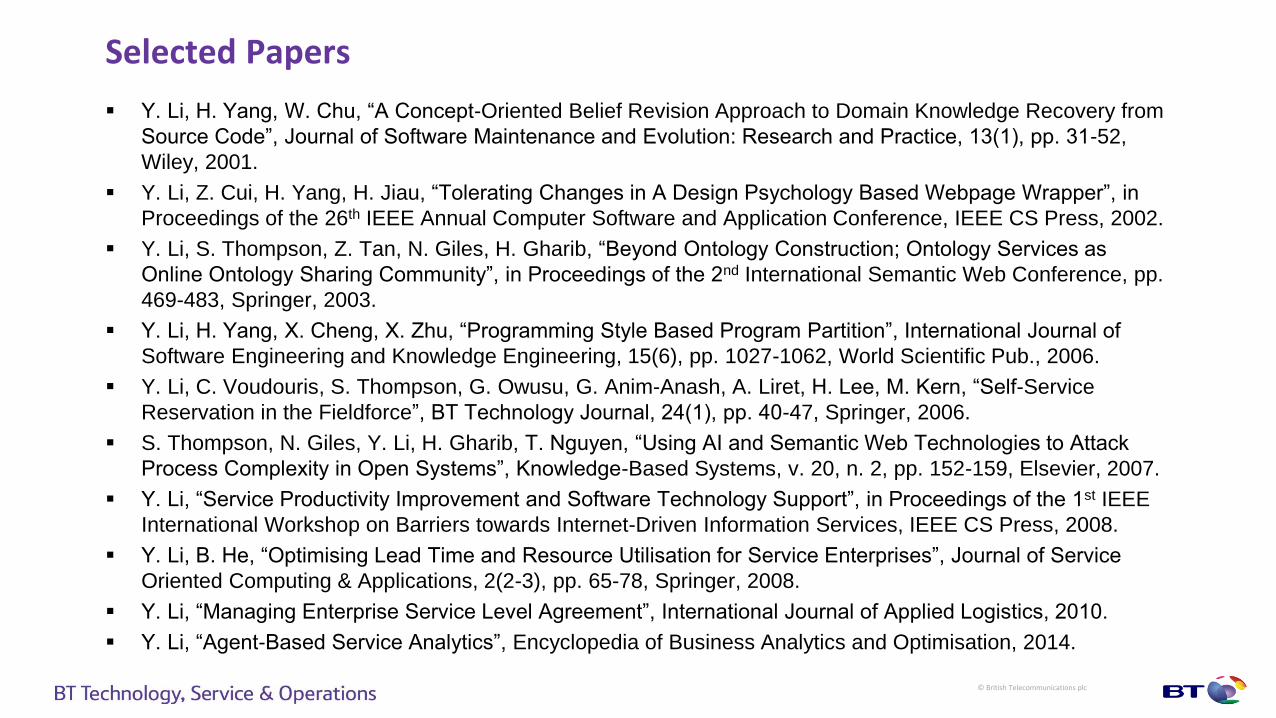
Selected Papers
Y. Li, H. Yang, W. Chu, “A Concept-Oriented Belief Revision Approach to Domain Knowledge Recovery from
Source Code”, Journal of Software Maintenance and Evolution: Research and Practice, 13(1), pp. 31-52,
Wiley, 2001.
Y. Li, Z. Cui, H. Yang, H. Jiau, “Tolerating Changes in A Design Psychology Based Webpage Wrapper”, in
Proceedings of the 26th IEEE Annual Computer Software and Application Conference, IEEE CS Press, 2002.
Y. Li, S. Thompson, Z. Tan, N. Giles, H. Gharib, “Beyond Ontology Construction; Ontology Services as
Online Ontology Sharing Community”, in Proceedings of the 2nd International Semantic Web Conference, pp.
469-483, Springer, 2003.
Y. Li, H. Yang, X. Cheng, X. Zhu, “Programming Style Based Program Partition”, International Journal of
Software Engineering and Knowledge Engineering, 15(6), pp. 1027-1062, World Scientific Pub., 2006.
Y. Li, C. Voudouris, S. Thompson, G. Owusu, G. Anim-Anash, A. Liret, H. Lee, M. Kern, “Self-Service
Reservation in the Fieldforce”, BT Technology Journal, 24(1), pp. 40-47, Springer, 2006.
S. Thompson, N. Giles, Y. Li, H. Gharib, T. Nguyen, “Using AI and Semantic Web Technologies to Attack
Process Complexity in Open Systems”, Knowledge-Based Systems, v. 20, n. 2, pp. 152-159, Elsevier, 2007.
Y. Li, “Service Productivity Improvement and Software Technology Support”, in Proceedings of the 1st IEEE
International Workshop on Barriers towards Internet-Driven Information Services, IEEE CS Press, 2008.
Y. Li, B. He, “Optimising Lead Time and Resource Utilisation for Service Enterprises”, Journal of Service
Oriented Computing & Applications, 2(2-3), pp. 65-78, Springer, 2008.
Y. Li, “Managing Enterprise Service Level Agreement”, International Journal of Applied Logistics, 2010.
Y. Li, “Agent-Based Service Analytics”, Encyclopedia of Business Analytics and Optimisation, 2014.

© British Telecommunications plc
First Paper on
Agent-Based
Service Analytics
2014
Chapter Invitation
from Executive
Editor of IGI Global
2016
USA
Recognitions
UK IT Industry
Business Analyst of The Year
UK IT Industry
Medal
Special
Commendation
2011
2013, 2016
2012
2015
European
Recognitions
2012 2015Two published books on advanced design
approaches and green service engineering
Books
Founder and Lead Chair
2008 - 2015
Workshops
Recent Recognitions

© British Telecommunications plc
Finally

© British Telecommunications plc
Summary
Service sector is continuously dominating world economy.
Existing statistics-based analytical approach is too coarse-grained to solve service problems.
A new curriculum overlapping between computer science and operational research could boost next-generation service business analysts.
Agent-based modelling and simulation could not set foot in operational research.
Agent-based service analytics was then coined and pioneered to solve a wide spectrum of real-world service analytical problems.

© British Telecommunications plc
Final Thought Are consumerism and individualism good?
https://www.theologyofwork.org
© British Telecommunications plc
Thank you
© British Telecommunications plc