agenda - d10k7k7mywg42z.cloudfront.net · market valuation report ... this compares with a decrease...
TRANSCRIPT

AGENDA

APPROVAL OF MINUTES

STAFF SUMMARY

RHODE ISLAND STATE INVESTMENT COMMISSIONSTAFF SUMMARY ANALYSIS
PORTFOLIO HIGHLIGHTSJanuary 31, 2010
PORTFOLIO PERFORMANCE
January
The ERSRI portfolio posted a 1.92% loss for the month of January, Jan-10 Calendaragainst the policy index of -2.05%. Domestic Equities lost 3.76%, inter- ERSRI Performance By Asset Class YTDnational equities were down 4.92%, and the fixed income asset class returned 1.08%. Domestic Equity -3.76% -3.76%
If we factor out PE & RE investments, due to the way they are monitored, Fixed Income 1.08% 1.08%
the plan performance was -2.12% against its -2.06% index. International Equity -4.92% -4.92%Total Fund Composite* -2.12% -2.12%
Calendar Year to Date Manager Summary Jan-10 CYTDDOMESTIC EQUITY
For the one month ending January 31, 2010, the portfolio is down 1.92% Shott 0.01% 0.01%
against the policy index of -2.05%. Domestic equities were down 3.76%, inter- PIMCO 0.00% 0.00%
national equities were down 4.92%, while fixed income generated a return of 1.08%. SSgA S&P 500 -3.59% -3.59%
Russell Overlay 0.06% 0.06%
Fiscal Year to Date Wellington Technical Eq -6.02% -6.02%
Russell 2000 Index -3.68% -3.68%
For the Fiscal Year ended June 30, 2010, the fund has gained 13.33%, Total Domestic Equity -3.76% -3.76%
against the policy index of 12.37%.FIXED INCOME
Index Performance Summary - January 31, 2010 Brown Bros TIPS 1.51% 1.51%Calendar Brown Bros Core 1.44% 1.44%
Market Indices Jan-10 YTD Fidelity 1.44% 1.44%Domestic Equity Taplin Canida & Habacht 1.53% 1.53%S & P 500 -3.60% -3.60% Fixed Income Cash Acct 0.01% 0.01%DJ Wilshire 5000 -3.60% -3.60% Mackay Shield 1.48% 1.48%Russell 2000 -3.68% -3.68%Policy Index -2.06% -2.06% Total Fixed Income 1.08% 1.08%
International Equity INTERNATIONAL EQUITYMSCI ACWI -4.88% -4.88% Total International Equity -4.92% -4.92%Fixed IncomeBC AGG 1.53% 1.53% *Total Fund Composite includes all classes ex PE & REReal Estate NCREIF 0.08% 0.08%

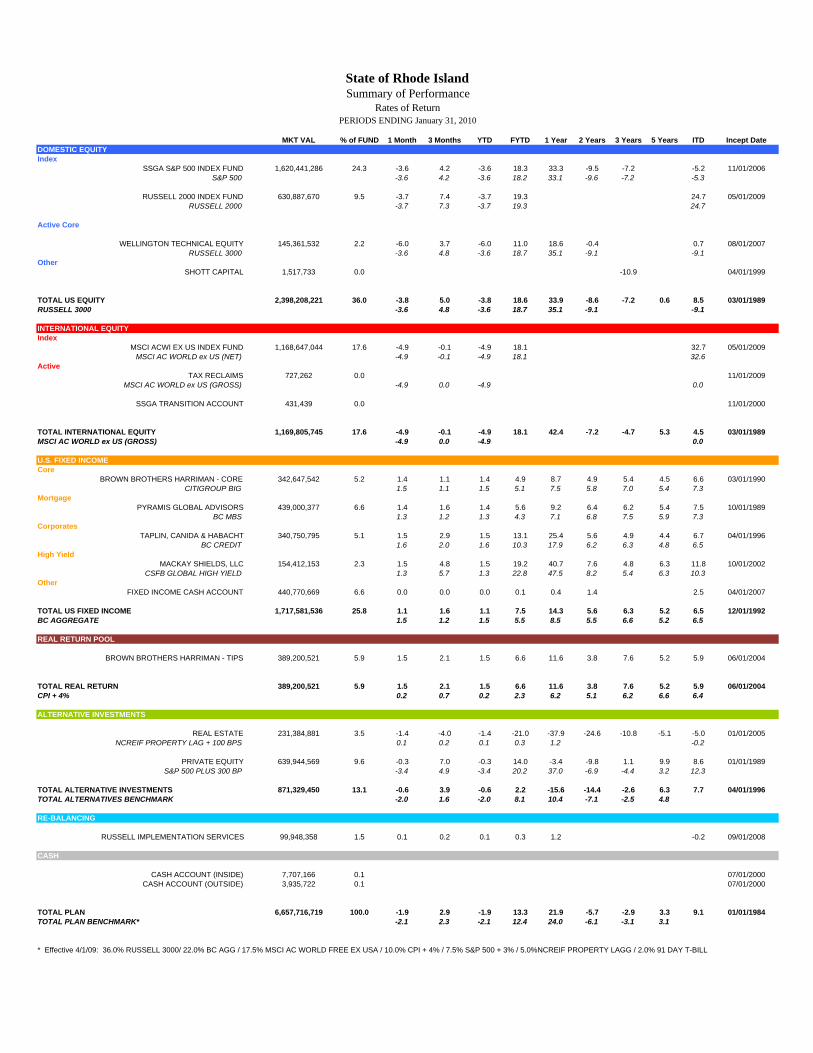
Market Valuation Report
Market Values
The total portfolio value decreased in January by $143.0 million to $6.66billion. This compares with a decrease in value of $337 million for thesame period in 2009. The Domestic Equity Market values decreased by $93.5million, including transfers in of $0.2 Million; Fixed Income increased by $7.9 millionincluding transfers out of $10.4 million; while International Values decreased by $60.8million, including transfers out of $0.03 million. The Cash Accounts decreased by $4.6
million including transfers out of $5.8 million, and Alternative Investments decreased by $2.1 million, including transfers in of $4.4 million. The Real Return Pool
increased by $5.8 million including transfers in of $0.03 million. The overlay accountincreased by $4.3 million.
December 31, 2009
February 05 - January 10
$3
$4
$5
$6
$7
$8
$9
F-05 J-05
D-05 M-06 O-06 M-07 A-07 J-08
J-08
N-08 A-09 S-09
(billi
ons)

Cash Flow
January pension payroll of $70.5 million was greater than the $60.8 million in contributions and wire transfers received by $9.7 million.To meet pension and other obligations, a transfer from long-term investments of $12.0 million was necessary.
Alternative Investments
At this time the alternative investment asset class has unfunded commitments of approximately $306.1 million oncommitments of $1,281 million.
CAPITAL CALLSNet of Distributions
January FYTD UNFUNDED2010 BALANCE
$4,261,619 $12,063,435 $306,099,881
January FYTD UNFUNDED2009 BALANCE
$604,901 $32,012,680 $388,240,822

State of Rhode IslandAsset Allocation
1/31/2010
US Equity 36%
Real Return 6%
Real Estate 3%
Private Equity 10%
Russell Implementation* 1%
Cash 7%
US Equity
International Equity
US Fixed Income
Real Return
Real Estate
Private Equity
Russell Implementation*
Cash
Value AllocationUS Equity 2,398.21 36.0%International Equity 1,169.81 17.6%US Fixed Income 1,276.81 19.2%Real Return 389.20 5.9%Real Estate 231.38 3.5%Private Equity 639.94 9.6%Russell Implementation* 99.95 1.5%Cash 452.41 6.8%
Total Fund 6,657.72 100.0%
* Difference in actual investment allocation versus target allocation policy is offset by the notional overlay provided by the Russell Implementation account.
US Equity 36%
International Equity 18%
US Fixed Income 19%
Real Return 6%
Real Estate 3%
Private Equity 10%
Russell Implementation* 1%
Cash 7%
US Equity
International Equity
US Fixed Income
Real Return
Real Estate
Private Equity
Russell Implementation*
Cash

RHODE ISLAND STATE INVESTMENT COMMISSIONSHORT TERM CASH INVESTMENTS AT:
January 31, 2010
Sovereign Bank14.02%
Federated Investors6.71%
Fidelity9.93%
BlackRock9.69%Citizens
Bank
Webster Bank29.04%
CD14%
Money Mkt26%
PIP60%
GID0%
REPO = Repurchase AgreementGID = Government Insured DepositCP = Commercial PaperCD = Certificate of DepositCoD = Collateralized DepositAgency = US Government Agency
Sovereign Bank14.02%
Federated Investors6.71%
Fidelity9.93%
BlackRock9.69%Citizens
Bank30.61%
Webster Bank29.04%
CD14%
Money Mkt26%
PIP60%
GID0%

State of Rhode IslandOffice of the General Treasurer
Short-Term Investments
Issuer Credit RatingsJan-10
Issuer Ratings S-T Debt Rating L-T Debt Rating Credit OutlookType of Month End %
Issuer Instrument Portfolio Moody's Moody's S&P Moody's S&P S&P
Bank RI 3,4 0.00% N/R N/R
JP Morgan Chase 2,3,5 0.00% Aa1 P-1 A-1+ Aa1 AA- Stable
BlackRock Inc. 6 9.69% A1 P-1 A-1 A1 A+ Negative
RBS Citizens 3,4 30.61% A2 P-1 A-2 A2 A- Negative
Federated 6 6.71% N/R N/R N/R
Fidelity 6 9.93% N/R N/R N/R
Merrill Lynch 2,5,6 0.00% A2 P-1 A-1 A2 A Negative
Morgan Stanley 1,2,5 0.00% A2 P-1 A-1 A2 A Negative
Sovereign Bank 3,4 14.02% Aa2 P-1 A-1+ Aa2 AA Negative
State Street Bank & Trust Comp 1,3 0.00% A1 P-1 A-1 A1 A+ Negative
Webster Bank 3,4 29.04% A2 P-1 A-2 BBB Negative
Wells Fargo 6 0.00% A1 P-1 A-1+ A1 AA- NegativeInstrument Codes
1 Repurchase Agreement2 Commercial Paper3 Certificate of Deposit4 Collateralized Deposit5 US Agency Discount Note6 Government Money Market
Ratings Definitions
Moody's Short-Term Debt Ratings: S&P Short-Term Credit Ratings:P-1 - Prime-1 have a superior ability for repayment of sr. S-T debt obligations A-1 - Highest rated, strong capacity to meet obligationsP-2 - Prime-1 have a strong ability for repayment of sr. S-T debt obligations A-2 - Somewhat more susceptible to adverse effects of changes in financial conditions, satisfactoryP-3 - Prime-1 have an acceptable ability for repayment of sr. S-T debt obligations A-3 - Exhibits adequate protection parametersNP - Not Prime B - Significant speculative characteristics, faces major ongoing uncertainties
C - Vulnerable to non-paymentD - Payment defaultModifiers:+ or - show relative standing within the category.
Moody's Issuer Rating Symbols:Aaa - Offer exceptional financial security (high-grade)Aa - Offer excellent financial security (high-grade)A - Offer good financial securityBaa - Offer adequate financial security S&P Outlook Definitions:Ba - Offer questionable financial security Positive - A rating may be raisedB - Offer poor financial security Negative - A rating may be loweredCaa - Offer very poor financial security Stable - A rating is not likely to changeCa - Offer extremely poor financial security Developing - May be raised or loweredC - Lowest rated class, usually in default NM - Not meaningfulModifiers:1 - Higher end of letter rating category2 - Mid-range of letter rating category3 - Lower end of letter rating category
S&P Long-Term Debt Ratings:AAA - Highest rating, extremely strongAA - Differs slightly from highest rating, very strongA - Somewhat more susceptible to adverse effects of change in economic condition, strongBBB - Exhibits adequate protection parameters
Moody's Long-Term Debt Ratings: BB, B, CCC, CC, C - Have significant speculative characteristics. BB least speculative, C highest degree.Aaa - Best Quality D - Payment defaultAa - High Quality Modifiers:A - Posess many favorable investment attributes + or - show relative standing within the category.Baa - Medium-grade obligationsBa - Posess speculative elementsB - Generally lack characteristics of desirable investmentsCaa - Poor standingCa - Speculative in a high degreeC - Lowest rated class of bondsModifiers:1 - Higher end of letter rating category2 - Mid-range of letter rating category3 - Lower end of letter rating category

PERFORMANCE

MKT VAL % of FUND 1 Month 3 Months YTD FYTD 1 Year 2 Years 3 Years 5 Years ITD Incept DateDOMESTIC EQUITYIndex
SSGA S&P 500 INDEX FUND 1,620,441,286 24.3 -3.6 4.2 -3.6 18.3 33.3 -9.5 -7.2 -5.2 11/01/2006S&P 500 -3.6 4.2 -3.6 18.2 33.1 -9.6 -7.2 -5.3
RUSSELL 2000 INDEX FUND 630,887,670 9.5 -3.7 7.4 -3.7 19.3 24.7 05/01/2009RUSSELL 2000 -3.7 7.3 -3.7 19.3 24.7
Active Core
WELLINGTON TECHNICAL EQUITY 145,361,532 2.2 -6.0 3.7 -6.0 11.0 18.6 -0.4 0.7 08/01/2007RUSSELL 3000 -3.6 4.8 -3.6 18.7 35.1 -9.1 -9.1
OtherSHOTT CAPITAL 1,517,733 0.0 -10.9 04/01/1999
TOTAL US EQUITY 2,398,208,221 36.0 -3.8 5.0 -3.8 18.6 33.9 -8.6 -7.2 0.6 8.5 03/01/1989RUSSELL 3000 -3.6 4.8 -3.6 18.7 35.1 -9.1 -9.1
INTERNATIONAL EQUITYIndex
MSCI ACWI EX US INDEX FUND 1,168,647,044 17.6 -4.9 -0.1 -4.9 18.1 32.7 05/01/2009MSCI AC WORLD ex US (NET) -4.9 -0.1 -4.9 18.1 32.6
ActiveTAX RECLAIMS 727,262 0.0 11/01/2009
MSCI AC WORLD ex US (GROSS) -4.9 0.0 -4.9 0.0
SSGA TRANSITION ACCOUNT 431,439 0.0 11/01/2000
TOTAL INTERNATIONAL EQUITY 1,169,805,745 17.6 -4.9 -0.1 -4.9 18.1 42.4 -7.2 -4.7 5.3 4.5 03/01/1989MSCI AC WORLD ex US (GROSS) -4.9 0.0 -4.9 0.0
U.S. FIXED INCOMECore
BROWN BROTHERS HARRIMAN - CORE 342,647,542 5.2 1.4 1.1 1.4 4.9 8.7 4.9 5.4 4.5 6.6 03/01/1990CITIGROUP BIG 1.5 1.1 1.5 5.1 7.5 5.8 7.0 5.4 7.3
MortgagePYRAMIS GLOBAL ADVISORS 439,000,377 6.6 1.4 1.6 1.4 5.6 9.2 6.4 6.2 5.4 7.5 10/01/1989
BC MBS 1.3 1.2 1.3 4.3 7.1 6.8 7.5 5.9 7.3Corporates
TAPLIN, CANIDA & HABACHT 340,750,795 5.1 1.5 2.9 1.5 13.1 25.4 5.6 4.9 4.4 6.7 04/01/1996BC CREDIT 1.6 2.0 1.6 10.3 17.9 6.2 6.3 4.8 6.5
High YieldMACKAY SHIELDS, LLC 154,412,153 2.3 1.5 4.8 1.5 19.2 40.7 7.6 4.8 6.3 11.8 10/01/2002
CSFB GLOBAL HIGH YIELD 1.3 5.7 1.3 22.8 47.5 8.2 5.4 6.3 10.3Other
FIXED INCOME CASH ACCOUNT 440,770,669 6.6 0.0 0.0 0.0 0.1 0.4 1.4 2.5 04/01/2007
TOTAL US FIXED INCOME 1,717,581,536 25.8 1.1 1.6 1.1 7.5 14.3 5.6 6.3 5.2 6.5 12/01/1992BC AGGREGATE 1.5 1.2 1.5 5.5 8.5 5.5 6.6 5.2 6.5
REAL RETURN POOL
BROWN BROTHERS HARRIMAN - TIPS 389,200,521 5.9 1.5 2.1 1.5 6.6 11.6 3.8 7.6 5.2 5.9 06/01/2004
TOTAL REAL RETURN 389,200,521 5.9 1.5 2.1 1.5 6.6 11.6 3.8 7.6 5.2 5.9 06/01/2004CPI + 4% 0.2 0.7 0.2 2.3 6.2 5.1 6.2 6.6 6.4
ALTERNATIVE INVESTMENTS
REAL ESTATE 231,384,881 3.5 -1.4 -4.0 -1.4 -21.0 -37.9 -24.6 -10.8 -5.1 -5.0 01/01/2005NCREIF PROPERTY LAG + 100 BPS 0.1 0.2 0.1 0.3 1.2 -0.2
PRIVATE EQUITY 639,944,569 9.6 -0.3 7.0 -0.3 14.0 -3.4 -9.8 1.1 9.9 8.6 01/01/1989S&P 500 PLUS 300 BP -3.4 4.9 -3.4 20.2 37.0 -6.9 -4.4 3.2 12.3
TOTAL ALTERNATIVE INVESTMENTS 871,329,450 13.1 -0.6 3.9 -0.6 2.2 -15.6 -14.4 -2.6 6.3 7.7 04/01/1996TOTAL ALTERNATIVES BENCHMARK -2.0 1.6 -2.0 8.1 10.4 -7.1 -2.5 4.8
RE-BALANCING
RUSSELL IMPLEMENTATION SERVICES 99,948,358 1.5 0.1 0.2 0.1 0.3 1.2 -0.2 09/01/2008
CASH
CASH ACCOUNT (INSIDE) 7,707,166 0.1 07/01/2000CASH ACCOUNT (OUTSIDE) 3,935,722 0.1 07/01/2000
TOTAL PLAN 6,657,716,719 100.0 -1.9 2.9 -1.9 13.3 21.9 -5.7 -2.9 3.3 9.1 01/01/1984TOTAL PLAN BENCHMARK* -2.1 2.3 -2.1 12.4 24.0 -6.1 -3.1 3.1
* Effective 4/1/09: 36.0% RUSSELL 3000/ 22.0% BC AGG / 17.5% MSCI AC WORLD FREE EX USA / 10.0% CPI + 4% / 7.5% S&P 500 + 3% / 5.0%NCREIF PROPERTY LAGG / 2.0% 91 DAY T-BILL
State of Rhode IslandSummary of Performance
PERIODS ENDING January 31, 2010Rates of Return

MKT VAL % of FUND 6 YEARS 7 YEARS 8 YEARS 9 YEARS 10 YEARS ITD Incept DateDOMESTIC EQUITYIndex
SSGA S&P 500 INDEX FUND 1,620,441 24.3 -5.2 11/1/2006S&P 500 1.2 5.4 1.3 -0.8 -0.8
RUSSELL 2000 INDEX FUND 630,888 9.5 24.7 5/1/2009RUSSELL 2000 1.9 8.5 4.1 3.3 3.3
Active Core
WELLINGTON TECHNICAL EQUITY 145,362 2.2 0.7 8/1/2007S&P 500 1.2 5.4 1.3 -0.8 -0.8
OtherSHOTT CAPITAL 1,518 0.0 4/1/1999
TOTAL US EQUITY 2,398,208 36.0 1.6 6.7 2.6 0.2 -0.8 8.5 3/1/1989RUSSELL 3000 1.6 6.0 2.0 -0.2 -0.2
INTERNATIONAL EQUITYIndex
MSCI ACWI EX US INDEX FUND 1,168,647 17.6 32.7 5/1/2009MSCI EAFE (NET) 5.1 10.2 6.7 2.5 1.4
ActiveTAX RECLAIMS 727 0.0 11/1/2009
MSCI AC WORLD ex US (GROSS) 7.5 12.6 8.9 4.6 3.2
SSGA TRANSITION ACCOUNT 431 0.0 11/1/2000
TOTAL INTERNATIONAL EQUITY 1,169,806 17.6 7.1 11.6 7.7 3.5 1.8 4.5 3/1/1989MSCI AC WORLD ex US (GROSS) 7.5 12.6 8.9 4.6 3.2
U.S. FIXED INCOMECore
BROWN BROTHERS HARRIMAN - CORE 342,648 5.2 4.5 4.9 5.5 5.7 6.5 6.6 3/1/1990CITIGROUP BIG 5.2 5.2 5.7 5.9 6.7
MortgagePYRAMIS GLOBAL ADVISORS 439,000 6.6 5.3 5.3 5.7 5.9 6.7 7.5 10/1/1989
BC MBS 5.7 5.4 5.7 5.9 6.7 1/0/1900Corporates
TAPLIN, CANIDA & HABACHT 340,751 5.1 4.6 6.0 6.0 6.2 6.8 6.7 4/1/1996BC CREDIT 4.9 5.4 5.9 6.2 6.8
High YieldMACKAY SHIELDS, LLC 154,412 2.3 6.9 10.5 11.8 10/1/2002
CSFB GLOBAL HIGH YIELD 6.8 9.5 8.9 8.0 7.3 Other
FIXED INCOME CASH ACCOUNT 440,771 6.6 2.5 4/1/2007
TOTAL US FIXED INCOME 1,717,582 25.8 5.3 6.0 6.1 5.9 6.6 6.5 12/1/1992BC AGGREGATE 5.0 5.0 5.5 5.8 6.5
REAL RETURN POOL
BROWN BROTHERS HARRIMAN - TIPS 389,201 5.9 5.9 6/1/2004BC U.S. TIPS 5.3 5.8 7.1 7.1 7.8
TOTAL REAL RETURN 389,201 5.9 5.9CPI + 4% 6.7 6.6 6.6 6.4 6.6
ALTERNATIVE INVESTMENTS
REAL ESTATE 231,385 3.5 -5.0 1/1/2005NCREIF PROPERTY INDEX QTR LAG 7.2 7.3 7.1 7.4 7.8
PRIVATE EQUITY 639,945 9.6 11.2 10.9 9.0 6.0 7.3 8.6 1/1/1989S&P 500 PLUS 300 BP 4.2 8.4 4.5 2.4 2.5
TOTAL ALTERNATIVE INVESTMENTS 871,329 13.1 8.1 8.3 6.6 4.4 5.0 7.7 4/1/1996TOTAL ALTERNATIVES BENCHMARK 5.8 8.3 5.9 4.8
RE-BALANCING
RUSSELL IMPLEMENTATION SERVICES 99,948 1.5 -0.2 9/1/2008
CASH
CASH ACCOUNT (INSIDE) 7,707 0.1CASH ACCOUNT (OUTSIDE) 3,936 0.1
TOTAL PLAN 6,657,717 100.0 4.3 7.9 5.2 3.2 2.6 9.1 1/1/1984TOTAL PLAN BENCHMARK 4.0 7.5 4.9 3.0 2.7
* Effective 4/1/09: 36.0% RUSSELL 3000/ 22.0% BC AGG / 17.5% MSCI AC WORLD FREE EX USA / 10.0% CPI + 4% / 7.5% S&P 500 + 3% / 5.0%NCREIF PROPERTY LAGG / 2.0% 91 DAY T-BILL
State of Rhode IslandSummary of Performance
Rates of ReturnPERIODS ENDING January 31, 2010

STATE OF RHODE ISLANDTOTAL PLAN POOL ATTRIBUTION
1 Year Period: January 31, 2009 - January 31, 2010Value Added
1 YEAR RETURNS VALUE ADDED ATTRIBUTION
(1.50)
(1.00)
(0.50)
0.00
0.50
1.00
1.50
2.00
2.50 Weighting Selection
21.94 24.04
Difference(2.10)
(20.00)
(10.00)
0.00
10.00
20.00
30.00
Portfolio Benchmark Difference Portfolio Benchmark Difference Weighting Selection Timing
TOTAL US EQUITY 36.30 42.50 (6.20) 33.89 35.05 (1.16) (0.59) (0.26)
TOTAL INTERNATIONAL EQUITY 16.30 20.00 (3.70) 42.42 48.28 (5.86) (0.47) (0.68)
TOTAL US FIXED INCOME* 28.70 25.00 3.70 14.33 8.51 5.82 (0.27) 1.57
RUSSELL IMPLEMENTATION SERVICES 1.10 0.00 1.10 1.19 34.92 (33.73) 1.40 (0.77)
REAL ESTATE 6.10 5.00 1.10 (37.89) (22.11) (15.78) 0.40 (1.02)
PRIVATE EQUITY 10.90 7.50 3.40 (3.37) 37.04 (40.41) 1.38 (3.66)TOTAL CASH 0.50 0.00 0.50 0.36 0.22 0.14 (0.07) 0.02TOTAL PLAN 100 100 (0.10) 21.94 24.04 (2.10) 1.77 (4.78) 1.45
* For the purpose of this TPPA analysis, the TIPS allocation is included in the Fixed Income asset class.
Beginning Weights Returns Value Added
(1.50)
(1.00)
(0.50)
0.00
0.50
1.00
1.50
2.00
2.50 Weighting Selection
21.94 24.04
Difference(2.10)
(40.00)
(30.00)
(20.00)
(10.00)
0.00
10.00
20.00
30.00

January 31, 2010
Benchmark Market Value Transfers Market Value Market ValuePerformance Benchmark Alpha Description Performance Benchmark Alpha 12/31/2009 In/(out) 1/31/2010 Increase/decrease
Domestic Equity Shott Capital Management IRR 0.01% -3.60% 3.61% S & P 500 0.01% -3.60% 3.61% 1,517,563 - 1,517,733 170 SSgA S&P 500 -3.59% -3.60% 0.01% S & P 500 -3.59% -3.60% 0.01% 1,680,618,735 147,232 1,620,441,286 (60,324,681) Wellington Tech Eq -6.02% -3.60% -2.42% Russell 3000 -6.02% -3.60% -2.42% 154,665,245 13,264 145,361,532 (9,316,977) Russell 2000 Index Fund -3.68% -3.68% Russell 2000 -3.68% -3.68% 0.00% 654,923,272 54,131 630,887,670 (24,089,733)
Total Domestic Equity -3.76% -3.60% -0.16% -3.76% -3.60% -0.16% 2,491,724,815 214,627 2,398,208,221 (93,731,221)
International Equity Boston Company -4.88% MSCI ACWI -4.88% 392,773 (135,370) 253,715 (3,688)
Goldman Sachs -4.88% MSCI ACWI -4.88% 392,823 (175,402) 215,621 (1,799)
Transition Account N/A N/A N/A N/A N/A N/A N/A 439,252 - 431,439 (7,813)
Mondrian -4.88% MSCI ACWI -4.88% 438,866 (178,446) 257,926 (2,494)
MSCI Ex US Index Fund -4.92% -4.88% MSCI Ex US Index Fund -4.92% -4.88% -0.04% 1,228,974,561 236,577 1,168,647,044 (60,564,094)
Total International Equity -4.92% -4.88% -0.04% -4.92% -4.88% -0.04% 1,230,638,274 (252,641) 1,169,805,745 (60,579,889)
Fidelity Management & Research 1.44% 1.33% 0.11% BC MBS 1.44% 1.33% 0.11% 432,748,880 39,047 439,000,377 6,212,451
Brown Brothers, Harriman 1.44% 1.46% -0.02% Citigroup BIG 1.44% 1.46% -0.02% 337,745,911 30,616 342,647,542 4,871,015
Taplin, Canida & Habacht 1.53% 1.55% -0.02% BC Credit 1.53% 1.55% -0.02% 335,598,334 29,995 340,750,795 5,122,466
Mackay Shields 1.48% 1.27% 0.21% CS First BosHiYield 1.48% 1.27% 0.21% 152,291,421 13,326 154,412,153 2,107,406
Fixed Income Cash Acct 0.01% 0.01% 0.00% 0.01% 0.01% 0.00% 451,281,175 (10,510,782) 440,770,669 276
Total Fixed Income 1.08% 1.53% -0.45% 1.08% 1.53% -0.45% 1,709,665,721 (10,397,798) 1,717,581,536 18,313,613
Alternative InvestmentsPrivate Equity -0.28% -3.35% 3.07% N/A -0.28% -3.35% 3.07% 638,669,018 4,261,619 639,944,569 (2,986,068)
Real Estate -1.43% 0.08% -1.51% NCREIF + 100 -1.43% 0.08% -1.51% 234,788,045 101,090 231,384,881 (3,504,254)
Total Alternatives -0.59% -2.01% 1.42% -0.59% -2.01% 1.42% 873,457,063 4,362,709 871,329,450 (6,490,322)
Cash AccountsCash in Trust 0.01% 0.01% 0.00% 0.01% 0.01% 0.00% 13,567,868 (5,791,839) 7,707,166 (68,863)
Cash Outside Trust 0.00% 0.01% -0.01% 0.00% 0.01% -0.01% 2,644,397 - 3,935,722 1,291,325
Total Cash 0.01% 0.01% 0.00% 0.01% 0.01% 0.00% 16,212,266 (5,791,839) 11,642,888 1,222,461
Real Return PoolBrown Bros TIPS 1.51% 0.15% 1.36% CPI +4% 1.51% 0.15% 1.36% 383,363,369 34,941 389,200,521 5,802,210
OtherRussell Overlay 0.06% 0.06% 95,668,822 - 99,948,358 4,279,536
Total Plan Ex PE & RE -2.12% -2.06% -0.06% -2.12% -2.06% -0.06% 6,800,730,330 (11,830,000) 6,657,716,719 (131,183,611) Total Plan -1.92% -2.05% 0.13% -1.92% -2.05% 0.13% *Policy Index: (Effective 04/1/09) 36% Russell 3000 Effective 11/1/09 Moved TIPS from Fixed Income to Real Return. The history remains in Fixed Income.22% BC Agg
17.5% MSCI World Free Ex USA
10% CPI + 4%
7.5% S&P 500 + 3%
Current Month
ERSRI Monthly Market Value Report With Time Weighted Returns
Valuation Change
Calendar YTD
Geo's sic report2/18/2010
1

State of Rhode IslandRATES OF RETURN - TotalPeriods Ending January 31, 2010
PERFORMANCE SUMMARY REPORT1 Month Return Calendar YTD Return
Fund Index Excess Fund Index ExcessBenchmark Value (000)Net Flow
(000)
Provided by State Street Investment AnalyticsPage 7
U.S. EQUITYSSGA S&P 500 INDEX FUND S&P 500 -3.59 -3.60 0.01 -3.59 -3.60 0.01 1,620,441 147SHOTT CAPITAL S&P 500 0.01 -3.60 3.61 0.01 -3.60 3.61 1,518 0WELLINGTON TECHNICAL EQUITY RUSSELL 3000 -6.02 -3.60 -2.42 -6.02 -3.60 -2.42 145,362 13RUSSELL 2000 INDEX FUND RUSSELL 2000 -3.68 -3.68 0.00 -3.68 -3.68 0.00 630,888 54
TOTAL US EQUITY RUSSELL 3000 -3.76 -3.60 -0.16 -3.76 -3.60 -0.16 2,398,208 215
INTERNATIONAL EQUITYTHE BOSTON COMPANY MSCI AC WORLD ex US (GROSS) -4.88 -4.88 254 -135GOLDMAN SACHS MSCI AC WORLD ex US (GROSS) -4.88 -4.88 216 -175MONDRIAN MSCI AC WORLD ex US (GROSS) -4.88 -4.88 258 -178MSCI ACWI EX US INDEX FUND MSCI AC WORLD ex US (NET) -4.92 -4.89 -0.03 -4.92 -4.89 -0.03 1,168,647 107
TOTAL INTERNATIONAL EQUITY MSCI AC WORLD ex US (GROSS) -4.92 -4.88 -0.04 -4.92 -4.88 -0.04 1,169,806 -382
U.S. FIXED INCOMEPYRAMIS GLOBAL ADVISORS BC MBS 1.44 1.33 0.11 1.44 1.33 0.11 439,000 39BROWN BROTHERS HARRIMAN - CORE CITIGROUP BIG 1.44 1.46 -0.02 1.44 1.46 -0.02 342,648 31TAPLIN, CANIDA & HABACHT BC CREDIT 1.53 1.55 -0.02 1.53 1.55 -0.02 340,751 30MACKAY SHIELDS, LLC CSFB GLOBAL HIGH YIELD 1.48 1.27 0.21 1.48 1.27 0.21 154,412 -136FIXED INCOME CASH ACCOUNT 91 DAY T-BILL 0.01 0.01 0.00 0.01 0.01 0.00 440,771 -10,561
TOTAL US FIXED INCOME BC AGGREGATE 1.08 1.53 -0.45 1.08 1.53 -0.45 1,717,582 -10,597

State of Rhode IslandRATES OF RETURN - TotalPeriods Ending January 31, 2010
PERFORMANCE SUMMARY REPORT1 Month Return Calendar YTD Return
Fund Index Excess Fund Index ExcessBenchmark Value (000)Net Flow
(000)
Provided by State Street Investment AnalyticsPage 8
ALTERNATIVE INVESTMENTSPRIVATE EQUITY S&P 500 PLUS 300 BP -0.28 -3.35 3.07 -0.28 -3.35 3.07 639,945 3,088REAL ESTATE NCREIF PROPERTY LAG + 100 BPS -1.43 0.08 -1.51 -1.43 0.08 -1.51 231,385 -50
TOTAL ALTERNATIVE INVESTMENTS TOTAL ALTERNATIVES BENCHMARK -0.59 -2.01 1.42 -0.59 -2.01 1.42 871,329 3,039
CASH EQUIVALENTSCASH ACCOUNT (INSIDE) 91 DAY T-BILL 0.01 0.01 0.00 0.01 0.01 0.00 7,707 -5,863CASH ACCOUNT (OUTSIDE) 91 DAY T-BILL 0.00 0.01 -0.01 0.00 0.01 -0.01 3,936 1,291
TOTAL CASH 91 DAY T-BILL 0.01 0.01 0.00 0.01 0.01 0.00 11,643 -4,572
OTHERRUSSELL IMPLEMENTATION SERVICES 0.06 0.06 99,948 0
TOTAL PLANTOTAL PLAN TOTAL PLAN BENCHMARK -1.92 -2.05 0.13 -1.92 -2.05 0.13 6,657,717 -12,263TOTAL PLAN ex PE RE TOTAL PLAN BENCHMARK ex PE RE -2.12 -2.06 -0.06 -2.12 -2.06 -0.06 5,786,387 -15,301
REAL RETURN POOLBROWN BROTHERS HARRIMAN - TIPS CPI + 4% 1.51 0.15 1.36 1.51 0.15 1.36 389,201 351

State of Rhode IslandTOTAL PLAN
CUMULATIVE PERFORMANCE REPORT
PERIODS: January 31, 2007 - January 31, 2010Index: TOTAL PLAN BENCHMARK
Provided by State Street Investment AnalyticsPage 1

1 Month 1 Qtr 2 Qtrs 3 Qtrs 1 Yr 3 Yrs 5 Yrs 7 Yrs 10 Yrs
5th Percentile 2.86 5.39 18.63 35.74 24.92 3.19 5.43 8.45 5.08
25th Percentile 1.63 3.75 15.77 29.48 19.46 -1.43 3.61 7.26 3.57
50th Percentile 1.27 3.60 14.58 23.86 15.72 -1.89 3.26 6.79 3.29
75th Percentile 1.09 3.13 12.31 21.09 12.09 -2.51 2.76 6.14 2.84
95th Percentile -0.69 1.05 8.03 14.13 6.09 -4.09 1.17 5.04 2.43
No. of Obs 31 31 31 31 30 26 27 27 26
� TOTAL PLAN 1.30 47 3.59 51 15.56 29 28.56 29 17.95 42 -1.96 56 3.42 36 7.92 11 2.84 78
� TOTAL PLAN BENCHMAR1 1.07 81 3.29 70 14.70 47 28.73 29 18.95 28 -2.06 64 3.19 53 7.56 17 2.55 92
State of Rhode IslandPUBLIC FUNDS (DB) > $1 BILLION (SSC)PERIOD ENDING December 31, 2009
TOTAL RETURN
Page 1Provided by State Street Investment Analytics
-8%
-3%
2%
7%
12%
17%
22%
27%
32%
37%
����
��
��
��
��
��
��
��

1 Month 1 Qtr 2 Qtrs 3 Qtrs 1 Yr 3 Yrs 5 Yrs 7 Yrs 10 Yrs
5th Percentile 3.84 5.54 27.63 64.14 43.16 -0.77 8.06 13.61 5.88
25th Percentile 2.98 4.15 24.82 58.49 39.79 -3.25 6.47 12.35 4.24
50th Percentile 2.33 3.65 24.18 55.04 38.35 -3.97 4.92 11.38 3.65
75th Percentile 2.01 3.35 23.02 52.47 33.45 -6.13 4.06 9.50 1.27
95th Percentile 0.07 0.34 20.65 46.51 26.64 -7.20 3.83 9.30 0.24
No. of Obs 14 14 14 14 14 14 12 12 11
� TOTAL INTERNATIONAL 2.16 58 3.81 43 24.17 51 55.49 48 36.55 68 -3.01 20 6.15 33 11.56 48 2.27 67
� MSCI AC WORLD ex US (G 2.13 60 3.79 45 24.30 46 59.03 24 42.14 8 -3.04 20 6.30 32 12.84 21 3.11 61
State of Rhode IslandINTL EQUITY POOLS - PUBLIC FUNDS (SSC)PERIOD ENDING December 31, 2009
TOTAL RETURN
Page 9Provided by State Street Investment Analytics
-14%
-3%
8%
19%
30%
41%
52%
63%
�� ��
��
��
��
��
����
��

1 Month 1 Qtr 2 Qtrs 3 Qtrs 1 Yr 3 Yrs 5 Yrs 7 Yrs 10 Yrs
5th Percentile 2.57 5.51 21.06 41.26 26.16 7.11 5.72 7.04 7.80
25th Percentile -0.13 2.33 12.15 23.62 22.30 6.93 5.65 6.25 7.32
50th Percentile -0.75 1.72 9.11 15.93 14.97 6.01 5.40 5.84 6.67
75th Percentile -1.42 0.60 6.08 10.49 12.07 5.87 5.08 5.16 6.47
95th Percentile -3.59 -2.34 2.91 4.92 1.25 2.56 3.16 3.74 4.78
No. of Obs 15 14 14 14 13 12 12 13 12
� TOTAL US FIXED INCOM -0.38 38 1.28 61 6.34 67 11.25 67 14.32 58 5.94 62 5.07 77 5.87 43 6.47 62
� BC AGGREGATE -1.56 81 0.20 84 3.95 90 5.81 92 5.93 90 6.04 40 4.97 80 4.75 88 6.33 86
State of Rhode IslandUS FIXED INC POOL PUBLIC GT 1 BILL (SSC)PERIOD ENDING December 31, 2009
TOTAL RETURN
Page 13Provided by State Street Investment Analytics
-8%
-2%
4%
10%
16%
22%
28%
34%
40%
����
��
�
�
�
� �� �� ����

1 Month 1 Qtr 2 Qtrs 3 Qtrs 1 Yr 3 Yrs 5 Yrs 7 Yrs 10 Yrs
5th Percentile 3.69 7.93 24.87 51.31 37.37 -4.47 1.98 9.17 2.66
25th Percentile 3.26 6.17 23.87 46.54 32.45 -4.85 1.10 6.63 0.60
50th Percentile 2.99 5.92 23.15 43.93 29.74 -5.38 0.78 6.08 0.01
75th Percentile 2.70 5.59 22.62 43.09 28.21 -5.80 0.32 5.50 -0.50
95th Percentile 1.90 4.64 21.97 40.61 26.47 -7.04 0.03 5.26 -2.91
No. of Obs 23 23 23 22 23 22 21 18 19
� TOTAL US EQUITY 3.63 9 5.68 71 23.27 42 43.99 48 28.61 67 -5.44 57 0.77 51 6.94 11 -0.41 71
� WILSHIRE 5000 2.70 75 5.78 59 22.83 65 43.45 59 28.30 73 -5.25 35 0.93 38 6.47 30 -0.27 66
State of Rhode IslandUS EQUITY POOLS PUBLIC GT 1BILL (SSC)PERIOD ENDING December 31, 2009
TOTAL RETURN
Page 7Provided by State Street Investment Analytics
-12%
-3%
6%
15%
24%
33%
42%
51%
����
��
��
��
��
��
��
��

State of Rhode IslandTOTAL PLAN
RISK VS. RETURN
January 31, 2005 - January 31, 2010Benchmark: TOTAL PLAN BENCHMARK
Provided by State Street Investment AnalyticsPage 1
RISK INFORMATION RISK STATISTICS
Portfolio ReturnBenchmark ReturnReturn DifferencesPortfolio Standard DeviationBenchmark StandardTracking Error
Historic BetaR-squaredJensen's AlphaSharpe RatioTreynor RatioInformation Ratio
0.913.323.060.26
11.2112.181.84
0.980.270.030.360.14

ASSET ALLOCATION

State of Rhode IslandAsset Allocation
1/31/2010
US Equity36.0%Real Estate
3.5%
Private Equity9.6%
Russell 1.5%
Cash6.8%
Physical Allocation
US Equity36.8%Real Return
5.9%
Real Estate3.5%
Private Equity9.6%
Russell
0.0%Cash4.5%
Notional Allocation
US Equity36.0%Real Return
10.0%
Real Estate5.0%
Private Equity7.5%
Russell 0.0%
Cash2.0%
Policy Allocation
* Difference in actual investment allocation versus target allocation policy is offset by the notional overlay provided by the Russell Implementation account.
US Equity36.0%
International Equity17.6%
US Fixed Income19.2%
Real Return5.8%
Real Estate3.5%
Private Equity9.6%
Russell 1.5%
Cash6.8%
Physical Allocation
US Equity36.8%
International Equity17.1%
US Fixed Income22.7%
Real Return5.9%
Real Estate3.5%
Private Equity9.6%
Russell
0.0%Cash4.5%
Notional Allocation
US Equity36.0%
International Equity17.5%
US Fixed Income22.0%
Real Return10.0%
Real Estate5.0%
Private Equity7.5%
Russell 0.0%
Cash2.0%
Policy Allocation

Asset Allocation1/31/2010
State of Rhode Island
0.02% 0.07%
‐2.82%
‐4.15%
‐1.52%
2.11%1.50%
4.80%
0.82%
‐0.43%
0.68%
‐4.15%
‐1.52%
2.11%
0.00%
2.49%
US Equity International Equity US Fixed Income Real Return Real Estate Private Equity Russell Implementation*
Cash
Deviations from Target Allocation
Physical Difference Overlay Difference
US Equity 36.0% 36.8% 36.0% 0.02% 0.82%International Equity 17.6% 17.1% 17.5% 0.07% ‐0.43%US Fixed Income 19.2% 22.7% 22.0% ‐2.82% 0.68%Real Return 5.9% 5.9% 10.0% ‐4.15% ‐4.15%Real Estate 3.5% 3.5% 5.0% ‐1.52% ‐1.52%Private Equity 9.6% 9.6% 7.5% 2.11% 2.11%Russell Implementation 1.5% 0.0% 1.50% 0.00%Cash 6.8% 4.5% 2.0% 4.80% 2.49%
100.0% 100.0% 100.0%
* Difference in actual investment allocation versus target allocation policy is offset by the notional overlay provided by the Russell Implementation account.
Overlay Difference
Physical Difference
PolicyNotional Allocation
Physical Allocation*
0.02% 0.07%
‐2.82%
‐4.15%
‐1.52%
2.11%1.50%
4.80%
0.82%
‐0.43%
0.68%
‐4.15%
‐1.52%
2.11%
0.00%
2.49%
US Equity International Equity US Fixed Income Real Return Real Estate Private Equity Russell Implementation*
Cash
Deviations from Target Allocation
Physical Difference Overlay Difference

Domestic EquitySSGA S&P 500 INDEX FUND 1,620.44 24.34%WELLINGTON TECHNICAL EQUITY 145.36 2.18%SHOTT CAPITAL 1.52 0.02%RUSSELL 2000 INDEX FUND 630.89 9.48%
TOTAL DOMESTIC EQUITY 2,398.21 36.02%International Equity
MSCI ACWI EX US INDEX FUND 1,168.65 17.55%TAX RECLAIMS 0.73 0.01%SSGA TRANSITION ACCOUNT 0.43 0.01%
TOTAL INT'L EQUITY 1,169.81 17.57%Domestic Fixed Income
BROWN BROTHERS HARRIMAN - CORE 342.65 5.15%PYRAMIS GLOBAL ADVISORS 439.00 6.59%MACKAY SHIELDS, LLC 154.41 2.32%TAPLIN, CANIDA & HABACHT 340.75 5.12%
TOTAL FIXED-INCOME 1,276.81 19.18%Alternative Investments
Real Estate 231.38 3.48%Pacific Corp Group 639.94 9.61%
TOTAL ALTERNATIVE INVESTMENTS 871.33 13.09%Real Return Pool
BROWN BROTHERS HARRIMAN - TIPS 389.20 5.85%
TOTAL REAL RETURN POOL 389.20 5.85%Cash
CASH EQUIVALENTS 11.64 0.17%FIXED INCOME CASH ACCOUNT 440.77 6.62%
Other Russell Implementation Services 99.95 1.50%
TOTAL ASSETS 6,657.72 100.00%
STIF, Yield+
Mortgages
TIPS
31-Jan-10
High YieldCorporates
Real EstatePrivate Equity
Passive
Actual
PassivePassive
STIF, Yield+
ClosedClosed
Opportunistic Core
Enhanced EquityTactical Equity
Style Mandate
ASSET ALLOCATION REPORT
(Millions $)

Historical Asset AllocationState of Rhode Island
January 31, 2010
US Equity US Equity
International Equity International Equity
US Fixed Income US Fixed Income
US Fixed Income
US Fixed Income US Fixed Income
Real Return
Real Return Real ReturnReal Return
Real Return
Real Estate
Real Estate Real EstateReal Estate
Real Estate
Private Equity
Private Equity Private Equity Private Equity Private Equity
Cash
Cash Cash Cash Cash
Russell Implementation* Russell Implementation* Russell Implementation* Russell Implementation* Russell Implementation*
30%
40%
50%
60%
70%
80%
90%
100%
Target Current 1 Yr Ago 3 Yrs Ago 5 Yrs Ago
US Equity 36.0% 36.0% 36.3% 43.5% 45.0%International Equity 17.5% 17.6% 16.3% 23.8% 24.2%US Fixed Income 22.0% 19.2% 28.7% 23.3% 24.9%Real Return 10.0% 5.9% 0.0% 0.0% 0.0%Real Estate 5.0% 3.5% 6.1% 3.1% 0.0%Private Equity 7.5% 9.6% 10.9% 5.7% 5.1%Russell Implementation* 0.0% 1.5% 1.1% 0.0% 0.0%Cash 2.0% 6.8% 0.5% 0.5% 0.7%Total Plan 100.0% 100.0% 100.0% 100.0% 100.0%
US Equity US EquityUS Equity
US Equity US Equity
International Equity International Equity
US Fixed Income US Fixed Income
US Fixed Income
US Fixed Income US Fixed Income
Real Return
Real Return Real ReturnReal Return
Real Return
Real Estate
Real Estate Real EstateReal Estate
Real Estate
Private Equity
Private Equity Private Equity Private Equity Private Equity
Cash
Cash Cash Cash Cash
Russell Implementation* Russell Implementation* Russell Implementation* Russell Implementation* Russell Implementation*
0%
10%
20%
30%
40%
50%
60%
70%
80%
90%
100%
Target Current 1 Yr Ago 3 Yrs Ago 5 Yrs Ago

State of Rhode IslandMANAGER ALLOCATION ANALYSIS
CURRENT MANAGER ALLOCATION
PERIOD ENDING 01/31/2010
Provided by State Street Investment AnalyticsPage 3
CURRENTPERIOD
ONE YEARAGO ALLOC. FUND
RUSSELL 2000 INDEX FUND 630.9 26.3
SSGA S&P 500 INDEX FUND 1,620.4 988.8 67.6
PIMCO 299.8 0.0
WELLINGTON MANAGEMENT 224.5 0.0
NORTHPOINTE CAPITAL 226.5 0.0
SSGA - CORE 221.7 0.0
SHOTT CAPITAL 1.5 1.2 0.1
WELLINGTON TECHNICAL 145.4 123.3 6.1
2,085.9 100.0TOTAL

State of Rhode IslandMANAGER ALLOCATION ANALYSIS
CURRENT MANAGER ALLOCATION
PERIOD ENDING 01/31/2010
Provided by State Street Investment AnalyticsPage 4
CURRENTPERIOD
ONE YEARAGO ALLOC. FUND
1 BROWN BROTHERS 389.2 464.8 18.5
PYRAMIS GLOBAL ADVISORS 439.0 481.7 20.8
FIXED INCOME CASH 440.8 3.1 20.9
TAPLIN, CANIDA & HABACHT 340.8 272.1 16.2
BROWN BROTHERS 342.6 315.5 16.3
MACKAY SHIELDS, LLC 154.4 110.0 7.3
2,106.8 1,647.1 100.0TOTAL

State of Rhode IslandMANAGER ALLOCATION ANALYSIS
CURRENT MANAGER ALLOCATION
PERIOD ENDING 01/31/2010
Provided by State Street Investment AnalyticsPage 6
CURRENTPERIOD
ONE YEARAGO ALLOC. FUND
MSCI ACWI EX US INDEX 1,168.6 99.9
GOLDMAN SACHS 0.2 287.5 0.0
MONDRIAN 0.3 319.7 0.0
THE BOSTON COMPANY 0.3 329.1 0.0
1,169.4 936.4 100.0TOTAL

CASH FLOW
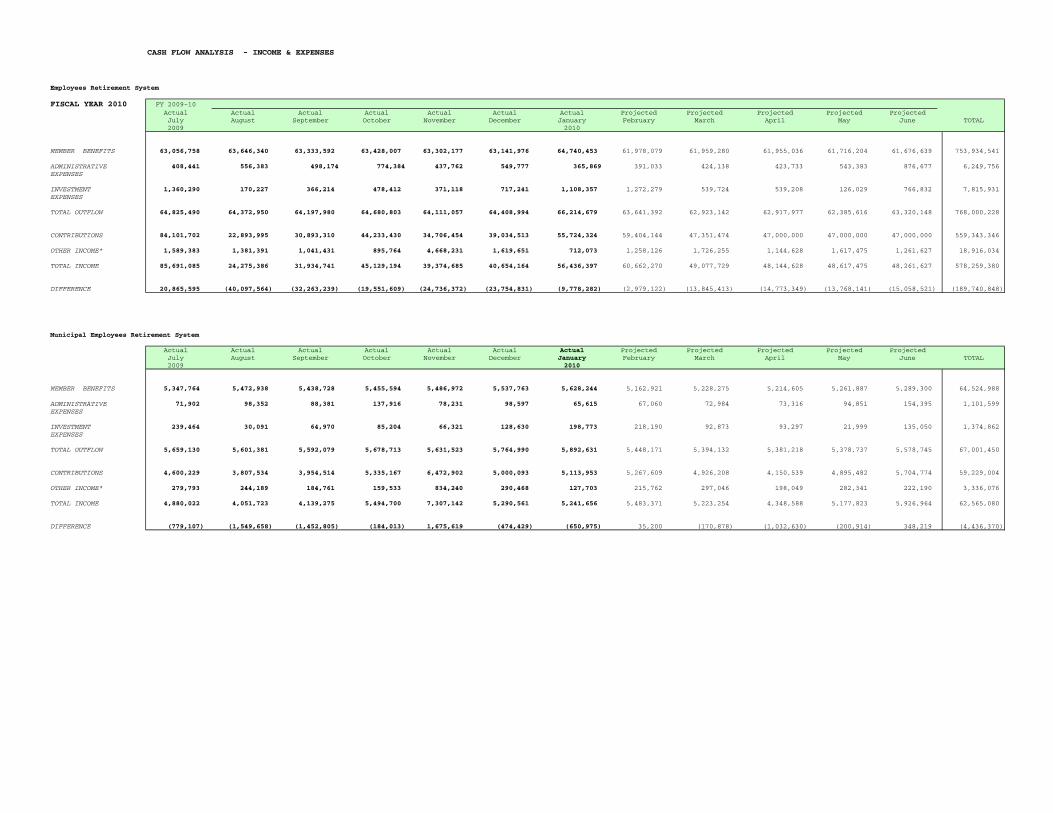
CASH FLOW ANALYSIS - INCOME & EXPENSES
Employees Retirement System
FISCAL YEAR 2010 FY 2009-10Actual Actual Actual Actual Actual Actual Actual Projected Projected Projected Projected ProjectedJuly August September October November December January February March April May June TOTAL2009 2010
MEMBER BENEFITS 63,056,758 63,646,340 63,333,592 63,428,007 63,302,177 63,141,976 64,740,453 61,978,079 61,959,280 61,955,036 61,716,204 61,676,639 753,934,541
ADMINISTRATIVE 408,441 556,383 498,174 774,384 437,762 549,777 365,869 391,033 424,138 423,733 543,383 876,677 6,249,756EXPENSES
INVESTMENT 1,360,290 170,227 366,214 478,412 371,118 717,241 1,108,357 1,272,279 539,724 539,208 126,029 766,832 7,815,931EXPENSES
TOTAL OUTFLOW 64,825,490 64,372,950 64,197,980 64,680,803 64,111,057 64,408,994 66,214,679 63,641,392 62,923,142 62,917,977 62,385,616 63,320,148 768,000,228
CONTRIBUTIONS 84,101,702 22,893,995 30,893,310 44,233,430 34,706,454 39,034,513 55,724,324 59,404,144 47,351,474 47,000,000 47,000,000 47,000,000 559,343,346
OTHER INCOME* 1,589,383 1,381,391 1,041,431 895,764 4,668,231 1,619,651 712,073 1,258,126 1,726,255 1,144,628 1,617,475 1,261,627 18,916,034
TOTAL INCOME 85,691,085 24,275,386 31,934,741 45,129,194 39,374,685 40,654,164 56,436,397 60,662,270 49,077,729 48,144,628 48,617,475 48,261,627 578,259,380
DIFFERENCE 20,865,595 (40,097,564) (32,263,239) (19,551,609) (24,736,372) (23,754,831) (9,778,282) (2,979,122) (13,845,413) (14,773,349) (13,768,141) (15,058,521) (189,740,848)
Municipal Employees Retirement System
Actual Actual Actual Actual Actual Actual Actual Projected Projected Projected Projected ProjectedJuly August September October November December January February March April May June TOTAL2009 2010
MEMBER BENEFITS 5,347,764 5,472,938 5,438,728 5,455,594 5,486,972 5,537,763 5,628,244 5,162,921 5,228,275 5,214,605 5,261,887 5,289,300 64,524,988
ADMINISTRATIVE 71,902 98,352 88,381 137,916 78,231 98,597 65,615 67,060 72,984 73,316 94,851 154,395 1,101,599EXPENSES
INVESTMENT 239,464 30,091 64,970 85,204 66,321 128,630 198,773 218,190 92,873 93,297 21,999 135,050 1,374,862EXPENSES
TOTAL OUTFLOW 5,659,130 5,601,381 5,592,079 5,678,713 5,631,523 5,764,990 5,892,631 5,448,171 5,394,132 5,381,218 5,378,737 5,578,745 67,001,450
CONTRIBUTIONS 4,600,229 3,807,534 3,954,514 5,335,167 6,472,902 5,000,093 5,113,953 5,267,609 4,926,208 4,150,539 4,895,482 5,704,774 59,229,004
OTHER INCOME* 279,793 244,189 184,761 159,533 834,240 290,468 127,703 215,762 297,046 198,049 282,341 222,190 3,336,076
TOTAL INCOME 4,880,022 4,051,723 4,139,275 5,494,700 7,307,142 5,290,561 5,241,656 5,483,371 5,223,254 4,348,588 5,177,823 5,926,964 62,565,080
DIFFERENCE (779,107) (1,549,658) (1,452,805) (184,013) 1,675,619 (474,429) (650,975) 35,200 (170,878) (1,032,630) (200,914) 348,219 (4,436,370)

CASH FLOW ANALYSIS - INCOME & EXPENSES
Judges/State PoliceRetirement System Actual Actual Actual Actual Actual Actual Actual Projected Projected Projected Projected Projected
July August September October November December January February March April May June TOTAL2009 2010
MEMBER BENEFITS 106,501 106,501 106,501 106,501 106,501 106,501 108,032 106,978 106,709 106,501 106,501 106,501 1,280,228
ADMINISTRATIVE 5,874 8,196 7,421 11,646 6,673 8,451 5,624 5,375 5,891 5,963 7,733 12,598 91,446EXPENSES
INVESTMENT 19,564 2,508 5,455 7,195 5,657 11,025 17,038 17,489 7,496 7,588 1,794 11,020 113,829EXPENSES
TOTAL OUTFLOW 131,940 117,205 119,377 125,342 118,831 125,978 130,693 129,843 120,095 120,052 116,028 130,119 1,485,503
CONTRIBUTIONS 1,580,000 437,000 427,000 685,000 422,000 470,000 467,000 420,000 430,000 420,000 420,000 420,000 6,598,000
OTHER INCOME* 22,859 20,349 15,513 13,472 71,161 24,897 10,946 17,295 23,975 16,108 23,018 18,130 277,722
TOTAL INCOME 1,602,859 457,349 442,513 698,472 493,161 494,897 477,946 437,295 453,975 436,108 443,018 438,130 6,875,722
DIFFERENCE 1,470,919 340,145 323,136 573,129 374,329 368,920 347,253 307,452 333,879 316,056 326,990 308,011 5,390,220
*includes income from Real Estate Investments, Private Equity, Securities Lending, and Cash Accounts,

FISCAL YEAR 2010 INVESTMENT MANAGER FEES, PROFESSIONAL FEES & OPERATING EXPENSES
ERSRI & MERSRI ACCRUAL BASIS
Actual Actual Actual Actual Actual Projected Projected Projected Projected Projected Projected Projected ProjectedJul 09 Aug Sept Oct Nov Dec Jan 09 Feb 09 Mar 09 Apr 09 May 09 June 10 TOTAL
EQUITIES
SSgA Russell 1000/S&P 5ZU14 0 100,000 165,213 100,000 365,213SSGA Russell 2000 ZU06 0 0 0 17,388 Shott Capital ZU49 421 5 460 2,718 3,604Wellington Tech Eq ZU04 348,739 292,948 276,882 296,937 1,215,505
349,160 392,952 442,555 417,043 1,584,322
FIXED INCOME Brown Bros. ZU69 105,055 142,889 130,550 152,252 530,746 Fidelity ZU46 143,712 156,534 148,748 140,949 589,943 Taplin ZU84 199,476 210,205 168,847 179,763 758,291 Mackay Shields ZU59 149,724 128,557 120,255 147,848 546,384 Brown Bros.TIPS ZU44 155,959 145,060 149,697 113,544 564,260
753,926 783,245 718,096 734,357 2,989,624
INT'L EQUITIES
The Boston Co ZU77 0 0 0 0 0 Mondrian ZU67 32,787 0 0 0 32,787 Goldman Sachs Asset MgmZU25 0 0 0 0 0 SSgA MSCI ACWI ZU08 129,145 130,000 130,000 130,000 519,145
0 161,932 0 130,000 130,000 130,000 551,932
REAL ESTATE 0
L & B Real Estate ZU79 178,749 77,105 94,424 161,810 0 87,590 1,173,526 159,603 238,864 241,734 0 256,830 2,670,236 ALTERNATIVE INVESTMENTS Other Alt Inv Mgmt FeesZU32 1,440,569 125,721 342,215 409,000 443,096 769,307 150,640 146,891 544,404 289,778 149,822 656,072 5,467,515
SUB TOTAL-INV MGMT FEES 1,619,318 202,826 1,701,657 570,810 443,096 2,163,094 1,324,167 306,494 2,073,919 531,511 149,822 2,194,302 13,263,628
PROFESSIONAL FEES
Legal 1,539 1,808 675 1,013 639 828 6,000 250 1,304 2,664 6,206 2,453 25,377 St St Bank Custodial 6,092 11,314 5,672 2,588 2,943 21,394 22,161 16,884 18,164 18,940 21,875 12,861 160,888 Pacific Corp Group ZU76 93,750 0 0 93,750 0 0 93,750 0 64,410 93,750 439,410 PCA/Wilshsire/Russell 14,583 14,583 14,583 14,583 63,246 13,125 14,583 14,583 115,328 14,583 14,583 14,583 322,948 Townsend 0 0 35,625 0 0 35,625 0 0 35,625 0 35,625 142,500
22,214 121,455 56,555 18,184 160,578 70,972 42,744 125,467 170,421 100,597 42,664 159,273 1,091,123OPERATING EXPENSE Retirement Transfers 450,000 530,255 480,567 665,657 492,580 467,833 388,964 443,340 715,596 513,836 687,929 858,260 6,694,818 Other Expense 0 6,250 11,650 0 6,250 6,250 5,400 22,425 6,250 0 6,250 17,050 87,775
450,000 536,505 492,217 665,657 498,830 474,083 394,364 465,765 721,846 513,836 694,179 875,310 6,782,593
TOTAL: 2,091,532 860,786 2,250,429 1,254,651 1,102,504 2,708,148 1,761,275 897,726 2,966,186 1,145,945 886,665 3,228,885 21,137,345
Note: Numbers in bold are actual. -2- EXPENS09

State of Rhode Island Alternative Investment Unfunded CommittmentJanuary 2010
Partnership Investment Total Commitment ERSRIRemaining
Commitment
Alta BioPhama Partners III 15,000,000.00$ 2,250,000$ Alta Partners VIII 15,000,000.00$ 6,750,000.00$ Apollo Investment Fund IV 15,000,000.00$ 32,445.00$ Apollo Investment Fund VI 20,000,000.00$ 3,481,639.62$ Apollo VII 25,000,000.00$ 19,098,821.00$ Aurora Equity Partners II** 15,000,000.00$ 38,917.00$ Aurora Equity Partners III** 15,000,000.00$ 602,507.00$ Avenue Special Situations Fund III 15,000,000.00$ -$ Avenue Special Situations Fund IV 20,000,000.00$ -$ Avenue V 20,000,000.00$ -$ Bain X 25,000,000.00$ 17,625,000.00$ Birch Hill Equity Partners III* 16,817,400.00$ 1,202,459.31$ Blackstone Capital Partners III ** 20,000,000.00$ 924,045.00$ Blackstone Capital Partners IV ** 25,000,000.00$ 2,435,595.00$ Blackstone Capital Partners V** 20,000,000.00$ 3,530,292.04$ Castile III 5,000,000.00$ 2,025,000.00$ Catterton Partners V 15,000,000.00$ 513,013.00$ Catterton Partners VI 15,000,000.00$ 4,807,018.00$ Centerbridge 15,000,000.00$ 3,646,206.00$ Charterhouse Capital Partners VIII* 20,794,500.00$ 4,400,177.47$ Coller International Capital IV** 15,000,000.00$ 2,100,000.00$ Coller International Capital V 15,000,000.00$ 6,787,500.00$ Constellation III 15,000,000.00$ 8,243,971.27$ CVC European Equity Partners lll 20,000,000.00$ 899,966.29$ CVC European Equity Partners IV* 22,873,950.00$ 2,976,500.66$ CVC 5 27,726,000.00$ 22,365,392.06$ Fenway Partners Capital Fund II 15,000,000.00$ 348,826.00$ Fenway III 15,000,000.00$ 4,254,793.00$ First Reserve Fund X 20,000,000.00$ 1.63$ First Reserve Fund XI 20,000,000.00$ 4,816,913.29$ Focus Ventures III 15,000,000.00$ 3,975,000.00$ Granite Global Ventures II 15,000,000.00$ 675,000.00$ Granite Global Ventures III 15,000,000.00$ 6,000,000.00$ Green Equity Investors IV 15,000,000.00$ 356,765.63$ Green Equity Investors V 20,000,000.00$ 13,529,316.44$ Harvest Partners III 15,000,000.00$ 364,023.61$ Kayne Anderson Energy Fund III 15,000,000.00$ 2,237,545.10$ Kayne Anderson Energy Fund IV 15,000,000.00$ 7,350,000.53$ Leapfrog Ventures II 10,000,000.00$ 2,505,000.00$ Leeds Weld Equity Partners IV 10,000,000.00$ 75,360.41$ Lighthouse Capital Partners V 11,250,000.00$ 787,500.00$ Lighthouse Capital Partners VI 15,000,000.00$ 3,374,999.99$ LNK Partners 12,500,000.00$ 6,510,169.51$
2/17/2010 S:\SIC_Books\FY10_February2010\Backup Feb 2010\jan10unfundedaltsic

State of Rhode Island Alternative Investment Unfunded CommittmentJanuary 2010
Partnership Investment Total Commitment ERSRIRemaining
Commitment
Matlin Patterson Glb. Opp. Fund (CSFB) 15,000,000.00$ -$ MHR Institutional Partners III 20,000,000.00$ 7,477,953.00$ Nautic Partners V 20,000,000.00$ 842,506.02$ Nautic Partners VI 20,000,000.00$ 13,013,741.31$ Nordic Capital Fund III* 10,828,720.00$ 176,519.65$ Nordic Capital Fund V* 20,261,536.97$ 0.10$ Nordic Capital Fund VI* 20,794,500.00$ 433,397.05$ Nordic VII 20,794,500.00$ 15,063,473.60$ OCM Opportunities Fund II 12,000,000.00$ -$ OCM Principal Opportunities Fund 5,000,000.00$ -$ Palladin III 10,000,000.00$ 6,110,701.00$ Parthenon Investors 15,000,000.00$ -$ Parthenon Investors ll 20,000,000.00$ 1,754,706.00$ Perseus VII 15,000,000.00$ 4,146,950.00$ Point 406 10,000,000.00$ 4,610,000.00$ Point Judith II 5,000,000.00$ 2,504,490.12$ Providence Equity Partners III 15,000,000.00$ 1,935,458.51$ Providence Equity Partners IV 25,000,000.00$ 1,757,780.79$ Providence Equity Partners V 25,000,000.00$ 2,316,091.00$ Providence Equity Partners VI 25,000,000.00$ 12,155,321.00$ SKM Equity Fund II** 10,000,000.00$ 1,735,947.00$ Thomas McNerney & Partners 15,000,000.00$ 1,687,500.00$ Thomas McNerney & Partners 2 15,000,000.00$ 7,912,500.00$ TPG Partners II 10,000,000.00$ 308,515.00$ TPG Partners IV 15,000,000.00$ 1,210,207.00$ TPG Partners V 20,000,000.00$ 4,813,924.00$ TPG VI 20,000,000.00$ 17,132,303.00$ Trilantic 11,098,351.00$ 6,176,933.54$ VS&A Communication Partners III 15,000,000.00$ 7,978.00$ W Capital Partners 15,000,000.00$ 1,143,000.00$ W Capital Partners II 15,000,000.00$ 7,697,172.00$
Washington & Congress Capital Partners** 15,000,000.00$ 305,637.24$ Wellspring Capital Partners III 20,000,000.00$ 120,955.00$ Wellspring Capital Partners IV 20,000,000.00$ 3,478,440.00$ Willis Stein & Partners 5,000,000.00$ -$ WLR 8,000,000.00$ 4,172,099.00$
Total Alternative Investments 1,280,739,457.97$ 306,099,880.79$
*transactions occur in foreign currence** fees NOT affecting unfunded commitment
2/17/2010 S:\SIC_Books\FY10_February2010\Backup Feb 2010\jan10unfundedaltsic

State of Rhode Island Real Estate Investment Unfunded CommittmentJanuary 2010
F
Real Estate Partnership InvestmentERSRI Remaining
Commitment
AEW 35,000,000.00$ 31,500,000.00$ Fillmore East Fund I 10,000,000.00$ -$ Fremont Strategic Property Partners II 15,000,000.00$ 1,873,108.00$ GMAC Commerical Realty Partners II 15,000,000.00$ 2,155,117.00$ Heitman Advisory Corporation -$ JPMorgan Fleming Asset Mgmt. Strat. Prop. 50,000,000.00$ -$ JPMorgan Alternative Property Fund 20,000,000.00$ -$ LaSalle Income & Growth Fund IV 15,000,000.00$ 397,937.57$ L&B Real Estate Counsel -$ Magna Hotel 4,000,000.00$ 2,709,898.00$ Morgan Stanley Prime Property Fund 35,000,000.00$ -$ Prudential Real Esate Investors (PRISA) 50,000,000.00$ -$ Prudential Real Esate Investors (PRISA) II 15,000,000.00$ 1,530,000.00$ RREEF America REIT II Fund 35,000,000.00$ -$ Starwood Hospitality Fund I 10,000,000.00$ -$ TA Realty Fund VIII 15,000,000.00$ -$ Tri Continential Fund VII 15,000,000.00$ 428,467.00$ Walton Street Real Estate Fund V 20,000,000.00$ -$ Westbrook Real Estate Fund VI*** 16,401,663.00$ 79,399.00$ Westbrook Real Estate Fund VII 15,000,000.00$ 2,636,362.40$ ***-adjusted to reflect required reserve amount
390,401,663.00$ 43,310,288.97$

SHORT TERM INVESTMENTS

RI SIC GUIDELINE COMPLIANCE REPORT
INVESTMENTS AS OF:
REPO = Repurchase AgreementCP = Commercial PaperGID = Government Insured DepositCD = Certificate of DepositCoD = Collateralized DepositAgency = US Government Agency
Vendor CP CD Agency Money Mkt PIP Repo GID Total ($)Guidelines-Total/Vendor 25%/10% 50%/20% 75%/35% 75%/35% 75%/35% 100%/20% 75%/35%Bank RI 0 0 0 0 0 0 0 0
0% 0% 0% 0% 0% 0% 0% 0.00%
January 31, 2010
CD14%
Money Mkt26%
PIP60%
GID0%
Sovereign Bank14.02%
Federated Investors6.71%
Fidelity9.93%
BlackRock9.69%Citizens Bank
30.61%
Webster Bank29.04%
0% 0% 0% 0% 0% 0% 0% 0.00%Sovereign Bank 0 48,644,323 0 0 0 0 0 48,644,323
0% 14% 0% 0% 0% 0% 0% 14.02%JP Morgan Chase 0 0 0 0 0 0 0 0
0% 0% 0% 0% 0% 0% 0% 0.00%Federated Investors 0 0 0 23,267,483 0 0 0 23,267,483
0% 0% 0% 7% 0% 0% 0% 6.71%Fidelity 0 0 0 34,466,895 0 0 0 34,466,895
0% 0% 0% 10% 0% 0% 0% 9.93%BlackRock 0 0 0 33,630,528 0 0 0 33,630,528
0% 0% 0% 10% 0% 0% 0% 9.69%Wells Fargo 0 0 0 0 0 0 0 0
0% 0% 0% 0% 0% 0% 0% 0.00%Citizens Bank 0 0 0 0 106,201,674 0 0 106,201,674
0% 0% 0% 0% 31% 0% 0% 30.61%Webster Bank 0 0 0 0 100,752,349 0 0 100,752,349
0% 0% 0% 0% 29% 0% 0% 29.04%Columbia Funds 0 0 0 0 0 0 0 0
0% 0% 0% 0% 0% 0% 0% 0.00%Washington Trust 0 0 0 0 0 0 0 0
0% 0% 0% 0% 0% 0% 0% 0.00%TOTALS - 48,644,323.09 - 91,364,906.32 206,954,022.63 - - 346,963,252
(%) PORTFOLIO 0.00% 14.02% 0.00% 26.33% 59.65% 0.00% 0.00% 100.00%
Note: PIP + CD must be under 75%. 73.67%Note: Maximum participation by any one vendor limited to 35% of total portfolio.
Acutal PIP + CD:
CD14%
Money Mkt26%
PIP60%
GID0%
Sovereign Bank14.02%
Federated Investors6.71%
Fidelity9.93%
BlackRock9.69%Citizens Bank
30.61%
Webster Bank29.04%

Fund Name Beginning Balance Ending Balance Earnings Yield(Annual)
GENERAL FUND 99,083,413.76$ 150,380,250.55$ 99,425.91$ 0.6962%H.A.V.A 293.51$ 293.57$ 0.06$ 0.2407%PENSION C PAYROLL AGENERAL FUND (HIST PRES) 534,383.05$ 534,864.74$ 239.74$ 0.5282%HIGHWAY FUND 7,009,427.68$ 10,550,861.36$ 1,466.80$ 0.2147%T.D.I. RESERVE (DET) 110,457,296.43$ 100,078,623.07$ 24,310.65$ 0.2726%EMPLOYER PENSION CONTRIBUTION ‐$ ‐$ ‐$ RICAP GL FUND 21 216,550.17$ 216,642.42$ 92.26$ 0.2420%BOND CAPITAL FUND 1,109,799.31$ 1,205,017.81$ 218.61$ 0.4119%R.I. CLEAN WATER ACT 243,566.47$ 243,616.53$ 50.06$ 0.2420%STATE LOTTERY FUND 37,687,497.44$ 34,540,631.98$ 3,506.46$ 0.1410%ASSESSED FRINGE BEN ADM 2,201,088.10$ 2,401,567.02$ 478.92$ 0.2420%AUTO EQUIPMENT SERVICE 604,911.57$ 705,062.42$ 150.84$ 0.2420%HEALTH INSURANCE FUND 23,879,268.73$ 25,280,600.24$ 1,384.24$ 0.0629%FLEET REVOLVING LOAN FUND 5,374,252.52$ 2,475,993.51$ 1,818.38$ 0.5802%EMPLOYEES RETIREMENT 789,809.46$ 1,692,023.64$ 2,217.18$ 0.1707%MUNICIPAL EMPLOYEES RET. 402,689.53$ 153,165.88$ 478.90$ 0.2822%RETIREE HEALTH FUND 7,897,503.90$ 8,299,176.19$ 1,672.30$ 0.2420%BOG RETIREE FUND 559,998.97$ 560,114.07$ 115.09$ 0.2420%RIPTA HEALTH FUND 5,069.40$ 105,146.69$ 77.29$ 0.2420%PERMANENT SCHOOL FUND 1,426,348.01$ 1,426,641.18$ 293.17$ 0.2420%TEACHER RETIREE HEALTH FUND 54,806.79$ 1,455,092.55$ 285.77$ 0.2420%UNIVERSITY COLLEGE 16,935.59$ 16,960.29$ 24.69$ 0.2419%HIGHER EDUCATION 603,330.47$ 1,503,494.26$ 163.80$ 0.2420%INDUS. BLDG. & MTG. INS. 3,136,767.35$ 3,137,412.07$ 644.72$ 0.2420%
Operating Funds Totals 303,295,008.21$ 346,963,252.04$ 139,115.84$ 0.572%
CLEAN WATER CCDL 1998B ‐$ ‐$ ‐$ CLEAN WATER CCDL 1994 (A) 6,047.31$ 6,045.56$ 0.19$ 0.0370%CAP DEV. OF 1997 SERIES A 11,166.43$ 11,163.20$ 0.34$ 0.0359%CLEAN WATER CCDL 2002 B ‐$ ‐$ ‐$ CLEAN WATER 2004 SERIES A 647,518.83$ 647,330.37$ 19.59$ 0.0356%CLN WATER CCDL 2005 SER E 51,692.81$ 51,675.97$ 1.56$ 0.0355%CAP DEV. OF 1997 SERIES A ‐$ ‐$ ‐$ RI POLLUT. CONT 94 SER. A ‐$ ‐$ ‐$ CCDL99A 1999A 278,095.07$ 278,014.13$ 8.40$ 0.0356%POL. CTRL CCDL 2006 SER C 232,530.24$ 232,463.06$ 7.03$ 0.0356%CLEAN WATER 2007 SERIES A 499,373.25$ 499,228.82$ 15.10$ 0.0356%RI POLLUTION CONTROL 2008 B 699,221.12$ 699,019.10$ 21.16$ 0.0356%G.O. NOTE 1991 SER. B 3,791.71$ 3,783.48$ 0.11$ 0.0342%BOND CCDL 1994 SERIES A 174,178.93$ 173,798.90$ 5.27$ 0.0357%BOND CCBL96A 257,760.13$ 256,493.99$ 7.77$ 0.0356%CAP DEV OF 1997 SERIES A 345.09$ 344.33$ 0.02$ 0.0683%CCDL 1998B 1,749,682.67$ 1,745,731.04$ 52.89$ 0.0356%MMG099 1999 2,846.04$ 2,839.85$ 0.08$ 0.0331%BOND CAPITOL CCDL2000A 951,314.69$ 948,930.06$ 28.76$ 0.0356%MULTI‐MODAL GEN OBL 2000 2,817.73$ 2,811.60$ 0.08$ 0.0335%CCDL 2004 SERIES A 7,088,894.86$ 7,068,548.21$ 214.21$ 0.0356%BOND CCDL 2005 SERIES C 16,041,608.81$ 16,006,495.59$ 484.89$ 0.0356%BOND CCDL 2005 SERIES E 2,425,653.54$ 2,420,165.95$ 73.32$ 0.0356%BOND CCDL 2006 SERIES B 22,645.93$ 22,596.73$ 0.69$ 0.0359%BOND CCDL 2006 SERIES C 6,404,943.63$ 6,343,642.60$ 192.95$ 0.0356%GO BND‐NTAX 2007 SERIES A 704,979.70$ 595,829.97$ 19.82$ 0.0350%GO BND‐TAX 2007 SERIES B 4,005,882.62$ 3,997,088.88$ 121.08$ 0.0356%NON‐TAX GO BND 2008 SERIES B 13,548,327.01$ 11,542,752.65$ 400.42$ 0.0355%TAXABLE GO BND 2008 SERIES C 8,498,300.63$ 8,495,845.25$ 257.10$ 0.0356%
Bond Proceeds Fund Totals 42,262,991.14$ 62,052,639.29$ 1,932.83$ 0.036%
TANS PROCEEDS 161,841,481.66$ 161,942,769.50$ 105,634.04$ 0.7685%
Grand Totals 345,557,999.35$ 409,015,891.33$ 141,048.67$ 0.481%
State of Rhode IslandShort Term Cash Monthly Performance
Performance for January 01, 2010 to January 31, 2010

$346,428,388
$100 000 000
$150,000,000
$200,000,000
$250,000,000
$300,000,000
$350,000,000
$400,000,000
Short‐Term InvestmentsMaturity Schedule
$346,428,388
$534,865 $0 $0 $0$0
$50,000,000
$100,000,000
$150,000,000
$200,000,000
$250,000,000
$300,000,000
$350,000,000
$400,000,000
Under 30 Days 31‐60 Days 61‐90 Days 91‐120 Days Over 120 Days
Short‐Term InvestmentsMaturity Schedule

SPECIAL FUNDS

Fund Name Gain/Loss Total Market Value
Abraham Touro Fund (69,204)$ 1,849,738$ ( Fidelity Balanced Fund)
Totals (69,204)$ 1,849,738$
January 31, 2010INVESTMENT SUMMARYABRAHAM TOURO FUND