agenda finance and audit committee - nerc.com and audit... · agenda finance and audit committee...
TRANSCRIPT

Agenda Finance and Audit Committee October 31, 2012 | 11:00 a.m.-12:30 p.m. Eastern Conference Call Dial-in: 800-403-7802 No Code Needed Introductions and Chair’s Remarks NERC Antitrust Compliance Guidelines and Public Announcement Agenda
1. Minutes* — Approve
a. August 15, 2012 meeting
2. FERC Action on 2013 NERC and Regional Entity Business Plans and Budgets ― Update
3. Third Quarter (unaudited) Statement of Activities and Year-end Forecasts (NERC and Regional Entities)* ― Review and Recommendation to Board of Trustees
4. Three-Year Financial Performance Review* – Budget to Actual for NERC and Regional Entities ― Review
5. Auditor Request For Proposal* ― Update
6. 2014 Business Plan and Budget Schedule*― Review
a. ERO Scope of Activities Input Group — Status Report
7. Exercise of Option for Atlanta Office Space* ― Review and Make Recommendation to Board of Trustees
8. Migration of Remaining IT Applications from Princeton* ― Update
*Background materials included.
Antitrust Compliance Guidelines I. General It is NERC’s policy and practice to obey the antitrust laws and to avoid all conduct that unreasonably restrains competition. This policy requires the avoidance of any conduct that violates, or that might appear to violate, the antitrust laws. Among other things, the antitrust laws forbid any agreement between or among competitors regarding prices, availability of service, product design, terms of sale, division of markets, allocation of customers or any other activity that unreasonably restrains competition. It is the responsibility of every NERC participant and employee who may in any way affect NERC’s compliance with the antitrust laws to carry out this commitment. Antitrust laws are complex and subject to court interpretation that can vary over time and from one court to another. The purpose of these guidelines is to alert NERC participants and employees to potential antitrust problems and to set forth policies to be followed with respect to activities that may involve antitrust considerations. In some instances, the NERC policy contained in these guidelines is stricter than the applicable antitrust laws. Any NERC participant or employee who is uncertain about the legal ramifications of a particular course of conduct or who has doubts or concerns about whether NERC’s antitrust compliance policy is implicated in any situation should consult NERC’s General Counsel immediately. II. Prohibited Activities Participants in NERC activities (including those of its committees and subgroups) should refrain from the following when acting in their capacity as participants in NERC activities (e.g., at NERC meetings, conference calls and in informal discussions):
• Discussions involving pricing information, especially margin (profit) and internal cost information and participants’ expectations as to their future prices or internal costs.
• Discussions of a participant’s marketing strategies.
• Discussions regarding how customers and geographical areas are to be divided among competitors.
• Discussions concerning the exclusion of competitors from markets.
• Discussions concerning boycotting or group refusals to deal with competitors, vendors or suppliers.
NERC Antitrust Compliance Guidelines 2
• Any other matters that do not clearly fall within these guidelines should be reviewed with NERC’s General Counsel before being discussed.
III. Activities That Are Permitted From time to time decisions or actions of NERC (including those of its committees and subgroups) may have a negative impact on particular entities and thus in that sense adversely impact competition. Decisions and actions by NERC (including its committees and subgroups) should only be undertaken for the purpose of promoting and maintaining the reliability and adequacy of the bulk power system. If you do not have a legitimate purpose consistent with this objective for discussing a matter, please refrain from discussing the matter during NERC meetings and in other NERC-related communications. You should also ensure that NERC procedures, including those set forth in NERC’s Certificate of Incorporation, Bylaws, and Rules of Procedure are followed in conducting NERC business. In addition, all discussions in NERC meetings and other NERC-related communications should be within the scope of the mandate for or assignment to the particular NERC committee or subgroup, as well as within the scope of the published agenda for the meeting. No decisions should be made nor any actions taken in NERC activities for the purpose of giving an industry participant or group of participants a competitive advantage over other participants. In particular, decisions with respect to setting, revising, or assessing compliance with NERC reliability standards should not be influenced by anti-competitive motivations. Subject to the foregoing restrictions, participants in NERC activities may discuss:
• Reliability matters relating to the bulk power system, including operation and planning matters such as establishing or revising reliability standards, special operating procedures, operating transfer capabilities, and plans for new facilities.
• Matters relating to the impact of reliability standards for the bulk power system on electricity markets, and the impact of electricity market operations on the reliability of the bulk power system.
• Proposed filings or other communications with state or federal regulatory authorities or other governmental entities.
Matters relating to the internal governance, management and operation of NERC, such as nominations for vacant committee positions, budgeting and assessments, and employment matters; and procedural matters such as planning and scheduling meetings.

Draft Minutes Finance and Audit Committee August 15, 2012 | 10:45 a.m. Eastern Hilton Quebec 1100, Rene-Levesque Blvd East Quebec, QC Canada G1R 4P3 418-647-6500 Chair Fred Gorbet convened a duly noticed meeting of the Finance and Audit Committee (the Committee) of the North American Electric Reliability Corporation on August 15, 2012 at 10:45 a.m. local time. The agenda is attached as Exhibit A. Present at the meeting were: All Committee members, being Fred Gorbet, Chair, David Goulding, Roy Thilly, Janice Case, and John Q. Anderson; Board members, Jan Schori, Vicky Bailey, Bruce Scherr, Ken Peterson, Tom Berry, and Paul Barber; and NERC staff members Gerry Cauley, Michael Walker, Charlie Berardesco, David Cook, and Tina McClellan. NERC Antitrust Compliance Guidelines Mr. Gorbet directed the participants’ attention to the NERC Antitrust Compliance Guidelines. Minutes The committee approved the minutes of the May 8, May 18, and July 19, 2012 meetings. Third Quarter Calendar of FAC Responsibilities Mr. Walker, chief financial and administrative officer, reviewed the unaudited Statement of Activities for NERC and the Regional Entities for the second quarter of 2012. After discussions, the committee members requested that management prepare a summary of historic budget to actual financial performance of NERC and the Regions for review at a future meeting. Upon motion duly made and seconded, the Committee recommended that the Board of Trustees accept the Statement of Activities. Mr. Walker reviewed the proposed Working Capital and Operating Reserve Policy, stating that no comments had been received from stakeholders recommending changes to the policy itself; however there were comments on the allocation categories and that those comments were reviewed and addressed in the final draft of 2013 Business Plan and Budget that was before the committee today. Upon motion duly made and seconded, the Committee recommended that the Board of Trustees approve the Working Capital and Operating Reserve Policy. Mr. Walker then provided an overview of the proposed final NERC and Regional Entity 2013 Business Plans and Budgets, including the schedule of assessments. With respect to the NERC Business Plan and Budget, Mr. Walker reviewed key changes in department activities and priorities, as well as key changes to the final proposed budget, including an increase of $400,000 in Operating Expense and a $1.4 million
Finance and Audit Committee Draft Minutes – August 15, 2012
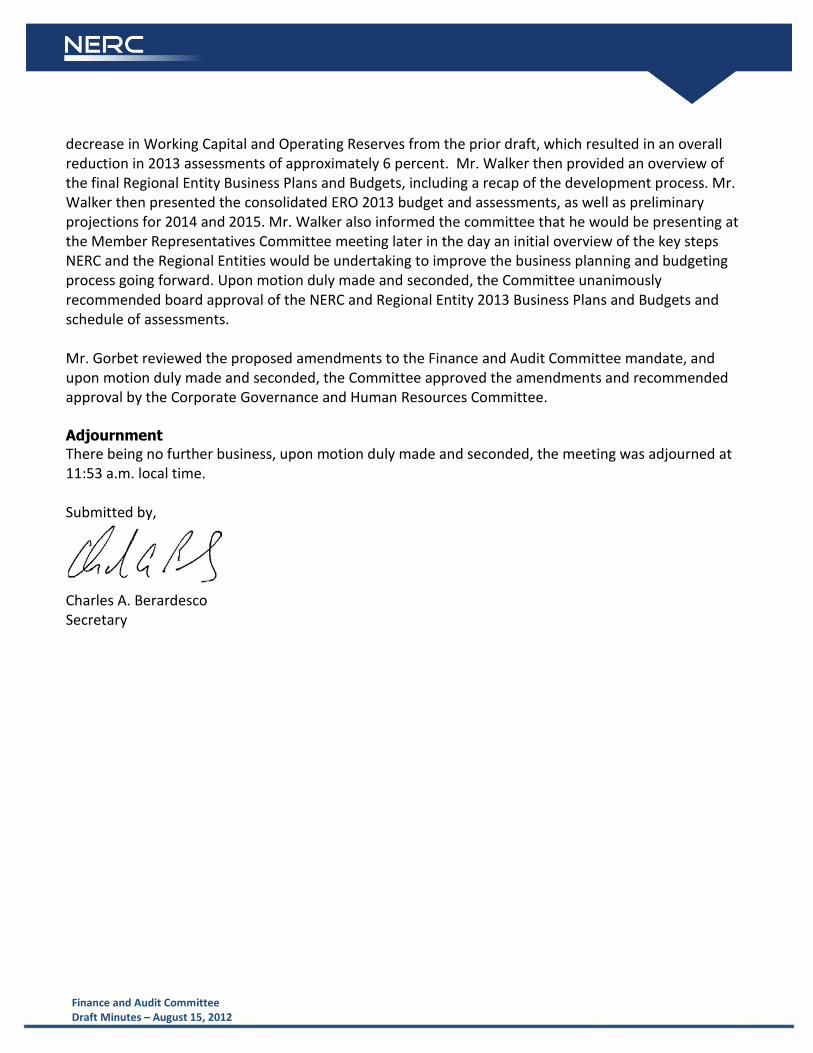
decrease in Working Capital and Operating Reserves from the prior draft, which resulted in an overall reduction in 2013 assessments of approximately 6 percent. Mr. Walker then provided an overview of the final Regional Entity Business Plans and Budgets, including a recap of the development process. Mr. Walker then presented the consolidated ERO 2013 budget and assessments, as well as preliminary projections for 2014 and 2015. Mr. Walker also informed the committee that he would be presenting at the Member Representatives Committee meeting later in the day an initial overview of the key steps NERC and the Regional Entities would be undertaking to improve the business planning and budgeting process going forward. Upon motion duly made and seconded, the Committee unanimously recommended board approval of the NERC and Regional Entity 2013 Business Plans and Budgets and schedule of assessments. Mr. Gorbet reviewed the proposed amendments to the Finance and Audit Committee mandate, and upon motion duly made and seconded, the Committee approved the amendments and recommended approval by the Corporate Governance and Human Resources Committee.
Adjournment There being no further business, upon motion duly made and seconded, the meeting was adjourned at 11:53 a.m. local time. Submitted by,
Charles A. Berardesco Secretary
Agenda Item 3 FAC Meeting October 31, 2012
Third Quarter (unaudited) Statement of Activities and Year End Forecast
Action Review and recommend acceptance by the Board of Trustees. Summary Attached is the third quarter unaudited Statement of Activities, budget variance report and year-end forecast for NERC. The attached report also includes information regarding the contributions and expenditures of operating reserves required pursuant to the Working Capital and Operating Reserve Policy which was adopted by the Board of Trustees at their August 2012 meeting. As the Regional Entity variance reports are not due to NERC until the 20th day after the close of the applicable quarter, we do not expect to have the consolidated variance report and year-end projection completed and available for distribution and posting until approximately one week prior to the committee conference call on October 31, 2012.
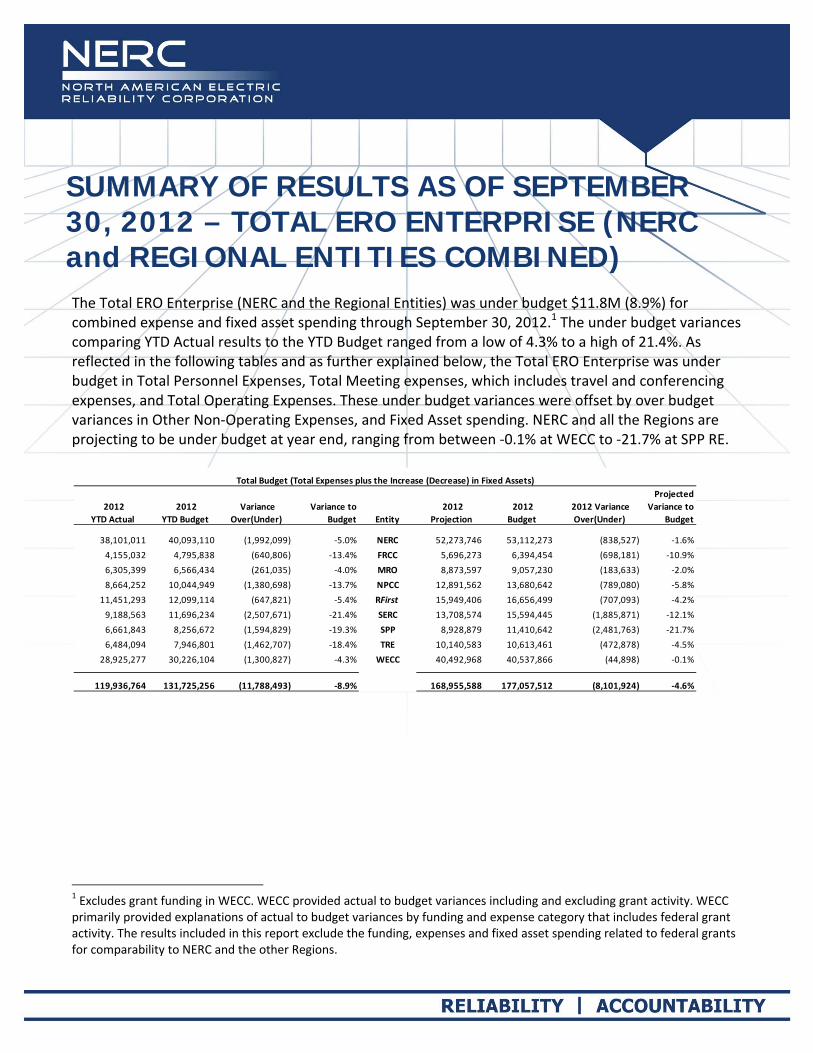
SUMMARY OF RESULTS AS OF SEPTEMBER 30, 2012 – TOTAL ERO ENTERPRISE (NERC and REGIONAL ENTITIES COMBINED) The Total ERO Enterprise (NERC and the Regional Entities) was under budget $11.8M (8.9%) for combined expense and fixed asset spending through September 30, 2012.1 The under budget variances comparing YTD Actual results to the YTD Budget ranged from a low of 4.3% to a high of 21.4%. As reflected in the following tables and as further explained below, the Total ERO Enterprise was under budget in Total Personnel Expenses, Total Meeting expenses, which includes travel and conferencing expenses, and Total Operating Expenses. These under budget variances were offset by over budget variances in Other Non‐Operating Expenses, and Fixed Asset spending. NERC and all the Regions are projecting to be under budget at year end, ranging from between ‐0.1% at WECC to ‐21.7% at SPP RE.
1 Excludes grant funding in WECC. WECC provided actual to budget variances including and excluding grant activity. WECC primarily provided explanations of actual to budget variances by funding and expense category that includes federal grant activity. The results included in this report exclude the funding, expenses and fixed asset spending related to federal grants for comparability to NERC and the other Regions.
2012
YTD Actual
2012
YTD Budget
Variance
Over(Under)
Variance to
Budget Entity
2012
Projection
2012
Budget
2012 Variance
Over(Under)
Projected
Variance to
Budget
38,101,011 40,093,110 (1,992,099) ‐5.0% NERC 52,273,746 53,112,273 (838,527) ‐1.6%
4,155,032 4,795,838 (640,806) ‐13.4% FRCC 5,696,273 6,394,454 (698,181) ‐10.9%
6,305,399 6,566,434 (261,035) ‐4.0% MRO 8,873,597 9,057,230 (183,633) ‐2.0%
8,664,252 10,044,949 (1,380,698) ‐13.7% NPCC 12,891,562 13,680,642 (789,080) ‐5.8%
11,451,293 12,099,114 (647,821) ‐5.4% RFirst 15,949,406 16,656,499 (707,093) ‐4.2%
9,188,563 11,696,234 (2,507,671) ‐21.4% SERC 13,708,574 15,594,445 (1,885,871) ‐12.1%
6,661,843 8,256,672 (1,594,829) ‐19.3% SPP 8,928,879 11,410,642 (2,481,763) ‐21.7%
6,484,094 7,946,801 (1,462,707) ‐18.4% TRE 10,140,583 10,613,461 (472,878) ‐4.5%
28,925,277 30,226,104 (1,300,827) ‐4.3% WECC 40,492,968 40,537,866 (44,898) ‐0.1%
119,936,764 131,725,256 (11,788,493) ‐8.9% 168,955,588 177,057,512 (8,101,924) ‐4.6%
Total Budget (Total Expenses plus the Increase (Decrease) in Fixed Assets)
SUMMARY OF RESULTS AS OF SEPTEMBER 30, 2012 – TOTAL ERO ENTERPRISE (NERC and REGIONAL ENTITIES COMBINED) 2
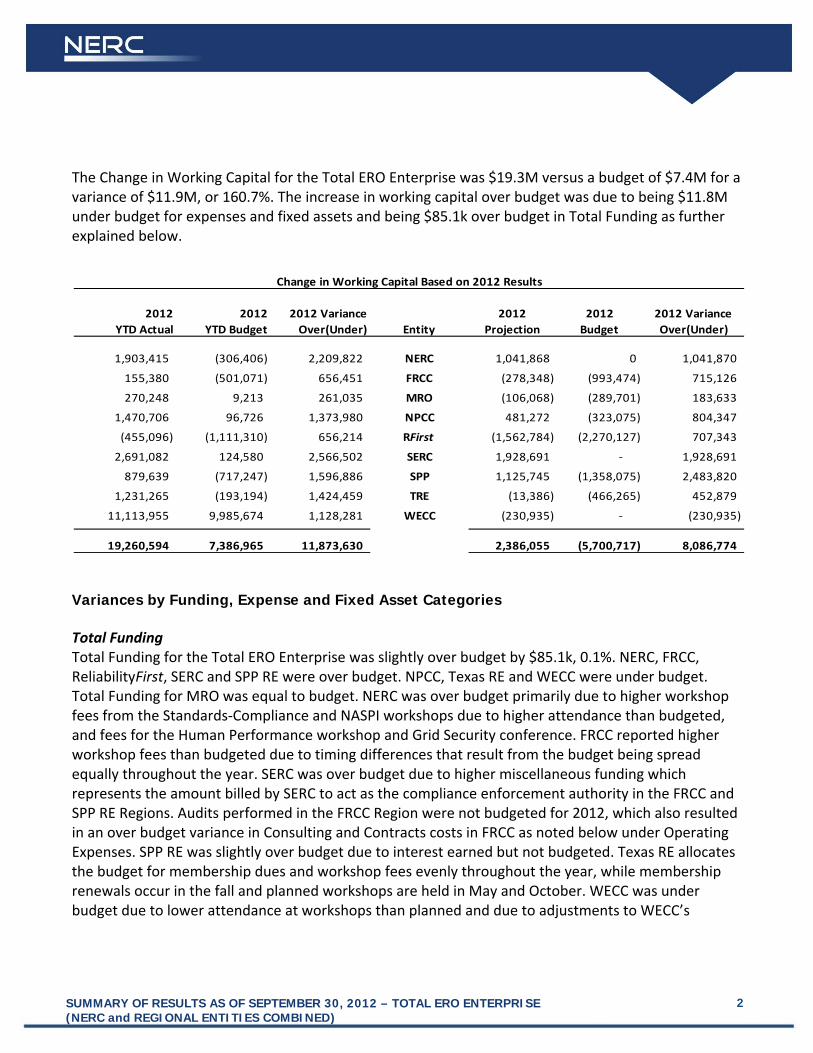
The Change in Working Capital for the Total ERO Enterprise was $19.3M versus a budget of $7.4M for a variance of $11.9M, or 160.7%. The increase in working capital over budget was due to being $11.8M under budget for expenses and fixed assets and being $85.1k over budget in Total Funding as further explained below.
Variances by Funding, Expense and Fixed Asset Categories Total Funding Total Funding for the Total ERO Enterprise was slightly over budget by $85.1k, 0.1%. NERC, FRCC, ReliabilityFirst, SERC and SPP RE were over budget. NPCC, Texas RE and WECC were under budget. Total Funding for MRO was equal to budget. NERC was over budget primarily due to higher workshop fees from the Standards‐Compliance and NASPI workshops due to higher attendance than budgeted, and fees for the Human Performance workshop and Grid Security conference. FRCC reported higher workshop fees than budgeted due to timing differences that result from the budget being spread equally throughout the year. SERC was over budget due to higher miscellaneous funding which represents the amount billed by SERC to act as the compliance enforcement authority in the FRCC and SPP RE Regions. Audits performed in the FRCC Region were not budgeted for 2012, which also resulted in an over budget variance in Consulting and Contracts costs in FRCC as noted below under Operating Expenses. SPP RE was slightly over budget due to interest earned but not budgeted. Texas RE allocates the budget for membership dues and workshop fees evenly throughout the year, while membership renewals occur in the fall and planned workshops are held in May and October. WECC was under budget due to lower attendance at workshops than planned and due to adjustments to WECC’s
2012
YTD Actual
2012
YTD Budget
2012 Variance
Over(Under) Entity
2012
Projection
2012
Budget
2012 Variance
Over(Under)
1,903,415 (306,406) 2,209,822 NERC 1,041,868 0 1,041,870
155,380 (501,071) 656,451 FRCC (278,348) (993,474) 715,126
270,248 9,213 261,035 MRO (106,068) (289,701) 183,633
1,470,706 96,726 1,373,980 NPCC 481,272 (323,075) 804,347
(455,096) (1,111,310) 656,214 RFirst (1,562,784) (2,270,127) 707,343
2,691,082 124,580 2,566,502 SERC 1,928,691 ‐ 1,928,691
879,639 (717,247) 1,596,886 SPP 1,125,745 (1,358,075) 2,483,820
1,231,265 (193,194) 1,424,459 TRE (13,386) (466,265) 452,879
11,113,955 9,985,674 1,128,281 WECC (230,935) ‐ (230,935)
19,260,594 7,386,965 11,873,630 2,386,055 (5,700,717) 8,086,774
Change in Working Capital Based on 2012 Results
SUMMARY OF RESULTS AS OF SEPTEMBER 30, 2012 – TOTAL ERO ENTERPRISE (NERC and REGIONAL ENTITIES COMBINED) 3
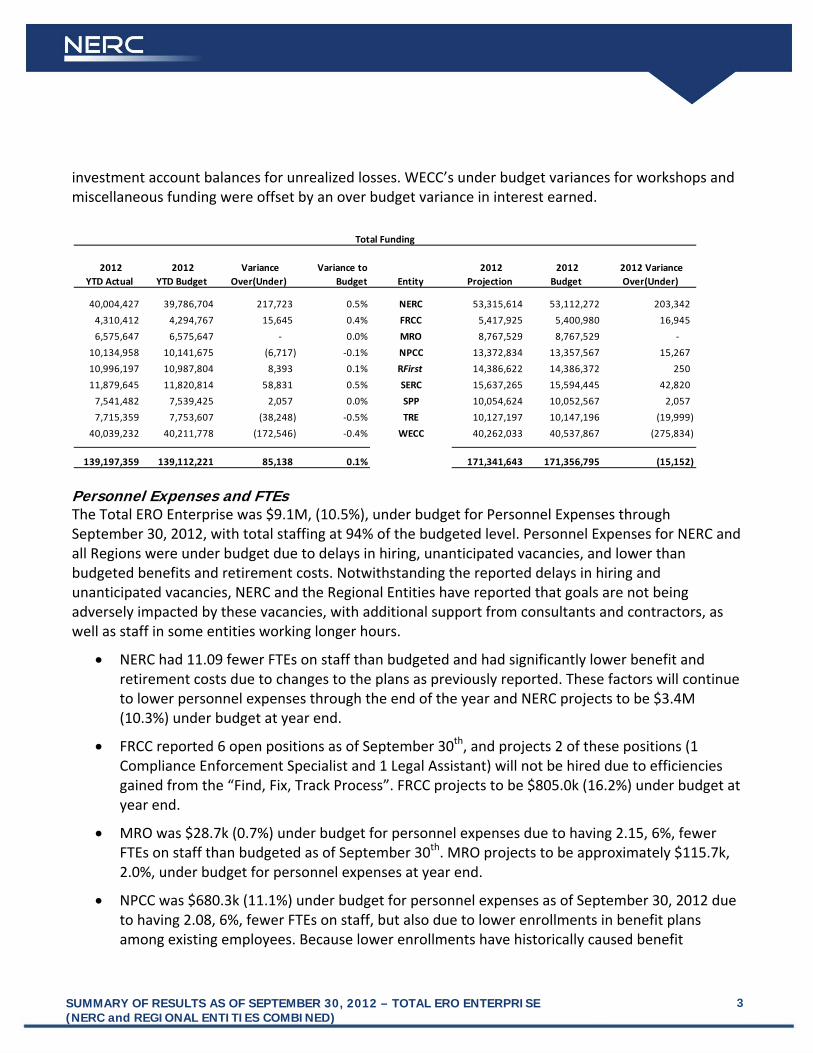
investment account balances for unrealized losses. WECC’s under budget variances for workshops and miscellaneous funding were offset by an over budget variance in interest earned.
Personnel Expenses and FTEs The Total ERO Enterprise was $9.1M, (10.5%), under budget for Personnel Expenses through September 30, 2012, with total staffing at 94% of the budgeted level. Personnel Expenses for NERC and all Regions were under budget due to delays in hiring, unanticipated vacancies, and lower than budgeted benefits and retirement costs. Notwithstanding the reported delays in hiring and unanticipated vacancies, NERC and the Regional Entities have reported that goals are not being adversely impacted by these vacancies, with additional support from consultants and contractors, as well as staff in some entities working longer hours.
NERC had 11.09 fewer FTEs on staff than budgeted and had significantly lower benefit and retirement costs due to changes to the plans as previously reported. These factors will continue to lower personnel expenses through the end of the year and NERC projects to be $3.4M (10.3%) under budget at year end.
FRCC reported 6 open positions as of September 30th, and projects 2 of these positions (1 Compliance Enforcement Specialist and 1 Legal Assistant) will not be hired due to efficiencies gained from the “Find, Fix, Track Process”. FRCC projects to be $805.0k (16.2%) under budget at year end.
MRO was $28.7k (0.7%) under budget for personnel expenses due to having 2.15, 6%, fewer FTEs on staff than budgeted as of September 30th. MRO projects to be approximately $115.7k, 2.0%, under budget for personnel expenses at year end.
NPCC was $680.3k (11.1%) under budget for personnel expenses as of September 30, 2012 due to having 2.08, 6%, fewer FTEs on staff, but also due to lower enrollments in benefit plans among existing employees. Because lower enrollments have historically caused benefit
2012
YTD Actual
2012
YTD Budget
Variance
Over(Under)
Variance to
Budget Entity
2012
Projection
2012
Budget
2012 Variance
Over(Under)
40,004,427 39,786,704 217,723 0.5% NERC 53,315,614 53,112,272 203,342
4,310,412 4,294,767 15,645 0.4% FRCC 5,417,925 5,400,980 16,945
6,575,647 6,575,647 ‐ 0.0% MRO 8,767,529 8,767,529 ‐
10,134,958 10,141,675 (6,717) ‐0.1% NPCC 13,372,834 13,357,567 15,267
10,996,197 10,987,804 8,393 0.1% RFirst 14,386,622 14,386,372 250
11,879,645 11,820,814 58,831 0.5% SERC 15,637,265 15,594,445 42,820
7,541,482 7,539,425 2,057 0.0% SPP 10,054,624 10,052,567 2,057
7,715,359 7,753,607 (38,248) ‐0.5% TRE 10,127,197 10,147,196 (19,999)
40,039,232 40,211,778 (172,546) ‐0.4% WECC 40,262,033 40,537,867 (275,834)
139,197,359 139,112,221 85,138 0.1% 171,341,643 171,356,795 (15,152)
Total Funding

SUMMARY OF RESULTS AS OF SEPTEMBER 30, 2012 – TOTAL ERO ENTERPRISE (NERC and REGIONAL ENTITIES COMBINED) 4
expenses to be under budget, NPCC discounted the cost of benefits for all employees in the development of their 2013 budget to mitigate actual to budget variances for this expense category in 2013.
ReliabilityFirst was under budget $446.4k (4.7%) as of September 30th and is projecting to be $659.7k (5.1%) under budget at year end for personnel expenses due to having fewer FTEs on staff and lower benefit costs related to a 0% increase in the cost of medical benefits, which were budgeted to increase 12%.
SERC reported having 12 open positions as of September 30th, however two (2) of these open positions were filled in October. SERC anticipates filling most of the open positions prior to year end. SERC was under budget $1.6M (17.9%) as of September 30th and is projecting to be $1.1M (9.3%) at year end for personnel expenses.
SPP RE reported having 4 open positions as of September 30, 2012. SPP RE was $422.8k (12.7%) under budget as of September 30th and is projecting to be $637.3k, 14.3%, at year end.
Texas RE reported 6 open positions resulting from employee turnover and the timing of new hires. Texas RE projects 3 positions will remain unfilled at year end. As a result of these open positions, Texas RE was under budget $1.2M (19.6%) as of September 30th and is projecting to be $678.4k (8.5%) under budget at year end.
WECC reported lower than budgeted personnel expenses due to timing of hiring, normal turnover and lower than budgeted enrollment among existing employees in WECC’s benefit plans. WECC was under budget $934.3k (4.7%) as of September 30th and is projecting to be $187.2k (0.7%) at year end.
2012
YTD Actual
2012
YTD Budget
Variance
Over(Under)
% Variance to
Budget Entity
2012
Projection
2012
Budget
2012 Variance
Over(Under)
% Variance
Over(Under)
21,765,676 24,994,624 (3,228,948) ‐12.9% NERC 29,602,932 33,005,813 (3,402,881) ‐10.3%
3,078,731 3,724,411 (645,680) ‐17.3% FRCC 4,160,926 4,965,882 (804,956) ‐16.2%
4,321,994 4,350,706 (28,712) ‐0.7% MRO 5,685,269 5,800,942 (115,673) ‐2.0%
5,474,280 6,154,560 (680,280) ‐11.1% NPCC 7,726,945 8,182,160 (455,215) ‐5.6%
9,104,839 9,551,218 (446,379) ‐4.7% RFirst 12,314,554 12,974,285 (659,731) ‐5.1%
7,273,283 8,860,126 (1,586,843) ‐17.9% SERC 10,720,530 11,813,504 (1,092,974) ‐9.3%
2,918,069 3,340,908 (422,839) ‐12.7% SPP 3,817,239 4,454,543 (637,304) ‐14.3%
4,791,461 5,957,558 (1,166,097) ‐19.6% TRE 7,304,591 7,982,969 (678,378) ‐8.5%
18,985,151 19,919,492 (934,341) ‐4.7% WECC 26,608,102 26,795,288 (187,186) ‐0.7%
77,713,484 86,853,603 (9,140,119) ‐10.5% 107,941,088 115,975,386 (8,034,298) ‐6.9%
Personnel Expenses
SUMMARY OF RESULTS AS OF SEPTEMBER 30, 2012 – TOTAL ERO ENTERPRISE (NERC and REGIONAL ENTITIES COMBINED) 5
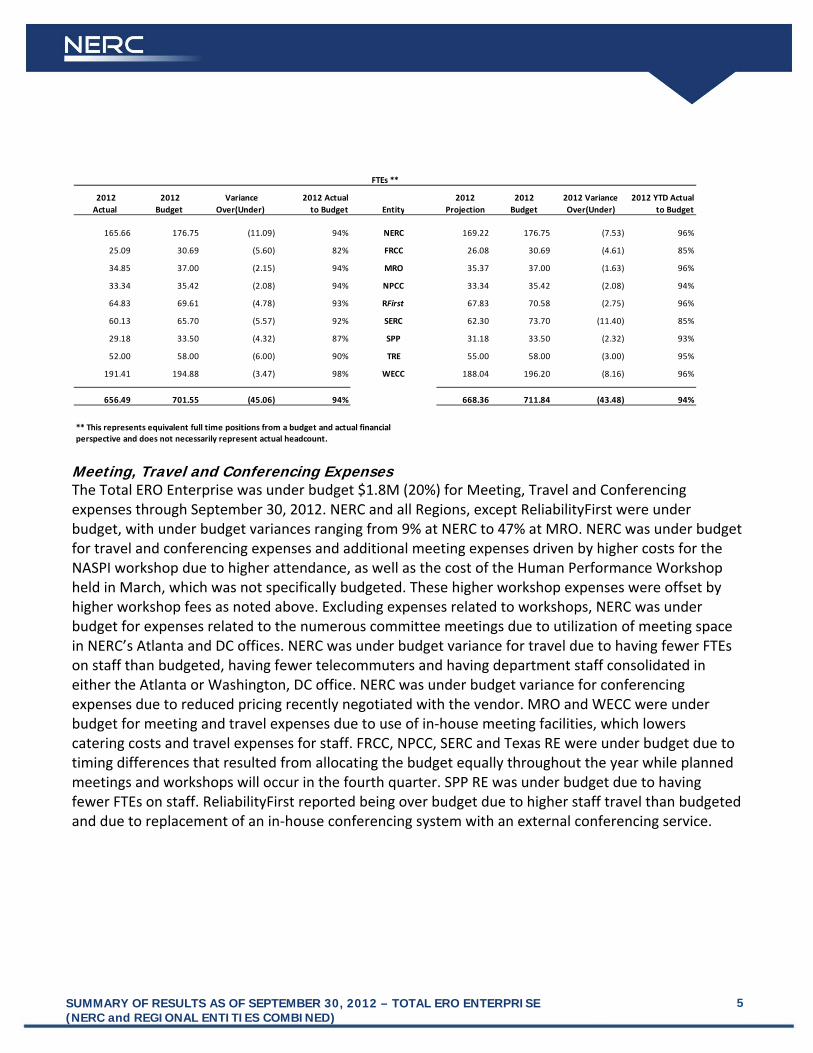
Meeting, Travel and Conferencing Expenses The Total ERO Enterprise was under budget $1.8M (20%) for Meeting, Travel and Conferencing expenses through September 30, 2012. NERC and all Regions, except ReliabilityFirst were under budget, with under budget variances ranging from 9% at NERC to 47% at MRO. NERC was under budget for travel and conferencing expenses and additional meeting expenses driven by higher costs for the NASPI workshop due to higher attendance, as well as the cost of the Human Performance Workshop held in March, which was not specifically budgeted. These higher workshop expenses were offset by higher workshop fees as noted above. Excluding expenses related to workshops, NERC was under budget for expenses related to the numerous committee meetings due to utilization of meeting space in NERC’s Atlanta and DC offices. NERC was under budget variance for travel due to having fewer FTEs on staff than budgeted, having fewer telecommuters and having department staff consolidated in either the Atlanta or Washington, DC office. NERC was under budget variance for conferencing expenses due to reduced pricing recently negotiated with the vendor. MRO and WECC were under budget for meeting and travel expenses due to use of in‐house meeting facilities, which lowers catering costs and travel expenses for staff. FRCC, NPCC, SERC and Texas RE were under budget due to timing differences that resulted from allocating the budget equally throughout the year while planned meetings and workshops will occur in the fourth quarter. SPP RE was under budget due to having fewer FTEs on staff. ReliabilityFirst reported being over budget due to higher staff travel than budgeted and due to replacement of an in‐house conferencing system with an external conferencing service.
2012
Actual
2012
Budget
Variance
Over(Under)
2012 Actual
to Budget Entity
2012
Projection
2012
Budget
2012 Variance
Over(Under)
2012 YTD Actual
to Budget
165.66 176.75 (11.09) 94% NERC 169.22 176.75 (7.53) 96%
25.09 30.69 (5.60) 82% FRCC 26.08 30.69 (4.61) 85%
34.85 37.00 (2.15) 94% MRO 35.37 37.00 (1.63) 96%
33.34 35.42 (2.08) 94% NPCC 33.34 35.42 (2.08) 94%
64.83 69.61 (4.78) 93% RFirst 67.83 70.58 (2.75) 96%
60.13 65.70 (5.57) 92% SERC 62.30 73.70 (11.40) 85%
29.18 33.50 (4.32) 87% SPP 31.18 33.50 (2.32) 93%
52.00 58.00 (6.00) 90% TRE 55.00 58.00 (3.00) 95%
191.41 194.88 (3.47) 98% WECC 188.04 196.20 (8.16) 96%
656.49 701.55 (45.06) 94% 668.36 711.84 (43.48) 94%
** This represents equivalent full time positions from a budget and actual financial perspective and does not necessarily represent actual headcount.
FTEs **

SUMMARY OF RESULTS AS OF SEPTEMBER 30, 2012 – TOTAL ERO ENTERPRISE (NERC and REGIONAL ENTITIES COMBINED) 6
Operating Expenses Operating expenses for the Total ERO Enterprise were approximately $972.1k (3%) under budget through September 30, 2012. NERC, FRCC, Texas RE and WECC were over budget and the other five Regions were under budget. The two major expense categories contributing to the $972.1k under budget variance were (1) Consultants and Contracts, under budget $931.8k (7.8%); and (2) Professional Services, under budget $388.2k (8.6%). Office Costs and Miscellaneous expenses were also collectively $157.5k under budget. Consultants and Contracts
NERC was over budget $106.5k, and is projecting to be over budget at year end $1.4M. These over budget variances are primarily related to: (i) the IDC contract is projected to be over budget $215.9k at year end due to costs associated with the “generation to load reporting” change order and the incentive availability performance component which were not included in the 2012 budget; (ii) the NASPI project, which is primarily related to the company’s contract with the Grid Protection Alliance (GPA), is projected to be over budget $248k at year end as a result of the carryover of unused 2011 contractual co‐funding commitments for the SIEGate Project pursuant to the terms of NERC’s contract with GPA for this project. This carryover was not anticipated at the time the budget was prepared and total costs of the SIEGate project remain on budget and are capped pursuant to the contract terms; (iii) the SAFNR contract costs are expected to be approximately $175.5k higher than budget at year end, primarily due to the costs of additional user licensing and maintenance fees; and (iv) $250.0k to upgrade of the System Operator Certification and Continuing Education Database which was not included in the 2012 budget but is being funded from operating reserves, which include excess funds generated from testing fees above expenses from this program area. These over budget variances are offset by an under budget variance for contract support required for the ES‐ISAC
2012
YTD Actual
2012
YTD Budget
Variance
Over(Under)
% Variance to
Budget Entity
2012
Projection
2012
Budget
Variance
Over(Under)
% Variance
to Budget
2,611,557 2,878,418 (266,862) ‐9% NERC 3,404,961 3,872,780 (467,819) ‐12%
198,353 241,360 (43,007) ‐18% FRCC 262,711 321,814 (59,103) ‐18%
306,020 572,396 (266,376) ‐47% MRO 515,110 763,194 (248,084) ‐33%
586,158 724,701 (138,543) ‐19% NPCC 1,071,935 1,071,935 ‐ 0%
650,939 606,030 44,909 7% RFirst 905,880 841,756 64,124 8%
628,587 836,404 (207,817) ‐25% SERC 862,680 1,114,669 (251,989) ‐23%
336,266 568,250 (231,984) ‐41% SPP 363,269 715,000 (351,731) ‐49%
223,919 318,002 (94,083) ‐30% TRE 380,448 414,948 (34,500) ‐8%
1,744,292 2,339,446 (595,154) ‐25% WECC 2,407,385 3,189,357 (781,972) ‐25%
7,286,091 9,085,007 (1,798,916) ‐20% 10,174,379 12,305,453 (2,131,074) ‐17%
Meeting, Travel and Conferencing Expenses
SUMMARY OF RESULTS AS OF SEPTEMBER 30, 2012 – TOTAL ERO ENTERPRISE (NERC and REGIONAL ENTITIES COMBINED) 7
secure portal which is projected to be $192.7k under budget at year end due to lower than anticipated costs required for the project.
MRO, NPCC, SERC, SPP RE, and WECC were collectively under budget $1.3M for Consultant and Contract Expenses primarily due to timing. MRO and NPCC are projecting to be at budget by year end. SERC reported lower than budgeted costs due to: (i) lower costs for hosting and maintaining SERC’s servers, (ii) lower than planned participation in the schedule checkout tool, (iii) contract delays for various compliance projects, (iv) timing related to several Reliability Assessment software projects scheduled to start in fourth quarter, and (v) lower than budgeted costs incurred for various studies and event analysis technical expertise. These under budget variances were offset by consulting support for SERC’s management training initiative, which was not specifically budgeted. SPP RE reported YTD and projected yearend under budget variances due to the elimination of consulting activity related to the enforcement caseload reduction initiative and delayed implementation of the BES exception process. WECC also reported that the YTD under budget variance was due to timing related to the Base Case Coordinating System project, and is projecting to be under budget at year end.
FRCC, ReliabilityFirst and Texas RE were collectively $290.6k over budget. FRCC was $69.1k over budget due to audits of their RC and PA functions by SERC which were not budgeted to occur in 2012. ReliabilityFirst was over budget due to the use of contractors to support performance of compliance audits due to having fewer FTEs on staff than budgeted. Texas RE was over budget as a result of unbudgeted consultant expense to assist with enforcement of violations involving CIP standards.
Professional Services – MRO, NPCC, ReliabilityFirst, SPP RE, Texas RE and WECC were collectively under budget $851.8k. MRO, NPCC, ReliabilityFirst, and WECC reported the under budget variance is primarily related to greater use of in‐house counsel. NPCC reported the under budget variance was also due to expenses related to trustee search fees incurred in 2011 but budgeted in 2012. Texas RE was under budget due to timing of expenses related to Board recruiting incurred during the fourth quarter but the budget is spread evenly throughout the year. NERC, FRCC and SERC were collectively $463.7k over budget for professional services. NERC was $432.2k over budget primarily due to $445.5k in legal fees associated with the FERC audit, which was not budgeted. SERC reported the over budget variance is related to legal fees to assist with SERC’s change in tax exempt status and state of incorporation and the engagement of external auditors to perform a review of SERC’s auditing function. SERC also reported the over budget variance is related to payment of property taxes on office equipment which was not budgeted. Office Costs were under budget $96.0k (1.2%) primarily due to variances reported by NERC and SERC. NERC was $195.1k over budget primarily due to higher than budgeted telephone and internet expenses. NERC reported higher internet expenses due to the unanticipated delay in relocation of
SUMMARY OF RESULTS AS OF SEPTEMBER 30, 2012 – TOTAL ERO ENTERPRISE (NERC and REGIONAL ENTITIES COMBINED) 8
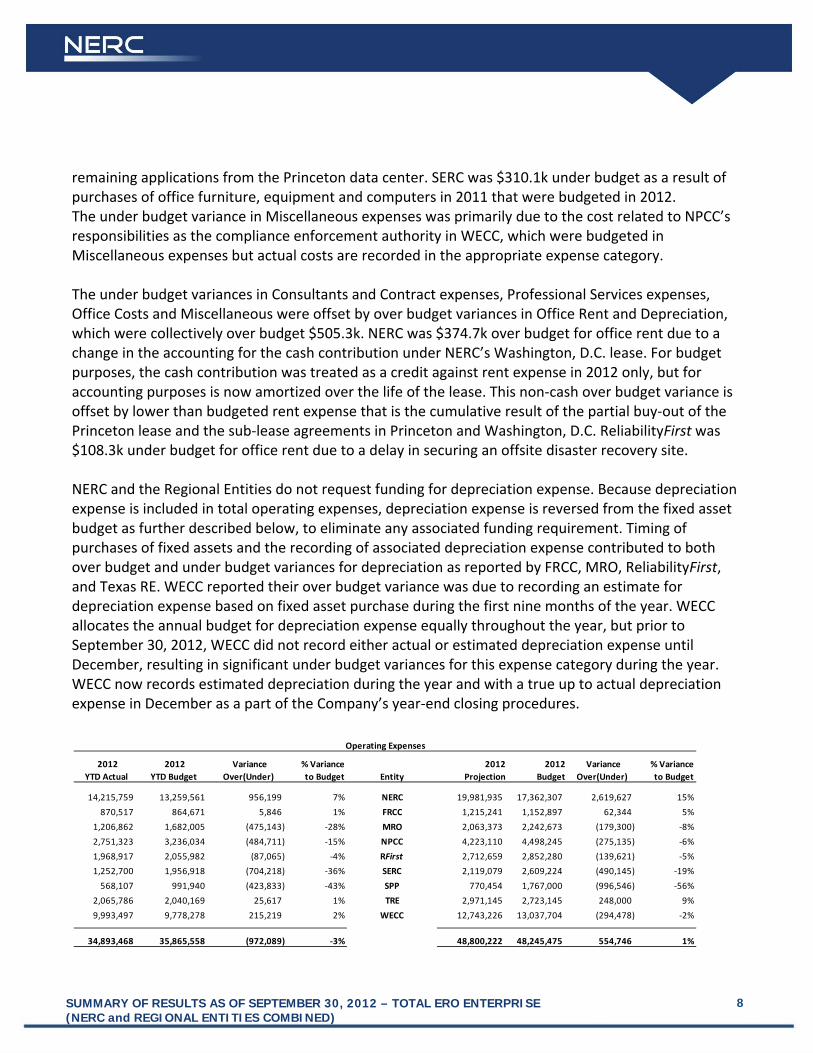
remaining applications from the Princeton data center. SERC was $310.1k under budget as a result of purchases of office furniture, equipment and computers in 2011 that were budgeted in 2012. The under budget variance in Miscellaneous expenses was primarily due to the cost related to NPCC’s responsibilities as the compliance enforcement authority in WECC, which were budgeted in Miscellaneous expenses but actual costs are recorded in the appropriate expense category. The under budget variances in Consultants and Contract expenses, Professional Services expenses, Office Costs and Miscellaneous were offset by over budget variances in Office Rent and Depreciation, which were collectively over budget $505.3k. NERC was $374.7k over budget for office rent due to a change in the accounting for the cash contribution under NERC’s Washington, D.C. lease. For budget purposes, the cash contribution was treated as a credit against rent expense in 2012 only, but for accounting purposes is now amortized over the life of the lease. This non‐cash over budget variance is offset by lower than budgeted rent expense that is the cumulative result of the partial buy‐out of the Princeton lease and the sub‐lease agreements in Princeton and Washington, D.C. ReliabilityFirst was $108.3k under budget for office rent due to a delay in securing an offsite disaster recovery site. NERC and the Regional Entities do not request funding for depreciation expense. Because depreciation expense is included in total operating expenses, depreciation expense is reversed from the fixed asset budget as further described below, to eliminate any associated funding requirement. Timing of purchases of fixed assets and the recording of associated depreciation expense contributed to both over budget and under budget variances for depreciation as reported by FRCC, MRO, ReliabilityFirst, and Texas RE. WECC reported their over budget variance was due to recording an estimate for depreciation expense based on fixed asset purchase during the first nine months of the year. WECC allocates the annual budget for depreciation expense equally throughout the year, but prior to September 30, 2012, WECC did not record either actual or estimated depreciation expense until December, resulting in significant under budget variances for this expense category during the year. WECC now records estimated depreciation during the year and with a true up to actual depreciation expense in December as a part of the Company’s year‐end closing procedures.
2012
YTD Actual
2012
YTD Budget
Variance
Over(Under)
% Variance
to Budget Entity
2012
Projection
2012
Budget
Variance
Over(Under)
% Variance
to Budget
14,215,759 13,259,561 956,199 7% NERC 19,981,935 17,362,307 2,619,627 15%
870,517 864,671 5,846 1% FRCC 1,215,241 1,152,897 62,344 5%
1,206,862 1,682,005 (475,143) ‐28% MRO 2,063,373 2,242,673 (179,300) ‐8%
2,751,323 3,236,034 (484,711) ‐15% NPCC 4,223,110 4,498,245 (275,135) ‐6%
1,968,917 2,055,982 (87,065) ‐4% RFirst 2,712,659 2,852,280 (139,621) ‐5%
1,252,700 1,956,918 (704,218) ‐36% SERC 2,119,079 2,609,224 (490,145) ‐19%
568,107 991,940 (423,833) ‐43% SPP 770,454 1,767,000 (996,546) ‐56%
2,065,786 2,040,169 25,617 1% TRE 2,971,145 2,723,145 248,000 9%
9,993,497 9,778,278 215,219 2% WECC 12,743,226 13,037,704 (294,478) ‐2%
34,893,468 35,865,558 (972,089) ‐3% 48,800,222 48,245,475 554,746 1%
Operating Expenses
SUMMARY OF RESULTS AS OF SEPTEMBER 30, 2012 – TOTAL ERO ENTERPRISE (NERC and REGIONAL ENTITIES COMBINED) 9
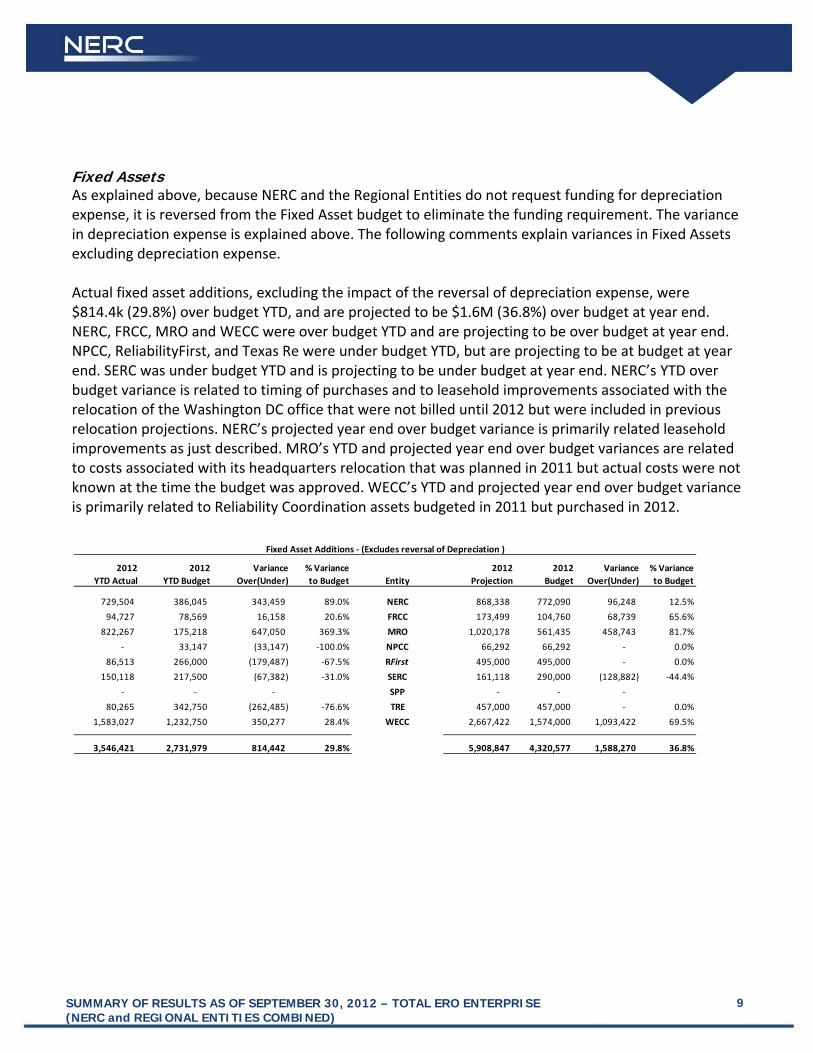
Fixed Assets As explained above, because NERC and the Regional Entities do not request funding for depreciation expense, it is reversed from the Fixed Asset budget to eliminate the funding requirement. The variance in depreciation expense is explained above. The following comments explain variances in Fixed Assets excluding depreciation expense. Actual fixed asset additions, excluding the impact of the reversal of depreciation expense, were $814.4k (29.8%) over budget YTD, and are projected to be $1.6M (36.8%) over budget at year end. NERC, FRCC, MRO and WECC were over budget YTD and are projecting to be over budget at year end. NPCC, ReliabilityFirst, and Texas Re were under budget YTD, but are projecting to be at budget at year end. SERC was under budget YTD and is projecting to be under budget at year end. NERC’s YTD over budget variance is related to timing of purchases and to leasehold improvements associated with the relocation of the Washington DC office that were not billed until 2012 but were included in previous relocation projections. NERC’s projected year end over budget variance is primarily related leasehold improvements as just described. MRO’s YTD and projected year end over budget variances are related to costs associated with its headquarters relocation that was planned in 2011 but actual costs were not known at the time the budget was approved. WECC’s YTD and projected year end over budget variance is primarily related to Reliability Coordination assets budgeted in 2011 but purchased in 2012.
2012
YTD Actual
2012
YTD Budget
Variance
Over(Under)
% Variance
to Budget Entity
2012
Projection
2012
Budget
Variance
Over(Under)
% Variance
to Budget
729,504 386,045 343,459 89.0% NERC 868,338 772,090 96,248 12.5%
94,727 78,569 16,158 20.6% FRCC 173,499 104,760 68,739 65.6%
822,267 175,218 647,050 369.3% MRO 1,020,178 561,435 458,743 81.7%
‐ 33,147 (33,147) ‐100.0% NPCC 66,292 66,292 ‐ 0.0%
86,513 266,000 (179,487) ‐67.5% RFirst 495,000 495,000 ‐ 0.0%
150,118 217,500 (67,382) ‐31.0% SERC 161,118 290,000 (128,882) ‐44.4%
‐ ‐ ‐ SPP ‐ ‐ ‐
80,265 342,750 (262,485) ‐76.6% TRE 457,000 457,000 ‐ 0.0%
1,583,027 1,232,750 350,277 28.4% WECC 2,667,422 1,574,000 1,093,422 69.5%
3,546,421 2,731,979 814,442 29.8% 5,908,847 4,320,577 1,588,270 36.8%
Fixed Asset Additions ‐ (Excludes reversal of Depreciation )

SUMMARY OF RESULTS AS OF SEPTEMBER 30, 2012 – TOTAL ERO ENTERPRISE (NERC and REGIONAL ENTITIES COMBINED) 10
2012
YTD Actual
2012
YTD Budget
2012 Variance
Over(Under)
2012
Projection
2012
Budget
2012 Variance
Over(Under)
FundingERO Funding
129,768,824$ 129,768,825$ (1) ERO Assessments 160,699,270$ 160,699,270$ ‐ 6,008,719 6,008,719 ‐ Penalty Sanctions 6,163,573 6,163,573 ‐
135,777,543$ 135,777,544$ (1)$ Total ERO Funding 166,862,843$ 166,862,843$ ‐$
‐$ ‐$ ‐ Federal Grants ‐$ ‐$ ‐ 2,440 20,626 (18,186) Membership Dues 17,751 27,500 (9,749)
1,523,788 1,545,750 (21,962) Testing Fees 2,108,200 2,061,000 47,200 110,265 209,500 (99,235) Services & Software 158,672 272,000 (113,328)
1,295,171 1,161,894 133,277 Workshops 1,595,725 1,617,575 (21,850) 348,831 295,628 53,203 Interest 451,977 394,171 57,806 139,320 101,279 38,041 Miscellaneous 146,476 121,706 24,770
139,197,359$ 139,112,221$ 85,138$ Total Funding (A) 171,341,643$ 171,356,795$ (15,152)$
ExpensesPersonnel Expenses
60,035,925$ 65,237,865$ (5,201,940) Salaries 82,734,134$ 87,503,094$ (4,768,960) 4,318,701 4,959,647 (640,947) Payroll Taxes 5,550,018 6,261,462 (711,444) 7,154,254 8,748,725 (1,594,471) Benefits 10,229,844 11,702,704 (1,472,860) 6,204,603 7,907,366 (1,702,762) Retirement Costs 9,427,092 10,508,125 (1,081,033) 77,713,484$ 86,853,603$ (9,140,119)$ Total Personnel Expenses 107,941,088$ 115,975,386$ (8,034,298)$
Meeting Expenses1,722,685$ 2,038,718$ (316,033) Meetings 2,513,171$ 2,915,855$ (402,684) 5,184,029 6,441,235 (1,257,207) Travel 7,043,726 8,582,859 (1,539,133) 379,377 605,054 (225,677) Conference Calls 617,482 806,739 (189,257)
7,286,091$ 9,085,007$ (1,798,916)$ Total Meeting Expenses 10,174,379$ 12,305,453$ (2,131,074)$
Operating Expenses11,052,530$ 11,984,306$ (931,776) Consultants & Contracts 16,874,135$ 16,240,651$ 633,484 5,631,234 5,472,701 158,533 Office Rent 7,488,543 7,297,718 190,825 7,843,567 7,939,518 (95,951) Office Costs 10,554,667 10,435,203 119,464 4,143,205 4,531,381 (388,176) Professional Services 6,275,723 6,325,507 (49,785)
78,194 139,711 (61,518) Miscellaneous 127,897 200,109 (72,212) 6,144,740 5,797,941 346,799 Depreciation 7,479,257 7,746,287 (267,030) 34,893,468$ 35,865,558$ (972,089)$ Total Operating Expenses 48,800,222$ 48,245,475$ 554,746$
119,893,043$ 131,804,168$ (11,911,125)$ Total Direct Expenses 166,915,689$ 176,526,314$ (9,610,626)$
2,538,423$ 2,908,169$ (369,746)$ Indirect Expenses 3,506,693$ 3,877,559$ (370,866)$
103,617$ 78,883$ 24,734$ Other Non‐Operating Expenses 103,617$ 79,349$ 24,268$
122,535,083$ 134,791,220$ (12,256,137)$ Total Expenses (B) 170,525,999$ 180,483,222$ (9,957,223)$
16,662,276$ 4,321,001$ 12,341,275$ Change in Assets 815,644$ (9,126,428)$ 9,942,072$
Fixed Assets(6,144,740) (5,797,941) (346,799) Depreciation (7,479,257) (7,746,287) 267,030 1,694,131 1,859,013 (164,881) Computer & Software CapEx 3,361,971 2,908,525 453,446 326,789 9,604 317,185 Furniture & Fixtures CapEx 345,996 19,207 326,789
1,122,873 838,758 284,115 Equipment CapEx 1,759,045 1,142,638 616,407 402,628 24,604 378,024 Leasehold Improvements 441,835 250,207 191,628
(2,598,319)$ (3,065,963)$ 467,644$ Inc(Dec) in Fixed Assets (C) (1,570,411)$ (3,425,710)$ 1,855,299$
119,936,764$ 131,725,257$ (11,788,493)$ Total Budget (B + C) 168,955,588$ 177,057,512$ (8,101,924)$
19,260,594$ 7,386,964$ 11,873,631$ Change in Working Capital (A‐B‐C) 2,386,055$ (5,700,718)$ 8,086,773$
656.5 701.6 (45.1) FTEs 668.4 711.8 (43.5)
33,582,463 25,231,926 8,350,537 Beginning Working Capital 1/1/12 33,582,463 25,780,217 7,802,246 19,260,594 7,386,965 11,873,630 Change in Working Capital 2,386,055 (5,700,717) 8,086,772 52,843,057 32,618,891 20,224,167 Working Capital Balance 35,968,518 20,079,500 15,889,017
CONSOLIDATED EROStatement of Activities, Fixed Assets and Change in Working Capital
As of September 30, 2012(Unaudited)
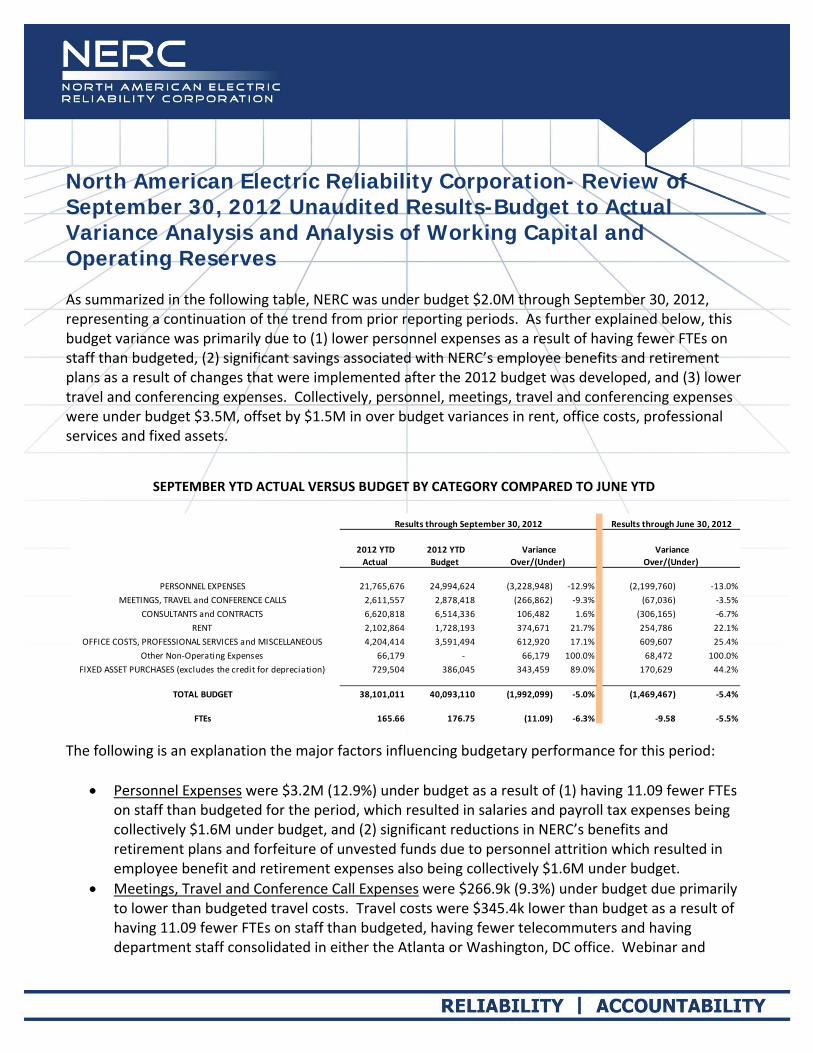
North American Electric Reliability Corporation- Review of September 30, 2012 Unaudited Results-Budget to Actual Variance Analysis and Analysis of Working Capital and Operating Reserves As summarized in the following table, NERC was under budget $2.0M through September 30, 2012, representing a continuation of the trend from prior reporting periods. As further explained below, this budget variance was primarily due to (1) lower personnel expenses as a result of having fewer FTEs on staff than budgeted, (2) significant savings associated with NERC’s employee benefits and retirement plans as a result of changes that were implemented after the 2012 budget was developed, and (3) lower travel and conferencing expenses. Collectively, personnel, meetings, travel and conferencing expenses were under budget $3.5M, offset by $1.5M in over budget variances in rent, office costs, professional services and fixed assets.
SEPTEMBER YTD ACTUAL VERSUS BUDGET BY CATEGORY COMPARED TO JUNE YTD
The following is an explanation the major factors influencing budgetary performance for this period:
Personnel Expenses were $3.2M (12.9%) under budget as a result of (1) having 11.09 fewer FTEs on staff than budgeted for the period, which resulted in salaries and payroll tax expenses being collectively $1.6M under budget, and (2) significant reductions in NERC’s benefits and retirement plans and forfeiture of unvested funds due to personnel attrition which resulted in employee benefit and retirement expenses also being collectively $1.6M under budget.
Meetings, Travel and Conference Call Expenses were $266.9k (9.3%) under budget due primarily to lower than budgeted travel costs. Travel costs were $345.4k lower than budget as a result of having 11.09 fewer FTEs on staff than budgeted, having fewer telecommuters and having department staff consolidated in either the Atlanta or Washington, DC office. Webinar and
2012 YTD
Actual
2012 YTD
Budget
PERSONNEL EXPENSES 21,765,676 24,994,624 (3,228,948) ‐12.9% (2,199,760) ‐13.0%
MEETINGS, TRAVEL and CONFERENCE CALLS 2,611,557 2,878,418 (266,862) ‐9.3% (67,036) ‐3.5%
CONSULTANTS and CONTRACTS 6,620,818 6,514,336 106,482 1.6% (306,165) ‐6.7%
RENT 2,102,864 1,728,193 374,671 21.7% 254,786 22.1%
OFFICE COSTS, PROFESSIONAL SERVICES and MISCELLANEOUS 4,204,414 3,591,494 612,920 17.1% 609,607 25.4%
Other Non‐Operating Expenses 66,179 ‐ 66,179 100.0% 68,472 100.0%
FIXED ASSET PURCHASES (excludes the credit for depreciation) 729,504 386,045 343,459 89.0% 170,629 44.2%
TOTAL BUDGET 38,101,011 40,093,110 (1,992,099) ‐5.0% (1,469,467) ‐5.4%
FTEs 165.66 176.75 (11.09) ‐6.3% ‐9.58 ‐5.5%
Results through June 30, 2012Results through September 30, 2012
Variance
Over/(Under)
Variance
Over/(Under)
Review of September 30, 2012 Unaudited Results-Budget to Actual Variance Analysis and Analysis of Working Capital and Operating Reserves
2
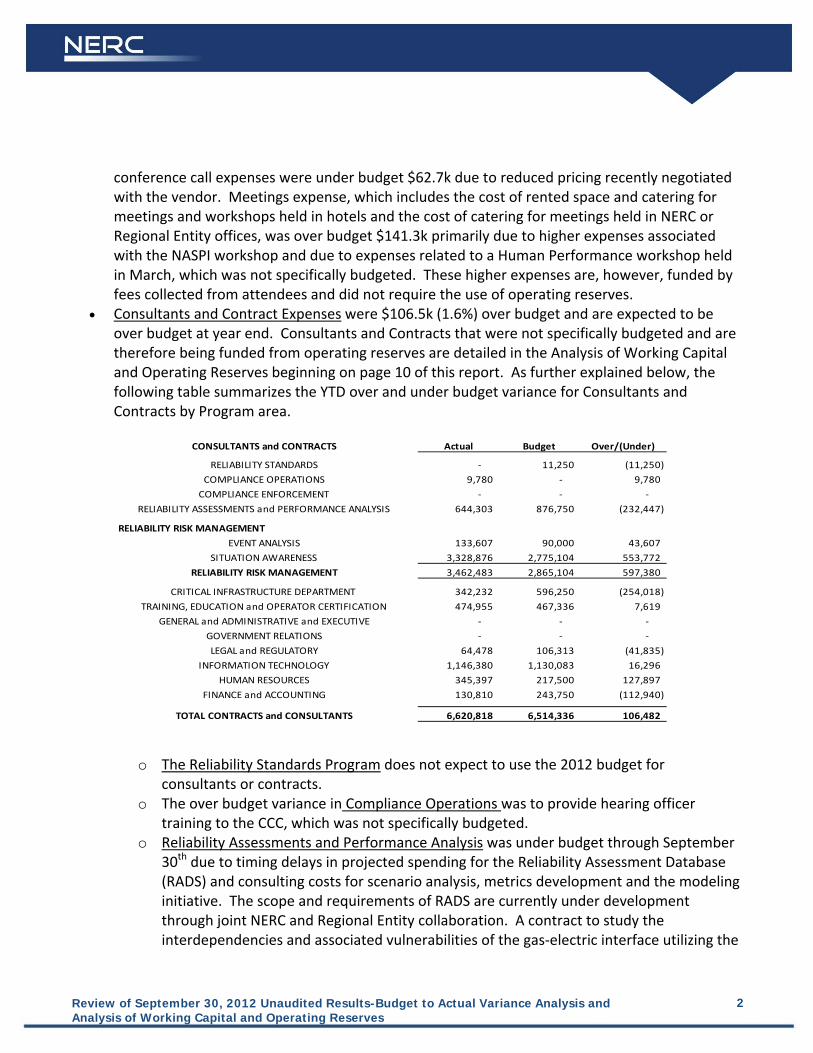
conference call expenses were under budget $62.7k due to reduced pricing recently negotiated with the vendor. Meetings expense, which includes the cost of rented space and catering for meetings and workshops held in hotels and the cost of catering for meetings held in NERC or Regional Entity offices, was over budget $141.3k primarily due to higher expenses associated with the NASPI workshop and due to expenses related to a Human Performance workshop held in March, which was not specifically budgeted. These higher expenses are, however, funded by fees collected from attendees and did not require the use of operating reserves.
Consultants and Contract Expenses were $106.5k (1.6%) over budget and are expected to be over budget at year end. Consultants and Contracts that were not specifically budgeted and are therefore being funded from operating reserves are detailed in the Analysis of Working Capital and Operating Reserves beginning on page 10 of this report. As further explained below, the following table summarizes the YTD over and under budget variance for Consultants and Contracts by Program area.
o The Reliability Standards Program does not expect to use the 2012 budget for consultants or contracts.
o The over budget variance in Compliance Operations was to provide hearing officer training to the CCC, which was not specifically budgeted.
o Reliability Assessments and Performance Analysis was under budget through September 30th due to timing delays in projected spending for the Reliability Assessment Database (RADS) and consulting costs for scenario analysis, metrics development and the modeling initiative. The scope and requirements of RADS are currently under development through joint NERC and Regional Entity collaboration. A contract to study the interdependencies and associated vulnerabilities of the gas‐electric interface utilizing the
CONSULTANTS and CONTRACTS Actual Budget Over/(Under)
RELIABILITY STANDARDS ‐ 11,250 (11,250)
COMPLIANCE OPERATIONS 9,780 ‐ 9,780
COMPLIANCE ENFORCEMENT ‐ ‐ ‐
RELIABILITY ASSESSMENTS and PERFORMANCE ANALYSIS 644,303 876,750 (232,447)
RELIABILITY RISK MANAGEMENT
EVENT ANALYSIS 133,607 90,000 43,607
SITUATION AWARENESS 3,328,876 2,775,104 553,772
RELIABILITY RISK MANAGEMENT 3,462,483 2,865,104 597,380
CRITICAL INFRASTRUCTURE DEPARTMENT 342,232 596,250 (254,018)
TRAINING, EDUCATION and OPERATOR CERTIFICATION 474,955 467,336 7,619
GENERAL and ADMINISTRATIVE and EXECUTIVE ‐ ‐ ‐
GOVERNMENT RELATIONS ‐ ‐ ‐
LEGAL and REGULATORY 64,478 106,313 (41,835)
INFORMATION TECHNOLOGY 1,146,380 1,130,083 16,296
HUMAN RESOURCES 345,397 217,500 127,897
FINANCE and ACCOUNTING 130,810 243,750 (112,940)
TOTAL CONTRACTS and CONSULTANTS 6,620,818 6,514,336 106,482
Review of September 30, 2012 Unaudited Results-Budget to Actual Variance Analysis and Analysis of Working Capital and Operating Reserves
3
scenario analysis budget currently under review by the Legal department. A contract has been executed to provide training and consulting services on dynamic stability modeling utilizing funding budgeted for the modeling initiative. Due to a reprioritization of reliability risk projects, a contract for metrics development will not be executed and the $75k budgeted will be reallocated to fund a change order to the GADS database contract to enable more consistent and efficient reporting and metrics display across all NERC data, assist reporting entities in more timely review of the data and provide high value information for risk analysis.
o The over budget variance in Event Analysis is related to the investigation of the southwest blackout event.
o Situation Awareness The NASPI project, which is primarily related to the company’s contract with the Grid
Protection Alliance (GPA), was over budget approximately $148.8k through September 30, 2012, and is expected to be over budget $248k at year end as a result of the carryover of unused 2011 contractual co‐funding commitments for the SIEGate Project pursuant to the terms of NERC’s contract with GPA for this project. This carryover was not anticipated at the time the budget was prepared and total costs of the SIE Gate project remain on budget and are capped pursuant to the contract terms.
The SAFNR contract was approximately $177.9k over budget through September 30, 2012, and is expected to be approximately $175.5k higher than budget at year end, primarily due to the costs of additional user licensing and maintenance fees.
The contract for the secure alert system was under budget $104.4k YTD due to the elimination of a portion of the contract that provided help desk support, which is now performed by NERC staff, and due to delays in utilizing the amount budgeted for changes to the system. Management is currently evaluating responses to an RFP to replace the current system. The RFP responses came in significantly in excess of budget for 2013 and management is evaluating options to reduce costs, including options to phase in of functionality over time..
The expense for various reliability monitoring tools was $40k under budget YTD and is projected to be $40k under budget at year end due to the elimination of the contract for Control Performance Standard 1 and Balancing Authority ACE Limits (CPS1‐BAAL).
The IDC contract was approximately $213.2 over budget YTD, and is projected to be $215.9k over budget at year end due to costs associated with the “generation to load reporting” change order and the incentive availability performance component which were planned but not included in the 2012 budget . NERC has issued a notice of termination of its IDC contract, effective in the second quarter of 2013 and is working with the vendor and users to transition this service to an end user funded model.
The cost of NERCnet was $163.3k over budget due to unresolved billing errors which we continue to attempt to work with Verizon to correct and which, depending on the
Review of September 30, 2012 Unaudited Results-Budget to Actual Variance Analysis and Analysis of Working Capital and Operating Reserves
4
outcome of these efforts, could be resolved and the additional projected costs eliminated prior to the end of the year. NERCnet is primarily used to support the secure communication of Reliability Coordinator data. Management is evaluating options to replace NERCnet with communication support provided by another vendor or negotiate alternative arrangements with Verizon, which is in the process of upgrading portions of the network its uses to provide this service.
o Critical Infrastructure Department ES‐ISAC contracts were under budget $229.0k through September 30, 2012 and
are projected to be $192.7k under budget at year end. The contract for the secure portal platform development was under budget $70.0k, primarily due to timing and is expected to be at budget at year end. Various contracts have been executed to provide support for Aurora webinars and reports, ICS cyber situational awareness reporting, and for building a comprehensive threat model, utilizing $107.7k of the $250k budgeted for cyber security analyst support and bi‐directional information sharing with US‐CERT, resulting in the under budget projection of approximately $192.7k for consultants and contracts expense for the ES‐ISAC.
Additional contracts to provide ESCC support, NIST/DOE risk guidelines, and cyber risk preparedness assessment support were collectively $25.0k under budget YTD, but are projected to be at or close to budget at year end.
o The Information Technology department continues to manage numerous critical projects supporting operating area needs, including document synchronization, security assessments, vulnerability testing, redesign and deployment of NERC’s public website, SQL database assessment, and upgrades to the standards balloting software and the C‐RATS database. A new time and materials contract with Dell was signed in October to assist with the evaluation and migration of certain software applications from the legacy NERC data center in Princeton to NERC’s new data center in Atlanta. This contract has a cap of $248.9k, has been approved by the President and Chief Executive Officer and will be funded from available operating reserves. An update on the progress being made regarding the transfer of necessary applications will be provided under item 8 of the FAC agenda, as well as at the Standards Oversight and Technology Committee meeting in November.
o The over budget variance in the Human Resources department is related to compensation and benefit consulting services which were not specifically budgeted in 2012, as well as higher than budgeted executive recruiting costs related to the search for a Chief Operating Officer and a Vice‐President and Director of Reliability Assessments and Performance Analysis.
o Finance and Accounting was under budget $112.9k due to timing. Contracts have been executed and are in progress to provide support for regional CIP audit oversight, review of NERC audit oversight and review of the NERC audit process. The under budget

Review of September 30, 2012 Unaudited Results-Budget to Actual Variance Analysis and Analysis of Working Capital and Operating Reserves
5
variance due to the timing of these contracts was offset by contract support for systems evaluation, implementation support, and improved reporting efficiencies of existing systems as follow up to the FERC audit, which were not specifically budgeted.
Rent was over budget $374.7k (21.7%) due to a change in the accounting for the cash contribution from the landlord at 1325G Street. For budget purposes, the cash contribution was treated as a credit against rent expense in 2012 only, but for accounting purposes is now amortized over the life of the lease. This non‐cash over budget variance is offset by lower than budgeted rent expense that is the cumulative result of the partial buy‐out of the Princeton lease and the sub‐lease agreements in Princeton and Washington, D.C.
Office Costs, Professional Services and Miscellaneous Expenses were $612.9k (17.1%) over budget.
o Office Costs were $195.1k over budget primarily due to higher than budgeted telephone and internet expenses. Internet expenses are exceeding budget due to the delay associated with relocation of remaining applications from the Princeton data center.
o Professional Services were $423.2k over budget primarily due to $445.5k in legal fees associated with the FERC audit, which was not budgeted.
Other Non‐Operating Expenses reflect costs to relocate of files from NERC’s DC office at 1120 G Street to the new office at 1325 G Street, costs to ship equipment from Princeton to Atlanta and property tax expense paid in Fulton County, GA, which was not budgeted. Management was unaware at the time the 2012 budget was prepared that the company would be required to pay property taxes on the net book value of assets located in the Atlanta office and data center, which are both located in Fulton County, Georgia.
Fixed Asset Purchases were $343.5k (88.9%) over budget through September 30th. This budget overrun is partially due to timing of budgeted purchases of computers, software and equipment, as well as the cost of leasehold improvements in the Atlanta and DC offices which were completed in 2011 but not recorded until 2012 pending final reconciliation of the excess tenant improvement allowance following completion of all construction.
2012 YEAR‐END PROJECTION VERSUS BUDGET BY CATEGORY
NERC is projecting to be approximately $838.5k (1.6%) under budget for total expenses and fixed assets at year end, as compared to the June 30, 2012 report which projected NERC would be $1.4M (2.7%) under budget at year end, an increase of $610.6k. This increase in total expenses and fixed assets is offset by a $48.2k projected increase in total funding, resulting in a $562.4k reduction in the projected ending Working Capital and Operating Reserve balance at December 31, 2012, as included in NERC’s 2013 Business Plan and Budget1. Notwithstanding this projected reduction in available Working Capital and Operating Reserves for 2013, management is monitoring a number of variables
1 The year-end projection included in the Second Quarter 2012 Variance Report was also the basis for the Working Capital and Operating Reserve Analysis in NERC’s 2013 Business Plan and Budget.
Review of September 30, 2012 Unaudited Results-Budget to Actual Variance Analysis and Analysis of Working Capital and Operating Reserves
6
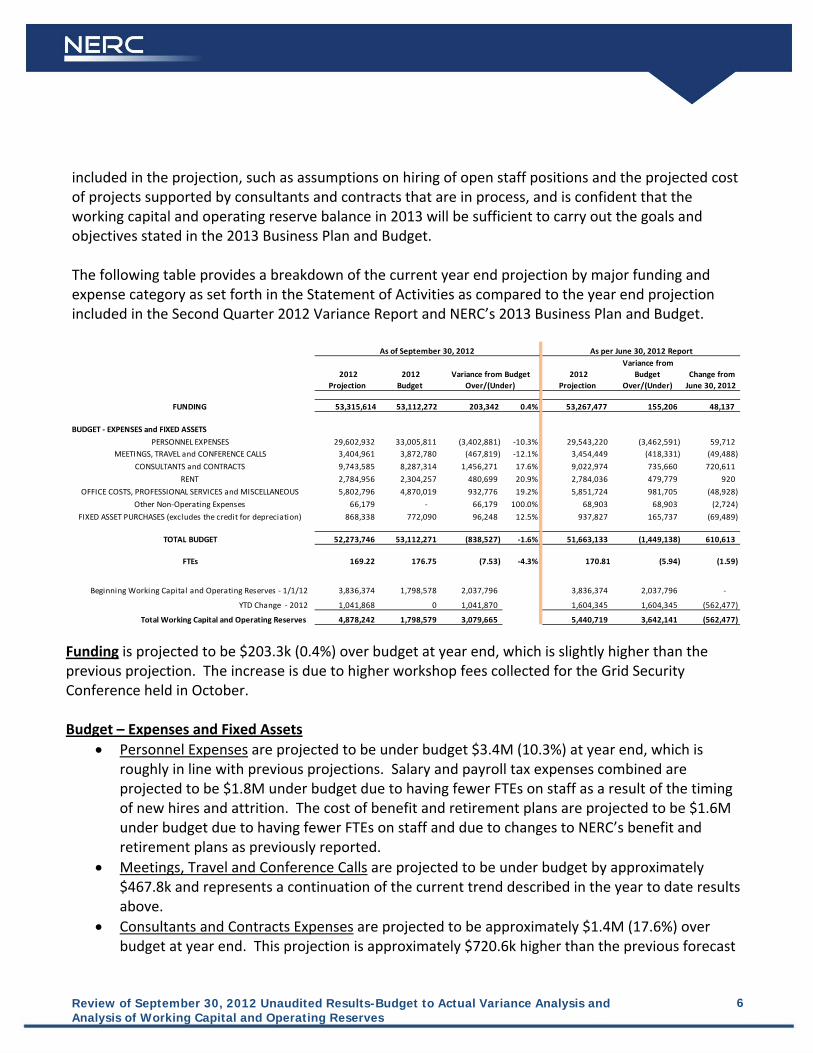
included in the projection, such as assumptions on hiring of open staff positions and the projected cost of projects supported by consultants and contracts that are in process, and is confident that the working capital and operating reserve balance in 2013 will be sufficient to carry out the goals and objectives stated in the 2013 Business Plan and Budget. The following table provides a breakdown of the current year end projection by major funding and expense category as set forth in the Statement of Activities as compared to the year end projection included in the Second Quarter 2012 Variance Report and NERC’s 2013 Business Plan and Budget.
Funding is projected to be $203.3k (0.4%) over budget at year end, which is slightly higher than the previous projection. The increase is due to higher workshop fees collected for the Grid Security Conference held in October. Budget – Expenses and Fixed Assets
Personnel Expenses are projected to be under budget $3.4M (10.3%) at year end, which is roughly in line with previous projections. Salary and payroll tax expenses combined are projected to be $1.8M under budget due to having fewer FTEs on staff as a result of the timing of new hires and attrition. The cost of benefit and retirement plans are projected to be $1.6M under budget due to having fewer FTEs on staff and due to changes to NERC’s benefit and retirement plans as previously reported.
Meetings, Travel and Conference Calls are projected to be under budget by approximately $467.8k and represents a continuation of the current trend described in the year to date results above.
Consultants and Contracts Expenses are projected to be approximately $1.4M (17.6%) over budget at year end. This projection is approximately $720.6k higher than the previous forecast
2012
Projection
2012
Budget
2012
Projection
Variance from
Budget
Over/(Under)
Change from
June 30, 2012
FUNDING 53,315,614 53,112,272 203,342 0.4% 53,267,477 155,206 48,137
BUDGET ‐ EXPENSES and FIXED ASSETS
PERSONNEL EXPENSES 29,602,932 33,005,811 (3,402,881) ‐10.3% 29,543,220 (3,462,591) 59,712 MEETINGS, TRAVEL and CONFERENCE CALLS 3,404,961 3,872,780 (467,819) ‐12.1% 3,454,449 (418,331) (49,488)
CONSULTANTS and CONTRACTS 9,743,585 8,287,314 1,456,271 17.6% 9,022,974 735,660 720,611
RENT 2,784,956 2,304,257 480,699 20.9% 2,784,036 479,779 920
OFFICE COSTS, PROFESSIONAL SERVICES and MISCELLANEOUS 5,802,796 4,870,019 932,776 19.2% 5,851,724 981,705 (48,928)
Other Non‐Operating Expenses 66,179 ‐ 66,179 100.0% 68,903 68,903 (2,724)
FIXED ASSET PURCHASES (excludes the credit for depreciation) 868,338 772,090 96,248 12.5% 937,827 165,737 (69,489)
TOTAL BUDGET 52,273,746 53,112,271 (838,527) ‐1.6% 51,663,133 (1,449,138) 610,613
FTEs 169.22 176.75 (7.53) ‐4.3% 170.81 (5.94) (1.59)
Beginning Working Capital and Operating Reserves ‐ 1/1/12 3,836,374 1,798,578 2,037,796 3,836,374 2,037,796 ‐
YTD Change ‐ 2012 1,041,868 0 1,041,870 1,604,345 1,604,345 (562,477)
Total Working Capital and Operating Reserves 4,878,242 1,798,579 3,079,665 5,440,719 3,642,141 (562,477)
Variance from Budget
Over/(Under)
As of September 30, 2012 As per June 30, 2012 Report
Review of September 30, 2012 Unaudited Results-Budget to Actual Variance Analysis and Analysis of Working Capital and Operating Reserves
7
and is due to an increase in the cost of budgeted contracts or the addition of new contracts not specifically budgeted as described below.
o Increases in the projected cost of budgeted contracts include: $75.5k for SAFNR due to the costs of additional user licensing and maintenance
fees $90k related to actual costs of NERCnet, which as previously described, includes
unresolved billing errors which we continue to attempt to work with Verizon to correct.
$53.2k for additional costs associated with the public website assessment, design and deployment
$194.8k for executive recruiting fees $39.0k additional costs related to the investigation of the southwest blackout
event o New contracts authorized that were not specifically budgeted:
A time and materials contract with Dell with a not to exceed of $248.9k to provide consulting services in connection with the relocation of the remaining applications in the Princeton data center to the Atlanta data center
$69.5k for contract employees to support ongoing operations due to staff vacancies
Rent is projected to be $480.7k over budget, which is consistent with the previous projection and YTD actual results as previously explained.
Office Costs, Professional Services and Miscellaneous expenses are projected to be $932.8k (19.2%) over budget at year end.
o Office Costs are projected to be $194.3k over budget primarily due to higher internet expenses related to the delay in transition of all software applications from the Princeton data center to the Atlanta data center.
o Professional Services are projected to be $755.6k over budget and includes $500k in outside legal fees associated with the FERC audit
Purchases of Fixed Assets, which excludes depreciation, are projected to be approximately
$96.2k (11%) over budget at year‐end, related to the cost of leasehold improvements, as previously described.

Review of September 30, 2012 Unaudited Results-Budget to Actual Variance Analysis and Analysis of Working Capital and Operating Reserves
8
BOARD OF TRUSTEES EXPENSES The following table provides actual and budgeted expenses of the Board of Trustees through September 30, 2012, and the projected 2012 expenses compared to the total 2012 budget. The amounts reflected in this table are included in the totals by expense category in the tables presented above. The projected over budget variance for expenses of the Board of Trustees is primarily due to higher trustee search fees than budgeted.
2012 YTD
Actual
2012 YTD
Budget
2012
Projection
2012
Budget
Board of Trustee Expenses
Meetings and Travel Expenses
Quarterly Board Meetings 153,286 168,000 (14,714) ‐8.8% 200,000 224,000 (24,000) ‐10.7%
Trustee Travel 107,861 82,500 25,361 30.7% 138,600 110,000 28,600 26.0%
Total Board of Trustees Meetings and Travel Expenses 261,147 250,500 10,647 4.3% 338,600 334,000 4,600 1.4%
Professional Services
Independent Trustee Fees 727,500 735,000 (7,500) ‐1.0% 970,000 980,000 (10,000) ‐1.0%
Trustee Search Fees ‐ ‐ ‐ 0.0% 147,600 75,000 72,600 96.8%
Total Board of Trustee Professional Services Expenses 727,500 735,000 (7,500) ‐1.0% 1,117,600 1,055,000 62,600 5.9%
Total Board of Trustee Expenses 988,647 985,500 3,147 0.3% 1,456,200 1,389,000 67,200 4.8%
Variance from Budget
Over/(Under)
Variance
Over/(Under)

Review of September 30, 2012 Unaudited Results-Budget to Actual Variance Analysis and Analysis of Working Capital and Operating Reserves
9
NORTH AMERICAN ELECTRIC RELIABILITY CORPORATION
Statement of Activities, Fixed Assets and Change in Working Capital (Unaudited)
For the period ended 09/30/2012
Review of September 30, 2012 Unaudited Results-Budget to Actual Variance Analysis and Analysis of Working Capital and Operating Reserves
10
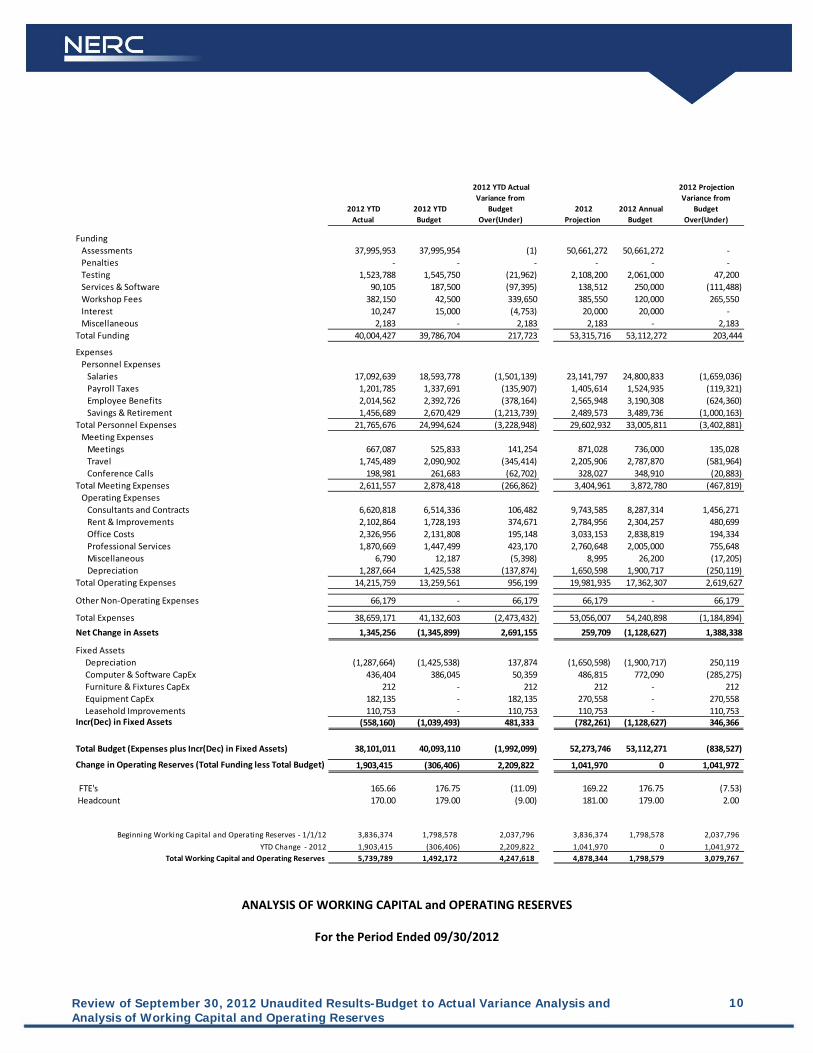
ANALYSIS OF WORKING CAPITAL and OPERATING RESERVES
For the Period Ended 09/30/2012
2012 YTD
Actual
2012 YTD
Budget
2012 YTD Actual
Variance from
Budget
Over(Under)
2012
Projection
2012 Annual
Budget
2012 Projection
Variance from
Budget
Over(Under)
Funding
Assessments 37,995,953 37,995,954 (1) 50,661,272 50,661,272 ‐ Penalties ‐ ‐ ‐ ‐ ‐ ‐ Testing 1,523,788 1,545,750 (21,962) 2,108,200 2,061,000 47,200 Services & Software 90,105 187,500 (97,395) 138,512 250,000 (111,488) Workshop Fees 382,150 42,500 339,650 385,550 120,000 265,550 Interest 10,247 15,000 (4,753) 20,000 20,000 ‐ Miscellaneous 2,183 ‐ 2,183 2,183 ‐ 2,183 Total Funding 40,004,427 39,786,704 217,723 53,315,716 53,112,272 203,444
Expenses
Personnel Expenses Salaries 17,092,639 18,593,778 (1,501,139) 23,141,797 24,800,833 (1,659,036) Payroll Taxes 1,201,785 1,337,691 (135,907) 1,405,614 1,524,935 (119,321) Employee Benefits 2,014,562 2,392,726 (378,164) 2,565,948 3,190,308 (624,360) Savings & Retirement 1,456,689 2,670,429 (1,213,739) 2,489,573 3,489,736 (1,000,163) Total Personnel Expenses 21,765,676 24,994,624 (3,228,948) 29,602,932 33,005,811 (3,402,881) Meeting Expenses Meetings 667,087 525,833 141,254 871,028 736,000 135,028 Travel 1,745,489 2,090,902 (345,414) 2,205,906 2,787,870 (581,964) Conference Calls 198,981 261,683 (62,702) 328,027 348,910 (20,883) Total Meeting Expenses 2,611,557 2,878,418 (266,862) 3,404,961 3,872,780 (467,819) Operating Expenses Consultants and Contracts 6,620,818 6,514,336 106,482 9,743,585 8,287,314 1,456,271 Rent & Improvements 2,102,864 1,728,193 374,671 2,784,956 2,304,257 480,699 Office Costs 2,326,956 2,131,808 195,148 3,033,153 2,838,819 194,334 Professional Services 1,870,669 1,447,499 423,170 2,760,648 2,005,000 755,648 Miscellaneous 6,790 12,187 (5,398) 8,995 26,200 (17,205) Depreciation 1,287,664 1,425,538 (137,874) 1,650,598 1,900,717 (250,119) Total Operating Expenses 14,215,759 13,259,561 956,199 19,981,935 17,362,307 2,619,627
Other Non‐Operating Expenses 66,179 ‐ 66,179 66,179 ‐ 66,179
Total Expenses 38,659,171 41,132,603 (2,473,432) 53,056,007 54,240,898 (1,184,894)
Net Change in Assets 1,345,256 (1,345,899) 2,691,155 259,709 (1,128,627) 1,388,338
Fixed Assets Depreciation (1,287,664) (1,425,538) 137,874 (1,650,598) (1,900,717) 250,119 Computer & Software CapEx 436,404 386,045 50,359 486,815 772,090 (285,275) Furniture & Fixtures CapEx 212 ‐ 212 212 ‐ 212 Equipment CapEx 182,135 ‐ 182,135 270,558 ‐ 270,558 Leasehold Improvements 110,753 ‐ 110,753 110,753 ‐ 110,753 Incr(Dec) in Fixed Assets (558,160) (1,039,493) 481,333 (782,261) (1,128,627) 346,366
Total Budget (Expenses plus Incr(Dec) in Fixed Assets) 38,101,011 40,093,110 (1,992,099) 52,273,746 53,112,271 (838,527)
Change in Operating Reserves (Total Funding less Total Budget) 1,903,415 (306,406) 2,209,822 1,041,970 0 1,041,972
FTE's 165.66 176.75 (11.09) 169.22 176.75 (7.53) Headcount 170.00 179.00 (9.00) 181.00 179.00 2.00
Beginning Working Capital and Operating Reserves ‐ 1/1/12 3,836,374 1,798,578 2,037,796 3,836,374 1,798,578 2,037,796
YTD Change ‐ 2012 1,903,415 (306,406) 2,209,822 1,041,970 0 1,041,972 Total Working Capital and Operating Reserves 5,739,789 1,492,172 4,247,618 4,878,344 1,798,579 3,079,767
Review of September 30, 2012 Unaudited Results-Budget to Actual Variance Analysis and Analysis of Working Capital and Operating Reserves
11
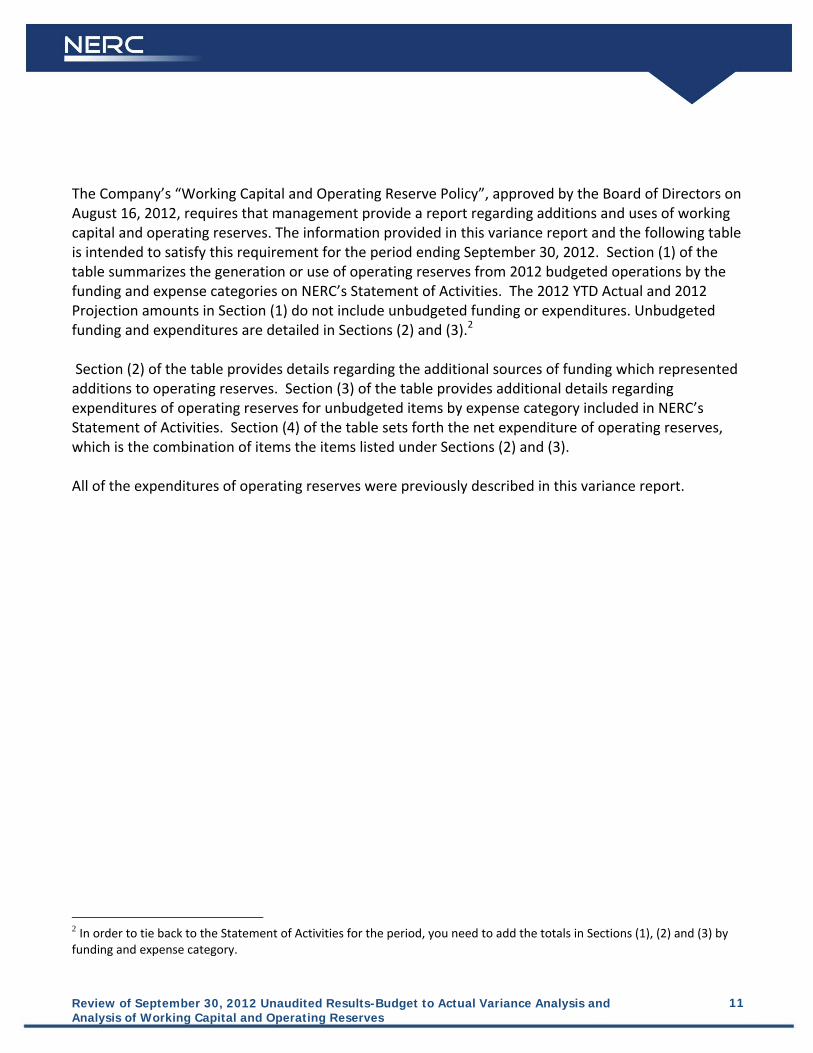
The Company’s “Working Capital and Operating Reserve Policy”, approved by the Board of Directors on August 16, 2012, requires that management provide a report regarding additions and uses of working capital and operating reserves. The information provided in this variance report and the following table is intended to satisfy this requirement for the period ending September 30, 2012. Section (1) of the table summarizes the generation or use of operating reserves from 2012 budgeted operations by the funding and expense categories on NERC’s Statement of Activities. The 2012 YTD Actual and 2012 Projection amounts in Section (1) do not include unbudgeted funding or expenditures. Unbudgeted funding and expenditures are detailed in Sections (2) and (3).2 Section (2) of the table provides details regarding the additional sources of funding which represented additions to operating reserves. Section (3) of the table provides additional details regarding expenditures of operating reserves for unbudgeted items by expense category included in NERC’s Statement of Activities. Section (4) of the table sets forth the net expenditure of operating reserves, which is the combination of items the items listed under Sections (2) and (3).
All of the expenditures of operating reserves were previously described in this variance report.
2 In order to tie back to the Statement of Activities for the period, you need to add the totals in Sections (1), (2) and (3) by funding and expense category.

Review of September 30, 2012 Unaudited Results-Budget to Actual Variance Analysis and Analysis of Working Capital and Operating Reserves
12
2012 YTD
Actual
2012 YTD
Budget
2012 YTD Actual
Variance from
Budget
Over(Under)
2012
Projection
2012 Annual
Budget
2012 Projection
Variance from
Budget
Over(Under)
Beginning Working Capital and Operating Reserves ‐ 1/1/12 3,836,374 1,798,578 2,037,796 3,836,374 1,798,578 2,037,796
(1) Generation (Use) of Operating Reserves from Budgeted Operations
Funding 39,843,927 39,786,704 57,223 53,151,866 53,112,272 39,594
Personnel (21,765,676) (24,994,624) 3,228,948 (29,602,932) (33,005,811) 3,402,881 Meetings, Travel and Conference Calls (2,558,005) (2,878,418) 320,413 (3,256,410) (3,872,780) 616,370
Operating Expenses (13,408,463) (13,259,561) (148,903) (18,527,460) (17,362,307) (1,165,152) Non‐Operating Expenses (0) ‐ (0) (0) ‐ (0) Inc(Dec) in Fixed Assets 668,913 1,039,493 (370,580) 893,013 1,128,627 (235,614)
Total Operating Reserves Generated(Used) from Budgeted Operations 2,780,694 (306,406) 3,087,101 2,658,078 0 2,658,079
(2) Additions to Operating Reserves
Fees collected from workshops not specifically budgeted
Human Performance Workshop 68,850 68,850 68,850 68,850 Grid Security Conference 91,650 91,650 95,000 95,000
Total Additions to Operating Reserves 160,500 ‐ 160,500 163,850 ‐ 163,850
(3) Expenditures of Operating Reserves
Meetings and Workshops
Human Performance Workshop (53,551) (53,551) (53,551) (53,551) Grid Security Conference ‐ (95,000) (95,000)
Subtotal (53,551) ‐ (53,551) (148,551) ‐ (148,551)
Contracts and Consultants
Hearing officer training for the CCC (9,780) (9,780) (9,780) (9,780) System Operator Database Upgrade (120,107) (120,107) (266,810) (266,810)
Relocation of Princeton Software Applications ‐ ‐ (248,869) (248,869) GADS Change Order #2 ‐ ‐ (100,000) (100,000)
Contract employees due to staff vacancies (22,708) (22,708) (69,468) (69,468) Compensation Studies (137,597) (137,597) (146,000) (146,000) Audit Implementation (58,052) (58,052) (100,000) (100,000)
Improve reporting efficiencies of existing accounting systems (13,548) (13,548) (13,548) (13,548) Subtotal (361,792) ‐ (361,792) (954,475) ‐ (954,475)
Operating Expenses
Professional Services ‐ Audit (445,504) (445,504) (500,000) (500,000) Subtotal (445,504) ‐ (445,504) (500,000) ‐ (500,000)
Other Non‐Operating Expenses
Fulton County Property Taxes (51,008) ‐ (51,008) (51,008) ‐ (51,008) Shipment of fi les and equipment to new office locations (15,171) (15,171) (15,171) (15,171)
Subtotal (66,179) ‐ (66,179) (66,179) ‐ (66,179)
Fixed Assets
Leasehold Improvements (110,753) ‐ (110,753) (110,753) ‐ (110,753) Subtotal (110,753) ‐ (110,753) (110,753) ‐ (110,753)
Total Expenditure of Operating Reserves (1,037,779) ‐ (1,037,779) (1,779,958) ‐ (1,779,958)
(4) Net Expenditure of Operating Reserves (877,279) ‐ (877,279) (1,616,108) ‐ (1,616,108)
TOTAL Operating Reserves
Beginning Balance 1/1/2012 3,836,374 1,798,578 2,037,796 3,836,374 1,798,578 2,037,796 Generation (Use) from Budgeted Operations 2,780,694 (306,406) 3,087,101 2,658,078 0 2,658,079 Generation (Use) from Unbudget Operations (877,279) ‐ (877,279) (1,616,108) ‐ (1,616,108)
5,739,789 1,492,172 4,247,618 4,878,344 1,798,579 3,079,767
FloRron ReLrRarLry CoonoruRrrruo Couucu, lruc.
1408 N. Wesrsnone Buvo., Surre 1002
TRueA, Flonron 33607-451 2
PHo¡re 813.289.5644 . Fnx 813.289.5646w\ /vv.FRcc.coMFlorido Reliobility Coordinoting Council, lnc,
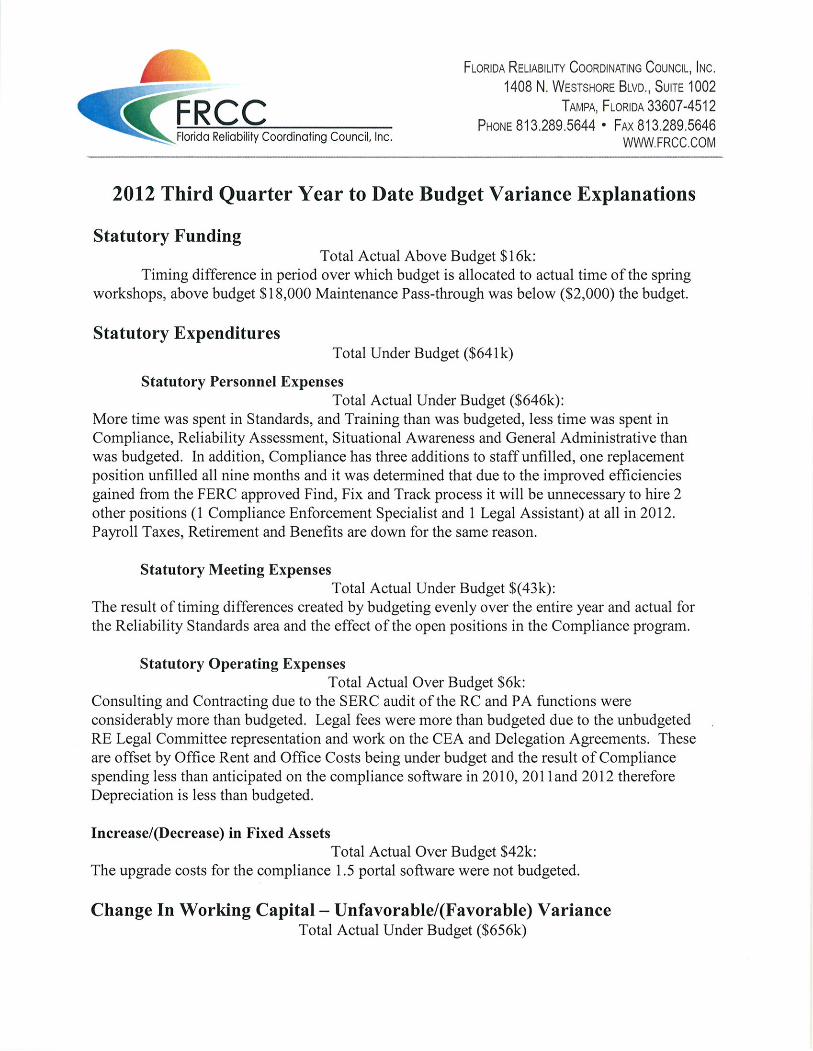
2012 Third Quarter Year to Date Budget Variance Explanations
Statutory FundingTotal Actual Above Budget $l6k:
Timing difference in period over which budget is allocated to actual time of the springworkshops, above budget $ 18,000 Maintenance Pass-through was below ($2,000) the budget.
Statutory ExpendituresTotal Under Budget ($641k)
Statutory Personnel ExpensesTotal Actual Under Budget ($6a6k):
More time was spent in Standards, and Training than was budgeted, less time was spent inCompliance, Reliability Assessment, Situational Awareness and General Administrative thanwas budgeted. In addition, Compliance has three additions to staff unfilled, one replacementposition unfilled all nine months and it was determined that due to the improved effrcienciesgained from the FERC approved Find, Fix and Track process it will be unnecessary to hire2other positions (1 Compliance Enforcement Specialist and I Legal Assistant) at all in 2012.Payroll Taxes, Retirement and Benefits are down for the same reason.
Statutory Meeting ExpensesTotal Actual Under Budget $(a3k):
The result of timing differences created by budgeting evenly over the entire year and actual forthe Reliability Standards area and the effect of the open positions in the Compliance program.
Statutory Operating ExpensesTotal Actual Over Budget $6k:
Consulting and Contracting due to the SERC audit of the RC and PA functions wereconsiderably more than budgeted. Legal fees were more than budgeted due to the unbudgetedRE Legal Committee representation and work on the CEA and Delegation Agreements. Theseare offset by Office Rent and Office Costs being under budget and the result of Compliancespending less than anticipated on the compliance software in 2010, 201land 2012 thereforeDepreciation is less than budgeted.
Increase/(Decrease) in Fixed AssetsTotal Actual Over Budget $42k:
The upgrade costs for the compliance 1.5 portal software were not budgeted.
Change In Working Capital - Unfavorable/(Favorable) VarianceTotal Actual Under Budget ($656k)
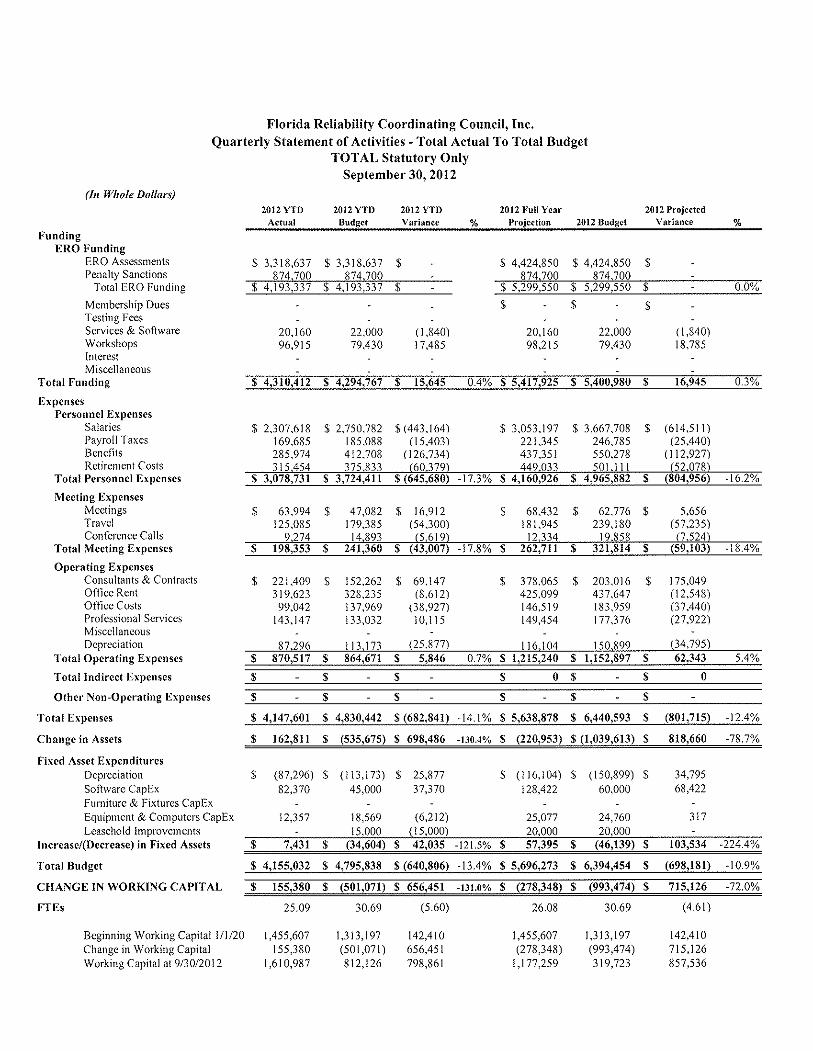
Florida Reliability Coordinating Council, Inc.
Quarterly Statement of Activities - Total Actual To Total BudgetTOTAL Statutory Only
September 30,2012
2O!2YTD 2OI2YTD 2()I2YTD 2012 Full YearActuål Budset Verlance olo Proiection 2012 Budeet
2012 ProjectedVerience %
$ 3,3 l 8,637 $ 3,31 8,637 $ $ 4,424,850 $ 4,424,850
-$$20,1ó0 22,000 ( l,840)98,2_t5 79,4-30 18,785
$ 3,053,197 $ 3,6ó7,708 $ (6l4,sll)22t,34s 246,785 Qs,440\437,351 550,278 (L12,927)
20, r ó09ó,9 r 5
22,Q00 ( r,840)79,4-30 r 7,485
$ 4,310,412 $ 4,294,767 $ 15'645 0.4o/o $ 5,417,925 S 5'400,980 $ 16'945 0.3o/o
$ 2,307,618 S 2,750:182 $ (443,ró4)r69,685 r8s,088 05,403)285,974 4t2,708 fi26,734\
$ 63,994 $125,085
47,082 $t79,385
t6,912(54.300)
$ 68,432 $ 62,776 $181,945 239,t80
5.65667.235\
(In ll/hole Dollars)
FundingERO Funding
ERO AssessmentsPenalty Sanctions
Total ERO Funding
Membership DuesTesting Fees
Services & SoftwareWorkshopsInterestMiscellaneous
Total Funding
ExpensesPersonnel Expenses
SalariesPayroll TaxesBenefitsRetirement Costs
Total Personnel Expenses
Meeting ExpensesMeetingsTravelConference Calls
Total Meeting Expenses
Operating ExpensesConsultants & ContractsOffice RentOffice CostsProfessional ServicesMiscellaneousDepreciation
Total Operating Expenses
Total lndirect Expenses
Other Non-Operât¡ng Expenses
Total Expenses
Change in Assets
Fixed Asset ExpendituresDepreciationSoftware CapExFumiture & Fixtures CapExEquipment & Computers CapExLeasehold Improvements
Increase(Decrease) in Fixed Assets
Total Budget
CHANGE IN WORKING CAPITAL
$ 22t,409 $ ts2,262 S 69,t473t9,623 328,23s (8,612)99,042 t37,969 (38,927)
t43,147 133,032 l0,l 15
8'7 .296 il 1. r 73 (25.877\
s 378,0ó5 $ 203,01ó $425,099 437,647r4ó,5r9 183,959149,454 t77,376
I l6 lô4 I 50.8c)c)
r 75,049( r 2.s48)(37,440).
Q7,922)
(34,79s)
$ 870.517 $ 864.671 $ 5.846 0.7% $ 1.215.240 $ 1.152,897 $ 62,343 5.40/o
0$
$ 4,147,601 $ 4,830,442 $ (ó82,841) -14.1% $ 5,638,878 $ ó,440,593 S (801,715) -l2.4ozo
$ 162,8ll $ (535,675) $ 698,486 -r¡0.¿y" $ (220,953) $ (1,039,ó13) $ 818,660 -78.7%
s (87,29ó) S
82,370
t2,357
(r r3,r73) s45,000
r 8,5ó9
25,87737,370
(6,2t2)
(rs0,8e9) só0,000
24,760
34,79568,422
317
s (r r6,r04) s128,422
25,077I
7,431 $ (34.604) $ 42.035 -r2t.50/o $ 57.395 $ (46,139) $ I -224.4%
4.155.032 S 4.795.838 $ 1640.8061 -13.4o/o S 5.696.273 $ 6.394.454 $ (698.181) -t0.9%
s
s
FTEs
Beginning Working Capital l/l/20Change in Working CapitalWorking Capital at 9/30/2012
30.69 (s.60)
t,313,t97 t42,4t0(501,07r) 6s6,4st8t2,t26 798,8ó r
26.08 30.69
t,455,607 t,3t3,197(278,348) (993,474)
t.177 .259 319,723
25.09
1,455,607t 55,380
I,6t 0,987
(4.61)
t42,4t0715,t26857,536
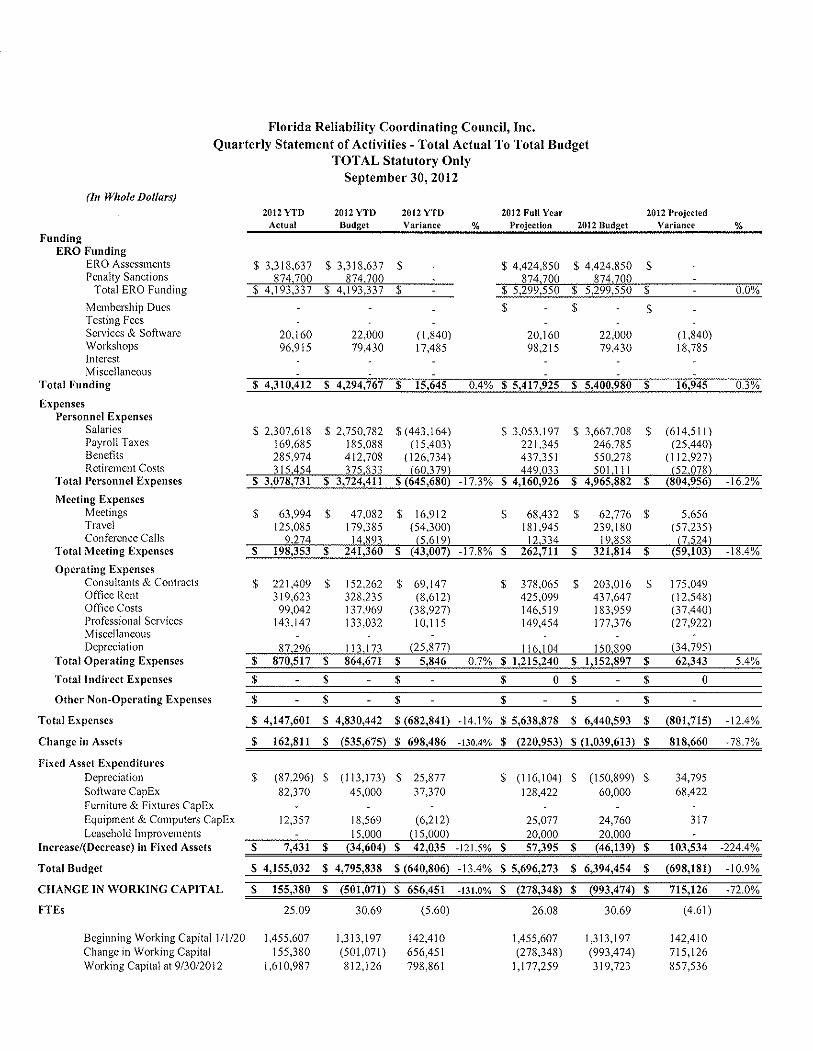
Florida Reliability Coordinating Council, Inc.
Quarterly Statement of Activities - Total Actual To Total BudgetTOTAL Statutory Only
September 30,2012
2OI2YTD 2OI2YTD 2OI2YTDBudget Variance o/o
2012 Full YearProJectlon 2012 Budget
2012 ProJected
Variance %
$ 3,318,637 $ 3,318,ó37 S $ 4,424,850 $ 4,424,850 $
20,r 6096,915
22,000 ( 1.840)79,4-30 17,485
$$20.r 6098,2 t 5
22,00079,4_30
( r ,840)t 8,785
$ 2,307,618 $ 2,7s0,782 $ (443,164)r 69,685 185,088 ( 15,403)285,974 4t2,708 026;134\
$ 3,053,r97 $ 3,óó7,708 $ (6r4,5ll)22t,34s 246,78s (2s,440)437,35t s50,278 (n2,927)
(In llhole Dollørs)
FundingERO Funding
ERO AssessmentsPenalty Sanctions
Total ERO Funding
Membership DuesTesting Fees
Services & SoftwareWorkshopsInterestMiscellaneous
Total Funding
ExpensesPersonnel Expenses
SalariesPayroll TaxesBenefitsRetirement Costs
Total Personnel Expenses
Meeting ExpensesMeetingsTravelConference Calls
Total Meeting Expenses
Operating ExpensesConsultants & ContractsOfïìce RentOffice CostsProfessional ServicesMiscellaneousDepreciation
Total Operating Expenses
Total Indirect Expenses
Other Non-Operating Expenses
Total Expenscs
Changc in Assets
Fixed Asset ExpendituresDepreciationSoflware CapExFumiture & Fixtures CapExEquipment & Computers CapExLeasehold Improvements
Increase(Decrease) in Fixed Assets
Total Budget
$ 63,994 $125,085
$ r ó,912(54,300)
$ 68,432181.945
s 62,776 $239. I 80
5,656(s7,23s\
47,082I 79,385
s 221,409 $3t9,62399,042
t43,147
s 69,t47(8,612)
(38,927\l0,ll5
$ 378,065 S
425,099t46.5t9t49,454
203,0 r 6 $437,64"1t 83,959177,376
t75.049( r 2,548)(37,440\(27,922\
152,262328,235137,969t33,032
77
t7s l$ 0.7% $ t.zt $1 5.4%
0$
$ 4,147,ó01 $ 4,830,442 $(682,841) -t4.1% S 5,ó38,878 $ 6,440,593 $ (801,715) -12.4%
$ 162,8ll $ (535,ó75) $ 698,486 -l¡0.¿ø $ (220,953) $ (1,039,613) $ 818,660 -78.7%
s (87,296) S (1r3,r73) S 25,877 s (lló,104) s (r50,899) s 34,79s
t28.422 ó0.000 68,42282,370
t2,357
45,000 37,370
18,s69 (6,2t2) zs,otl 24,760 3t7
t,3t3,t97 t42,4t0(993,474) 715,t26319.723 857.536
- 15,000 (15,000) 20,000 20,000 -s 7,a31 $ <3a,ó0al s
s 4,155,032 S 4,795,838 $ (640,806) -13.4% $ 5,ó9ó,273 S 6,394,454 $ (698,181) -10.9%
CHANGE IN WORKING CAPITAL
FTEs 2s.09 30.69 (5.60) 26.08 30.69 (4.ól)
Beginning Working Capital l/l/20 1,455,607 1,313,197 142,410change in working capital 155,380 (501,071) 656,451Working Capitalat 9/30/2012 1,610,987 812,126 798,8ól
1,455,607(278,348)
I,177,259
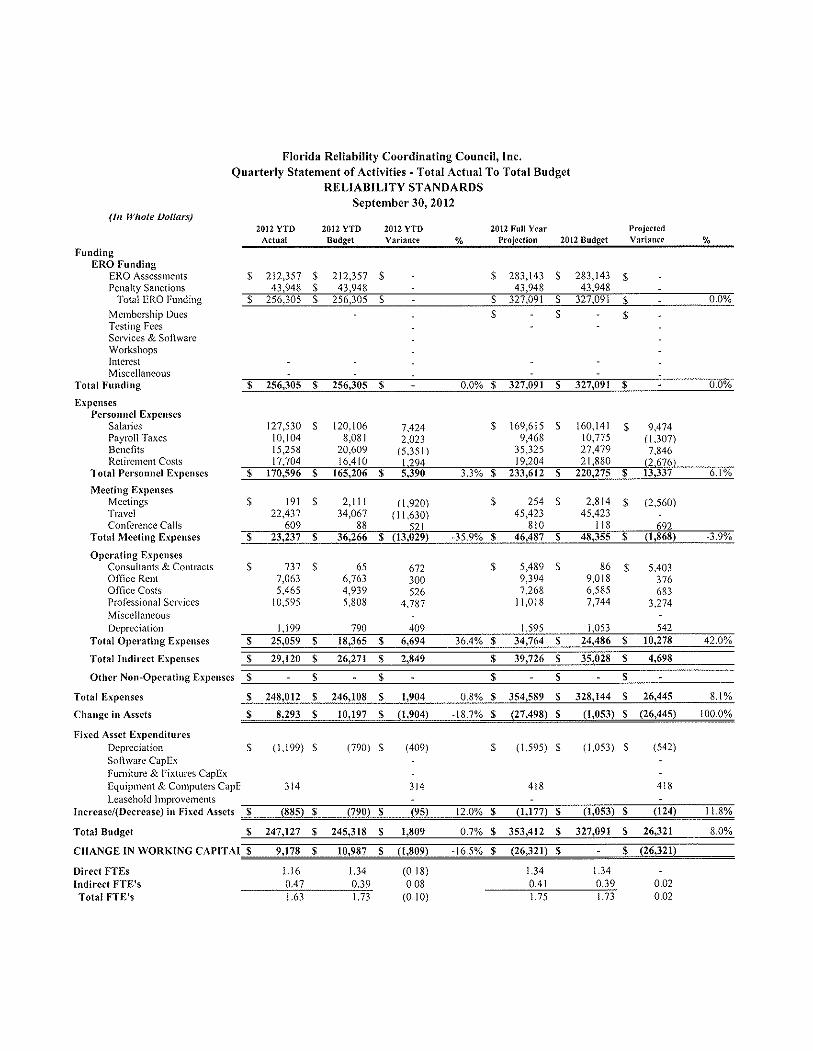
(In Whole Dollars)
Funding
Florida Reliability Coordinating Council, Inc.
Quarterly Statement of Activities - Total Actual To Total BudgetRELIABILITY STANDARDS
September 30,2012
2012 YTD 2012 YTD 2012 YTD 2012 Full Year ProjectedActuâl Budget Vâr¡ance o/o ProJection 2012 Budget Vâriânce
s 2t2,35'l 2t2,357 S s 283,143 S 283,143 s43.948 43.948 43.948 43.948
t27,530 S
r 0,1 0415,258
1 20,1 068,081
20,609
I 69,61 5 S
9,46835,325
t60,l4lt0,'7't 5
27,4'19
s 9.474( r.307)'1.846
7,424 s2,023
(5.3s I )
ERO FundingERO Assess¡nentsPenalty Sanctions
Total ERO Funding
Mernbenhip DuesTesting Fees
Services & SoftwareWorkshopsInlerestMiscellaneous
Totâl Funding
ExpensesPerso¡rnel Expenses
SalariesPayroll TaxesBenefitsRetirement Costs
Total Personnel Expenses
Meeting ExpensesMeetingsTravelConlerence Calls
Total Mceting Expenses
Opcrating ExpensesConsultants & ContractsOffice RentOfñce CostsProlèssional Services
MiscellaneousDepreciation
Total Operating Expenses
Total Indirect Expenses
Other Non-Opcrating Expenscs
Totål Exp€nses
Change in Assets
Fixed Asset ExpendituresDcprcciationSoftware CapExFumiture & Fixtures CapEx
t'7;t04 I6.4t0 t9.204 21.880
l9l s22,437
ó09
2,lll34,067
88
254 $45,423
810
5,489 S
9,3947,268
I I ,018
2,814 $45,423
l l8
(2.s60)
't37 S
7,0635,465
10,595
1.199
656,7634,939s,808
't90
672300526
4.7_8'l
409
86s9,01 8
ó,5857,744
5.403376683
3.214
54236.40/o S 764 S
262.84920
$ 248,012 $ 246,t08 $ 1,904 0.8% $ 354,589 $ 328,144 $ 26,445 8.lo/o
8,293 $ r0,r97 S (r,904) -18.7% $ (27,49E) $ (1,053) $ (26,445) 100.0%
s (1,199) s (7e0) s (409)
tto
s (1,s95) s (r,os3) s
418
(s_42)
418Equiprnent & Cornputers CapE 314Leasehold Improvements
lncrease/(Dccreasc) in Fixed Assets
Total Budget s 247.127 S 245.318 $ 1.E09 0.7% S 353.412 S 327.091 $ 26.321 8.0%
CHANGE IN WORKING CAPITAT
Direct FTEsIndirect FTE'sTotal FTEts
r. l60.47
t.340.4t
t.340.39 o.oz
0.020.08
(0. I 0)
t.34 (0. r 8)0.39
r.63 |.73 t.75 t.73
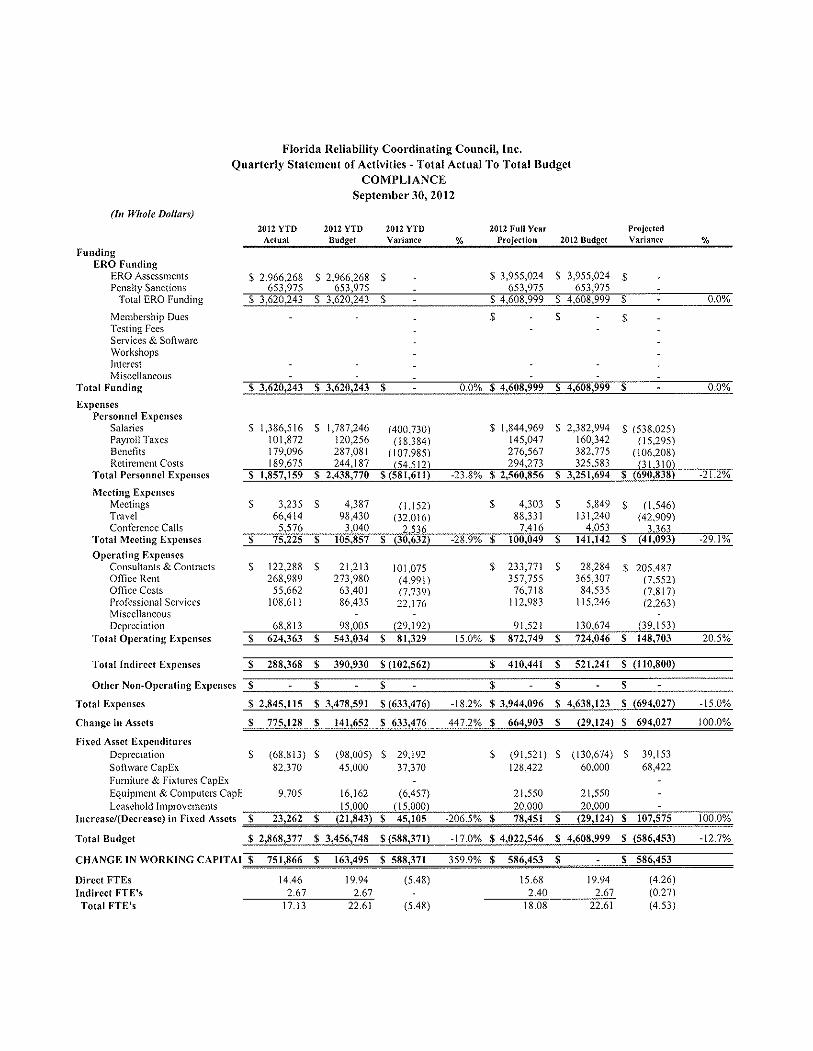
(In llhole Dollars)
Florida Reliability Coordinating Council, Inc.
Quarterly Statement of Activities - Total Actual To Total BudgetCOMPLIANCE
September 30,2012
2012 YTD 2012 YTD 2012 YTD 2012 Full Ye¡r ProJectedActual Budgea var¡ânce oh Projection 2012 Budget variance
s 3,955,024 s 3,9s5,024 s653.9't5 653.975
2.966653
2.966653
.268
.9'15268975
S I ,386,5 16 S t ,787 ,246 (400.230)l0l ,872 120,256 ( 18.384)t79,096 287,081 ( 107.985)
S 1,844,969 S 2,382,994 S (539.025)145,04''1 160,342 05.295)276,56'1 382,77s ( l0ó.208)
t 89.ó75 244.t87 294,273
3,235 $
66,4t44,387
98,4300.1 s2)
(32.016)4,303 S
88,3315,849 S
t3t,240( 1.546)
G2.909\
FundingERO Funding
ERO AssessmentsPenalty Sanctions
Total ERO Funding
Mernbemhip DuesTesting Fees
Services & SoftwareWorkshopshrterestMiscellaneous
Total Funding
ExpensesPersonncl Expenses
SalariesPayroll TaxesBenefitsRetirernent Costs
Total Personnel Expenses
Meeting ExpensesMeetingsTravelConference Calls
Totâl Meeting Expenses
Operating ExpcnsesConsultants & ContractsOfIìce RentOffice CostsProfessional ServicesMiscellaneousDepreciation
Total Opcrating Expcnses
Total Indircct Expenscs
Othcr Non-Operating Expenscs
Totâl Expenses
Change in Assets
Fixed Asset ExpcndituresDepreciationSoftware CapExFumiture & Fixtures CapExEquiprnent & Cornputers CapE
Direct FTEsIndirect FTE'sTotal FTE's
Q9.19Ð 9t.52t
28,284 S 205.487365,307 0.552',t84,53s (7.8 I 7)
tts,246 Q.263)
t30.674 (39.r53)
576 7.416 4
s 122,288 S
268,98955,662
108,61I
68.8 l3
2t,2t3273,980
ó3,4018ó,435
98.005
l0 l .075(4.99 r )(7;139\22.1_76
s 233,771 S
357,'75576,'7 t8
I12,983
$ 624.363 $ 543.034 $ 8r.329 15.0% $ 872.749 S 724,046 $ 14E,703 20.5%
$ 2,845,115 $ 3,478,59t $(633,476) -18.2% $ 3,944,096 $ 4,638,123 $ (694,027) -15.0%
$ 775,128 $ t4\6n $ ß,q6
s (ó8,813) S
82,370
9.70s
14.46
2.67
(98,005) S 29,t924s,000 37,370
t6,t62 (6,457)
t9.94 (s.48)
s (9r,521) s (r30,ó74) S 39,r53t28,422 60,000 68,422
2l ,550 2l .550Leasehold hnprovernenrs lt,0q0 (15,000) 20,000 20,000 -
Incrcase/(Decrease) in Fixcd Asset.
Total Budget $ 2,868,377 S 3,456,748 $(5E8,371) -t7.0% S 4,022,546 $ 4,608,999 $ (586,453) -12.'l%
CHANGE IN WORKING CAPITAI
r 5.ó82.40
t9.94 (4.26)2.6't (0.27)
t7.t3 22.61 (s.48) 18.08 22.6t (4.s3)
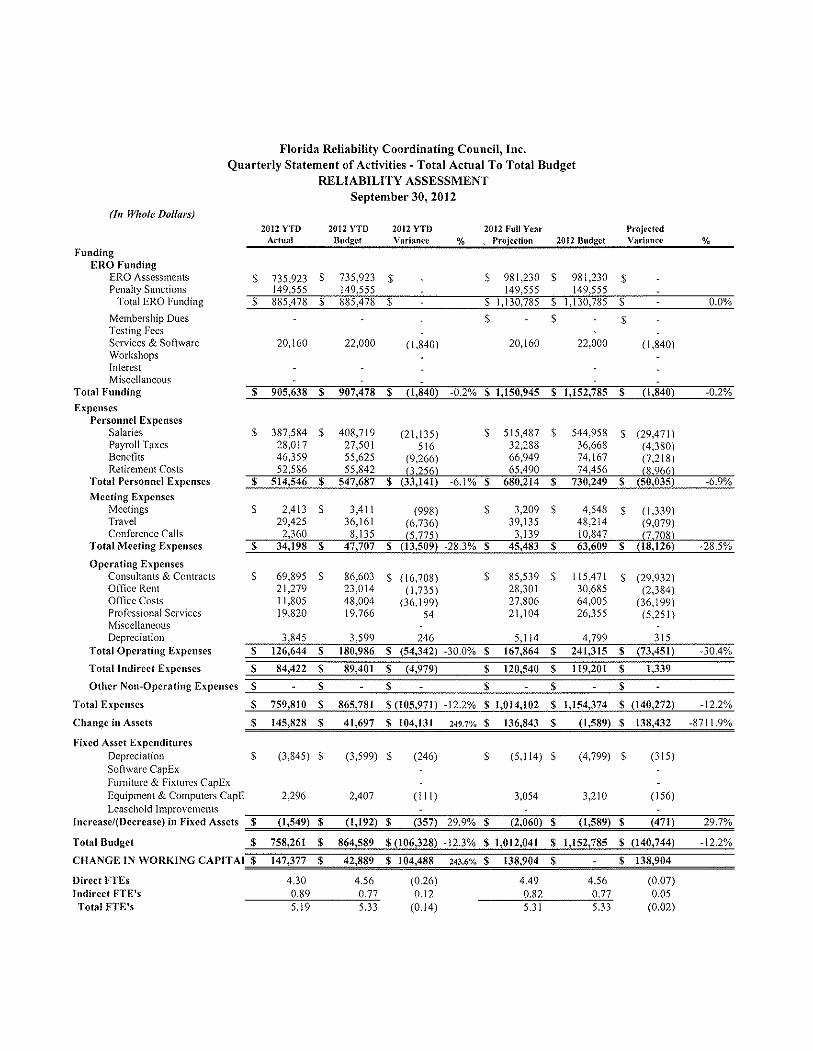
Florida Reliability Coordinating Council, Inc.
Quarterly Statement of Activities - Total Actual To Total BudgetRELIABILITY ASSESSMENT
September 30,2012
2OI2YTD 2OI2YTD 2OI2YTDActuâl Budget Vsr¡ence
2012 Full Yearo/" Proiectlon 2012 Budeet
ProJectedV¡rlance
g 735,923 s 73s,923 $ s 98 1,230 $ 98 1,230 $ -149,555 t49,555 - 149,5s5 149,555
20, I 60 22,000 fl,840)
$$
20,t60
-$
22,000 0,840)
$ 387,584 $ 408,719 (21,135)28,0t7 27,501 5t646,359 55,625 0,266)
$ 515,487 $ 544,958 S e9.47ll32,288 3ó,6ó8 (4,380)66,949 74,167 0,2t8\
(In llthole Dollars)
FundingERO Funding
ERO AssessmentsPenalty Sanctions
Total ERO Funding
Membership DuesTesting FeesServices & SoftwareWorkshopsInterestMiscellaneous
Total Funding
ExpensesPersonnel Expenses
SalariesPayroll TaxesBenefitsRetirement Costs
Total Personnel Expenses
Meeting ExpensesMeetingsTravelConference Calls
Total Meeting Expenses
Operating ExpensesConsultants & ContractsOffìce RentOfñce CostsProfessional ServicesMiscellaneousDepreciation
Total Operating Expenses
Total Indirect Expenses
Other Non-Operating Expenses
Total Expenses
Change in Assets
Fixed Assct ExpendituresDepreciationSoftware CapEx
2,413 $29,42s
3,41 I
36,1 ó l(9e8)
rc.736',1
3,209 $
39,1 35
4,548 $ 0,339)48,214 (9.079)360
ó9,89s $
2t,279l 1,805t9,820
3.845
135
86,60323,0t448,00419,766
3.599
s ( r 6,708)( I,735)
(36, r 99)54
246
85,539 $28,30127,8062t,104
5.1 l4
139
ll5,47t s Q9,932\30,ó85 e,384\ó4,00s (3ó,t99)26,35s (5,25 I )
4.799 i't$ 126,644 $ t80,986 $ (54,342) -30.0% $ 167,864 $ 241,315 $ (73,451) -30.4%
$ 759,810 $ 865,781 $(105,97t) -12.2% $ 1,014,102 $ I,154,374 $ (140,272) -12.2%
s t¿s,az¡ s ¿t,097 $
Fumiture & Fixlures CapExEquiprnent & Computers CapELeasehold hnprovements
(3,84s) $
2,296
(3,see) $
2,407
(2-46)
(r l r)
(s,r 14) $
3,054
(4,799) $
3,210
(3r5)
(15ó)
Increase(Decrease) in Fixed Assets
Total Budget
(l.s49) $ û.r92) $ ßs7t 29.9% S (2.060) $ (l.s89) $ ø7ll 29.7o/o
CHANGE IN WORKING CAPITAI $
Direct FTEslndirect FTE'sTotal FTE's
$ 138.904
4.300.89
4.560.77
(0.26)0.t2
4.490.82
4.560.77
(0.07)0.0s
(0.02)
$ 758,261 $ 864,589 $ (106,328) -12.3% $ 1,012,041 $ I,152,785 $ (140,744) -12.2%
5. l9 5.33 (0. r4) 5.31 5.33

Florida Reliability Coordinating Council, Inc.
Quarterly Statement of Activities - Total Actual To Total BudgetTRAINING AND EDUCATION
September 30,2012
2()I2 YTD 2OI2 YTD 2OI2 YTDActual Budget vsriance olo
2012 Full YearProjection 2012 Budg€t
ProJectedVarlancc
s 89.989 S 89,989 S - $ 119,98ó S 119,986 S16,071 s ló,071 - tó,071 ló,071
96,91 5 79,430 l?.485
'.S98,21 5
-s7s,430 I s.ias
58,559 S 2ó.91 I3,940 (410)6,6t7 (ó75)
234272 $ 21s,487 S 18,78s 8.7%
10,641 ó,001 4.640 7,162 8,001 (839) ,,37;
s 76,923 S
5,51 I8,607
s 58,122 S
6,r28563
43,919 33.0042,955 2.556s 85,470 S
3,5305,9424,963 3.644
36,647 2t.4is7,745 ¡.ó 17)
s 60,622 S
8,1 50749
48,8ó3 $ I 1.75910,327 Q.t77\
(In ll/hole Dollars)
FundingERO Funding
ERO AssessmentsPenalty Sanctions
Total ERO Funding
Mernbership DuesTesting Fees
Services & SoftwareWorkshopsInterestMiscellaneous
Totâl Funding
ExpensesPersonnel Expenses
SalariesPayroll TaxesBenefitsRetirernent Costs
Total Personnel Expenses
Meeting ExpcnsesMeetingsTravelConference Calls
Total Meeting Expenses
Operating ExpensesConsultants & ContractsOffice RentOffice CostsProfessional ServicesMiscellaneousDepreciation
Total Operating Expenses
Total lndirect Expenses
Other Non-Operating Expenses
Total Expenses
Change in Assets
Fixed Asset ExpendituresDepreciationSoftware CapExFurniture & Fixtures CapExEquiprnent & Computers CapELeasehold Irnproverne¡rls
lncrease/(Decrease) in Fixed Assets
Total Budget
CHANGE IN WORKING CAPITAI
Direct FTEslndirect FTE'sTotal FTE's
S 26,871 S 36,ó70 0.799\4,103 2,473 1.630
I 5,486 4,933 10.5533,223 2,124 1.099
48,894 S fl 1.743)3,297 2.1606,577 14.0192,832 St7
3,578 7't I
s 37,151 s5,457
20,s963,349
I,150 ó8ó 4ó4 1,530 915 ó15
$ 50,833 $ 46,886 $ 3,947 8.4% $ 68,083 $ 62,515 $ 5,5ó8 8.9%
$ 233,319 $ ló2,301 $ 71,018 43.8o/o$ 251'513 S 216,402 $ 35'lll 16.2o/o
$ (30.344) $ 23.189 $ (s3.s33) -230.9% $ 07.241) $ (9rs) $ (ló,326) 100.0%
(9ls) S(r,r50) s
34
(ó8ó) S (4_64)
34
(r,530) s
45
(óls)
45
62.'1% S
s 232.203 $ 16l.ó15 $ 70.s88 43jt%S 250.029 $ 215.487 $ 34,542 t6.0%
S Q9.228\ $ 23.875 $(53.103) -222.4o/o $ (15'757)$ - $ (15'757)
0.ó90.t2
0.490.1 I
0.200.01
0.2t
0.420.10
(0.07)(0.01)
0.490.r r
0.81 0.ó0 0.s2 0.60 (0.08)

Florida Reliability Coordinating Council, Inc.
Quarterly Statement of Activities - Total Actual To Total BudgetSITUATIONAL AWARENESS
September 30,2012
2()I2 YTD 2OI2 YTD 2OI2 YTD 2012 Full Year ProjectedActual Budset Vår¡ânce olo Proiection 2012 Budqet Variance olo
59.206 Sl I,l5l
s9.206 SI I,l5l
78,94t S
I I,l5 l78,94t S
I l.l5l
70.J57 $ 70.357 $ 0.0% $ 90.092 $ 9U,U9Z $
25,867 S
r,7092,9793,383
30,4752,0503,'t t64,t64
(4.ó08)(341)(737\
34,403 S
2,4024,4084,8'13
40,633 s2,7344,9ss5,552
(ó.230)(332)(5471
(In llhole Dollars)
FundingERO Funding
ERO AssessmentsPenalty Sanctions
Total ERO Funding
Mernbership DuesTesting Fees
Services & SoftwareWorkshopsInterestMiscellaneous
Total Funding
ExpensesPersonnel Expenses
SalariesPayroll TaxesBenefìtsRetirernent Costs
Total Personnel Expenses
Meeting ExpensesMeetingsTravelConlerence Calls
Total Meeting Expenses
Operating ExpensesConsultants & ContractsOffice RentOlfice CostsProfessional ServicesMiscellaneousDepreciation
Total Opcrating Expenses
Total Indirect Expenses
Other Non-Operating Expenses
Total Expenses
Change in Assets
Fixed Asset ExpendituresDepreciationSoftware CapExFunriture & Fixtures CapExEquiprnent & Cornputers CapELeasehold Improvernents
Increase/(Dccrease) in Fixed Assets
Total Budget
s 33Sóó0
s 107I,3968,084
898
10,812
248 (215)2,982 e3Z2)
7 ,517 (7.410)1,7 t6 (320)ó,557 t.5271,4'Ì4 (576)
8,s88 2,224
s 44S878
33 I S (287)3,976 (3.098)
t0,022 S (8.73ó)2,288 (431)8,743 2.0091,96s (9ós)
I I ,451 2,929
lóó 4 t62 221 5 2t6
t,286 S
l,857t0,752I,000
14.380
21,297 $ 25.852 S (4.555) -t7.60/0 S 29.274 $ 34.469 $ (5.195) -15.1%
5.251 $ 6.666 $ û.415) 9.s32$ 8.888$ 644
61,345 $ 76,t57 $ 04.812) -t9.4% $ 86,035 $ 101,543 $ (15,508) -t53%
9.0t2 $ (5.800) $ 14.812 -zss.4vo $ 4.057 $ (l1.45t) $ 15.508 100.0%
s (10,812) s (8,588) S (2,224)
:
8 8 ll - ll
$ 50,541 $ 67,569 $ (l?,028) -25.2% $ 7t,665 $ 90,092 $ (1E,427) -205%
CHANCE TN WORKTNC CAPITAT
s (14,380) s (r r,45r) s (2,92e)
Direct FTEsIndirect FTE'sTotal FTE's
0.290.04
0.340.08
0.340.09
0.340.08 o.or
0.01
(0.0s)(0.04)(0.09)0.33 0.42 0.43 0.42
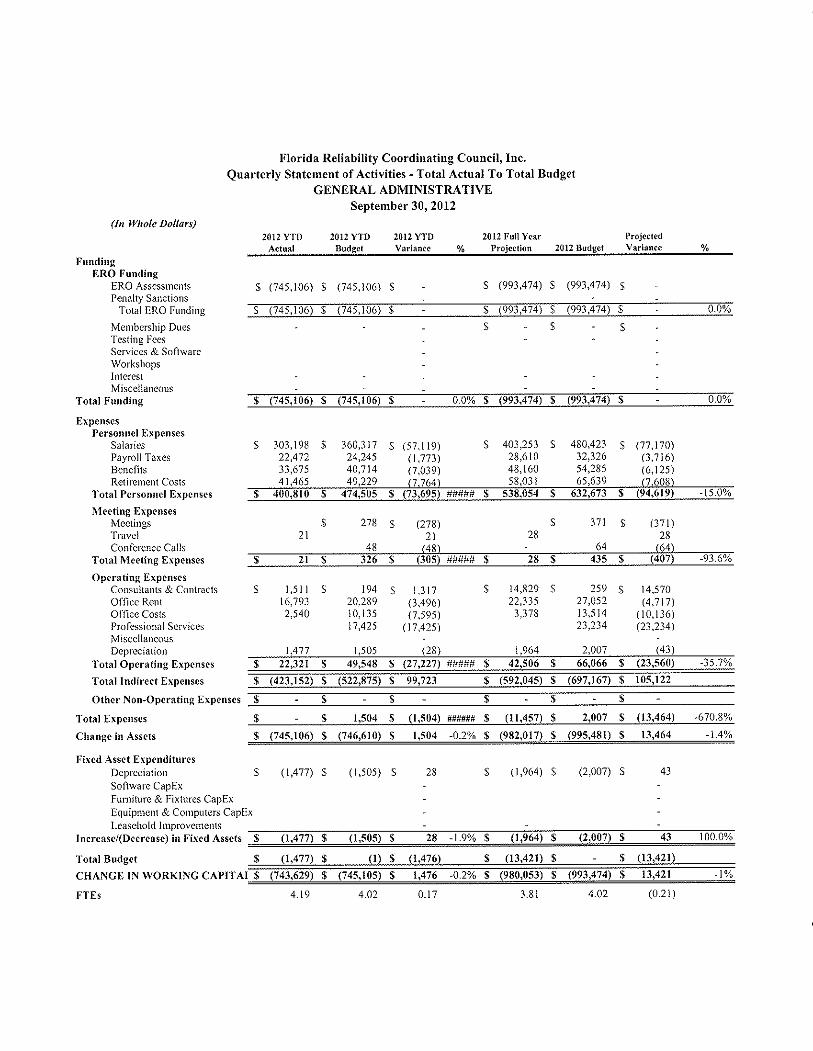
(In llhole Dollars)
FundingERO Funding
ERO AssessmentsPenalty Sanctions
Total ERO Funding
Membership DuesTesting Fees
Services & SoftwareWorkshopsInterestMiscellaneous
Total Funding
ExpensesPersonnel Expenscs
SalariesPayroll TaxesBenefìtsRetirement Costs
Total Personnel Expenses
Meeting ExpensesMcetingsTravelConference Calls
Totâl Meeting Expenses
Operating ExpensesConsultants & ContractsOffice RentOffìce CostsProfessional ServicesMiscellaneousDepreciation
Total Operating Expenses
Total lndirect Expenses
Other Non-Operating Expenses
Total Expenses
Change in Assets
Fixed Asset ExpendituresDepreciationSoftware CapEx
Florida Reliability Coordinating Council, Inc.
Quarterly Statement of Activities - Total Actual To Total BudgetGENERAL ADMINISTRATIVE
September 30,2012
2OI2 YTD 2OI2 YTD 2OI2 YTD 2012 Full Year ProJected
Actual Budget Variance o/o Projection 2012 Budget V¡¡iance olo
$(745,106)S (745,10ó)S - s (993,474)S (993,474) $
ffi$$ -s
(993,474)$ (993,474)$ - 0.0%
s 303,198 S
22,47233,67541.465
s (57,r l9)(1,773\(7,039)
360,3t't24,24540,7 t4
S 403,253 S 480,423 S (77.170)28,610 32,326 (3,7 t6)48,160 54,285 (6.t25158,03 r
s l,5ll s16,'1932,540
229
278 s (278)2l
194 S 1,3 l720,289 ß,496)l0,l3s (7,59s)t7,42s (t7,425)
s 14,829 S
22,33s3,378
37t $ (371)28
259 s 14,57027,0s2 ø,7 t7)13,514 (10,136)23,234 (23,234',t
Fumiture & Fixtures CapExEquiprnent & Cornputers CapEx
r,477 t,50s (28) t,964 2,007 (43)
s 22,321 $ 49,548 $ (27,227) ##### $ 42,506 $ 66,066 $ (23,560) -35.1%
S - s 1.504 $ 11.504) ###fl#H S lll.4sil S 2.007 $ (13.464) -670.8%
$ (745,t06) $ (746,610) $ 1,504 -0.2% $ (982,017) $ (995,481) $ 13,464 -1.40/o
( l,477) S (1,s05) s 28 (r,964) S (2,007) s 43
s û.47Ð S
Leasehold hnprovementsI ncrease/(Decrease) in Fixed Assets
Total Budget lr)$ fi.476r $ t13.421)$ - $ 03.421)
CHANGE IN WORKING CAPITAI
FTEs
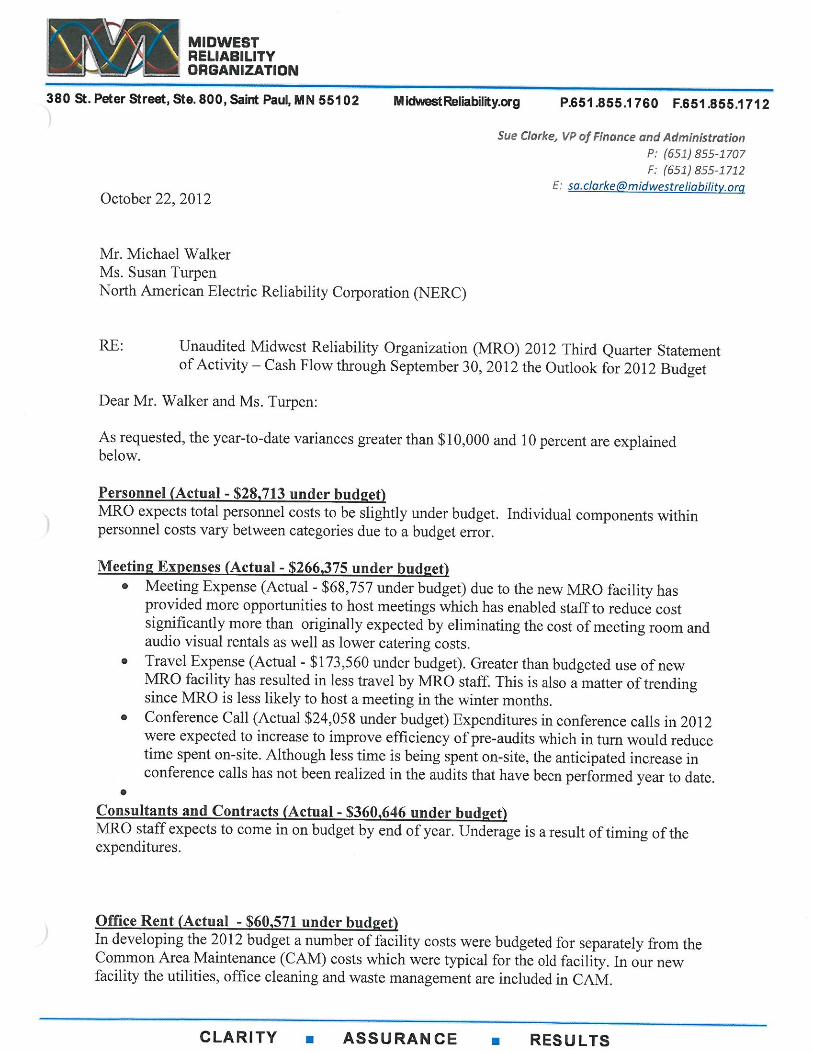
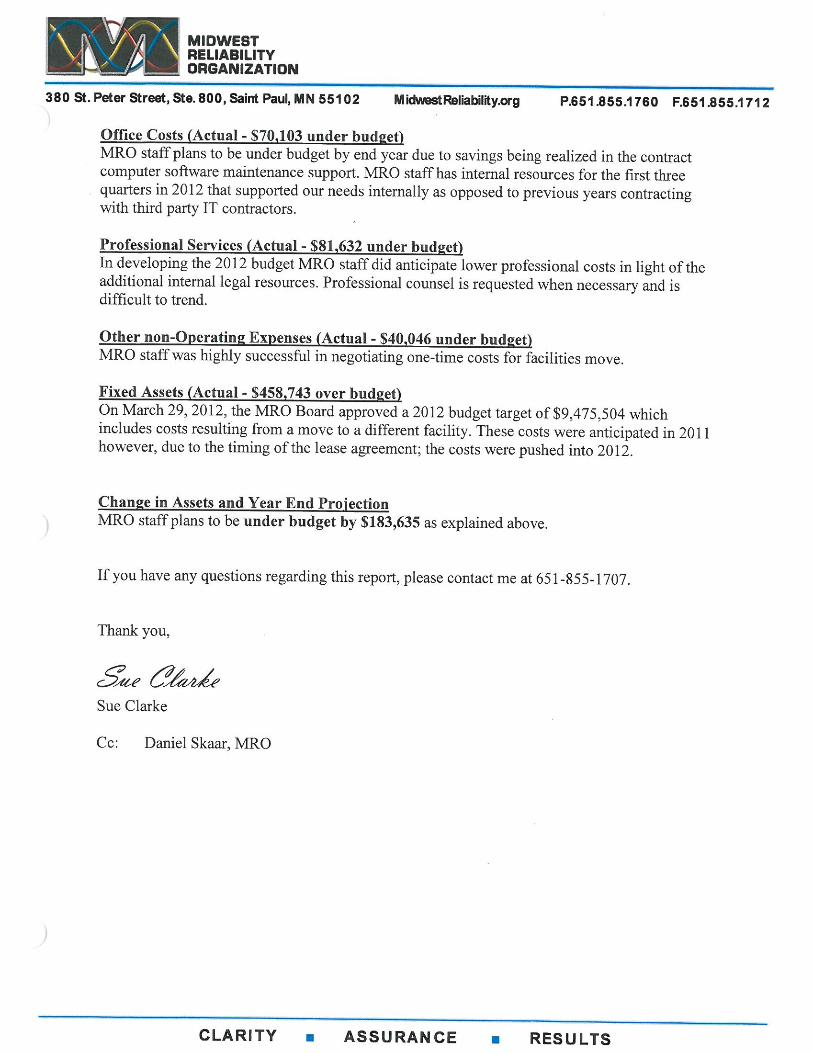
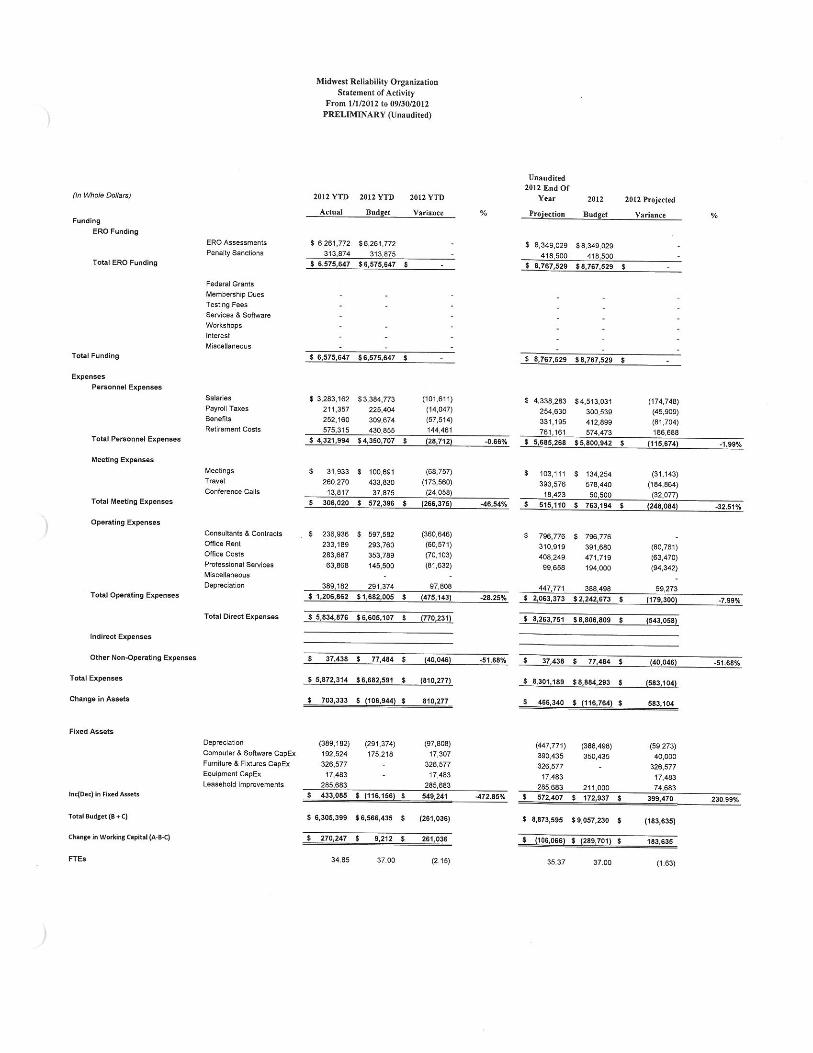

October 19, 2012 North American Electric Reliability Corporation 3353 Peachtree Road NE Suite 600, North Tower Atlanta, GA 30326 Attention: Mr. Michael Walker Subject: NPCC Regional Entity Division Variance Comparison and Third Quarter 2012 Statement of Activities Dear Michael: The variance comparison for the period ended September 30th, 2012 is included along with Northeast Power Coordinating Council, Inc.’s unaudited Third Quarter 2012 Statement of Activities. Please do not hesitate to contact me via email at [email protected] or via telephone at (212) 840-1070 should you have any comments or questions with regard to the materials provided. Sincerely,
Jessica Hala Jessica Hala Senior Financial Analyst JH: jh Enclosures cc: Mr. Christopher Weir, CPA – NPCC Treasurer Mr. Edward A. Schwerdt – NPCC President & CEO Ms. Jennifer Budd Mattiello – NPCC Vice President & COO ERO Finance Group
1
NPCC Regional Entity Division Budget to Actual
Variance Comparison as of September 30, 2012
INCOME
• Penalty Sanctions (Actual income of $614k remitted to NPCC as of June 30, 2011 has been applied to reduce 2012 assessments to NPCC U.S. load serving entity designees.) All penalty sanctions remitted from July 1, 2011 through June 30, 2012 will be applied to reduce 2013 assessments to NPCC U.S. load serving entity designees and are included in the NPCC 2013 Business Plan and Budget.
• Interest Income (Actual income of $15k year-to-date not included in budget)
NPCC has not budgeted for interest income as returns on U.S. treasury securities fund are negligible and corporate money market fund returns for 2011 were minimal for operating fund investment.
o NPCC allocated $15k as a portion of total interest income (93%) to the Regional Entity Division
consistent with the ratio of Regional Entity (RE) to Criteria Services (CS) Division 2012 funding. A common system of accounts, with divisional separation, is used for both RE and CS revenue tracking and financial reporting.
EXPENSES
• Personnel Expenses (Variance of $680k under budget year-to-date and $455k under budget FYP) o Recruiting knowledge-based professionals continues to be challenging. One of the open Regional Entity
positions budgeted for the full year in 2012 has not yet been filled and is currently projected based on an estimated start date in 2013. In the benefits area, a significant number of professionals retained over the past five years continue to waive health insurance coverage, keeping superior coverage available to them from a prior employer. NPCC continues to budget for its full staff’s health insurance coverage. The full year projection was adjusted for the known year to date underage.
• Meeting Expenses (Variance of $139k under budget year-to-date and as budgeted FYP) o Continued efforts to hold more meetings onsite or via webinar have kept meeting and conference call
expenses under budget. Current underage is projected to be made up later in the year due to timing of planned meetings.
• Contracts & Consultants (Variance of $59k under budget year-to-date and as budgeted FYP) o NPCC utilizes contractors to support its reliability standards and compliance program areas.
Expenditures to date are consistent with scheduled work flow which is heavier in the fourth quarter. o While expenses are currently tracking under budget, projected expenses for the remainder of the year are
expected to be in line with budget.

2
• Professional Services (Variance of $323k under budget year-to-date and $260k under budget FYP)
o Under budget due to decreased use of outside counsel and timing of Independent Director search. A portion of Independent Director search fees were budgeted in 2012, however, the search fees were paid in full last year. The full year projection has been reduced to account for this underage. If compliance hearings were to be required, it is expected that there could be a multi-year budgetary impact. In the near term, hearings would be funded out of operating cash reserves as there is no 2012 budget for hearings.
• Miscellaneous (Actual variance of $86k under budget year-to-date and $72k under budget FYP) o For the 2012 budget, expenses related to NPCC’s responsibilities as WECC CEA of $72k were included
under miscellaneous expense in the 2012 budget. However, the actual expenses are being recorded to the appropriate account based on expense type (i.e. Travel, Contracts, etc). Therefore, the full year projection for miscellaneous expense has been reduced by $72k. NPCC conducted two on-site audits of WECC during 2012 (one 693 audit and one CIP audit). The budgeted expense was based on the average annual expense in a three year audit cycle. Therefore, the actual expense in 2012 will be greater than budgeted. The additional expense in 2012 is currently estimated to be approximately $60k - $75k. The total expenses related to the WECC audits will be trued up with WECC at year end, as per the CEA Agreement.
• Depreciation (Actual variance of $43k over budget year-to-date and $57k over budget FYP) o Capitalization of computer equipment expenditures during the fourth quarter of 2011, in accordance with
NPCC’s capitalization policy and GAAP guidelines, will result in a projected overage of this budget for 2012.
FIXED ASSETS
• NPCC made no fixed asset acquisitions through third quarter 2012.
(Unaudited) Submitted October 19th, 2012
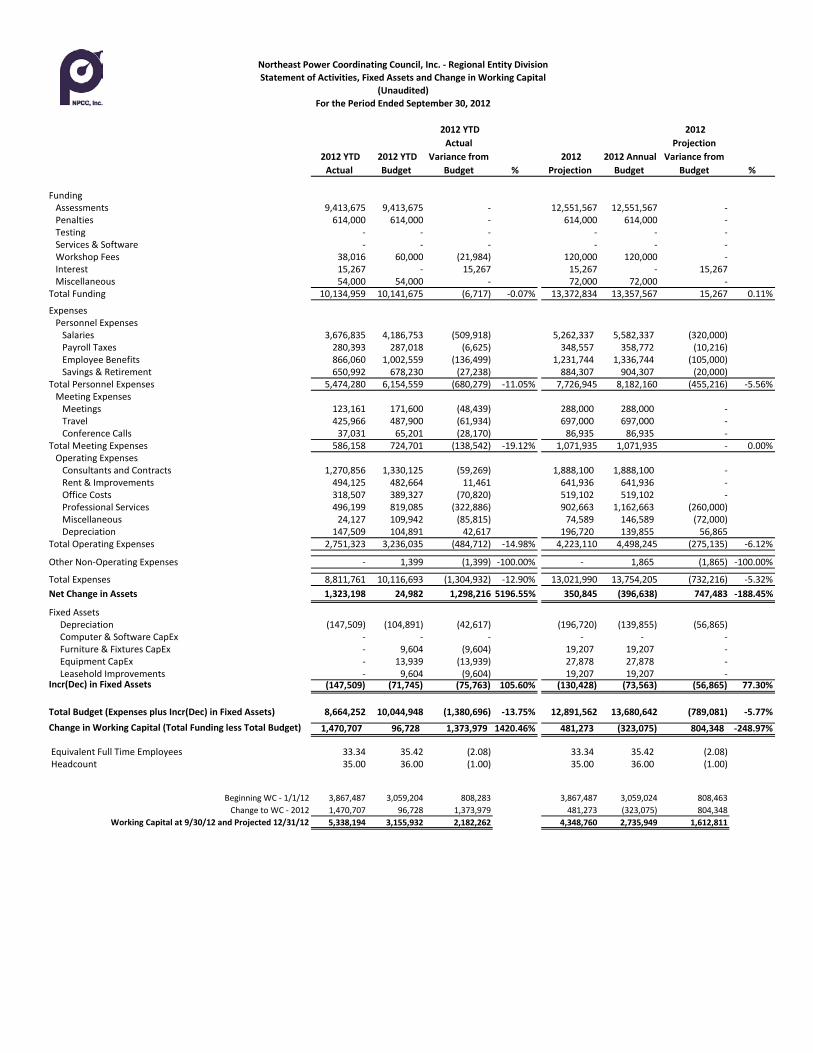
2012 YTD Actual
2012 YTD Budget
2012 YTD Actual
Variance from Budget %
2012 Projection
2012 Annual Budget
2012 Projection
Variance from Budget %
Funding Assessments 9,413,675 9,413,675 - 12,551,567 12,551,567 - Penalties 614,000 614,000 - 614,000 614,000 - Testing - - - - - - Services & Software - - - - - - Workshop Fees 38,016 60,000 (21,984) 120,000 120,000 - Interest 15,267 - 15,267 15,267 - 15,267 Miscellaneous 54,000 54,000 - 72,000 72,000 - Total Funding 10,134,959 10,141,675 (6,717) -0.07% 13,372,834 13,357,567 15,267 0.11%
Expenses Personnel Expenses Salaries 3,676,835 4,186,753 (509,918) 5,262,337 5,582,337 (320,000) Payroll Taxes 280,393 287,018 (6,625) 348,557 358,772 (10,216) Employee Benefits 866,060 1,002,559 (136,499) 1,231,744 1,336,744 (105,000) Savings & Retirement 650,992 678,230 (27,238) 884,307 904,307 (20,000)Total Personnel Expenses 5,474,280 6,154,559 (680,279) -11.05% 7,726,945 8,182,160 (455,216) -5.56% Meeting Expenses Meetings 123,161 171,600 (48,439) 288,000 288,000 - Travel 425,966 487,900 (61,934) 697,000 697,000 - Conference Calls 37,031 65,201 (28,170) 86,935 86,935 - Total Meeting Expenses 586,158 724,701 (138,542) -19.12% 1,071,935 1,071,935 - 0.00% Operating Expenses Consultants and Contracts 1,270,856 1,330,125 (59,269) 1,888,100 1,888,100 - Rent & Improvements 494,125 482,664 11,461 641,936 641,936 - Office Costs 318,507 389,327 (70,820) 519,102 519,102 - Professional Services 496,199 819,085 (322,886) 902,663 1,162,663 (260,000) Miscellaneous 24,127 109,942 (85,815) 74,589 146,589 (72,000) Depreciation 147,509 104,891 42,617 196,720 139,855 56,865 Total Operating Expenses 2,751,323 3,236,035 (484,712) -14.98% 4,223,110 4,498,245 (275,135) -6.12%
Other Non-Operating Expenses - 1,399 (1,399) -100.00% - 1,865 (1,865) -100.00%
Total Expenses 8,811,761 10,116,693 (1,304,932) -12.90% 13,021,990 13,754,205 (732,216) -5.32%Net Change in Assets 1,323,198 24,982 1,298,216 5196.55% 350,845 (396,638) 747,483 -188.45%
Fixed Assets Depreciation (147,509) (104,891) (42,617) (196,720) (139,855) (56,865) Computer & Software CapEx - - - - - - Furniture & Fixtures CapEx - 9,604 (9,604) 19,207 19,207 - Equipment CapEx - 13,939 (13,939) 27,878 27,878 - Leasehold Improvements - 9,604 (9,604) 19,207 19,207 - Incr(Dec) in Fixed Assets (147,509) (71,745) (75,763) 105.60% (130,428) (73,563) (56,865) 77.30%
Total Budget (Expenses plus Incr(Dec) in Fixed Assets) 8,664,252 10,044,948 (1,380,696) -13.75% 12,891,562 13,680,642 (789,081) -5.77%Change in Working Capital (Total Funding less Total Budget) 1,470,707 96,728 1,373,979 1420.46% 481,273 (323,075) 804,348 -248.97%
Equivalent Full Time Employees 33.34 35.42 (2.08) 33.34 35.42 (2.08) Headcount 35.00 36.00 (1.00) 35.00 36.00 (1.00)
Beginning WC - 1/1/12 3,867,487 3,059,204 808,283 3,867,487 3,059,024 808,463 Change to WC - 2012 1,470,707 96,728 1,373,979 481,273 (323,075) 804,348
Working Capital at 9/30/12 and Projected 12/31/12 5,338,194 3,155,932 2,182,262 4,348,760 2,735,949 1,612,811
Northeast Power Coordinating Council, Inc. - Regional Entity DivisionStatement of Activities, Fixed Assets and Change in Working Capital
(Unaudited)For the Period Ended September 30, 2012

320 SPRING TELEPHON
October Mr. MichNorth Am3353 PeaSuite 600Atlanta, G Subject:
Mr. Mich
As requecomparisBusiness
The expl1. V2. V3. V
SignificFor the qbudget, wcriteria a
• S• E• C• R• P• C
Expens
• P
o
GSIDE DRIVE, SNE: (330) 456-24
A REGION
22, 2012
ael Walker merican Elecachtree Roa0, North TowGeorgia 303
: Reliability Report - U
ael Walker:
ested, the attson of budges Plan and B
anations of vVariances eqVariances greVariances tha
cant Varianquarter endinwhile on targbove, includ
Salaries, PayEmployee BeContracts & CRent & UtilitieProfessional Computer Ha
es
Personnel E
Salaries, budget foThese pehiring qua
SUITE 300, AKRO488 FACSIMI
NAL ENTITY OF
ctric Reliabiliad, N.E. wer 326
yFirst’s 2012Unaudited
tached 2012eted and actBudget, as ap
variances arual to or greeater than $at are consid
nces ng Septembeget to complede: yroll Taxes aenefits - $127Consultants es - $108K UServices - $
ardware & So
xpenses
Payroll Taxr Year to Darsonnel exp
alified person
ON, OH 44333 ILE: (330) 456-36
THE NORTH A
P
ty Corporati
2, 3rd Quar
2, 3rd Quartetual expensepproved by
re provided beater than +/10,000, or dered signific
er 30, 2012,ete our inten
and Savings 7K Under - $48K Over
Under $42K Underoftware - $1
xes and Savate (YTD) enses are unnel.
648
MERICAN ELEC
Page 1 of 3
on
rter Stateme
er Statemenes relative toNERC and F
based on the/- 10% of bu
cant.
ReliabilityFnded objectiv
& Retiremen
r
79K Under
vings & Ret
nder budget
CTRIC RELIABIL
ent of Activi
t of Activitieso the 2012 RFERC.
e following cdget, and
First Corporaves. The ma
nt Costs - $3
tirement Co
t due to the
LITY CORPORAT
vities Varian
s (unauditedReliabilityFirs
criteria:
ation is $648ajor contribu
319K Under
osts: $319K
difficulties in
TION
nce
d) is a st Corporatio
K (5%) undeutors, using
r
(4%) under
n attracting a
on’s
er the
r
and

A REGIONAL ENTITY OF THE NORTH AMERICAN ELECTRIC RELIABILITY CORPORATION
Page 2 of 3
o Employee Benefits: $127K (13%) under budget for YTD Employee Benefits is under budget as a result of variances in Training and Education, and Medical Benefits. Training and Education is under budget due to staff not taking advantage of training opportunities available, as planned. Medical Benefits are under budget due to negotiating a 0% increase in medical premiums, which was much less than the budgeted 12% increase.
• Meeting Expenses
o Conference Calls: $9K (112%) over budget for YTD Conference Calls is over budget due to the replacement of the current in-house conferencing system with an external conferencing service.
• Operating Expenses
o Contracts & Consultants: $48K (16%) over budget for YTD Contracts & Consultants is over budget as a result of the use of contractors to help support the performance of compliance audits due to the program area operating below budgeted staffing levels.
o Rent & Utilities: $108K (27%) under budget for YTD Rent is under budget as a result of the delay in securing an offsite disaster recovery site.
o Professional Services: $42K (11%) under budget for YTD Professional Services is under budget due to the use of in-house counsel versus more costly outside legal support.
Fixed Assets
• Computer Hardware & Software: $179K (67%) under budget for YTD Computer Hardware & Software is under budget due to the delay in the implementation of a new phone and web conferencing system.
Year End Projection
For the year end projection, ReliabilityFirst is projecting a year-end variance of $707 (4%) under budget. The major contributors to the projected variance are: • Personnel Expenses are projected to be $660K under budget due to the difficulties in
attracting and hiring qualified personnel.
• Conference Calls is projected to be $15K over budget due to the replacement of the current in-house conferencing system with an external conferencing service.
• Rent & Utilities is projected to be $137K under budget due to the delay in securing a disaster recovery site.
• Professional Services is projected to be $44K under budget due to the continued use of in-house counsel versus more costly outside legal support.
A REGIONAL ENTITY OF THE NORTH AMERICAN ELECTRIC RELIABILITY CORPORATION
Page 3 of 3
For more information, please contact me at 330.456.2488 or [email protected]. Sincerely,
Jack A. Istvan Chief Financial Officer and Treasurer
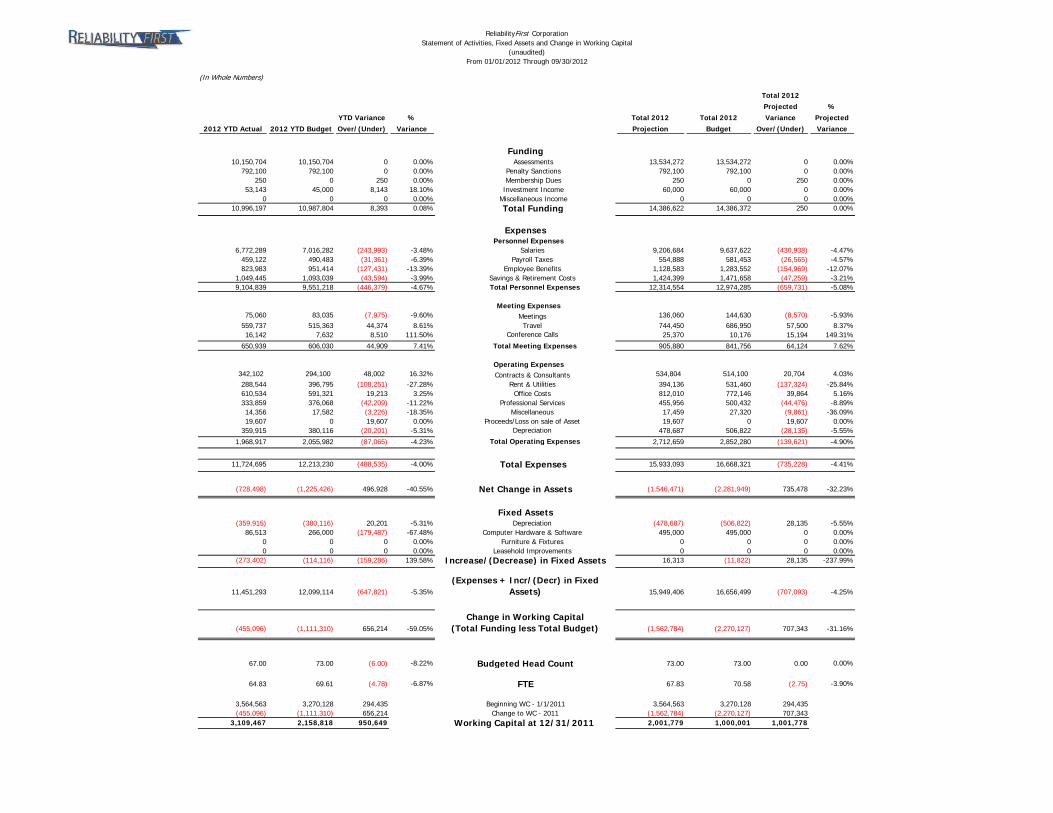
ReliabilityFirst CorporationStatement of Activities, Fixed Assets and Change in Working Capital
(unaudited)From 01/01/2012 Through 09/30/2012
(In Whole Numbers)
2012 YTD Actual 2012 YTD Budget
YTD Variance
Over/(Under)
%
Variance
Total 2012
Projection
Total 2012
Budget
Total 2012
Projected
Variance
Over/(Under)
%
Projected
Variance
Funding10,150,704 10,150,704 0 0.00% Assessments 13,534,272 13,534,272 0 0.00%
792,100 792,100 0 0.00% Penalty Sanctions 792,100 792,100 0 0.00%250 0 250 0.00% Membership Dues 250 0 250 0.00%
53,143 45,000 8,143 18.10% Investment Income 60,000 60,000 0 0.00%0 0 0 0.00% Miscellaneous Income 0 0 0 0.00%
10,996,197 10,987,804 8,393 0.08% Total Funding 14,386,622 14,386,372 250 0.00%
Expenses Personnel Expenses
6,772,289 7,016,282 (243,993) -3.48% Salaries 9,206,684 9,637,622 (430,938) -4.47%459,122 490,483 (31,361) -6.39% Payroll Taxes 554,888 581,453 (26,565) -4.57%823,983 951,414 (127,431) -13.39% Employee Benefits 1,128,583 1,283,552 (154,969) -12.07%
1,049,445 1,093,039 (43,594) -3.99% Savings & Retirement Costs 1,424,399 1,471,658 (47,259) -3.21%9,104,839 9,551,218 (446,379) -4.67% Total Personnel Expenses 12,314,554 12,974,285 (659,731) -5.08%
Meeting Expenses75,060 83,035 (7,975) -9.60% Meetings 136,060 144,630 (8,570) -5.93%
559,737 515,363 44,374 8.61% Travel 744,450 686,950 57,500 8.37%16,142 7,632 8,510 111.50% Conference Calls 25,370 10,176 15,194 149.31%
650,939 606,030 44,909 7.41% Total Meeting Expenses 905,880 841,756 64,124 7.62%
Operating Expenses342,102 294,100 48,002 16.32% Contracts & Consultants 534,804 514,100 20,704 4.03%288,544 396,795 (108,251) -27.28% Rent & Utilities 394,136 531,460 (137,324) -25.84%610,534 591,321 19,213 3.25% Office Costs 812,010 772,146 39,864 5.16%333,859 376,068 (42,209) -11.22% Professional Services 455,956 500,432 (44,476) -8.89%14,356 17,582 (3,226) -18.35% Miscellaneous 17,459 27,320 (9,861) -36.09%19,607 0 19,607 0.00% Proceeds/Loss on sale of Asset 19,607 0 19,607 0.00%
359,915 380,116 (20,201) -5.31% Depreciation 478,687 506,822 (28,135) -5.55%
1,968,917 2,055,982 (87,065) -4.23% Total Operating Expenses 2,712,659 2,852,280 (139,621) -4.90%
11,724,695 12,213,230 (488,535) -4.00% Total Expenses 15,933,093 16,668,321 (735,228) -4.41%
(728,498) (1,225,426) 496,928 -40.55% Net Change in Assets (1,546,471) (2,281,949) 735,478 -32.23%
Fixed Assets(359,915) (380,116) 20,201 -5.31% Depreciation (478,687) (506,822) 28,135 -5.55%
86,513 266,000 (179,487) -67.48% Computer Hardware & Software 495,000 495,000 0 0.00%0 0 0 0.00% Furniture & Fixtures 0 0 0 0.00%0 0 0 0.00% Leasehold Improvements 0 0 0 0.00%
(273,402) (114,116) (159,286) 139.58% Increase/(Decrease) in Fixed Assets 16,313 (11,822) 28,135 -237.99%
11,451,293 12,099,114 (647,821) -5.35%
(Expenses + Incr/(Decr) in Fixed Assets) 15,949,406 16,656,499 (707,093) -4.25%
(455,096) (1,111,310) 656,214 -59.05%
Change in Working Capital(Total Funding less Total Budget) (1,562,784) (2,270,127) 707,343 -31.16%
67.00 73.00 (6.00) -8.22% Budgeted Head Count 73.00 73.00 0.00 0.00%
64.83 69.61 (4.78) -6.87% FTE 67.83 70.58 (2.75) -3.90%
3,564,563 3,270,128 294,435 Beginning WC - 1/1/2011 3,564,563 3,270,128 294,435 (455,096) (1,111,310) 656,214 Change to WC - 2011 (1,562,784) (2,270,127) 707,343
3,109,467 2,158,818 950,649 Working Capital at 12/31/2011 2,001,779 1,000,001 1,001,778
October 22, 2012 Mike Walker North American Electric Reliability Corporation 3353 Peachtree Rd, NE Atlanta, GA 30326 Re: 3rd Quarter 2012 Financial Statements – Budget vs. Actual Mike: Following please find SERC’s third quarter 2012 financial statements showing actual to budgeted figures. If you have any questions, please let me know. Thank you,
Jennifer Kelly Director of Finance and Human Resources cc: Scott Henry, President/CEO John Twitchell, Vice President/CPO
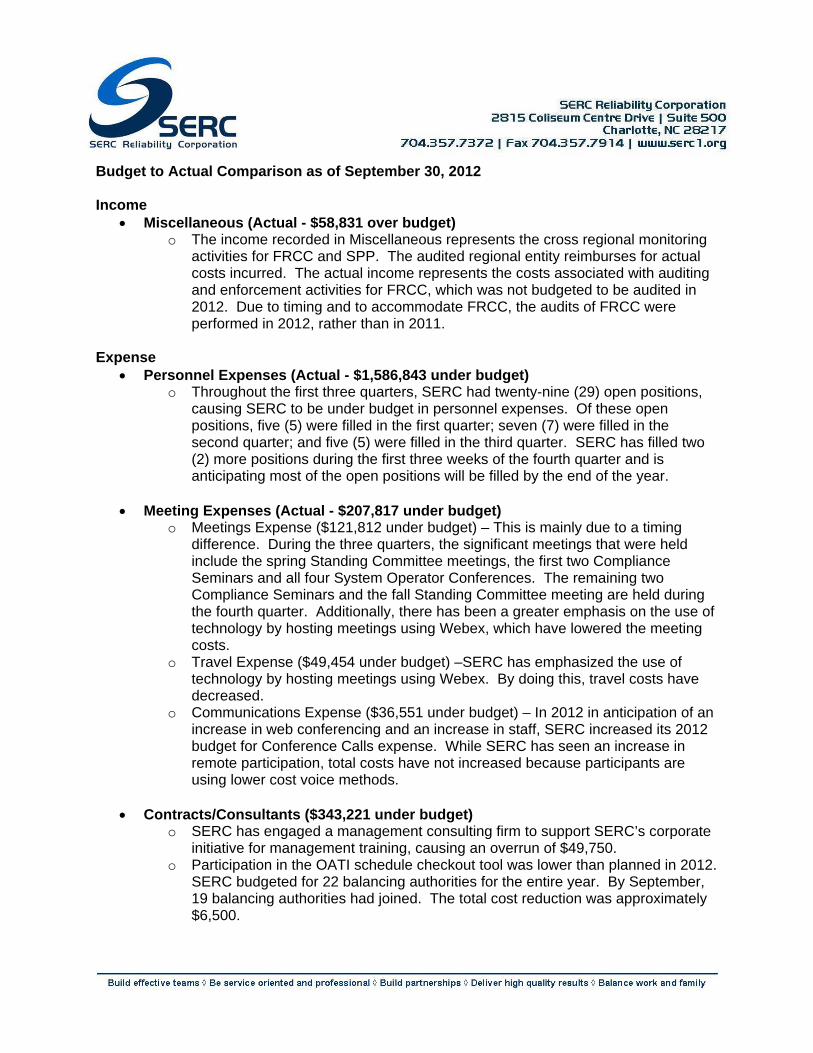
Budget to Actual Comparison as of September 30, 2012 Income
Miscellaneous (Actual - $58,831 over budget) o The income recorded in Miscellaneous represents the cross regional monitoring
activities for FRCC and SPP. The audited regional entity reimburses for actual costs incurred. The actual income represents the costs associated with auditing and enforcement activities for FRCC, which was not budgeted to be audited in 2012. Due to timing and to accommodate FRCC, the audits of FRCC were performed in 2012, rather than in 2011.
Expense Personnel Expenses (Actual - $1,586,843 under budget)
o Throughout the first three quarters, SERC had twenty-nine (29) open positions, causing SERC to be under budget in personnel expenses. Of these open positions, five (5) were filled in the first quarter; seven (7) were filled in the second quarter; and five (5) were filled in the third quarter. SERC has filled two (2) more positions during the first three weeks of the fourth quarter and is anticipating most of the open positions will be filled by the end of the year.
Meeting Expenses (Actual - $207,817 under budget)
o Meetings Expense ($121,812 under budget) – This is mainly due to a timing difference. During the three quarters, the significant meetings that were held include the spring Standing Committee meetings, the first two Compliance Seminars and all four System Operator Conferences. The remaining two Compliance Seminars and the fall Standing Committee meeting are held during the fourth quarter. Additionally, there has been a greater emphasis on the use of technology by hosting meetings using Webex, which have lowered the meeting costs.
o Travel Expense ($49,454 under budget) –SERC has emphasized the use of technology by hosting meetings using Webex. By doing this, travel costs have decreased.
o Communications Expense ($36,551 under budget) – In 2012 in anticipation of an increase in web conferencing and an increase in staff, SERC increased its 2012 budget for Conference Calls expense. While SERC has seen an increase in remote participation, total costs have not increased because participants are using lower cost voice methods.
Contracts/Consultants ($343,221 under budget)
o SERC has engaged a management consulting firm to support SERC’s corporate initiative for management training, causing an overrun of $49,750.
o Participation in the OATI schedule checkout tool was lower than planned in 2012. SERC budgeted for 22 balancing authorities for the entire year. By September, 19 balancing authorities had joined. The total cost reduction was approximately $6,500.
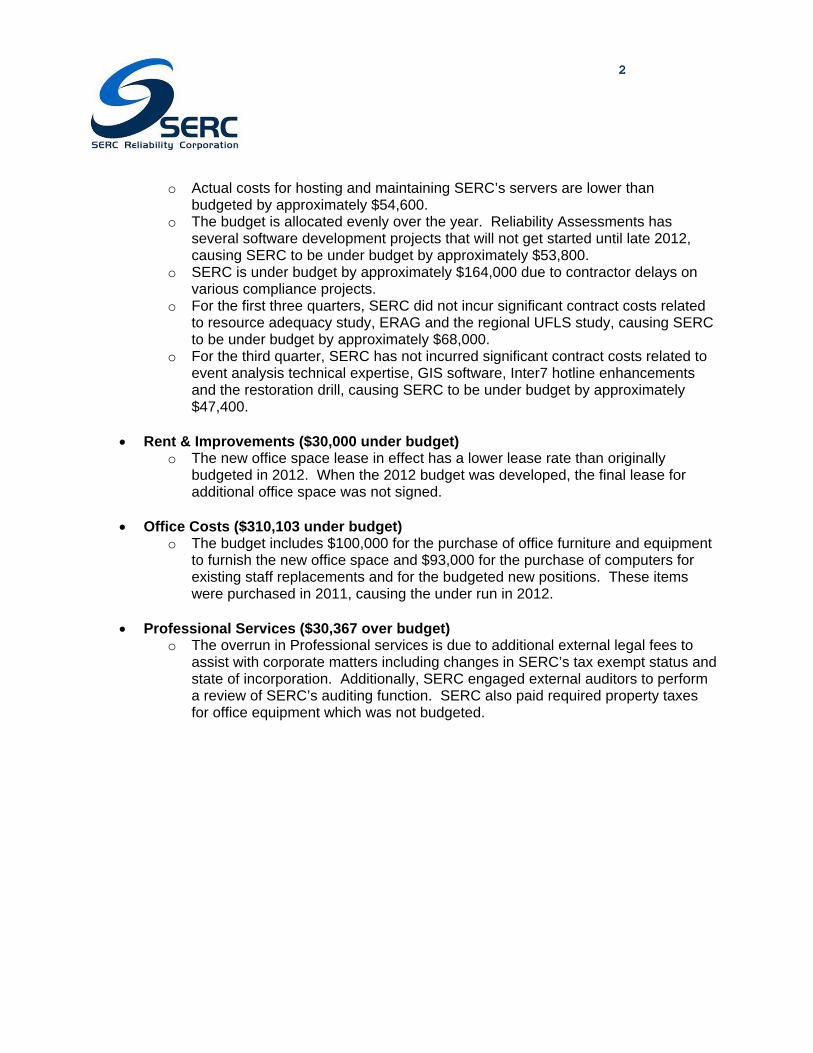
2
o Actual costs for hosting and maintaining SERC’s servers are lower than
budgeted by approximately $54,600. o The budget is allocated evenly over the year. Reliability Assessments has
several software development projects that will not get started until late 2012, causing SERC to be under budget by approximately $53,800.
o SERC is under budget by approximately $164,000 due to contractor delays on various compliance projects.
o For the first three quarters, SERC did not incur significant contract costs related to resource adequacy study, ERAG and the regional UFLS study, causing SERC to be under budget by approximately $68,000.
o For the third quarter, SERC has not incurred significant contract costs related to event analysis technical expertise, GIS software, Inter7 hotline enhancements and the restoration drill, causing SERC to be under budget by approximately $47,400.
Rent & Improvements ($30,000 under budget)
o The new office space lease in effect has a lower lease rate than originally budgeted in 2012. When the 2012 budget was developed, the final lease for additional office space was not signed.
Office Costs ($310,103 under budget) o The budget includes $100,000 for the purchase of office furniture and equipment
to furnish the new office space and $93,000 for the purchase of computers for existing staff replacements and for the budgeted new positions. These items were purchased in 2011, causing the under run in 2012.
Professional Services ($30,367 over budget)
o The overrun in Professional services is due to additional external legal fees to assist with corporate matters including changes in SERC’s tax exempt status and state of incorporation. Additionally, SERC engaged external auditors to perform a review of SERC’s auditing function. SERC also paid required property taxes for office equipment which was not budgeted.
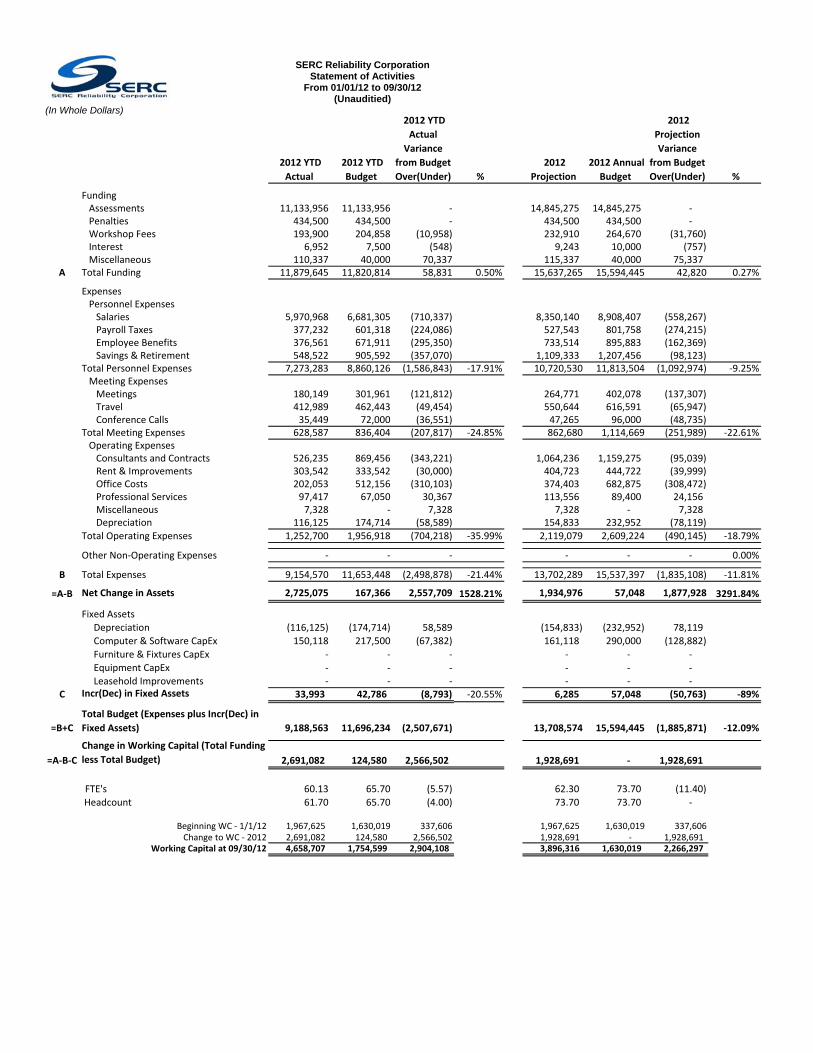
(In Whole Dollars)
2012 YTD 2012 YTD
2012 YTD
Actual
Variance
from Budget 2012 2012 Annual
2012
Projection
Variance
from Budget
SERC Reliability Corporation Statement of Activities
From 01/01/12 to 09/30/12 (Unauditied)
Actual Budget Over(Under) % Projection Budget Over(Under) %
Funding Assessments 11,133,956 11,133,956 ‐ 14,845,275 14,845,275 ‐ Penalties 434,500 434,500 ‐ 434,500 434,500 ‐ Workshop Fees 193,900 204,858 (10,958) 232,910 264,670 (31,760) Interest 6,952 7,500 (548) 9,243 10,000 (757) Miscellaneous 110,337 40,000 70,337 115,337 40,000 75,337
A Total Funding 11,879,645 11,820,814 58,831 0.50% 15,637,265 15,594,445 42,820 0.27%
ExpensesExpenses Personnel Expenses Salaries 5,970,968 6,681,305 (710,337) 8,350,140 8,908,407 (558,267) Payroll Taxes 377,232 601,318 (224,086) 527,543 801,758 (274,215) Employee Benefits 376,561 671,911 (295,350) 733,514 895,883 (162,369) Savings & Retirement 548,522 905,592 (357,070) 1,109,333 1,207,456 (98,123) Total Personnel Expenses 7,273,283 8,860,126 (1,586,843) ‐17.91% 10,720,530 11,813,504 (1,092,974) ‐9.25% Meeting Expenses Meetings 180,149 301,961 (121,812) 264,771 402,078 (137,307) Travel 412,989 462,443 (49,454) 550,644 616,591 (65,947)
C f C ll 35 449 72 000 (36 551) 47 265 96 000 (48 735) Conference Calls 35,449 72,000 (36,551) 47,265 96,000 (48,735) Total Meeting Expenses 628,587 836,404 (207,817) ‐24.85% 862,680 1,114,669 (251,989) ‐22.61% Operating Expenses Consultants and Contracts 526,235 869,456 (343,221) 1,064,236 1,159,275 (95,039) Rent & Improvements 303,542 333,542 (30,000) 404,723 444,722 (39,999) Office Costs 202,053 512,156 (310,103) 374,403 682,875 (308,472) Professional Services 97,417 67,050 30,367 113,556 89,400 24,156 Miscellaneous 7,328 ‐ 7,328 7,328 ‐ 7,328 Depreciation 116,125 174,714 (58,589) 154,833 232,952 (78,119)
Total Operating Expenses 1,252,700 1,956,918 (704,218) ‐35.99% 2,119,079 2,609,224 (490,145) ‐18.79%p g p , , , , ( , ) , , , , ( , )
Other Non‐Operating Expenses ‐ ‐ ‐ ‐ ‐ ‐ 0.00%
B Total Expenses 9,154,570 11,653,448 (2,498,878) ‐21.44% 13,702,289 15,537,397 (1,835,108) ‐11.81%
=A‐B Net Change in Assets 2,725,075 167,366 2,557,709 1528.21% 1,934,976 57,048 1,877,928 3291.84%
Fixed Assets
Depreciation (116,125) (174,714) 58,589 (154,833) (232,952) 78,119
Computer & Software CapEx 150,118 217,500 (67,382) 161,118 290,000 (128,882)
Furniture & Fixtures CapEx ‐ ‐ ‐ ‐ ‐ ‐
Equipment CapEx ‐ ‐ ‐ ‐ ‐ ‐
Leasehold Improvements ‐ ‐ ‐ ‐ ‐ ‐ C Incr(Dec) in Fixed Assets 33,993 42,786 (8,793) ‐20.55% 6,285 57,048 (50,763) ‐89%
=B+C
Total Budget (Expenses plus Incr(Dec) in
Fixed Assets) 9,188,563 11,696,234 (2,507,671) 13,708,574 15,594,445 (1,885,871) ‐12.09%
=A‐B‐C
Change in Working Capital (Total Funding
less Total Budget) 2,691,082 124,580 2,566,502 1,928,691 ‐ 1,928,691
FTE' 60 13 65 70 (5 57) 62 30 73 70 (11 40)FTE's 60.13 65.70 (5.57) 62.30 73.70 (11.40)
Headcount 61.70 65.70 (4.00) 73.70 73.70 ‐
Beginning WC ‐ 1/1/12 1,967,625 1,630,019 337,606 1,967,625 1,630,019 337,606 Change to WC ‐ 2012 2,691,082 124,580 2,566,502 1,928,691 ‐ 1,928,691
Working Capital at 09/30/12 4,658,707 1,754,599 2,904,108 3,896,316 1,630,019 2,266,297
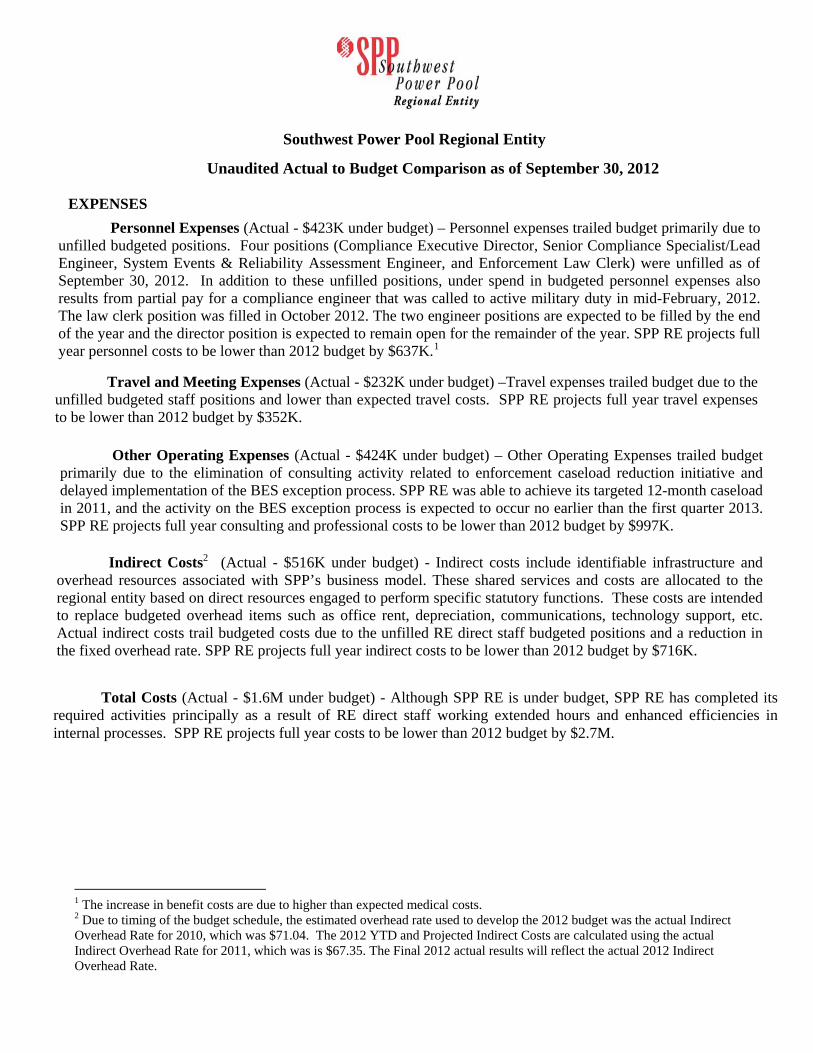
Southwest Power Pool Regional Entity
Unaudited Actual to Budget Comparison as of September 30, 2012
EXPENSES
Personnel Expenses (Actual - $423K under budget) – Personnel expenses trailed budget primarily due tounfilled budgeted positions. Four positions (Compliance Executive Director, Senior Compliance Specialist/Lead Engineer, System Events & Reliability Assessment Engineer, and Enforcement Law Clerk) were unfilled as ofSeptember 30, 2012. In addition to these unfilled positions, under spend in budgeted personnel expenses alsoresults from partial pay for a compliance engineer that was called to active military duty in mid-February, 2012. The law clerk position was filled in October 2012. The two engineer positions are expected to be filled by the endof the year and the director position is expected to remain open for the remainder of the year. SPP RE projects full year personnel costs to be lower than 2012 budget by $637K.1
Travel and Meeting Expenses (Actual - $232K under budget) –Travel expenses trailed budget due to the unfilled budgeted staff positions and lower than expected travel costs. SPP RE projects full year travel expenses to be lower than 2012 budget by $352K.
Other Operating Expenses (Actual - $424K under budget) – Other Operating Expenses trailed budget primarily ue to the elimination of consulting activity related to enforcement caseload reduction initiative and d delayed implementation of the BES exception process. SPP RE was able to achieve its targeted 12-month caseload in 2011, and the activity on the BES exception process is expected to occur no earlier than the first quarter 2013. SPP RE projects full year consulting and professional costs to be lower than 2012 budget by $997K.
Indirect Costs22 (Actual - $516K under budget) - Indirect costs include identifiable infrastructure andoverhead resources associated with SPP’s business model. These shared services and costs are allocated to theregional entity based on direct resources engaged to perform specific statutory functions. These costs are intendedto replace budgeted overhead items such as office rent, depreciation, communications, technology support, etc.Actual indirect costs trail budgeted costs due to the unfilled RE direct staff budgeted positions and a reduction inthe fixed overhead rate. SPP RE projects full year indirect costs to be lower than 2012 budget by $716K.
Total Costs (Actual - $1.6M under budget) - Although SPP RE is under budget, SPP RE has completed its required activities principally as a result of RE direct staff working extended hours and enhanced efficiencies in internal processes. SPP RE projects full year costs to be lower than 2012 budget by $2.7M.
1 The increase in benefit costs are due to higher than expected medical costs. 2 Due to timing of the budget schedule, the estimated overhead rate used to develop the 2012 budget was the actual Indirect Overhead Rate for 2010, which was $71.04. The 2012 YTD and Projected Indirect Costs are calculated using the actual Indirect Overhead Rate for 2011, which was is $67.35. The Final 2012 actual results will reflect the actual 2012 Indirect Overhead Rate.
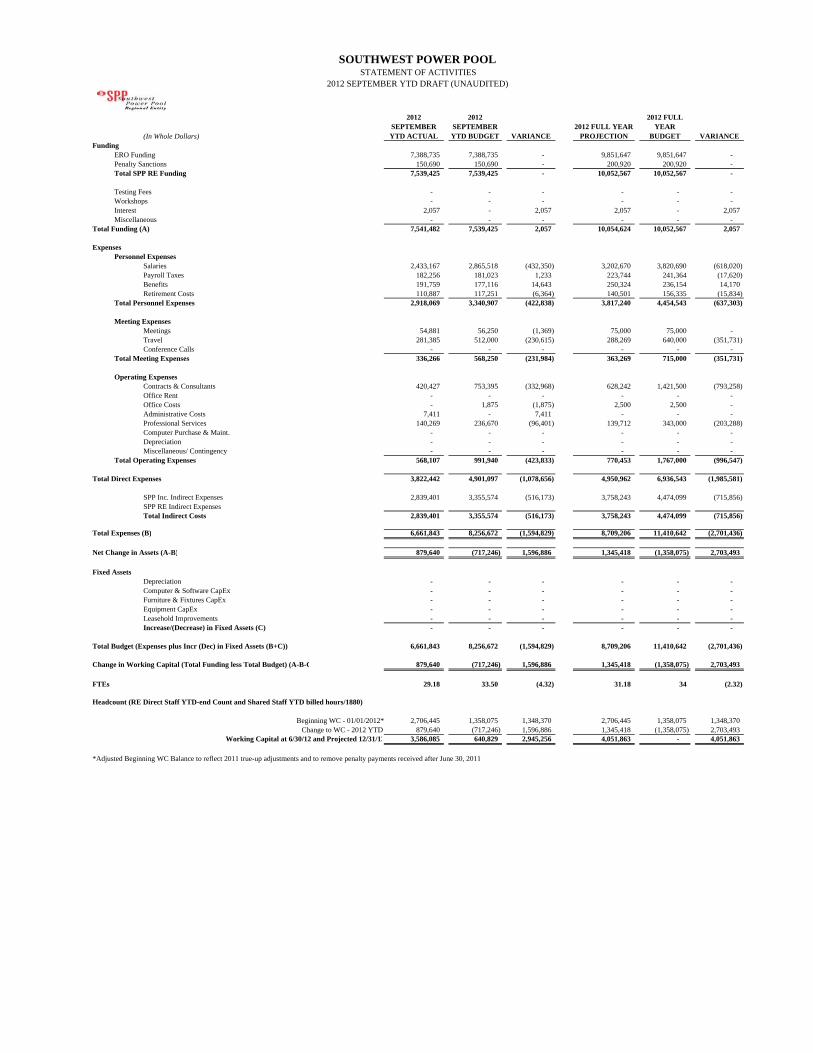
2
SOUTHWEST POWER POOLSTATEMENT OF ACTIVITIES
2012 SEPTEMBER YTD DRAFT (UNAUDITED)
(In Whole Dollars)
2012 SEPTEMBER YTD ACTUAL
2012 SEPTEMBER YTD BUDGET VARIANCE
2012 FULL YEAR PROJECTION
2012 FULL YEAR
BUDGET VARIANCEFunding
ERO Funding 7,388,735 7,388,735 - 9,851,647 9,851,647 - Penalty Sanctions 150,690 150,690 - 200,920 200,920 - Total SPP RE Funding 7,539,425 7,539,425 - 10,052,567 10,052,567 -
Testing Fees - - - - - - Workshops - - - - - - Interest 2,057 - 2,057 2,057 - 2,057 Miscellaneous - - - - - -
Total Funding (A) 7,541,482 7,539,425 2,057 10,054,624 10,052,567 2,057
ExpensesPersonnel Expenses
Salaries 2,433,167 2,865,518 (432,350) 3,202,670 3,820,690 (618,020) Payroll Taxes 182,256 181,023 1,233 223,744 241,364 (17,620) Benefits 191,759 177,116 14,643 250,324 236,154 14,170 Retirement Costs 110,887 117,251 (6,364) 140,501 156,335 (15,834)
Total Personnel Expenses 2,918,069 3,340,907 (422,838) 3,817,240 4,454,543 (637,303)
Meeting ExpensesMeetings 54,881 56,250 (1,369) 75,000 75,000 - Travel 281,385 512,000 (230,615) 288,269 640,000 (351,731) Conference Calls - - - - - -
Total Meeting Expenses 336,266 568,250 (231,984) 363,269 715,000 (351,731)
Operating ExpensesContracts & Consultants 420,427 753,395 (332,968) 628,242 1,421,500 (793,258) Office Rent - - - - - - Office Costs - 1,875 (1,875) 2,500 2,500 - Administrative Costs 7,411 - 7,411 - - - Professional Services 140,269 236,670 (96,401) 139,712 343,000 (203,288) Computer Purchase & Maint. - - - - - -
Services Depreciation - - - - - - Furniture Miscellaneous/ Contingency - - - - - - Total Operating Expenses 568,107 991,940 (423,833) 770,453 1,767,000 (996,547)
Total Direct Expenses 3,822,442 4,901,097 (1,078,656) 4,950,962 6,936,543 (1,985,581)
SPP Inc. Indirect Expenses 2,839,401 3,355,574 (516,173) 3,758,243 4,474,099 (715,856) SPP RE Indirect ExpensesTotal Indirect Costs 2,839,401 3,355,574 (516,173) 3,758,243 4,474,099 (715,856)
Total Expenses (B) 6,661,843 8,256,672 (1,594,829) 8,709,206 11,410,642 (2,701,436)
Net Change in Assets (A-B) 879,640 (717,246) 1,596,886 1,345,418 (1,358,075) 2,703,493
Fixed AssetsDepreciation - - - - - - Computer & Software CapEx - - - - - - Furniture & Fixtures CapEx - - - - - - Equipment CapEx - - - - - - Leasehold Improvements - - - - - - Increase/(Decrease) in Fixed Assets (C) - - - - - -
Total Budget (Expenses plus Incr (Dec) in Fixed Assets (B+C)) 6,661,843 8,256,672 (1,594,829) 8,709,206 11,410,642 (2,701,436)
Change in Working Capital (Total Funding less Total Budget) (A-B-C 879,640 (717,246) 1,596,886 1,345,418 (1,358,075) 2,703,493
FTEs 29.18 33.50 (4.32) 31.18 34 (2.32)
Headcount (RE Direct Staff YTD-end Count and Shared Staff YTD billed hours/1880)
Beginning WC - 01/01/2012* 2,706,445 1,358,075 1,348,370 2,706,445 1,358,075 1,348,370 Change to WC - 2012 YTD 879,640 (717,246) 1,596,886 1,345,418 (1,358,075) 2,703,493
Working Capital at 6/30/12 and Projected 12/31/1 3,586,085 640,829 2,945,256 4,051,863 - 4,051,863
*Adjusted Beginning WC Balance to reflect 2011 true-up adjustments and to remove penalty payments received after June 30, 2011

805 Las Cimas Parkway, Ste 200 PAGE 1 of 4 TRE LIMITED Austin, Texas 78746 Tel: (512) 583-4900
October 12, 2012 Mr. Michael Walker Ms. Susan Turpen North American Electric Reliability Corporation 3353 Peachtree Road NE Suite 600, North Tower Atlanta, GA 30326 RE: Texas Reliability Entity, Inc. Third Quarter 2012 Statement of Activities Variance Report Dear Mr. Walker and Ms. Turpen, The third quarter variance report Texas RE is attached. Please contact me if you have questions or comments. Thank you. Judy Foppiano Judy A. Foppiano, CPA Finance & Accounting Manager Texas Reliability Entity, Inc. 805 Los Cimas Parkway, Suite 200 Austin, Texas 78746 [email protected] 512.583.4959
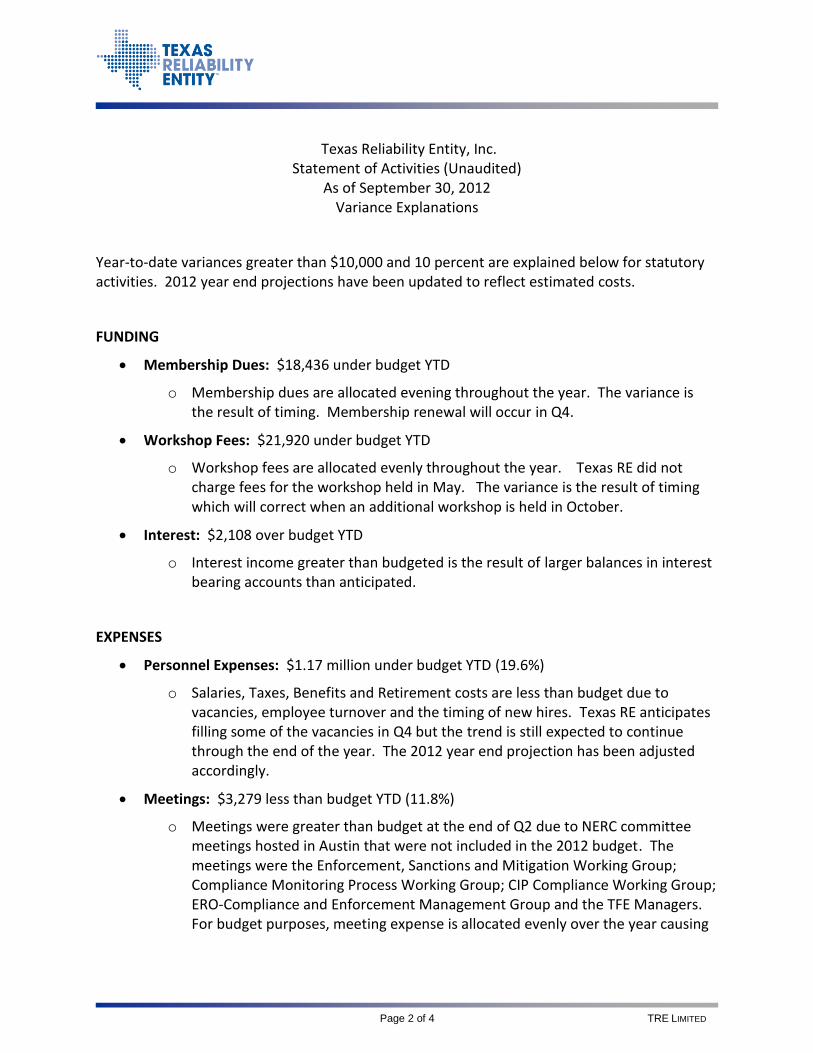
Page 2 of 4 TRE LIMITED
Texas Reliability Entity, Inc.
Statement of Activities (Unaudited) As of September 30, 2012
Variance Explanations
Year-to-date variances greater than $10,000 and 10 percent are explained below for statutory activities. 2012 year end projections have been updated to reflect estimated costs.
FUNDING
Membership Dues: $18,436 under budget YTD
o Membership dues are allocated evening throughout the year. The variance is the result of timing. Membership renewal will occur in Q4.
Workshop Fees: $21,920 under budget YTD
o Workshop fees are allocated evenly throughout the year. Texas RE did not charge fees for the workshop held in May. The variance is the result of timing which will correct when an additional workshop is held in October.
Interest: $2,108 over budget YTD
o Interest income greater than budgeted is the result of larger balances in interest bearing accounts than anticipated.
EXPENSES
Personnel Expenses: $1.17 million under budget YTD (19.6%)
o Salaries, Taxes, Benefits and Retirement costs are less than budget due to vacancies, employee turnover and the timing of new hires. Texas RE anticipates filling some of the vacancies in Q4 but the trend is still expected to continue through the end of the year. The 2012 year end projection has been adjusted accordingly.
Meetings: $3,279 less than budget YTD (11.8%)
o Meetings were greater than budget at the end of Q2 due to NERC committee meetings hosted in Austin that were not included in the 2012 budget. The meetings were the Enforcement, Sanctions and Mitigation Working Group; Compliance Monitoring Process Working Group; CIP Compliance Working Group; ERO-Compliance and Enforcement Management Group and the TFE Managers. For budget purposes, meeting expense is allocated evenly over the year causing
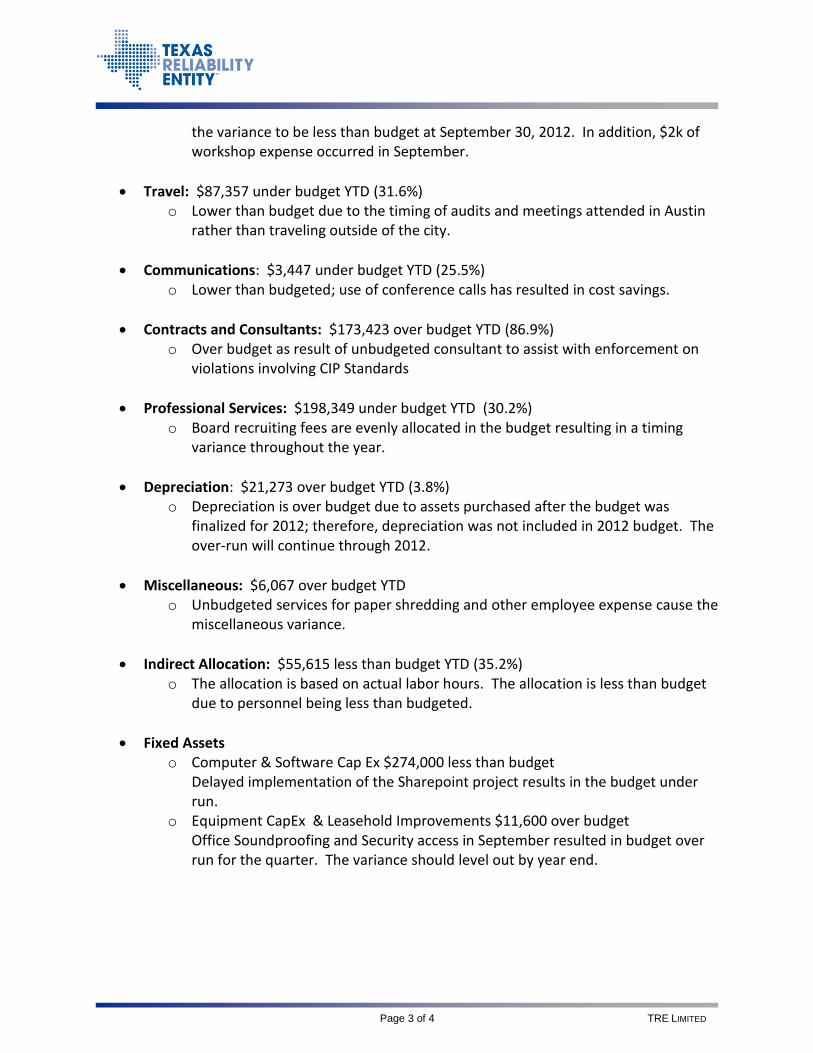
Page 3 of 4 TRE LIMITED
the variance to be less than budget at September 30, 2012. In addition, $2k of workshop expense occurred in September.
Travel: $87,357 under budget YTD (31.6%) o Lower than budget due to the timing of audits and meetings attended in Austin
rather than traveling outside of the city.
Communications: $3,447 under budget YTD (25.5%) o Lower than budgeted; use of conference calls has resulted in cost savings.
Contracts and Consultants: $173,423 over budget YTD (86.9%) o Over budget as result of unbudgeted consultant to assist with enforcement on
violations involving CIP Standards
Professional Services: $198,349 under budget YTD (30.2%) o Board recruiting fees are evenly allocated in the budget resulting in a timing
variance throughout the year.
Depreciation: $21,273 over budget YTD (3.8%) o Depreciation is over budget due to assets purchased after the budget was
finalized for 2012; therefore, depreciation was not included in 2012 budget. The over-run will continue through 2012.
Miscellaneous: $6,067 over budget YTD o Unbudgeted services for paper shredding and other employee expense cause the
miscellaneous variance.
Indirect Allocation: $55,615 less than budget YTD (35.2%) o The allocation is based on actual labor hours. The allocation is less than budget
due to personnel being less than budgeted.
Fixed Assets o Computer & Software Cap Ex $274,000 less than budget
Delayed implementation of the Sharepoint project results in the budget under run.
o Equipment CapEx & Leasehold Improvements $11,600 over budget Office Soundproofing and Security access in September resulted in budget over run for the quarter. The variance should level out by year end.
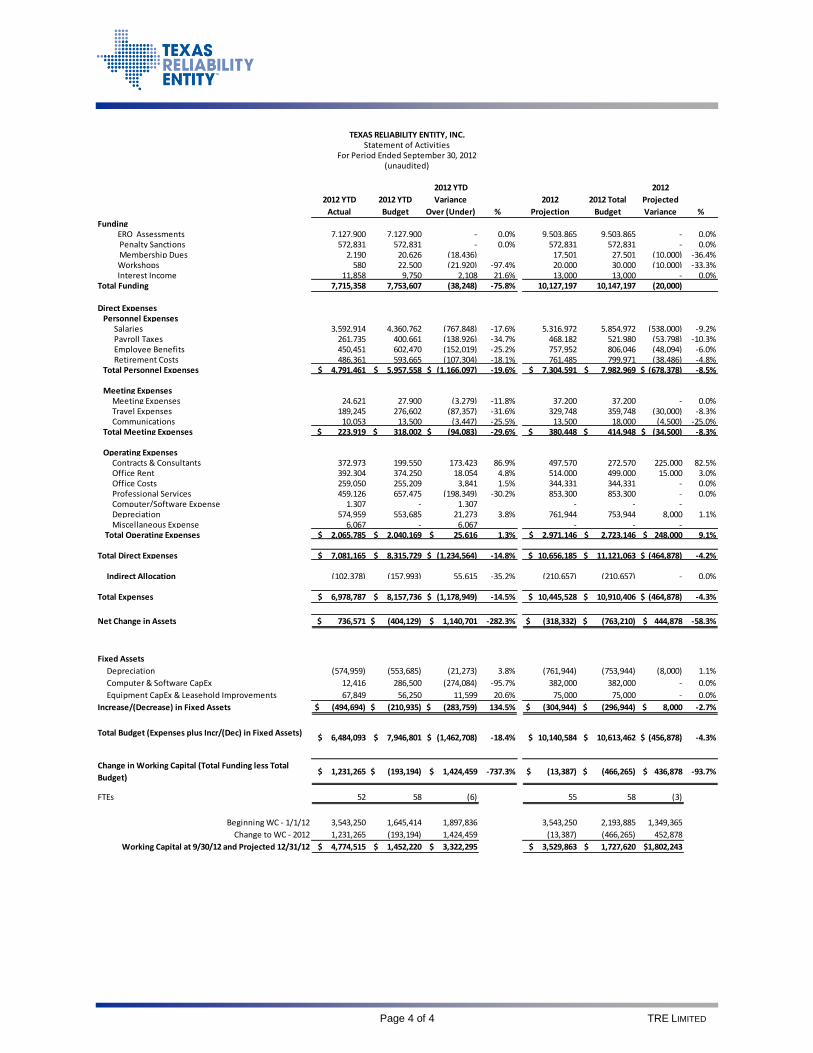
Page 4 of 4 TRE LIMITED
2012 YTD
Actual
2012 YTD
Budget
2012 YTD
Variance
Over (Under) %
2012
Projection
2012 Total
Budget
2012
Projected
Variance %
Funding ERO Assessments 7,127,900 7,127,900 - 0.0% 9,503,865 9,503,865 - 0.0% Penalty Sanctions 572,831 572,831 - 0.0% 572,831 572,831 - 0.0% Membership Dues 2,190 20,626 (18,436) 17,501 27,501 (10,000) -36.4% Workshops 580 22,500 (21,920) -97.4% 20,000 30,000 (10,000) -33.3% Interest Income 11,858 9,750 2,108 21.6% 13,000 13,000 - 0.0%Total Funding 7,715,358 7,753,607 (38,248) -75.8% 10,127,197 10,147,197 (20,000)
Direct Expenses Personnel Expenses Salaries 3,592,914 4,360,762 (767,848) -17.6% 5,316,972 5,854,972 (538,000) -9.2% Payroll Taxes 261,735 400,661 (138,926) -34.7% 468,182 521,980 (53,798) -10.3% Employee Benefits 450,451 602,470 (152,019) -25.2% 757,952 806,046 (48,094) -6.0% Retirement Costs 486,361 593,665 (107,304) -18.1% 761,485 799,971 (38,486) -4.8% Total Personnel Expenses $ 4,791,461 $ 5,957,558 $ (1,166,097) -19.6% $ 7,304,591 $ 7,982,969 $ (678,378) -8.5%
Meeting Expenses Meeting Expenses 24,621 27,900 (3,279) -11.8% 37,200 37,200 - 0.0% Travel Expenses 189,245 276,602 (87,357) -31.6% 329,748 359,748 (30,000) -8.3% Communications 10,053 13,500 (3,447) -25.5% 13,500 18,000 (4,500) -25.0% Total Meeting Expenses $ 223,919 $ 318,002 $ (94,083) -29.6% $ 380,448 $ 414,948 $ (34,500) -8.3%
Operating Expenses Contracts & Consultants 372,973 199,550 173,423 86.9% 497,570 272,570 225,000 82.5% Office Rent 392,304 374,250 18,054 4.8% 514,000 499,000 15,000 3.0% Office Costs 259,050 255,209 3,841 1.5% 344,331 344,331 - 0.0% Professional Services 459,126 657,475 (198,349) -30.2% 853,300 853,300 - 0.0% Computer/Software Expense 1,307 - 1,307 - - - Depreciation 574,959 553,685 21,273 3.8% 761,944 753,944 8,000 1.1% Miscellaneous Expense 6,067 - 6,067 - - - Total Operating Expenses $ 2,065,785 $ 2,040,169 $ 25,616 1.3% $ 2,971,146 $ 2,723,146 $ 248,000 9.1%
Total Direct Expenses $ 7,081,165 $ 8,315,729 $ (1,234,564) -14.8% $ 10,656,185 $ 11,121,063 $ (464,878) -4.2%
Indirect Allocation (102,378) (157,993) 55,615 -35.2% (210,657) (210,657) - 0.0%
Total Expenses $ 6,978,787 $ 8,157,736 $ (1,178,949) -14.5% $ 10,445,528 $ 10,910,406 $ (464,878) -4.3%
Net Change in Assets $ 736,571 $ (404,129) $ 1,140,701 -282.3% $ (318,332) $ (763,210) $ 444,878 -58.3%
Fixed Assets
Depreciation (574,959) (553,685) (21,273) 3.8% (761,944) (753,944) (8,000) 1.1%
Computer & Software CapEx 12,416 286,500 (274,084) -95.7% 382,000 382,000 - 0.0%
Equipment CapEx & Leasehold Improvements 67,849 56,250 11,599 20.6% 75,000 75,000 - 0.0%
Increase/(Decrease) in Fixed Assets $ (494,694) $ (210,935) $ (283,759) 134.5% $ (304,944) $ (296,944) $ 8,000 -2.7%
Total Budget (Expenses plus Incr/(Dec) in Fixed Assets) $ 6,484,093 $ 7,946,801 $ (1,462,708) -18.4% $ 10,140,584 $ 10,613,462 $ (456,878) -4.3%
Change in Working Capital (Total Funding less Total
Budget) $ 1,231,265 $ (193,194) $ 1,424,459 -737.3% $ (13,387) $ (466,265) $ 436,878 -93.7%
FTEs 52 58 (6) 55 58 (3)
Beginning WC - 1/1/12 3,543,250 1,645,414 1,897,836 3,543,250 2,193,885 1,349,365
Change to WC - 2012 1,231,265 (193,194) 1,424,459 (13,387) (466,265) 452,878
Working Capital at 9/30/12 and Projected 12/31/12 $ 4,774,515 $ 1,452,220 $ 3,322,295 $ 3,529,863 $ 1,727,620 $1,802,243
TEXAS RELIABILITY ENTITY, INC.Statement of Activities
For Period Ended September 30, 2012(unaudited)
W E S T E R N E L E C T R I C I T Y C O O R D I N A T I N G C O U N C I L • W W W . W E C C . B I Z 1 5 5 N O R T H 4 0 0 W E ST • S U I T E 2 0 0 • S A L T L A K E C I T Y • U T A H • 8 4 1 0 3 - 1 1 1 4 • P H 8 0 1 . 5 8 2 . 0 35 3 • F X 8 0 1 . 5 8 2 . 3 9 1 8
Jillian Lessner Director of Finance and Accounting
801-883-6872
October 19, 2012
Mr. Michael Walker Senior Vice President, Chief Financial and Administrative Officer North American Electric Reliability Corporation 3353 Peachtree Road, N.E. Suite 600, North Tower Atlanta, Georgia 30326 RE: WECC Q3 2012 Statement of Activities and Variance Report Dear Mr. Walker: Attached are WECC’s third quarter Statement of Activities (Unaudited) and variance explanation report. If you have any questions or need additional information, please do not hesitate to contact me. Regards,
Jillian Lessner Director of Finance and Accounting
Enclosures
cc: Mark Maher, Chief Executive Officer David Godfrey, Vice President of Shared Services WECC Finance and Audit Committee
Susan Turpen, NERC Controller
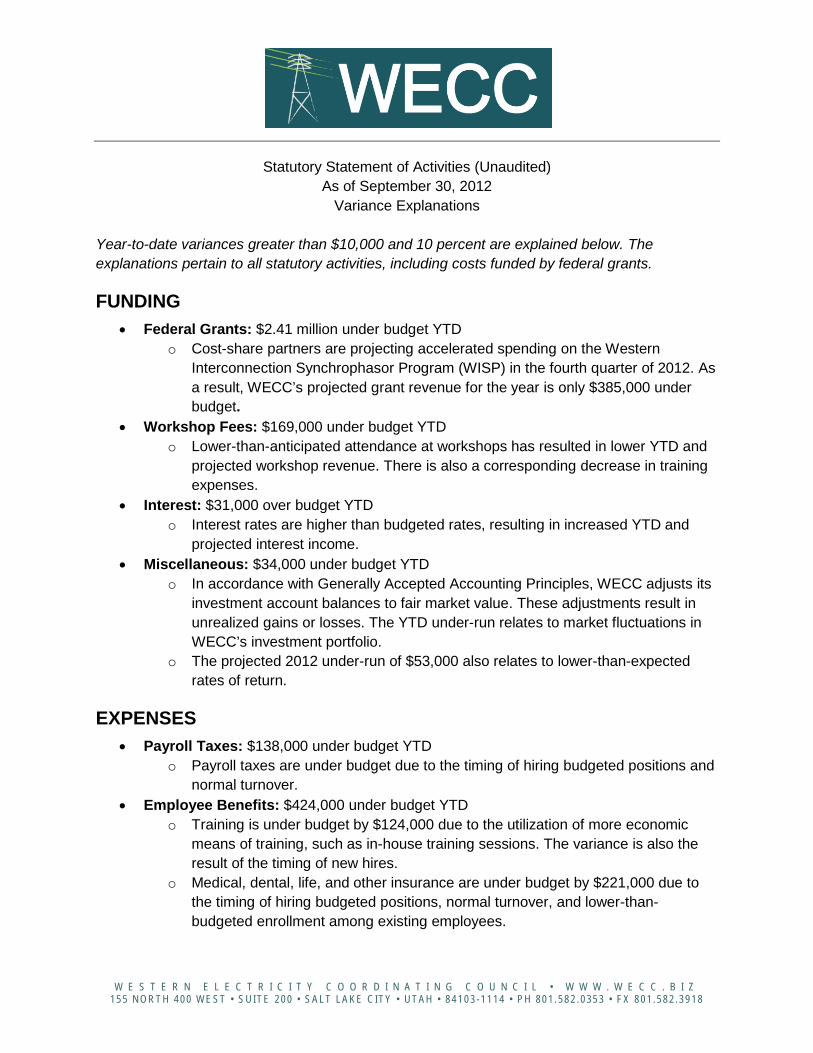
W E S T E R N E L E C T R I C I T Y C O O R D I N A T I N G C O U N C I L • W W W . W E C C . B I Z 1 5 5 N O R T H 4 0 0 W E ST • S U I T E 2 0 0 • S A L T L A K E C I T Y • U T A H • 8 4 1 0 3 - 1 1 1 4 • P H 8 0 1 . 5 8 2 . 0 35 3 • F X 8 0 1 . 5 8 2 . 3 9 1 8
Statutory Statement of Activities (Unaudited) As of September 30, 2012
Variance Explanations Year-to-date variances greater than $10,000 and 10 percent are explained below. The explanations pertain to all statutory activities, including costs funded by federal grants.
FUNDING • Federal Grants: $2.41 million under budget YTD
o Cost-share partners are projecting accelerated spending on the Western Interconnection Synchrophasor Program (WISP) in the fourth quarter of 2012. As a result, WECC’s projected grant revenue for the year is only $385,000 under budget.
• Workshop Fees: $169,000 under budget YTD o Lower-than-anticipated attendance at workshops has resulted in lower YTD and
projected workshop revenue. There is also a corresponding decrease in training expenses.
• Interest: $31,000 over budget YTD o Interest rates are higher than budgeted rates, resulting in increased YTD and
projected interest income. • Miscellaneous: $34,000 under budget YTD
o In accordance with Generally Accepted Accounting Principles, WECC adjusts its investment account balances to fair market value. These adjustments result in unrealized gains or losses. The YTD under-run relates to market fluctuations in WECC’s investment portfolio.
o The projected 2012 under-run of $53,000 also relates to lower-than-expected rates of return.
EXPENSES • Payroll Taxes: $138,000 under budget YTD
o Payroll taxes are under budget due to the timing of hiring budgeted positions and normal turnover.
• Employee Benefits: $424,000 under budget YTD o Training is under budget by $124,000 due to the utilization of more economic
means of training, such as in-house training sessions. The variance is also the result of the timing of new hires.
o Medical, dental, life, and other insurance are under budget by $221,000 due to the timing of hiring budgeted positions, normal turnover, and lower-than-budgeted enrollment among existing employees.

October 19, 2012 Page - 2
W E S T E R N E L E C T R I C I T Y C O O R D I N A T I N G C O U N C I L • W W W . W E C C . B I Z 1 5 5 N O R T H 4 0 0 W E ST • S U I T E 2 0 0 • S A L T L A K E C I T Y • U T A H • 8 4 1 0 3 - 1 1 1 4 • P H 8 0 1 . 5 8 2 . 0 35 3 • F X 8 0 1 . 5 8 2 . 3 9 1 8
o Other benefits are under budget by $79,000 due to the timing of new hires and normal turnover.
• Meetings: $267,000 under budget YTD o Meetings are under budget due to increased use of the Salt Lake City meeting
facilities instead of hotels. • Travel: $362,000 under budget YTD
o Greater-than-budgeted use of the Salt Lake City meeting facilities has resulted in less travel by WECC employees.
o Travel is also under budget due to staffing levels. • Conference Calls: $88,000 under budget YTD
o Actual conference call usage is less than budgeted. • Consultants and Contracts: $6.29 million under budget YTD
o Consultants and Contracts costs associated with the grants are under budget by $6.06 million due to timing of work performed varying from the straight-lined budget.
o Consultants and Contracts costs not associated with the grants are under budget by $233,000 as a result of timing variances related to the Base Case Coordination System project.
• Professional Services: $160,000 under budget YTD o Professional Services are under budget due to higher-than-budgeted use of
WECC employees instead of consulting services. • Depreciation: $428,000 over budget YTD
o Depreciation is evenly budgeted throughout the year. In September, an estimate was recorded based on fixed asset purchases during the first nine months of the year. Actual depreciation will be recorded in December as part of the Company’s year-end closing procedures
• Other Non-Operating Expenses: $91,000 under budget YTD o Other Non-Operating Expenses are under budget by $91,000 as a result of a
lower-than-budgeted non-statutory overhead allocation for the first, second, and third quarters. This allocation is based on the expenses in general and administrative departments, which are under budget YTD.
FIXED ASSETS • Computer & Software CapEx: $3.56 million over budget YTD
o Computer & Software CapEx costs associated with the grants are over budget by $3.31 million as a result of timing variances related to grant assets budgeted in 2011 that were purchased in 2012. Also, there has been a significant increase in the internal development of custom software, which must be capitalized, in place of expensed third-party-provider license fees.
o Computer & Software CapEx costs not associated with the grants are over budget by $251,000 as a result of timing variances related to Reliability Coordination assets budgeted in 2011 that were purchased in 2012.
October 19, 2012 Page - 3
W E S T E R N E L E C T R I C I T Y C O O R D I N A T I N G C O U N C I L • W W W . W E C C . B I Z 1 5 5 N O R T H 4 0 0 W E ST • S U I T E 2 0 0 • S A L T L A K E C I T Y • U T A H • 8 4 1 0 3 - 1 1 1 4 • P H 8 0 1 . 5 8 2 . 0 35 3 • F X 8 0 1 . 5 8 2 . 3 9 1 8
• Equipment CapEx: $994,000 over budget YTD o The YTD and projected over-runs relate mainly to grant assets budgeted in 2011
that were purchased or will be purchased in 2012.
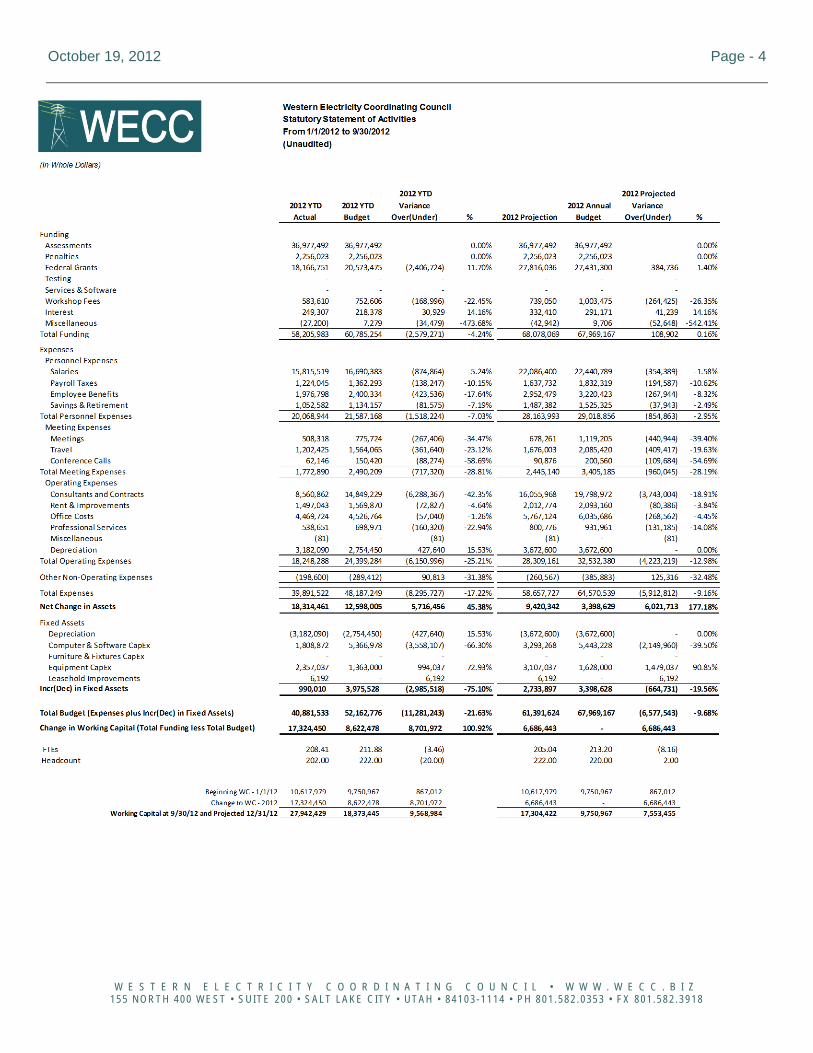
October 19, 2012 Page - 4
W E S T E R N E L E C T R I C I T Y C O O R D I N A T I N G C O U N C I L • W W W . W E C C . B I Z 1 5 5 N O R T H 4 0 0 W E ST • S U I T E 2 0 0 • S A L T L A K E C I T Y • U T A H • 8 4 1 0 3 - 1 1 1 4 • P H 8 0 1 . 5 8 2 . 0 35 3 • F X 8 0 1 . 5 8 2 . 3 9 1 8
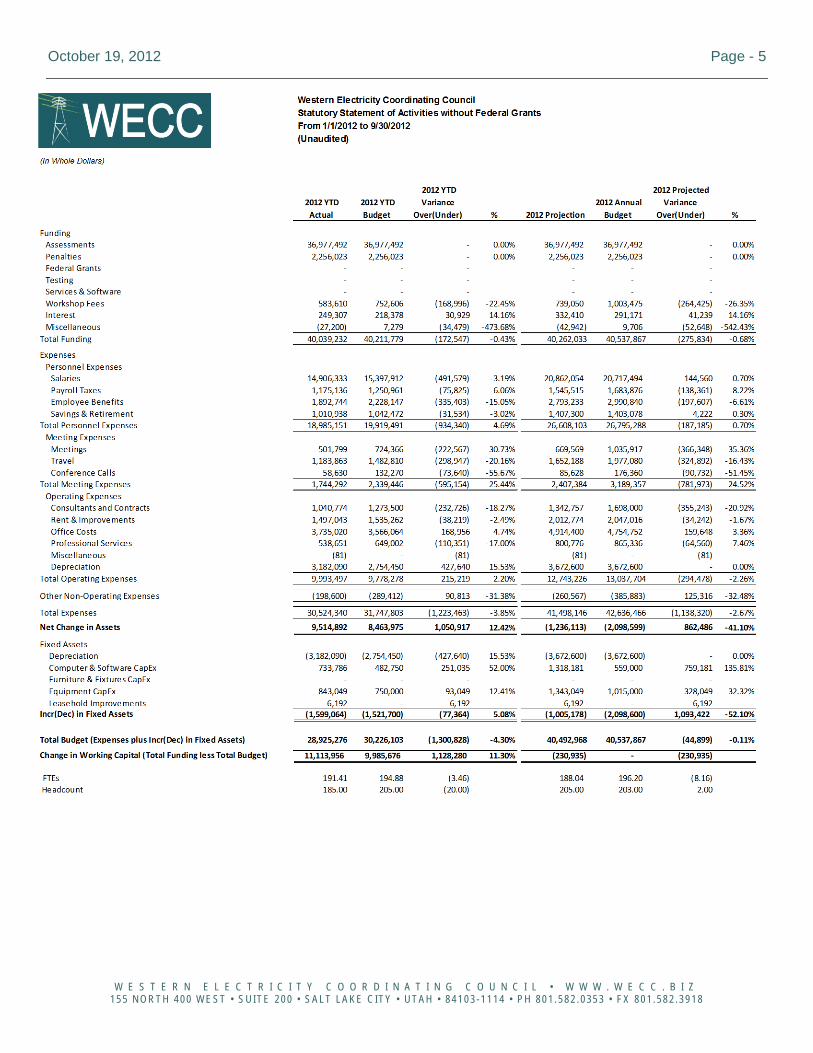
October 19, 2012 Page - 5
W E S T E R N E L E C T R I C I T Y C O O R D I N A T I N G C O U N C I L • W W W . W E C C . B I Z 1 5 5 N O R T H 4 0 0 W E ST • S U I T E 2 0 0 • S A L T L A K E C I T Y • U T A H • 8 4 1 0 3 - 1 1 1 4 • P H 8 0 1 . 5 8 2 . 0 35 3 • F X 8 0 1 . 5 8 2 . 3 9 1 8
Agenda Item 4 FAC Meeting October 31, 2012
Three-Year Financial Performance Review
Action None Summary The committee requested that management provide some historic information regarding budget to actual performance for NERC and the Regional Entities. Attached is a summary of budget to actual performance for NERC and the Regional Entities for calendar years 2009, 2010 and 2011. This information was compiled using the annual true up filings at FERC and reflected audited results for the applicable year. For the years ending December 31, 2011, 2010 and 2009, the Total Budget (expenses plus the increase or decrease in fixed assets) for the Total ERO Enterprise (NERC and the Regional Entities) was under budget 2.6%, 7.6%, and 7.5%, respectively.1
The decrease in the Total Budget variance from -7.5% in 2009 to -2.6% in 2011 is at least in part attributable to the experience gained in budgeting by NERC and the Regional Entities as the ERO matured.
As reflected on Attachment 1, all major expense categories were under budget in each year with the exception of Fixed Assets in 2011, which were over budget $2.8 million (199.6%) primarily due to additional costs associated with NERC’s planned relocation of the office and data center, and Total Operating Expenses in 2009, which were over budget $1.8 million (5.5%) primarily related to depreciation expense. In 2009, NERC and all Regions except Texas Regional Entity did not include depreciation expense in their budgets but recorded actual expense in their true up filing with FERC. The variances comparing actual results to budget for NERC and each of the Regional Entities for each year are reflected on Attachment 2. In 2011, NERC was over budget $2.6 million (5.3%) which, as noted above and in the detailed variance reports provided to the committee and posted with the committee agendas in 2011, was primarily due to additional costs associated with the planned relocation of the office and data center. All of the Regional Entities were under budget in 2011, ranging from a low of 0.4% to a high of 14.3%. In 2010, NERC and all Regional Entities were under budget, ranging from a low of 0.7% to a high of 16.3%. In 2009, FRCC was over budget 3.9% while NERC and the other Regional Entities were under budget ranging from a low of 0.4% to a high of 19.9%. Total actual and budgeted full-time employees (FTEs) are summarized on Attachment 3 and generally reflect lower than budgeted staffing. Total FTEs were under budget 7.1% and 3.8% in 2011 and 2010, respectfully, and were over budget 1.1% in 2009. The increase in the percentage of FTE vacancies at year-end is in part due to the challenges which NERC and the Regional Entities face in filling vacancies, as well as the impact of vacancies arising in connection with NERC’s office relocations strategy, which was announced in 2010 and implemented in 2011. It is also important to keep in mind as you review this data that the percentages can sometimes be misleading for the smaller Regional Entities with lower total headcount.
1 Excludes grant activity in WECC which occurred in 2011 and 2010.
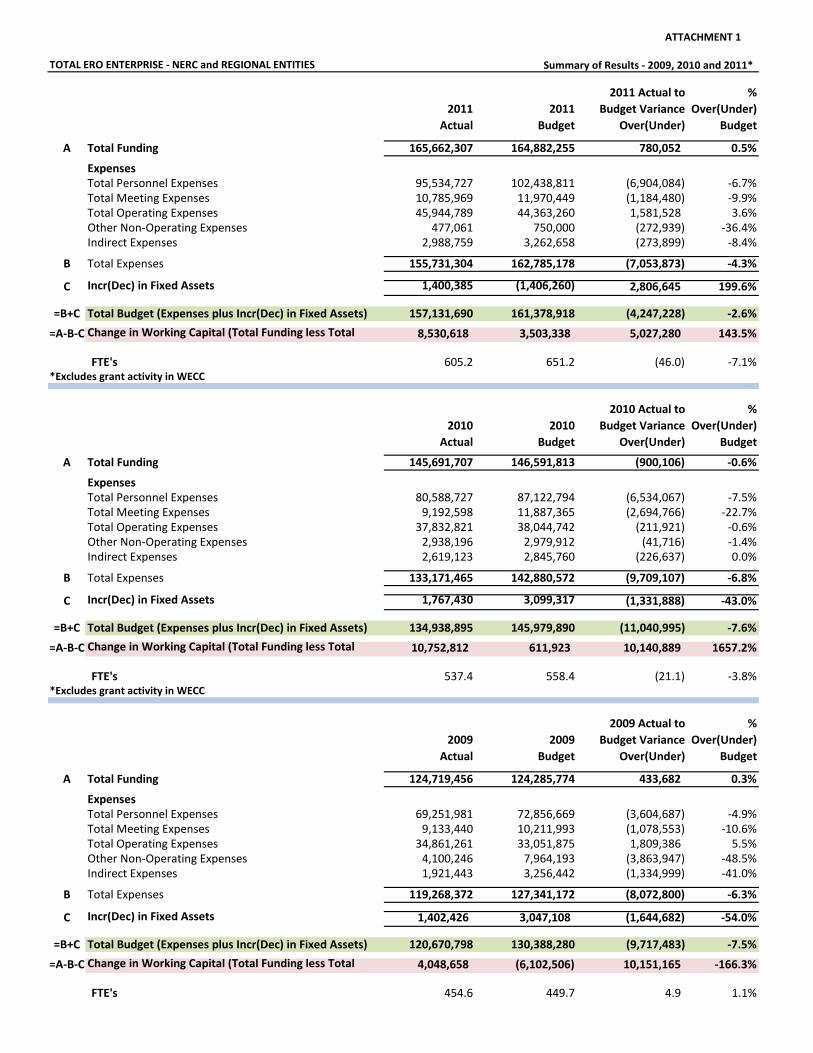
ATTACHMENT 1
Summary of Results ‐ 2009, 2010 and 2011*
2011
Actual
2011
Budget
2011 Actual to
Budget Variance
Over(Under)
%
Over(Under)
Budget
A Total Funding 165,662,307 164,882,255 780,052 0.5%
ExpensesTotal Personnel Expenses 95,534,727 102,438,811 (6,904,084) ‐6.7%Total Meeting Expenses 10,785,969 11,970,449 (1,184,480) ‐9.9%Total Operating Expenses 45,944,789 44,363,260 1,581,528 3.6%Other Non‐Operating Expenses 477,061 750,000 (272,939) ‐36.4%Indirect Expenses 2,988,759 3,262,658 (273,899) ‐8.4%
B Total Expenses 155,731,304 162,785,178 (7,053,873) ‐4.3%
C Incr(Dec) in Fixed Assets 1,400,385 (1,406,260) 2,806,645 199.6%
=B+C Total Budget (Expenses plus Incr(Dec) in Fixed Assets) 157,131,690 161,378,918 (4,247,228) ‐2.6%
=A‐B‐C Change in Working Capital (Total Funding less Total 8,530,618 3,503,338 5,027,280 143.5%
FTE's 605.2 651.2 (46.0) ‐7.1%*Excludes grant activity in WECC
2010
Actual
2010
Budget
2010 Actual to
Budget Variance
Over(Under)
%
Over(Under)
Budget
A Total Funding 145,691,707 146,591,813 (900,106) ‐0.6%
ExpensesTotal Personnel Expenses 80,588,727 87,122,794 (6,534,067) ‐7.5%Total Meeting Expenses 9,192,598 11,887,365 (2,694,766) ‐22.7%Total Operating Expenses 37,832,821 38,044,742 (211,921) ‐0.6%
TOTAL ERO ENTERPRISE ‐ NERC and REGIONAL ENTITIES
Other Non‐Operating Expenses 2,938,196 2,979,912 (41,716) ‐1.4%Indirect Expenses 2,619,123 2,845,760 (226,637) 0.0%
B Total Expenses 133,171,465 142,880,572 (9,709,107) ‐6.8%
C Incr(Dec) in Fixed Assets 1,767,430 3,099,317 (1,331,888) ‐43.0%
=B+C Total Budget (Expenses plus Incr(Dec) in Fixed Assets) 134,938,895 145,979,890 (11,040,995) ‐7.6%
=A‐B‐C Change in Working Capital (Total Funding less Total 10,752,812 611,923 10,140,889 1657.2%
FTE's 537.4 558.4 (21.1) ‐3.8%*Excludes grant activity in WECC
2009
Actual
2009
Budget
2009 Actual to
Budget Variance
Over(Under)
%
Over(Under)
Budget
A Total Funding 124,719,456 124,285,774 433,682 0.3%
ExpensesTotal Personnel Expenses 69,251,981 72,856,669 (3,604,687) ‐4.9%Total Meeting Expenses 9,133,440 10,211,993 (1,078,553) ‐10.6%Total Operating Expenses 34,861,261 33,051,875 1,809,386 5.5%Other Non‐Operating Expenses 4,100,246 7,964,193 (3,863,947) ‐48.5%Indirect Expenses 1,921,443 3,256,442 (1,334,999) ‐41.0%
B Total Expenses 119,268,372 127,341,172 (8,072,800) ‐6.3%
C Incr(Dec) in Fixed Assets 1,402,426 3,047,108 (1,644,682) ‐54.0%
=B+C Total Budget (Expenses plus Incr(Dec) in Fixed Assets) 120,670,798 130,388,280 (9,717,483) ‐7.5%
=A‐B‐C Change in Working Capital (Total Funding less Total 4,048,658 (6,102,506) 10,151,165 ‐166.3%
FTE's 454.6 449.7 4.9 1.1%

ATTACHMENT 2
Summary of Results ‐ 2009, 2010 and 2011
2011
Actual
2011
Budget
2011 Actual to
Budget Variance
Over(Under)
%
Over(Under)
Budget
NERC 51,331,461 48,726,465 2,604,996 5.3%FRCC 5,177,020 5,588,610 (411,590) ‐7.4%MRO 7,385,721 8,130,825 (745,104) ‐9.2%NPCC 11,754,576 12,716,808 (962,232) ‐7.6%RFirst 15,158,286 15,219,649 (61,363) ‐0.4%SERC 11,438,066 11,776,640 (338,574) ‐2.9%SPP RE 8,397,845 9,797,236 (1,399,391) ‐14.3%Texax RE 8,179,402 9,283,855 (1,104,453) ‐11.9%WECC* 38,309,313 40,138,829 (1,829,516) ‐4.6%
Total Budget (Expenses plus Incr(Dec) in Fixed 157,131,690 161,378,917 (4,247,227) ‐2.6%
*Excludes grant activity
2010
Actual
2010
Budget
2010 Actual to
Budget Variance
Over(Under)
%
Over(Under)
Budget
NERC 37,025,071 40,088,365 (3,063,294) ‐7.6%FRCC 4,560,806 5,421,187 (860,381) ‐15.9%MRO 6,958,727 7,366,118 (407,391) ‐5.5%NPCC 9,559,008 11,354,087 (1,795,079) ‐15.8%RFirst 11,871,573 14,184,713 (2,313,140) ‐16.3%SERC 10,051,263 10,701,683 (650,420) ‐6.1%SPP RE 6,843,894 8,138,783 (1,294,889) ‐15.9%Texax RE 9,151,291 9,216,396 (65,105) ‐0.7%WECC* 38,917,262 39,508,558 (591,296) ‐1.5%
Total Budget (Expenses plus Incr(Dec) in Fixed 134,938,895 145,979,890 (11,040,995) ‐7.6%
*Excludes grant activity
2009
Actual
2009
Budget
2009 Actual to
Budget Variance
Over(Under)
%
Over(Under)
Budget
NERC 35,871,592 36,006,226 (134,635) ‐0.4%FRCC 4,131,433 3,977,869 153,564 3.9%MRO 6,949,466 7,525,725 (576,259) ‐7.7%NPCC 8,999,704 10,008,885 (1,009,181) ‐10.1%RFirst 10,850,859 11,434,201 (583,342) ‐5.1%SERC 9,496,566 10,095,546 (598,980) ‐5.9%SPP RE 5,190,261 6,481,036 (1,290,775) ‐19.9%Texax RE 4,981,473 6,167,025 (1,185,552) ‐19.2%WECC 34,199,444 38,691,767 (4,492,323) ‐11.6%
Total Budget (Expenses plus Incr(Dec) in Fixed 120,670,798 130,388,280 (9,717,483) ‐7.5%
TOTAL ERO ENTERPRISE ‐ NERC and REGIONAL ENTITIES
Total Budget (Expenses plus Incr(Dec) in Fixed Assets)
Total Budget (Expenses plus Incr(Dec) in Fixed Assets)
Total Budget (Expenses plus Incr(Dec) in Fixed Assets)

ATTACHMENT 3
TOTAL ERO ENTERPRISE ‐ NERC and REGIONAL ENTITIES Summary of Results ‐ 2009, 2010 and 2011
2011
Actual
2011
Budget
2011 Actual to
Budget Variance
Over(Under)
%
Over(Under)
Budget
NERC 140.3 150.7 (10.5) ‐7.0%FRCC 25.5 26.5 (1.0) ‐3.7%MRO 33.0 34.5 (1.5) ‐4.3%NPCC 29.8 31.4 (1.6) ‐5.0%RFirst 62.1 68.0 (6.0) ‐8.8%SERC 56.7 53.5 3.2 6.0%SPP RE 26.4 29.7 (3.3) ‐11.1%Texax RE 42.7 49.0 (6.3) ‐12.9%WECC 188.8 207.9 (19.1) ‐9.2%
Total FTEs 605.2 651.2 (46.0) ‐7.1%
2010
Actual
2010
Budget
2010 Actual to
Budget Variance
Over(Under)
%
Over(Under)
Budget
NERC 120.5 131.5 (11.0) ‐8.4%FRCC 20.0 22.6 (2.6) ‐11.6%MRO 30.5 27.8 2.8 9.9%NPCC 27.4 27.4 ‐ 0.0%RFirst 53.2 58.0 (4.8) ‐8.3%SERC 47.5 45.5 2.0 4.4%SPP RE 21.5 24.3 (2.8) ‐11.4%Texax RE 39.5 39.5 ‐ 0.0%WECC 177.3 181.9 (4.6) ‐2.5%
Total FTEs 537.4 558.4 (21.1) ‐3.8%
2009
Actual
2009
Budget
2009 Actual to
Budget Variance
Over(Under)
%
Over(Under)
Budget
NERC 109.4 106.5 2.9 2.7%
FRCC 18.2 18.3 (0.1) ‐0.7%MRO 25.8 26.5 (0.7) ‐2.5%NPCC 23.4 27.2 (3.8) ‐13.9%RFirst 41.2 44.0 (2.8) ‐6.5%SERC 44.5 43.0 1.5 3.5%
SPP RE 14.8 17.2 (2.4) ‐14.0%Texax RE 26.3 27.0 (0.7) ‐2.6%WECC 151.0 140.0 11.0 7.9%
Total FTEs 454.6 449.7 4.9 1.1%
Total FTEs
Total FTEs
Total FTEs
Agenda Item 5 FAC Meeting October 31, 2012
Auditor Request for Proposals
Action None Summary On October 12, 2012, management issued a Request for Proposal (RFP) for financial audit and tax services. A copy of the RFP is attached. Nine selected firms received the RFP. Management believes the list represents a good mix of accounting firms, with three of the largest, two which are local, and four mid-sized firms. The following process was used to select the firms that received the RFP:
• Management started with the list of Atlanta’s Top 25 Accounting Firms, ranked by the number of professionals in Atlanta, and published by the Atlanta Business Chronicle.
• The publicly available qualifications of each firm were reviewed to identify those firm’s who listed non-profit, government or regulatory, employee benefit plans and corporate tax as areas of specialty. This narrowed the list down to six (6) firms.
• Three of the Big 4 accounting firms were then added to the list, which resulted in a total of nine firms to receive the RFP. We did not include Deloitte, since they perform other work for NERC.
We also researched the audit firms used by the eight Regional Entities. NPCC uses PWC and SERC uses Cherry, Bekaert & Holland, LLP who are included in the nine firms selected. Responses to the RFP are due on October 26, 2012. Management will prepare a summary of the responses, as well as provide a recommendation for the Committee’s review, and will schedule a conference call with the Committee in November to approve the selection of the auditor and associated engagement agreement(s).
3353 Peachtree Road NE
Suite 600, North Tower Atlanta, GA 30326
404-446-2560 | www.nerc.com
External Audit and Tax Services Request for Proposal
October 12, 2012
Overview
1 External Audit and Tax Services – Request for Proposal
Overview
Introduction The North American Electric Reliability Corporation (NERC) is a not-for-profit entity organized under the New Jersey Nonprofit Corporation Act. NERC’s mission is to improve and ensure the reliability of the bulk power system in North America. NERC’s area of responsibility spans the continental United States and Canada and the northern portion of Baja California, Mexico. Entities under NERC’s jurisdiction are the users, owners, and operators of the bulk power system – a system that serves the needs of over 334 million people, includes installed electricity production capacity of approximately 1,200 gigawatts and 211,000 miles of high voltage transmission.
The Federal Energy Regulatory Commission (FERC) certified NERC as the Electric Reliability Organization (ERO) within the United States to establish and enforce reliability standards for the United States portion of the bulk power system, pursuant to section 215 of the Federal Power Act. NERC is subject to regulatory oversight by FERC.
In Canada, NERC presently has memoranda of understanding with provincial authorities in Ontario, New Brunswick, Nova Scotia, Québec, Saskatchewan, and Alberta, and with the National Energy Board of Canada. NERC standards are mandatory and enforceable in Ontario and New Brunswick as a matter of provincial law. NERC has an agreement with Manitoba Hydro, making reliability standards mandatory for that entity, and Manitoba has recently adopted legislation setting out a framework for standards to become mandatory for users, owners, and operators in the province. In addition, NERC has been designated as the “electric reliability organization” under Alberta’s Transportation Regulation, and certain reliability standards have been approved in that jurisdiction; others are pending. NERC and the Northeast Power Coordinating Council have been recognized as standards setting bodies by the Régie de l’énergie of Québec, and Québec has the framework in place for reliability standards to become mandatory. NERC standards are now mandatory in British Columbia and Nova Scotia.
Scope of NERC Responsibilities
As the ERO, NERC’s primary responsibilities are leading the development, adoption, and improvement of mandatory reliability standards for the bulk power system in North America; leading the monitoring, evaluating, and enforcement of compliance with those reliability standards by the approximately 1,900 entities registered with NERC as bulk power system users, owners, and operators; and assessing the reliability and adequacy of the bulk power system in North America. Collectively, the entities registered with NERC as bulk power system users, owners, and operators perform over 4,600 bulk power system reliability functions. NERC conducts near-term and long-term assessments of the reliability and future adequacy of the North American bulk power system; certifies bulk power system operators as having and maintaining the necessary knowledge and skills to perform their reliability responsibilities; maintains situational awareness of events and conditions that may threaten the reliability of the bulk power system; coordinates efforts to improve physical and cyber security for the bulk power system of North America in order to maintain the reliability and adequacy of the bulk power system; and conducts detailed analyses and investigations of system disturbances and
Overview
External Audit and Tax Services – Request for Proposal 2
unusual events to determine root causes, uncover lessons learned, and issue relevant findings as advisories, recommendations, and essential actions to the industry, in order to identify the potential need for new or modified reliability standards, maintain compliance with existing standards, and assess the reliability of the bulk power system.
Scope of Audit and Tax Services NERC places the highest emphasis on the integrity of financial processes and disclosures. We believe that our audit must deliver the optimum levels of assurance to all key stakeholders. NERC’s Board of Trustees, Finance and Audit Committee and senior management all believe it is in the company’s best interests to review our current external auditor relationship. NERC is issuing this Request for Proposal (RFP) for external audit and tax services, including (1) audits of (i) the company’s year end financial statements and (ii) the company’s Savings and Investment Plan (a.k.a 401(k) Plan) and (2) the (i) preparation and filing of the company’s federal corporate income tax return and supporting schedules, IRS Form 990 (ii) filing the Form 990 with the State of NJ, and other states, as required, (iii) preparation and filing of state corporate income tax returns, as required, and (iv) preparation and filing of Fulton County, GA property tax returns. It is expected that the audit of the company’s financial statements and 401(k) Plan will include a review of the company’s internal controls in accordance with standard auditing practices. Note that preparation and filing of Form 5500 for the 401(k) Plan is performed by Vanguard and is not required. The completed Form 5500 will be provided to the appointed firm during the course of the audit. The purpose of this document is to explain NERC’s requirements and to provide instructions for the preparation of a proposal response. This document also establishes a common framework within which the final terms of an executed agreement may be reached. In addition, NERC’s 2012 Business Plan and Budget is posted on NERC’s website and can be accessed by following this link: 2012 Business Plan and Budget The appointed firm should be prepared to complete the audit of NERC’s financial statements and 401K Plan and prepare the above referenced tax returns for the year ending December 31, 2012. Success in the process requires that the appointed firm be prepared to immediately begin to transition this assignment from our current service provider. Members of NERC’s management team will meet with and provide firms with an overview of the scope and timing of the RFP process, as well as further background on NERC’s financial statements, tax returns and 401(k) Plan. Responding firms will be evaluated on the quality of the interviews, written proposals, and oral presentations (as described herein). These meetings will be coordinated and arranged through Susan Turpen, NERC’s Controller.
Request for Proposal Instructions
3 External Audit and Tax Services – Request for Proposal
Request for Proposal Instructions
All information contained in this document and subsequent communications is considered confidential and shall be treated as such. This RFP is not an offer to enter into an engagement, nor should it be construed as such; it is a definition of specific requirements and an invitation to submit a responsive proposal addressing such requirements. Issuance of this RFP, the preparation and submission of a response, and the subsequent receipt and evaluation of the response does not commit NERC to award an engagement, even if all of the requirements stated in the RFP are met. NERC reserves the right to award no engagement at all, or to award an engagement to a firm which does not provide the most advantageous terms or is not a respondent to this RFP. This RFP does not commit or obligate NERC to pay any expenses incurred in the preparation of a proposal. All such expenses are solely the obligation of the respondent.
Proposal Approach and Format
Each respondent is to provide its proposal via Microsoft Word or Adobe PDF format and delivered via email. The key contact for this RFP is Susan Turpen, NERC’s Controller. All questions regarding this RFP are to be sent via email to [email protected]. Any questions regarding this RFP submitted in ways other than email (phone call, fax, etc.) will not be considered. NERC reserves the right to communicate any respondent’s questions and NERC answers to all RFP respondents as it deems appropriate. A respondent must respond to the RFP in the following manner:
1. Provide biographical sketches of each team member proposed to work on the audit.
2. Describe the approach to the audit, focusing on any unique methodology or tools that will be employed, including those which the respondent believes are clear differentiating factors for the firm.
3. Describe the approach to resolving accounting and financial reporting issues.
4. Describe proposed fees for services to be rendered in the audits and other services requested, along with basis used for determining those fees. Fees should be set forth for a one and three-year term, with the three-year fee proposal indicating the amount of fees to be billed in each year over the three-year period. Also provide a billing schedule for each year, showing the proposed dates and amounts of the billings during the course of each year to complete the required audit and tax services. It is important that the respondents list the key assumptions in developing its proposed fees to ensure that NERC is in agreement with those assumptions. All pricing will be considered firm. The respondent is not authorized to resubmit modifications to pricing after the response due date. The invoicing schedule must be included in the engagement letter, including

Request for Proposal Instructions
External Audit and Tax Services – Request for Proposal 4
requirements for reimbursement of expenses. NERC prefers the team members be based in close proximity to NERC’s corporate office in Atlanta. In the event respondent proposes to use engagement team members who are not based in Atlanta, the respondent should provide a maximum amount of reimbursable expenses that will be billed to NERC to cover such out-of-pocket costs.
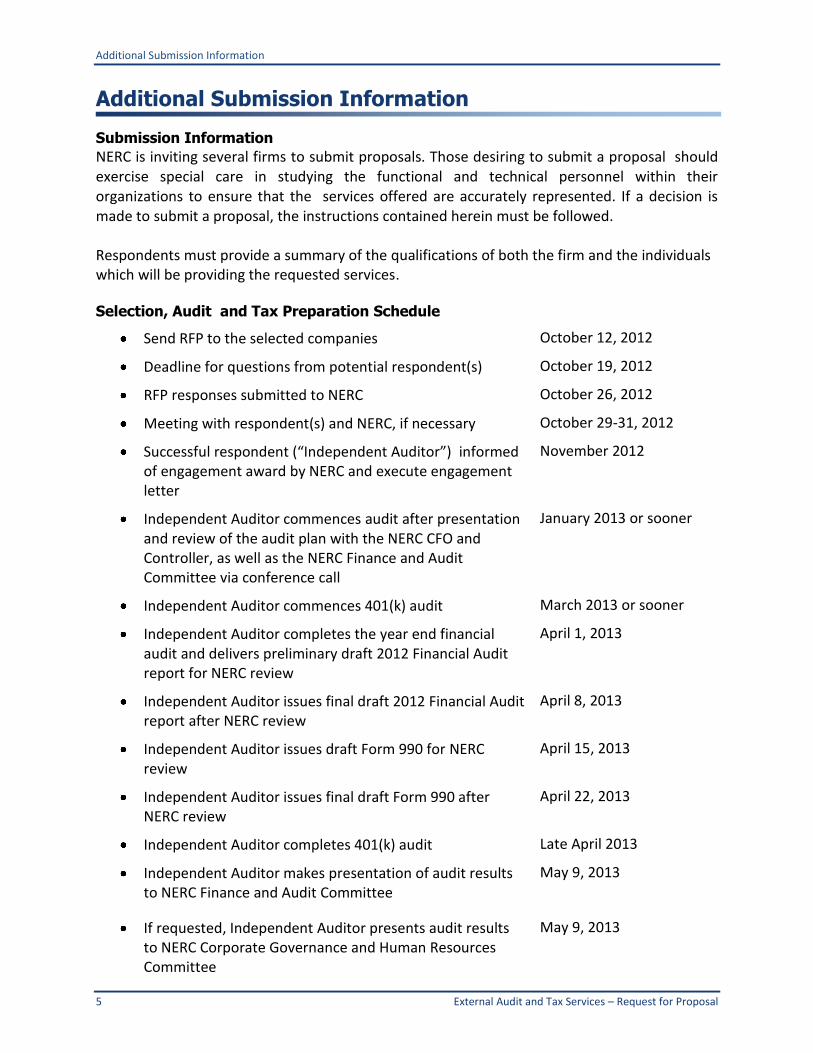
Additional Submission Information
5 External Audit and Tax Services – Request for Proposal
Additional Submission Information
Submission Information
NERC is inviting several firms to submit proposals. Those desiring to submit a proposal should exercise special care in studying the functional and technical personnel within their organizations to ensure that the services offered are accurately represented. If a decision is made to submit a proposal, the instructions contained herein must be followed. Respondents must provide a summary of the qualifications of both the firm and the individuals which will be providing the requested services.
Selection, Audit and Tax Preparation Schedule
Send RFP to the selected companies October 12, 2012
Deadline for questions from potential respondent(s) October 19, 2012
RFP responses submitted to NERC October 26, 2012
Meeting with respondent(s) and NERC, if necessary October 29-31, 2012
Successful respondent (“Independent Auditor”) informed of engagement award by NERC and execute engagement letter
November 2012
Independent Auditor commences audit after presentation and review of the audit plan with the NERC CFO and Controller, as well as the NERC Finance and Audit Committee via conference call
January 2013 or sooner
Independent Auditor commences 401(k) audit March 2013 or sooner
Independent Auditor completes the year end financial audit and delivers preliminary draft 2012 Financial Audit report for NERC review
April 1, 2013
Independent Auditor issues final draft 2012 Financial Audit report after NERC review
April 8, 2013
Independent Auditor issues draft Form 990 for NERC review
April 15, 2013
Independent Auditor issues final draft Form 990 after NERC review
April 22, 2013
Independent Auditor completes 401(k) audit Late April 2013
Independent Auditor makes presentation of audit results to NERC Finance and Audit Committee
May 9, 2013
If requested, Independent Auditor presents audit results to NERC Corporate Governance and Human Resources Committee
May 9, 2013
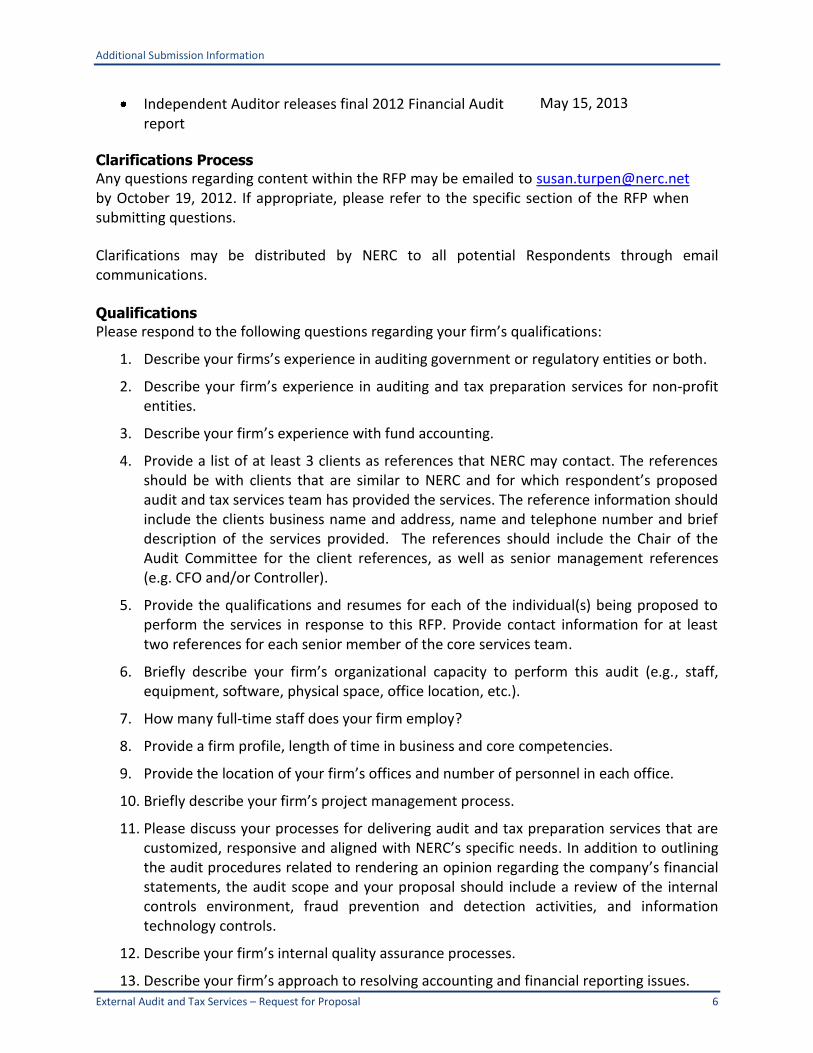
Additional Submission Information
External Audit and Tax Services – Request for Proposal 6
Independent Auditor releases final 2012 Financial Audit report
May 15, 2013
Clarifications Process
Any questions regarding content within the RFP may be emailed to [email protected] by October 19, 2012. If appropriate, please refer to the specific section of the RFP when submitting questions.
Clarifications may be distributed by NERC to all potential Respondents through email communications. Qualifications
Please respond to the following questions regarding your firm’s qualifications:
1. Describe your firms’s experience in auditing government or regulatory entities or both.
2. Describe your firm’s experience in auditing and tax preparation services for non-profit entities.
3. Describe your firm’s experience with fund accounting.
4. Provide a list of at least 3 clients as references that NERC may contact. The references should be with clients that are similar to NERC and for which respondent’s proposed audit and tax services team has provided the services. The reference information should include the clients business name and address, name and telephone number and brief description of the services provided. The references should include the Chair of the Audit Committee for the client references, as well as senior management references (e.g. CFO and/or Controller).
5. Provide the qualifications and resumes for each of the individual(s) being proposed to perform the services in response to this RFP. Provide contact information for at least two references for each senior member of the core services team.
6. Briefly describe your firm’s organizational capacity to perform this audit (e.g., staff, equipment, software, physical space, office location, etc.).
7. How many full‐time staff does your firm employ?
8. Provide a firm profile, length of time in business and core competencies.
9. Provide the location of your firm’s offices and number of personnel in each office.
10. Briefly describe your firm’s project management process.
11. Please discuss your processes for delivering audit and tax preparation services that are customized, responsive and aligned with NERC’s specific needs. In addition to outlining the audit procedures related to rendering an opinion regarding the company’s financial statements, the audit scope and your proposal should include a review of the internal controls environment, fraud prevention and detection activities, and information technology controls.
12. Describe your firm’s internal quality assurance processes.
13. Describe your firm’s approach to resolving accounting and financial reporting issues.
Additional Submission Information
7 External Audit and Tax Services – Request for Proposal
14. Desribe your firm’s practices to ensure compliance with independence requirements and freedom of conflicts of interest.
15. As attachments to your proposal, provide examples of previous activities and reports related to the services requested under this RFP. Documentaion should include examples of forms of presentations, audit reports, publications, client advisories demonstrating expertise in the areas which are the subject of the RFP.
16. Please provide your firm’s Terms and Conditions. Format for Proposal
Please use the following as a guideline to format your proposal: Length and Font Size Please use fonts no smaller than 10 point. Maximum proposal length including title page, cover letter, proposal, qualifications and budget should not exceed 8 pages (not including Attachment).
Title Page
Please include the following information on the title page:
1. NERC External Audit and Tax Services Proposal
2. Company Name
3. Company Address
4. Company Website
5. Primary Contact
6. Telephone Number
7. Email Address Contract Terms
NERC will negotiate contract terms upon selection. All contracts are subject to review by NERC’s legal counsel, and a project will be awarded upon signing of an agreement or contract, which outlines terms, scope, budget and other necessary items.
Pricing
Please provide a pricing proposal to accomplish the scope outlined below. Include fixed fee or not to exceed hourly pricing plus out of pocket expenses. The pricing must encompass all project management, planning, execution and reporting. Describe how start up costs during audit transition will be absorbed. Hourly billing rates are fixed for the intial term of the award and shall be inclusive of all wages, fringe benefits, taxes, direct and indirect costs, and profit.
Evaluation Criteria
The following criteria will form the basis upon which NERC will evaluate proposals. The mandatory criteria must be met and include:
Respondents shall submit one copy of their proposal in electronic format, either Microsoft

Additional Submission Information
External Audit and Tax Services – Request for Proposal 8
Word or Adobe PDF, no later than October 26, 2012. Deliver electronic proposals to [email protected] with the subject line “<<Company Name>>’s proposal for the NERC Audit and Tax Services”.
The proposal must include a pricing proposal as described above. All pricing associated with conducting the requested services should be broken out in detail. The proposals shall be signed by the person authorized to act for the submitting respondent. The proposal should also indicate the time period for which it is valid. Proposals that meet the mandatory requirements, as stated above, will be evaluated with the following criteria:
1. Respondent’s audit qualifications
a. Understanding project objectives
b. Respondent’s audit methodology
c. Experience with audits and tax preparation services for non-profits
d. Overall familiarity with FERC regulation
2. Respondent's organization and management plan
a. Overall audit team
b. Roles and responsibilities
c. Proposed method for preparation and submission of requested schedules and documentation
d. Proposed communication method regarding status of services and budget
e. Proposed communication method regarding accounting or financial reporting issues
3. Respondent's corporate profile, experience and past performance
a. Accreditations/awards
b. Management structure
c. Financial viability
d. On‐time delivery within budget
e. Experience with similar audits/services
f. Client satisfaction
g. Quality of reference testimonials
4. Pricing
a. Fees and/or hourly rates
b. Expenses
5. Communication Skills and RFP Compliance
a. Clarity and readability of written proposal
b. Completeness of response
Additional Submission Information
9 External Audit and Tax Services – Request for Proposal
c. Overall professionalism and quality
Award or Rejection of Bids
The respondent, by submitting a proposal, represents that:
1. The respondent has read and understands this RFP and the resulting proposal is made accordingly.
2. The respondent possesses the capabilities and the personnel necessary to provide efficient and successful implementation, service and support.
Agenda Item 6 FAC Meeting October 31, 2012
2014 Business Plan and Budget Schedule
Action Review Summary Management has prepared a draft schedule for the 2014 business plan and budget preparation, a copy of which is attached. The schedule also includes the 2013 schedule for reference. One of the key improvements in this schedule is the initiation of the development of goals and objectives during the fourth quarter of 2012, which is significantly earlier than with prior business plans and budgets. This will in turn facilitate earlier input by stakeholders regarding goals, objectives and priorities and provide valuable input to resource planning, allocation and budget formulation by both NERC and the Regional Entities as they prepare the first drafts of their proposed 2013 business plans and budgets. The schedule is expected to be further updated to reflect key dates for other committee meetings and initiatives that feed the business plan and budget process. Consistent with past practices, an updated version of this schedule will be maintained on NERC’s website. The next key dates are the posting of draft Section 215 Guidelines and draft 2014-2016 Goals and Objectives for comment. The current schedule anticipates public posting of the draft Section 215 Guidelines in mid-to-late November and posting of draft 2014-2016 Goals and Objectives in early January 2013.

Draft – October 2012
2014-2016 Business Planning Schedule (Working Draft)
Highlights
• Includes the 2012 schedule for the 2013 business planning and budgeting process, as well as a draft schedule for the 2014 business planning and budgeting process.
• Next three-year business planning cycle contemplates the development of goals and objectives for the 2014-2016 time period (“Valued Outcomes” document will be used to guide goals and objectives discussions).
• Schedule anticipates early start to the process (Q4 2012), with the objective of having final draft three-year goals and objectives in place by February 2013 for inclusion in the first draft of NERC and Regional Entity business plans and budgets to be posted in early May 2013.
• Process expected to facilitate earlier input to Regional Entity business planning and budgeting, as well as demonstrate ongoing and increased coordination regarding long-term planning efforts.
• A column on the far right entitled “Related Stakeholder and Committee Initiatives” is to identify and coordinate with key committees and/or and stakeholders which affect the business planning and budgeting process. For example, there are a number of key working groups and committees that engage in planning and decision making that directly impact ERO budgets or initiatives. This schedule will also need to incorporate any parallel processes related to the NERC and Regional Entity Business Plans and Budgets which result from the implementation of the final recommendations and requirements contained in the FERC 2013 business plan and budget and/or audit orders applicable to NERC and the Regional Entities.

Draft – October 2012 2
DATES
2013 BP&B 2014-16 BP&B Related Stakeholder-NERC Committee
Initiatives NERC Regional Entity NERC Regional Entity February 3, 2012 -11:00
a.m. ET
FAC Conference Call to discuss quarterly business; includes update on 2013 BP&B process and schedule which is posted as part of agenda materials.
February 17, 2012
Common 2013 BP&B Assumptions posted for comment.
March 9, 2012 Comments due on Common 2013 BP&B Assumptions.
April 4, 2012 Meeting with trades to discuss 2013 BP&B (NERC DC office).
April 16, 2012 Submittal to Regional Entities of Preliminary Internal Draft of NERC 2013 business plan and budget.
Submittal to NERC of Preliminary Internal Draft of Regional Entity business plan and budgets for circulation among NERC program
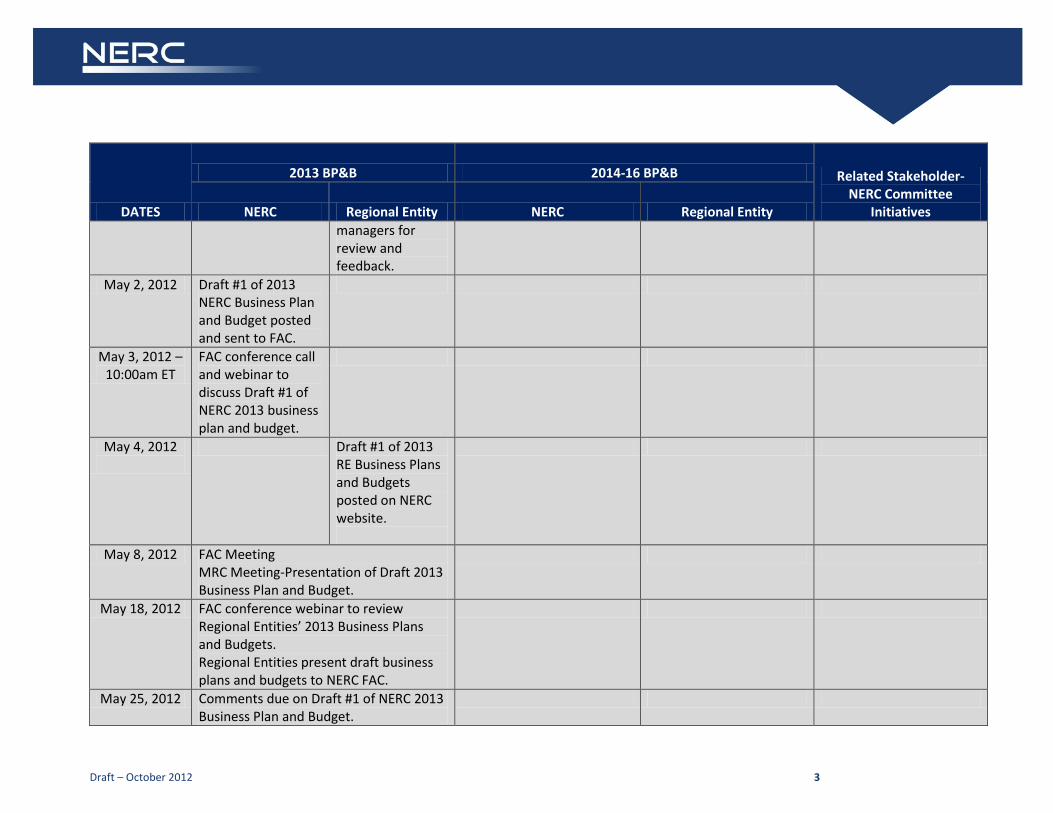
Draft – October 2012 3
DATES
2013 BP&B 2014-16 BP&B Related Stakeholder-NERC Committee
Initiatives NERC Regional Entity NERC Regional Entity managers for review and feedback.
May 2, 2012 Draft #1 of 2013 NERC Business Plan and Budget posted and sent to FAC.
May 3, 2012 – 10:00am ET
FAC conference call and webinar to discuss Draft #1 of NERC 2013 business plan and budget.
May 4, 2012
Draft #1 of 2013 RE Business Plans and Budgets posted on NERC website.
May 8, 2012 FAC Meeting MRC Meeting-Presentation of Draft 2013 Business Plan and Budget.
May 18, 2012 FAC conference webinar to review Regional Entities’ 2013 Business Plans and Budgets. Regional Entities present draft business plans and budgets to NERC FAC.
May 25, 2012 Comments due on Draft #1 of NERC 2013 Business Plan and Budget.
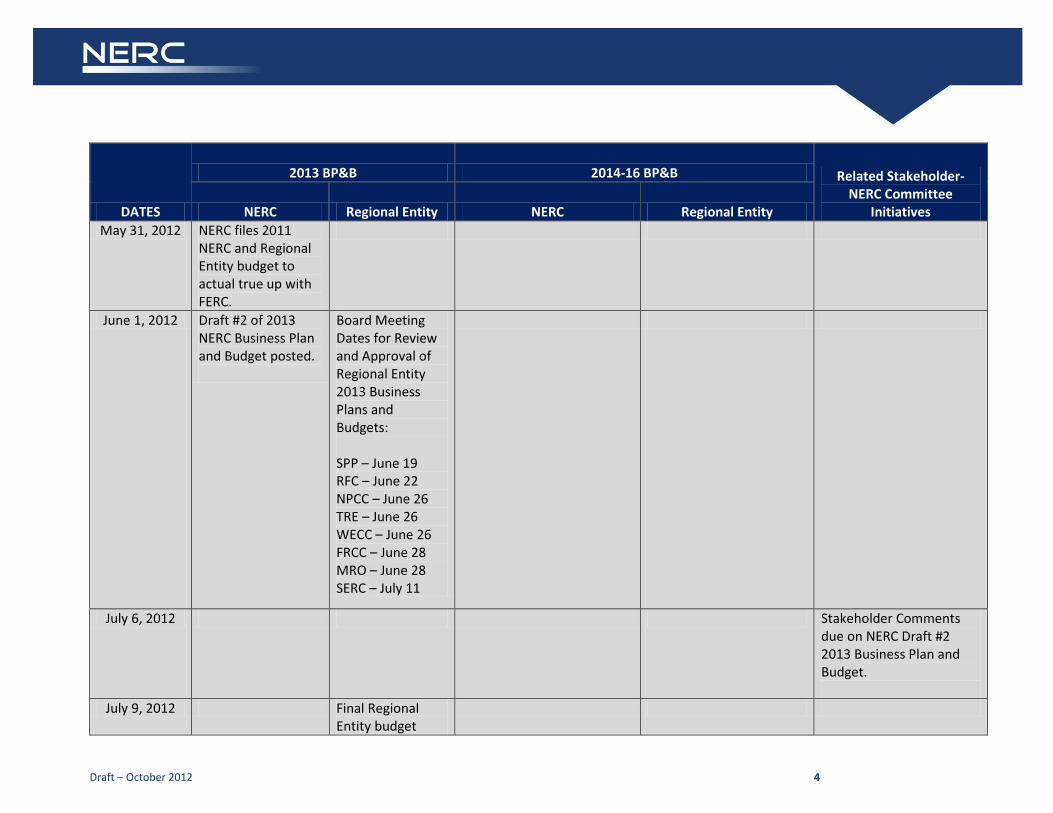
Draft – October 2012 4
DATES
2013 BP&B 2014-16 BP&B Related Stakeholder-NERC Committee
Initiatives NERC Regional Entity NERC Regional Entity May 31, 2012 NERC files 2011
NERC and Regional Entity budget to actual true up with FERC.
June 1, 2012 Draft #2 of 2013 NERC Business Plan and Budget posted.
Board Meeting Dates for Review and Approval of Regional Entity 2013 Business Plans and Budgets: SPP – June 19 RFC – June 22 NPCC – June 26 TRE – June 26 WECC – June 26 FRCC – June 28 MRO – June 28 SERC – July 11
July 6, 2012 Stakeholder Comments due on NERC Draft #2 2013 Business Plan and Budget.
July 9, 2012 Final Regional Entity budget
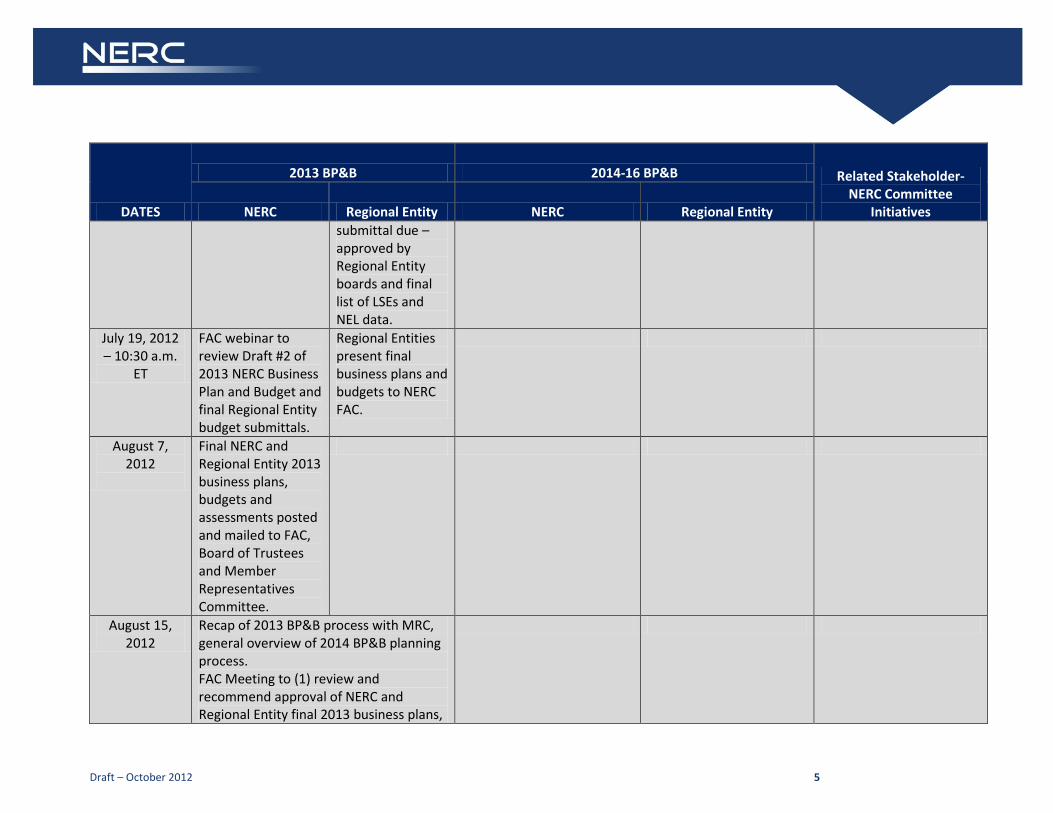
Draft – October 2012 5
DATES
2013 BP&B 2014-16 BP&B Related Stakeholder-NERC Committee
Initiatives NERC Regional Entity NERC Regional Entity submittal due – approved by Regional Entity boards and final list of LSEs and NEL data.
July 19, 2012 – 10:30 a.m.
ET
FAC webinar to review Draft #2 of 2013 NERC Business Plan and Budget and final Regional Entity budget submittals.
Regional Entities present final business plans and budgets to NERC FAC.
August 7, 2012
Final NERC and Regional Entity 2013 business plans, budgets and assessments posted and mailed to FAC, Board of Trustees and Member Representatives Committee.
August 15, 2012
Recap of 2013 BP&B process with MRC, general overview of 2014 BP&B planning process. FAC Meeting to (1) review and recommend approval of NERC and Regional Entity final 2013 business plans,
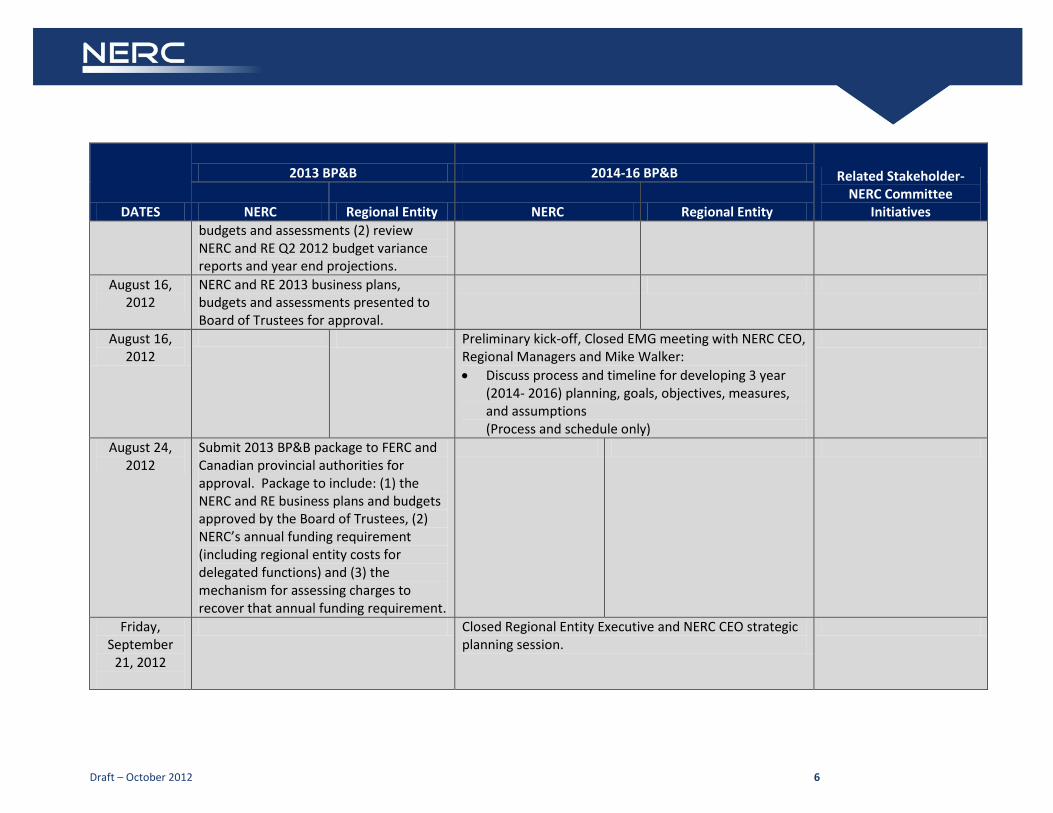
Draft – October 2012 6
DATES
2013 BP&B 2014-16 BP&B Related Stakeholder-NERC Committee
Initiatives NERC Regional Entity NERC Regional Entity budgets and assessments (2) review NERC and RE Q2 2012 budget variance reports and year end projections.
August 16, 2012
NERC and RE 2013 business plans, budgets and assessments presented to Board of Trustees for approval.
August 16, 2012
Preliminary kick-off, Closed EMG meeting with NERC CEO, Regional Managers and Mike Walker: • Discuss process and timeline for developing 3 year
(2014- 2016) planning, goals, objectives, measures, and assumptions (Process and schedule only)
August 24, 2012
Submit 2013 BP&B package to FERC and Canadian provincial authorities for approval. Package to include: (1) the NERC and RE business plans and budgets approved by the Board of Trustees, (2) NERC’s annual funding requirement (including regional entity costs for delegated functions) and (3) the mechanism for assessing charges to recover that annual funding requirement.
Friday, September
21, 2012
Closed Regional Entity Executive and NERC CEO strategic planning session.
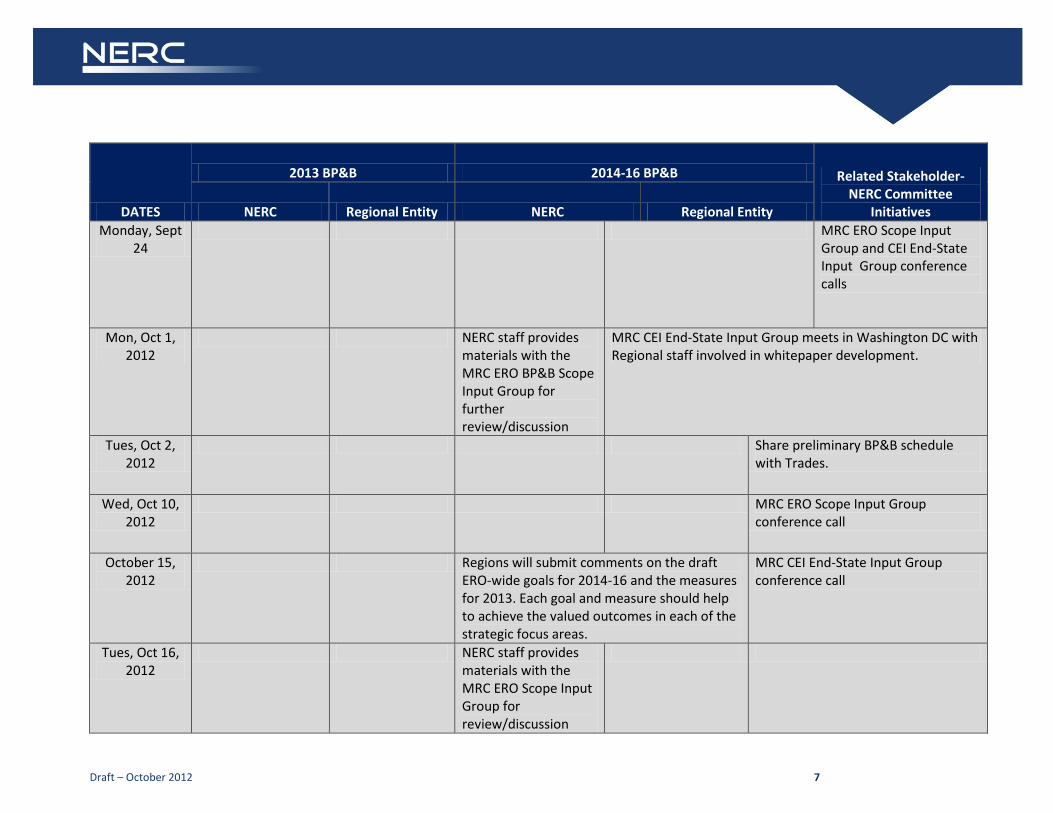
Draft – October 2012 7
DATES
2013 BP&B 2014-16 BP&B Related Stakeholder-NERC Committee
Initiatives NERC Regional Entity NERC Regional Entity Monday, Sept
24 MRC ERO Scope Input
Group and CEI End-State Input Group conference calls
Mon, Oct 1, 2012
NERC staff provides materials with the MRC ERO BP&B Scope Input Group for further review/discussion
MRC CEI End-State Input Group meets in Washington DC with Regional staff involved in whitepaper development.
Tues, Oct 2, 2012
Share preliminary BP&B schedule with Trades.
Wed, Oct 10, 2012
MRC ERO Scope Input Group conference call
October 15, 2012
Regions will submit comments on the draft ERO-wide goals for 2014-16 and the measures for 2013. Each goal and measure should help to achieve the valued outcomes in each of the strategic focus areas.
MRC CEI End-State Input Group conference call
Tues, Oct 16, 2012
NERC staff provides materials with the MRC ERO Scope Input Group for review/discussion
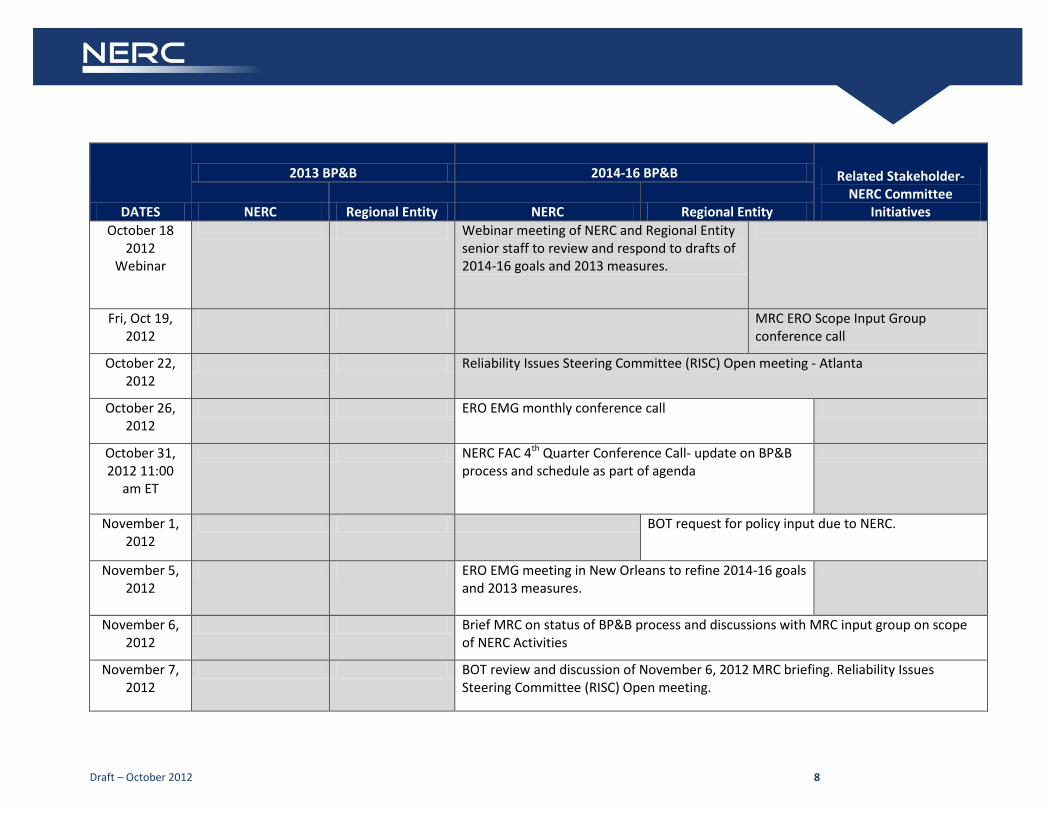
Draft – October 2012 8
DATES
2013 BP&B 2014-16 BP&B Related Stakeholder-NERC Committee
Initiatives NERC Regional Entity NERC Regional Entity October 18
2012 Webinar
Webinar meeting of NERC and Regional Entity senior staff to review and respond to drafts of 2014-16 goals and 2013 measures.
Fri, Oct 19, 2012
MRC ERO Scope Input Group conference call
October 22, 2012
Reliability Issues Steering Committee (RISC) Open meeting - Atlanta
October 26, 2012
ERO EMG monthly conference call
October 31, 2012 11:00
am ET
NERC FAC 4th Quarter Conference Call- update on BP&B process and schedule as part of agenda
November 1, 2012
BOT request for policy input due to NERC.
November 5, 2012
ERO EMG meeting in New Orleans to refine 2014-16 goals and 2013 measures.
November 6, 2012
Brief MRC on status of BP&B process and discussions with MRC input group on scope of NERC Activities
November 7, 2012
BOT review and discussion of November 6, 2012 MRC briefing. Reliability Issues Steering Committee (RISC) Open meeting.
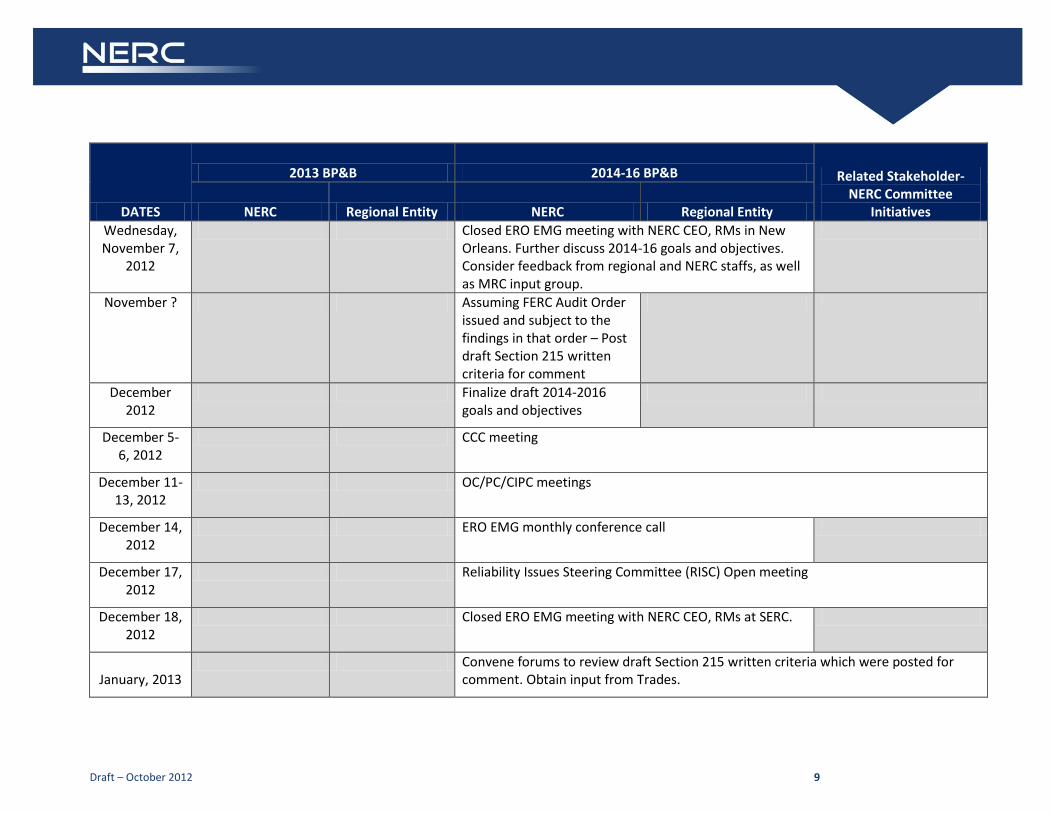
Draft – October 2012 9
DATES
2013 BP&B 2014-16 BP&B Related Stakeholder-NERC Committee
Initiatives NERC Regional Entity NERC Regional Entity Wednesday, November 7,
2012
Closed ERO EMG meeting with NERC CEO, RMs in New Orleans. Further discuss 2014-16 goals and objectives. Consider feedback from regional and NERC staffs, as well as MRC input group.
November ? Assuming FERC Audit Order issued and subject to the findings in that order – Post draft Section 215 written criteria for comment
December 2012
Finalize draft 2014-2016 goals and objectives
December 5-6, 2012
CCC meeting
December 11-13, 2012
OC/PC/CIPC meetings
December 14, 2012
ERO EMG monthly conference call
December 17, 2012
Reliability Issues Steering Committee (RISC) Open meeting
December 18, 2012
Closed ERO EMG meeting with NERC CEO, RMs at SERC.
January, 2013
Convene forums to review draft Section 215 written criteria which were posted for comment. Obtain input from Trades.
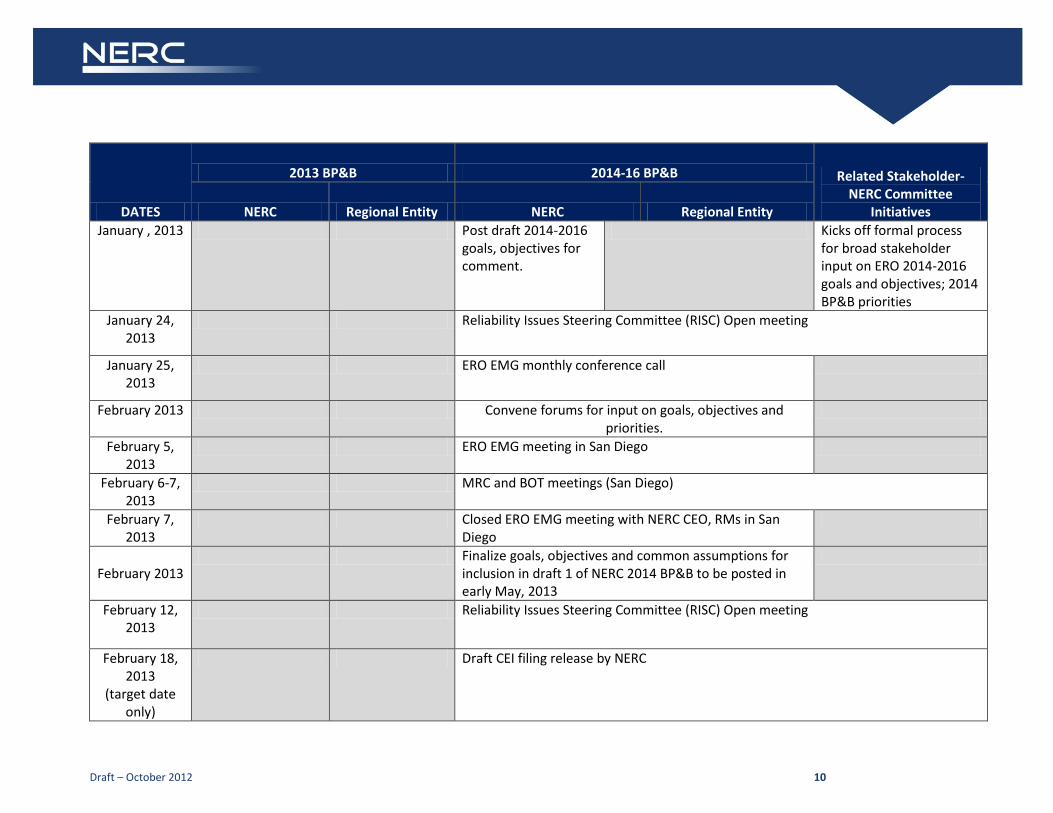
Draft – October 2012 10
DATES
2013 BP&B 2014-16 BP&B Related Stakeholder-NERC Committee
Initiatives NERC Regional Entity NERC Regional Entity January , 2013 Post draft 2014-2016
goals, objectives for comment.
Kicks off formal process for broad stakeholder input on ERO 2014-2016 goals and objectives; 2014 BP&B priorities
January 24, 2013
Reliability Issues Steering Committee (RISC) Open meeting
January 25, 2013
ERO EMG monthly conference call
February 2013 Convene forums for input on goals, objectives and priorities.
February 5, 2013
ERO EMG meeting in San Diego
February 6-7, 2013
MRC and BOT meetings (San Diego)
February 7, 2013
Closed ERO EMG meeting with NERC CEO, RMs in San Diego
February 2013
Finalize goals, objectives and common assumptions for inclusion in draft 1 of NERC 2014 BP&B to be posted in early May, 2013
February 12, 2013
Reliability Issues Steering Committee (RISC) Open meeting
February 18, 2013
(target date only)
Draft CEI filing release by NERC

Draft – October 2012 11
DATES
2013 BP&B 2014-16 BP&B Related Stakeholder-NERC Committee
Initiatives NERC Regional Entity NERC Regional Entity March, 2013 (target date
only)
Subject to audit order, make compliance filing of Section 215 written criteria with FERC
March 5-6, 2013
OC/PC/CIPC meetings
March 12, 2013
Reliability Issues Steering Committee (RISC) Open meeting
March 13-14, 2013
CCC meeting
March 15, 2013
CEI filing at FERC
March- April
2013
Work on Draft 1 of 2014 BP&B Continue to work with MRC Task Force; obtain input from Trades
April , 2013 Closed FAC Meeting – Review of personnel, contracts and other assumptions for 2013 BP&B
April 16, 2012 Reliability Issues Steering Committee (RISC) Open meeting
Tuesday, April 30, 2013
Target date for Draft #1 of 2014 NERC
2012 Regional Entity True-Up files due to NERC
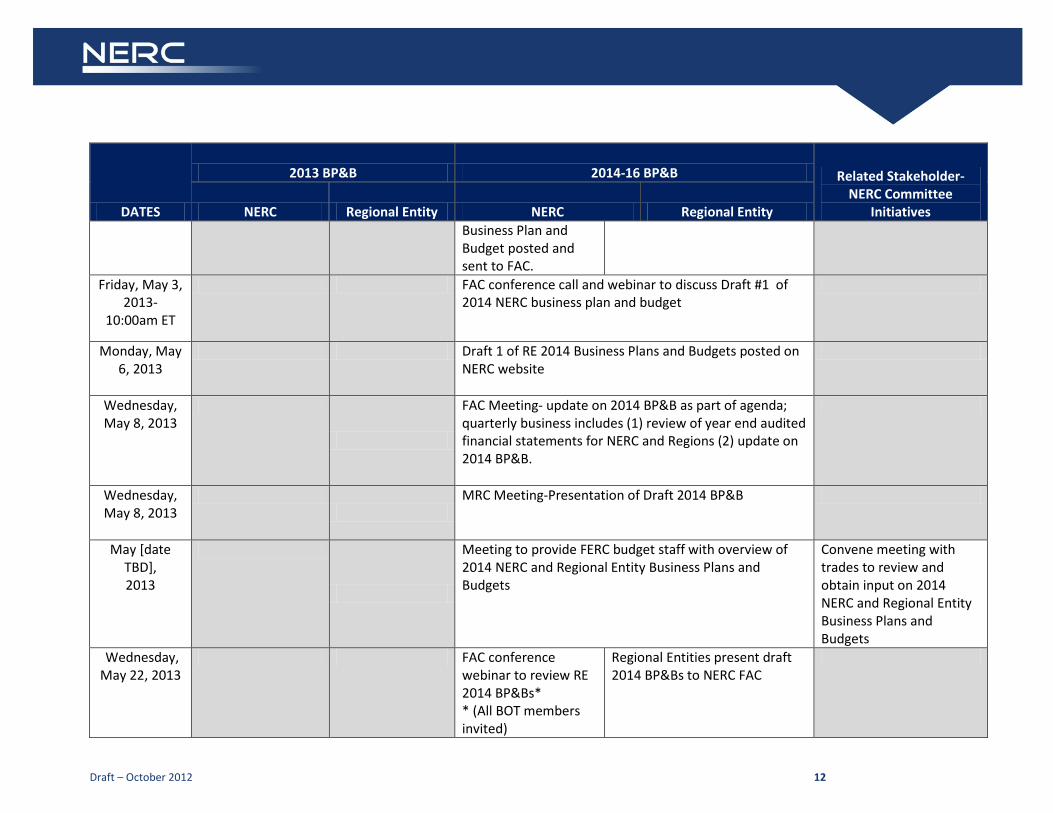
Draft – October 2012 12
DATES
2013 BP&B 2014-16 BP&B Related Stakeholder-NERC Committee
Initiatives NERC Regional Entity NERC Regional Entity Business Plan and Budget posted and sent to FAC.
Friday, May 3, 2013-
10:00am ET
FAC conference call and webinar to discuss Draft #1 of 2014 NERC business plan and budget
Monday, May 6, 2013
Draft 1 of RE 2014 Business Plans and Budgets posted on NERC website
Wednesday, May 8, 2013
FAC Meeting- update on 2014 BP&B as part of agenda; quarterly business includes (1) review of year end audited financial statements for NERC and Regions (2) update on 2014 BP&B.
Wednesday, May 8, 2013
MRC Meeting-Presentation of Draft 2014 BP&B
May [date TBD], 2013
Meeting to provide FERC budget staff with overview of 2014 NERC and Regional Entity Business Plans and Budgets
Convene meeting with trades to review and obtain input on 2014 NERC and Regional Entity Business Plans and Budgets
Wednesday, May 22, 2013
FAC conference webinar to review RE 2014 BP&Bs* * (All BOT members invited)
Regional Entities present draft 2014 BP&Bs to NERC FAC

Draft – October 2012 13
DATES
2013 BP&B 2014-16 BP&B Related Stakeholder-NERC Committee
Initiatives NERC Regional Entity NERC Regional Entity May 22, 2013 Reliability Issues Steering Committee (RISC) Open meeting
Thursday, May 30, 2013
Comments due on 1st Draft of NERC BP&B. NERC and Regional Entity 2012 budget to actual true up filing due at FERC
June 2013 Regional Entity board meeting dates for review and approval of Regional Entity 2014 Business Plans and Budgets FRCC – June MRO – June NPCC – June RFC – June 21 SERC – July 10 SPP – June 18 TRE – June WECC – June 26
Monday, June 10, 2013
Post Draft #2 of 2014 NERC Business Plan and Budget
June 18, 2013 Reliability Issues Steering Committee (RISC) Open meeting
Tuesday, July 9, 2013
Final RE 2014 budget submittal due – approved by RE board and final list of LSEs and NEL data
Wednesday, July 10, 2013
Stakeholder Comments due on 2014 NERC Draft #2
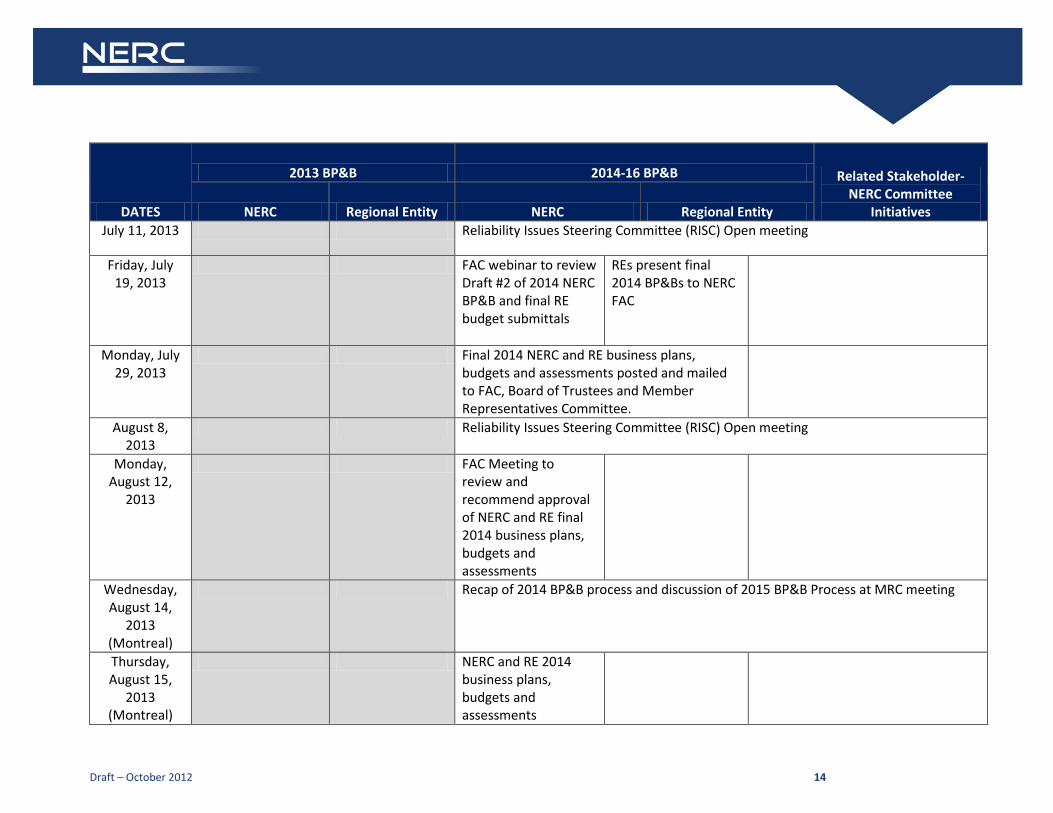
Draft – October 2012 14
DATES
2013 BP&B 2014-16 BP&B Related Stakeholder-NERC Committee
Initiatives NERC Regional Entity NERC Regional Entity July 11, 2013 Reliability Issues Steering Committee (RISC) Open meeting
Friday, July 19, 2013
FAC webinar to review Draft #2 of 2014 NERC BP&B and final RE budget submittals
REs present final 2014 BP&Bs to NERC FAC
Monday, July 29, 2013
Final 2014 NERC and RE business plans, budgets and assessments posted and mailed to FAC, Board of Trustees and Member Representatives Committee.
August 8, 2013
Reliability Issues Steering Committee (RISC) Open meeting
Monday, August 12,
2013
FAC Meeting to review and recommend approval of NERC and RE final 2014 business plans, budgets and assessments
Wednesday, August 14,
2013 (Montreal)
Recap of 2014 BP&B process and discussion of 2015 BP&B Process at MRC meeting
Thursday, August 15,
2013 (Montreal)
NERC and RE 2014 business plans, budgets and assessments
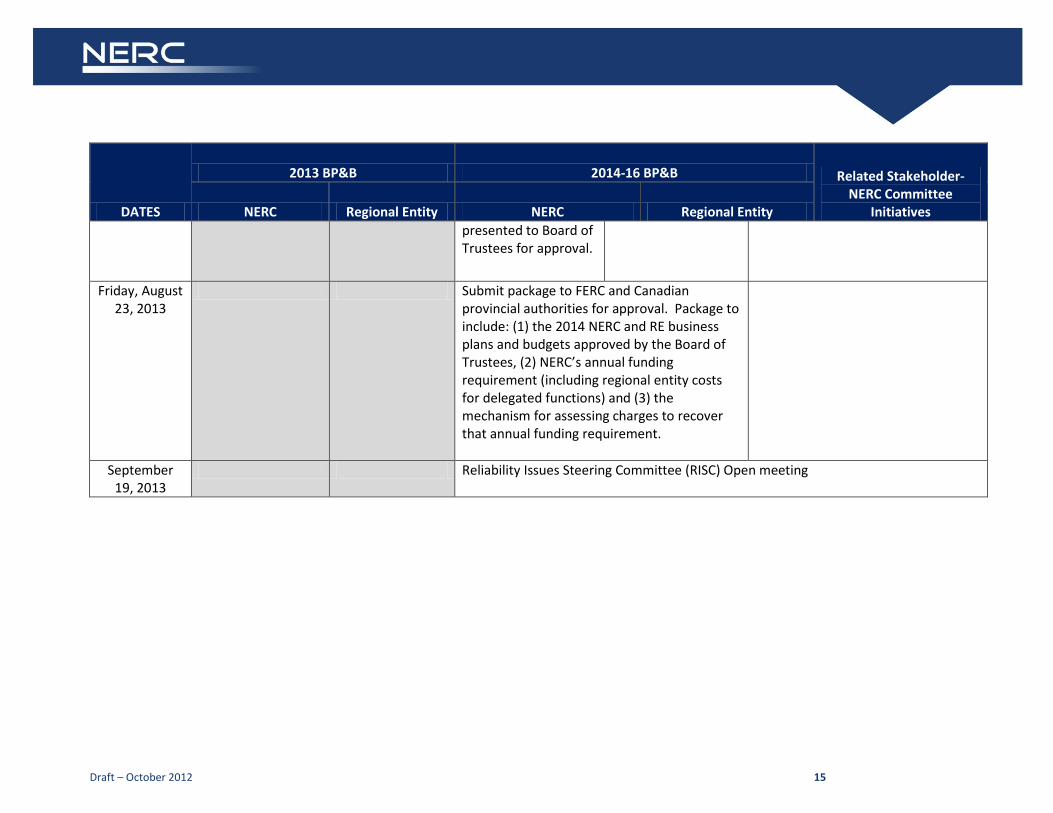
Draft – October 2012 15
DATES
2013 BP&B 2014-16 BP&B Related Stakeholder-NERC Committee
Initiatives NERC Regional Entity NERC Regional Entity presented to Board of Trustees for approval.
Friday, August 23, 2013
Submit package to FERC and Canadian provincial authorities for approval. Package to include: (1) the 2014 NERC and RE business plans and budgets approved by the Board of Trustees, (2) NERC’s annual funding requirement (including regional entity costs for delegated functions) and (3) the mechanism for assessing charges to recover that annual funding requirement.
September 19, 2013
Reliability Issues Steering Committee (RISC) Open meeting
Agenda Item 6aC!/ aŜŜǘƛƴƎOctober 31, 2012
ERO Scope of Activities Input Group — Status Report
Action None Summary During its August 15, 2012 meeting, the Member Representatives Committee (MRC) created an informal group of volunteers to assist NERC and the Regional Entities in defining the ERO’s goals, objectives and priorities as part of the annual business planning and budget process. The input group is chaired by MRC Vice Chair Carol Chinn and member representative Bill Gallagher. Other member representatives and participants include: John Anderson, Tom Burgess, Mike Penstone and Ed Schwerdt, Northeast Power Coordinating Council. NERC participants include Mike Walker, David Cook, Charlie Berardesco and Holly Mann. Mike Walker will provide the Committee with a brief update regarding the work being undertaken by this group and the materials which will be presented at the November 6, 2012 MRC meeting.
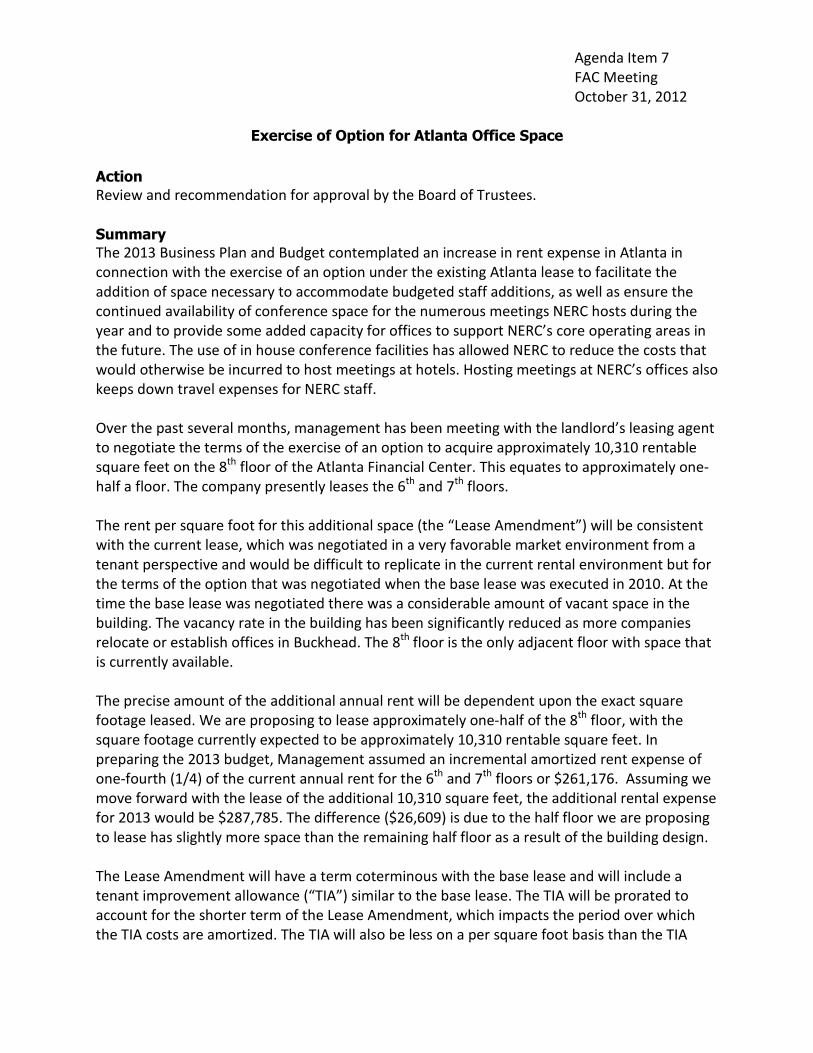
Agenda Item 7 FAC Meeting October 31, 2012
Exercise of Option for Atlanta Office Space
Action Review and recommendation for approval by the Board of Trustees.
Summary The 2013 Business Plan and Budget contemplated an increase in rent expense in Atlanta in connection with the exercise of an option under the existing Atlanta lease to facilitate the addition of space necessary to accommodate budgeted staff additions, as well as ensure the continued availability of conference space for the numerous meetings NERC hosts during the year and to provide some added capacity for offices to support NERC’s core operating areas in the future. The use of in house conference facilities has allowed NERC to reduce the costs that would otherwise be incurred to host meetings at hotels. Hosting meetings at NERC’s offices also keeps down travel expenses for NERC staff. Over the past several months, management has been meeting with the landlord’s leasing agent to negotiate the terms of the exercise of an option to acquire approximately 10,310 rentable square feet on the 8th floor of the Atlanta Financial Center. This equates to approximately one-half a floor. The company presently leases the 6th and 7th floors. The rent per square foot for this additional space (the “Lease Amendment”) will be consistent with the current lease, which was negotiated in a very favorable market environment from a tenant perspective and would be difficult to replicate in the current rental environment but for the terms of the option that was negotiated when the base lease was executed in 2010. At the time the base lease was negotiated there was a considerable amount of vacant space in the building. The vacancy rate in the building has been significantly reduced as more companies relocate or establish offices in Buckhead. The 8th floor is the only adjacent floor with space that is currently available. The precise amount of the additional annual rent will be dependent upon the exact square footage leased. We are proposing to lease approximately one-half of the 8th floor, with the square footage currently expected to be approximately 10,310 rentable square feet. In preparing the 2013 budget, Management assumed an incremental amortized rent expense of one-fourth (1/4) of the current annual rent for the 6th and 7th floors or $261,176. Assuming we move forward with the lease of the additional 10,310 square feet, the additional rental expense for 2013 would be $287,785. The difference ($26,609) is due to the half floor we are proposing to lease has slightly more space than the remaining half floor as a result of the building design. The Lease Amendment will have a term coterminous with the base lease and will include a tenant improvement allowance (“TIA”) similar to the base lease. The TIA will be prorated to account for the shorter term of the Lease Amendment, which impacts the period over which the TIA costs are amortized. The TIA will also be less on a per square foot basis than the TIA
under the existing lease due to the fact the landlord will be directly responsible for the costs to upgrade the bathrooms on the 8th floor. The construction of the bathrooms for the 6th and 7th floors was NERC’s responsibility and paid out of the TIA negotiated under the base lease, since the company was fully occupying both floors. Since the Lease Amendment contemplates that NERC will occupy approximately only 50 percent of the 8th floor, the landlord will pay for these costs directly and adjust the TIA prorata so that it is equivalent to the TIA that was provided for the 6th and 7th floor build out. Construction of the tenant improvements will be pursuant to a competitively procured construction contract, consistent with the process and terms set forth in the base lease. We are working with the architects to ensure a cost effective design for the build out of the space, including the reuse of existing offices in the expansion space. Furniture and finishing (paint, light fixtures, etc.) will generally be consistent with the 6th and 7th floors. Working with the architect, engineers, contractor and furniture supplier for our existing space, we are in the process of developing preliminary estimates of the cost to build out and furnish the expansion space. Our plan is to attempt to keep the costs as much as possible within the TIA. However, it is possible that we may be required to fund a portion of the build out from operating reserves. Management may be in a position to provide more detail regarding the estimated build out costs and potential need to utilize operating reserves at or before the Committee’s scheduled meeting on October 31, 2012. Use of operating reserves to fund any portion of the build out of the expansion space or to fund 2013 rent expense in excess of budgeted amounts will be subject to the provisions of the company’s Working Capital and Operating Reserve Policy, including the receipt of necessary authorizations and reporting of expenditures. Management is requesting that the Committee recommend to the Board that Management be authorized to execute the Lease Amendment consistent, in all material respects, with the description provided herein and also subject to (1) FERC approval of a 2013 budget which includes an estimated rent expense for the Lease Amendment, as more specifically set forth in the 2013 Business Plan and Budget approved by the Board and filed with the FERC, and (2) review and approval of the final terms and conditions of the Lease Amendment by the President and Chief Executive Officer, Chief Financial and Administrative Officer and General Counsel.
Agenda Item 8 FAC Meeting October 31, 2012
Migration of Remaining IT Applications from Princeton, NJ
Action None Summary On October 2, 2012 the Chief Financial and Administrative Officer provided the Committee with a memorandum regarding the use of operating reserves to pay for consulting services by Dell, Inc. to assist in the evaluation and migration of certain software applications from the legacy NERC data center in Princeton, NJ to NERC’s new data center in Atlanta, GA. These services are being provided on a time and materials basis with a contract limit of just under $250,000. Funding for these services was authorized by the President and Chief Executive Officer and funded from available operating reserves in accordance with the company’s Working Capital and Operating Reserve policy. Due to the complexity of the migration, the committee was informed that a potential exists that additional services will be necessary and that to the extent these additional services become necessary Management will seek Committee approval of these expenditures pursuant to the company’s Working Capital and Operating Reserve Policy. Management also indicated it would provide the Committee with a further update regarding this matter as part of its October 31, 2012 quarterly conference call agenda, as well as provide an update to the Standards Oversight and Technology Committee (SOTC) at its November 5, 2012 meeting. The purpose of this document is to provide a summary of relevant background information and provide an update to both this Committee and the SOTC regarding the status of this initiative. Background A number of software applications critical to support NERC and ERO operations are housed in the Princeton data center, including but not limited to: the Compliance Reporting, Analysis, and Tracking System (CRATS); various ERO registration applications; certain applications utilized by Reliability Coordinators; and certain applications supporting the Standards Program area, including NERC’s balloting application. NERC management is currently assessing which applications and databases may be candidates to retire or replace. Several of the applications are tied to the IDC and will be transitioned to the IDC Users Group as part of the IDC transition, which will take place when NERC’s contract to support the IDC ends on March 31, 2013. In addition, replacement of a number of applications that reside on servers in Princeton is also already underway, such as the balloting application. The Princeton lease expires on May 1, 2013 and pursuant to the terms of the lease all computer hardware needs to be removed prior to the lease termination date. There is minimal physical support available out of the Princeton office, coupled with hardware that in some instances is 8-10 years old and if it fails, replacement hardware is not available.

NERC IT has attempted four unsuccessful moves of the remaining software applications in the Princeton data center and has concluded that given the absence of documentation regarding these applications, lack of vendor support, and the fact that the applications reside on very old equipment that is no longer available, the risk is simply too great to NERC; therefore NERC IT determined it was imperative to leverage an organization with the depth and breadth of services offered by Dell Professional Services. NERC sought proposals from several other vendors, but was not comfortable that any other vendor had the resources required given the complexity and timing of NERC’s needs. Dell’s scope includes:
• Assessment of existing hardware and software
• Database mapping and application dependencies
• Documentation of applications and their usage
• Virtualization readiness assessment
• Ownership and management 80 percent of the move – only exception would involve items that would require NERC resources e.g., backups, security, etc.
Dell has committed to providing timesheets and activities on a weekly basis to ensure adherence to cost containment requirements and will invoice on a monthly basis for time worked. In addition, we have been assured that personnel will be available to conduct moves during after-hours timeframe at no additional cost. Moving the remaining legacy Princeton data center to Atlanta is also critical to allowing NERC to cancel Princeton data circuits and realize a reduction in telecommunication fees of several hundred thousand dollars per year, which has already been factored into NERC’s budget. Additional hardware and software may be required to support any applications that are migrated to the Atlanta data center, but the extent of any incremental hardware or software investments is unknown at this time. Current Status NERC IT assembled a team consisting of management, staff and vendors with familiarity regarding the various applications that are currently housed in Princeton. Based on feedback from this group it was determined that a number of the applications are either no longer necessary and can be retired or can be transferred by NERC IT without the assistance of Dell. However, a number of critical applications still remain in Princeton and will be the focus of the next phase of the evaluation and will involve the assistance of Dell. While at this time it is too early to determine the exact amount of resources that will be required for the relocation, it is clear the number of applications which must be relocated is much less than was initially contemplated. Management will continue to keep both committees informed of the progress with respect to the scope and costs of the relocation of the remaining applications. While it is too early to tell whether the current Dell contract for this work will be sufficient to cover the costs, all expenditures of operating reserves in support of this initiative will continue to be subject to the authorizations and reporting requirements set forth in the company’s Working Capital and Operating Reserve Policy.