agency washington, d.c. 20460 environmental … · are responsive to the needs of stakeholders,...
TRANSCRIPT

Oak Ridge National Laboratory
United States Office of Research and EPA/600/R-00/045Environmental Protection Development March 2000Agency Washington, D.C. 20460
Environmental TechnologyVerification Report
Explosives Detection Technology
Research International, Inc.FAST 2000™

EPA-VS-SCM-45 The accompanying notice is an integral part of this verification statement. March 2000
TECHNOLOGY TYPE: EXPLOSIVES DETECTION
APPLICATION: MEASUREMENT OF EXPLOSIVES INCONTAMINATED WATER
TECHNOLOGY NAME: FAST 2000™
COMPANY: Research International, Inc.
ADDRESS: 18706 142nd Avenue NE PHONE: (425) 486-7831Woodinville, WA 98072-8523 FAX: (425) 485-9137
WEB SITE: www.resrchintl.com
Oak Ridge National Laboratory
THE ENVIRONMENTAL TECHNOLOGY VERIFICATION PROGRAM
Joint Verification Statement
The U.S. Environmental Protection Agency (EPA) has created the Environmental Technology VerificationProgram (ETV) to facilitate the deployment of innovative or improved environmental technologies throughperformance verification and dissemination of information. The goal of the ETV Program is to furtherenvironmental protection by substantially accelerating the acceptance and use of improved and cost-effectivetechnologies. ETV seeks to achieve this goal by providing high quality, peer reviewed data on technologyperformance to those involved in the design, distribution, financing, permitting, purchase, and use ofenvironmental technologies.
ETV works in partnership with recognized standards and testing organizations and stakeholder groupsconsisting of regulators, buyers, and vendor organizations, with the full participation of individual technologydevelopers. The program evaluates the performance of innovative technologies by developing test plans thatare responsive to the needs of stakeholders, conducting field or laboratory tests (as appropriate), collectingand analyzing data, and preparing peer-reviewed reports. All evaluations are conducted in accordance withrigorous quality assurance protocols to ensure that data of known and adequate quality are generated and thatthe results are defensible.
The Department of Defense (DoD) has a similar verification program known as the Environmental SecurityTechnology Certification Program (ESTCP). The purpose of ESTCP is to demonstrate and validate the mostpromising innovative technologies that target DoD’s most urgent environmental needs and are projected to

EPA-VS-SCM-45 The accompanying notice is an integral part of this verification statement. March 2000
pay back the investment within 5 years through cost savings and improved efficiencies. ESTCPdemonstrations are typically conducted under operational field conditions at DoD facilities. Thedemonstrations are intended to generate supporting cost and performance data for acceptance or validation ofthe technology. The goal is to transition mature environmental science and technology projects through thedemonstration/ validation phase, enabling promising technologies to receive regulatory and end useracceptance in order to be fielded and commercialized more rapidly.
The Oak Ridge National Laboratory (ORNL) is one of the verification organizations operating under the SiteCharacterization and Monitoring Technologies (SCMT) program. SCMT, which is administered by EPA’sNational Exposure Research Laboratory, is one of 12 technology areas under ETV. In this demonstration,ORNL evaluated the performance of explosives detection technologies. This verification statement provides asummary of the test results for Research International’s (RI’s) FAST 2000™. This verification wasconducted jointly with the Department of Defense’s (DoD’s) Environmental Security TechnologyCertification Program (ESTCP).
DEMONSTRATION DESCRIPTION This demonstration was designed to evaluate technologies that detect and measure explosives in soil andwater. RI elected to analyze only water samples with the FAST 2000. The demonstration was conducted atORNL in Oak Ridge, Tennessee, from August 23 through September 1, 1999. Spiked samples of knownconcentration were used to assess the accuracy of the technology. Explosives-contaminated water samplesfrom Tennessee, Oregon, and Louisiana with concentrations ranging from 0 to 25,000 µg/L were analyzed.The primary constituents in the samples were 2,4,6-trinitrotoluene (TNT); isomeric dinitrotoluene (DNT),including both 2,4-dinitrotoluene and 2,6-dinitrotoluene; hexahydro-1,3,5-trinitro-1,3,5-triazine (RDX); andoctahydro-1,3,5,7-tetranitro-1,3,5,7-tetrazocine (HMX). The results of the water analyses conducted underfield conditions by the FAST 2000 were compared with results from reference laboratory analyses ofhomogenous replicate samples determined using EPA SW-846 Method 8330. Details of the demonstration,including a data summary and discussion of results, may be found in the report entitled EnvironmentalTechnology Verification Report: Explosives Detection Technology—Research International, Inc., FAST2000™, EPA/600-R-00/045.
TECHNOLOGY DESCRIPTIONThe FAST 2000 is based on a displacement assay that uses antibodies and fluorescence as a means ofdetection. The unit (weighing 2.8 lb, with dimensions of 6 × 15.5 × 16 cm) can be easily carried into the fieldand plugged directly into a portable PC for on-site data acquisition and analysis. The key elements of thesensor are (1) antibodies specific for the analyte; (2) signal molecules that are similar to the analyte but arelabeled with a fluorophore (a cyanine-based fluorescent dye, Cy5) to enable fluorescence detection; and (3) afluorescence detector. For analysis, the analyte-specific antibodies are immobilized onto a solid support andthen saturated with the fluorescently labeled signal molecule, creating an antibody/signal molecule complex.Monoclonal antibodies (the Naval Research Laboratory’s 11B3 TNT and Strategic Diagnostics RDX) areimmobilized onto porous membrane supports and saturated with the fluorescent tag. The membrane is insertedinto a disposable coupon and placed in the FAST 2000, and the buffer flow is started by a computercommand. Once the fluorescence background signal due to unbound Cy5 has stabilized (generally15–20 minutes), the biosensor is ready for sample injection. If the sample contains the target analyte, aproportional amount of the labeled signal molecule is displaced from the antibody and detected by thefluorimeter downstream. The coupon and membrane can be used for repeated assays. The life of themembrane is dependent upon the number and concentration of positive assays that are run. The reporting limitfor both TNT and RDX was 20 µg/L.

EPA-VS-SCM-45 The accompanying notice is an integral part of this verification statement. March 2000
VERIFICATION OF PERFORMANCEThe following performance characteristics of the FAST 2000 were observed:
Precision: For the water samples, the mean relative standard deviations (RSDs) for RDX and TNT were52% and 76%, respectively.
Accuracy: The mean recoveries for RDX and TNT were 192% and 316%, respectively.
False positive/false negative results: Of the 20 blank water samples, RI reported RDX in 4 samples (24%false positives) and TNT in 16 samples (80% false positives). Three of the RDX results were reported as“ME,” which indicated that the sample had “matrix effects” and the result could not be reported by the FAST2000. False positive and false negative results were also determined by comparing the FAST 2000 result tothe reference laboratory result on environmental and spiked samples (e.g., whether the FAST 2000 reports aresult as a nondetect that the reference laboratory reported as a detect, and vice versa). For RDX, 2% of theresults were false positives relative to the reference laboratory result, while 16% of the TNT results werereported as false positives. RI reported a small fraction of the samples (3% for each analyte) as nondetects(i.e., false negatives) when the laboratory reported a detect.
Completeness: Approximately 80% of the water analyses were complete. Approximately 18% of the RDXresults and 21% of the TNT results were reported as “matrix effects,” where a result could not be obtained.
Comparability: A one-to-one sample comparison of the FAST 2000 results and the reference laboratoryresults was performed for all samples (spiked and environmental) that were reported above the reportinglimits. The correlation coefficient (r) for the comparison of the entire water data set for TNT was 0.23, andthe slope (m) of the linear regression line was 1.81. When comparability was assessed for specificconcentration ranges, the r value did not change dramatically for TNT, ranging from 0.14 to 0.21 dependingon the concentration ranges selected. RDX correlation with the reference laboratory for water was higher ®= 0.63, m = 1.60). Examination of the data indicated that the RDX results were usually higher than those ofthe reference laboratory. However, for specific environmental sample matrices (such as the samples from theLouisiana Army Ammunition Plant), the FAST 2000 results were generally lower than those of the referencelaboratory. This indicated the possibility of a matrix-dependent effect.
Sample Throughput: Operating under the outdoor conditions, the RI team, usually consisting of threeoperators, accomplished a sample throughput rate of approximately three samples per hour for the wateranalyses. Separate instruments were used for the TNT and RDX analyses. Typically, two operators analyzedsamples while one operator performed data analysis, but the technology can be run by a single trainedoperator.
NOTICE: EPA and ESTCP verifications are based on evaluations of technology performance under specific,predetermined criteria and appropriate quality assurance procedures. EPA, ESTCP, and ORNL make no expressed orimplied warranties as to the performance of the technology and do not certify that a technology will always operate asverified. The end user is solely responsible for complying with any and all applicable federal, state, and localrequirements. Mention of commercial product names does not imply endorsement or recommendation.
Overall Evaluation: The verification team found that the FAST 2000 was relatively simple for the trainedanalyst to operate in the field, requiring less than an hour for initial setup. The overall performance of theFAST 2000 for the analysis of water samples was characterized as imprecise and biased high for TNT, andimprecise and biased high (but matrix-dependent) for RDX. As with any technology selection, the user mustdetermine if this technology is appropriate for the application and the project data quality objectives. For moreinformation on this and other verified technologies, visit the ETV web site at http://www.epa.gov/etv .
Gary J. Foley, Ph.D. David E. Reichle, Ph.D.Director Associate Laboratory DirectorNational Exposure Research Laboratory Life Sciences and Environmental TechnologiesOffice of Research and Development Oak Ridge National Laboratory
Jeffrey Marqusee, Ph.D.DirectorEnvironmental Security Technology Certification Program U.S. Department of Defense

EPA/600/R-00/045March 2000
Environmental TechnologyVerification Report
Explosives Detection Technology
Research International, Inc.FAST 2000™
By
Amy B. DindalCharles K. Bayne, Ph.D.Roger A. Jenkins, Ph.D.
Oak Ridge National LaboratoryOak Ridge, Tennessee 37831-6120
Eric N. KoglinU.S. Environmental Protection Agency
Environmental Sciences DivisionNational Exposure Research Laboratory
Las Vegas, Nevada 89193-3478
This demonstration was conducted in cooperation with theU.S. Department of Defense
Environmental Security Technology Certification Program

ii
Notice
The U.S. Environmental Protection Agency (EPA), through its Office of Research and Development (ORD),and the U.S. Department of Defense’s Environmental Security Technology Certification Program (ESTCP)Program, funded and managed, through Interagency Agreement No. DW89937854 with Oak Ridge NationalLaboratory, the verification effort described herein. This report has been peer and administratively reviewedand has been approved for publication as an EPA document. Mention of trade names or commercial productsdoes not constitute endorsement or recommendation for use of a specific product.

iii
Table of Contents
List of Figures . . . . . . . . . . . . . . . . . . . . . . . . . . . . . . . . . . . . . . . . . . . . . . . . . . . . . . . . . . . . . . . . . . vList of Tables . . . . . . . . . . . . . . . . . . . . . . . . . . . . . . . . . . . . . . . . . . . . . . . . . . . . . . . . . . . . . . . . . . viiAcknowledgments . . . . . . . . . . . . . . . . . . . . . . . . . . . . . . . . . . . . . . . . . . . . . . . . . . . . . . . . . . . . . . . ixAbbreviations and Acronyms . . . . . . . . . . . . . . . . . . . . . . . . . . . . . . . . . . . . . . . . . . . . . . . . . . . . . . . xi
1 INTRODUCTION . . . . . . . . . . . . . . . . . . . . . . . . . . . . . . . . . . . . . . . . . . . . . . . . . . . . . . . . . . . . . . . 1
2 TECHNOLOGY DESCRIPTION . . . . . . . . . . . . . . . . . . . . . . . . . . . . . . . . . . . . . . . . . . . . . . . . . . . . 3General Technology Description . . . . . . . . . . . . . . . . . . . . . . . . . . . . . . . . . . . . . . . . . . . . . . . . . . . . . 3Preparation of Standards . . . . . . . . . . . . . . . . . . . . . . . . . . . . . . . . . . . . . . . . . . . . . . . . . . . . . . . . . . . 3Sample Preparation and Analysis . . . . . . . . . . . . . . . . . . . . . . . . . . . . . . . . . . . . . . . . . . . . . . . . . . . . . 4Cross-Reactivity . . . . . . . . . . . . . . . . . . . . . . . . . . . . . . . . . . . . . . . . . . . . . . . . . . . . . . . . . . . . . . . . . 4
3 DEMONSTRATION DESIGN . . . . . . . . . . . . . . . . . . . . . . . . . . . . . . . . . . . . . . . . . . . . . . . . . . . . . . 5Objective . . . . . . . . . . . . . . . . . . . . . . . . . . . . . . . . . . . . . . . . . . . . . . . . . . . . . . . . . . . . . . . . . . . . . . 5Demonstration Testing Location and Conditions . . . . . . . . . . . . . . . . . . . . . . . . . . . . . . . . . . . . . . . . . . 5Soil Sample Descriptions . . . . . . . . . . . . . . . . . . . . . . . . . . . . . . . . . . . . . . . . . . . . . . . . . . . . . . . . . . 5
Sources of Samples . . . . . . . . . . . . . . . . . . . . . . . . . . . . . . . . . . . . . . . . . . . . . . . . . . . . . . . . . . 5Iowa Army Ammunition Plant . . . . . . . . . . . . . . . . . . . . . . . . . . . . . . . . . . . . . . . . . . . . . . . 5Louisiana Army Ammunition Plant . . . . . . . . . . . . . . . . . . . . . . . . . . . . . . . . . . . . . . . . . . . . 5Milan Army Ammunition Plant . . . . . . . . . . . . . . . . . . . . . . . . . . . . . . . . . . . . . . . . . . . . . . . 5Volunteer Army Ammunition Plant . . . . . . . . . . . . . . . . . . . . . . . . . . . . . . . . . . . . . . . . . . . 5Fort Ord Military Base . . . . . . . . . . . . . . . . . . . . . . . . . . . . . . . . . . . . . . . . . . . . . . . . . . . . 6
Performance Evaluation Samples . . . . . . . . . . . . . . . . . . . . . . . . . . . . . . . . . . . . . . . . . . . . . . . . 6Soil Sample Preparation . . . . . . . . . . . . . . . . . . . . . . . . . . . . . . . . . . . . . . . . . . . . . . . . . . . . . . . 6
Water Sample Descriptions . . . . . . . . . . . . . . . . . . . . . . . . . . . . . . . . . . . . . . . . . . . . . . . . . . . . . . . . 7Sources of Samples . . . . . . . . . . . . . . . . . . . . . . . . . . . . . . . . . . . . . . . . . . . . . . . . . . . . . . . . . . 7Performance Evaluation Samples . . . . . . . . . . . . . . . . . . . . . . . . . . . . . . . . . . . . . . . . . . . . . . . . 7Water Sample Preparation . . . . . . . . . . . . . . . . . . . . . . . . . . . . . . . . . . . . . . . . . . . . . . . . . . . . . 7
Sample Randomization . . . . . . . . . . . . . . . . . . . . . . . . . . . . . . . . . . . . . . . . . . . . . . . . . . . . . . . . . . . . 7Summary of Experimental Design . . . . . . . . . . . . . . . . . . . . . . . . . . . . . . . . . . . . . . . . . . . . . . . . . . . . 7Description of Performance Factors . . . . . . . . . . . . . . . . . . . . . . . . . . . . . . . . . . . . . . . . . . . . . . . . . . 7
Precision . . . . . . . . . . . . . . . . . . . . . . . . . . . . . . . . . . . . . . . . . . . . . . . . . . . . . . . . . . . . . . . . . 8Accuracy . . . . . . . . . . . . . . . . . . . . . . . . . . . . . . . . . . . . . . . . . . . . . . . . . . . . . . . . . . . . . . . . . 8False Positive/Negative Results . . . . . . . . . . . . . . . . . . . . . . . . . . . . . . . . . . . . . . . . . . . . . . . . . 8Completeness . . . . . . . . . . . . . . . . . . . . . . . . . . . . . . . . . . . . . . . . . . . . . . . . . . . . . . . . . . . . . . 9Comparability . . . . . . . . . . . . . . . . . . . . . . . . . . . . . . . . . . . . . . . . . . . . . . . . . . . . . . . . . . . . . . 9Sample Throughput . . . . . . . . . . . . . . . . . . . . . . . . . . . . . . . . . . . . . . . . . . . . . . . . . . . . . . . . . . 9Ease of Use . . . . . . . . . . . . . . . . . . . . . . . . . . . . . . . . . . . . . . . . . . . . . . . . . . . . . . . . . . . . . . . 9Cost . . . . . . . . . . . . . . . . . . . . . . . . . . . . . . . . . . . . . . . . . . . . . . . . . . . . . . . . . . . . . . . . . . . . . 9Miscellaneous Factors . . . . . . . . . . . . . . . . . . . . . . . . . . . . . . . . . . . . . . . . . . . . . . . . . . . . . . . . 9
4 REFERENCE LABORATORY ANALYSES . . . . . . . . . . . . . . . . . . . . . . . . . . . . . . . . . . . . . . . . . . 10Reference Laboratory Selection . . . . . . . . . . . . . . . . . . . . . . . . . . . . . . . . . . . . . . . . . . . . . . . . . . . . . 10Reference Laboratory Method . . . . . . . . . . . . . . . . . . . . . . . . . . . . . . . . . . . . . . . . . . . . . . . . . . . . . . 10Reference Laboratory Performance . . . . . . . . . . . . . . . . . . . . . . . . . . . . . . . . . . . . . . . . . . . . . . . . . . 10

iv
5 TECHNOLOGY EVALUATION . . . . . . . . . . . . . . . . . . . . . . . . . . . . . . . . . . . . . . . . . . . . . . . . . . . 13Objective and Approach . . . . . . . . . . . . . . . . . . . . . . . . . . . . . . . . . . . . . . . . . . . . . . . . . . . . . . . . . . . 13Precision . . . . . . . . . . . . . . . . . . . . . . . . . . . . . . . . . . . . . . . . . . . . . . . . . . . . . . . . . . . . . . . . . . . . . . 13Accuracy . . . . . . . . . . . . . . . . . . . . . . . . . . . . . . . . . . . . . . . . . . . . . . . . . . . . . . . . . . . . . . . . . . . . . 13False Positive/False Negative Results . . . . . . . . . . . . . . . . . . . . . . . . . . . . . . . . . . . . . . . . . . . . . . . . . 13Completeness . . . . . . . . . . . . . . . . . . . . . . . . . . . . . . . . . . . . . . . . . . . . . . . . . . . . . . . . . . . . . . . . . . 14Comparability . . . . . . . . . . . . . . . . . . . . . . . . . . . . . . . . . . . . . . . . . . . . . . . . . . . . . . . . . . . . . . . . . . 14Sample Throughput . . . . . . . . . . . . . . . . . . . . . . . . . . . . . . . . . . . . . . . . . . . . . . . . . . . . . . . . . . . . . . 17Ease of Use . . . . . . . . . . . . . . . . . . . . . . . . . . . . . . . . . . . . . . . . . . . . . . . . . . . . . . . . . . . . . . . . . . . 17Cost Assessment . . . . . . . . . . . . . . . . . . . . . . . . . . . . . . . . . . . . . . . . . . . . . . . . . . . . . . . . . . . . . . . . 17
FAST 2000 Costs . . . . . . . . . . . . . . . . . . . . . . . . . . . . . . . . . . . . . . . . . . . . . . . . . . . . . . . . . . . 18Reference Laboratory Costs . . . . . . . . . . . . . . . . . . . . . . . . . . . . . . . . . . . . . . . . . . . . . . . . . . . 19Cost Assessment Summary . . . . . . . . . . . . . . . . . . . . . . . . . . . . . . . . . . . . . . . . . . . . . . . . . . . . 19
Miscellaneous Factors . . . . . . . . . . . . . . . . . . . . . . . . . . . . . . . . . . . . . . . . . . . . . . . . . . . . . . . . . . . . 19Summary of Performance . . . . . . . . . . . . . . . . . . . . . . . . . . . . . . . . . . . . . . . . . . . . . . . . . . . . . . . . . 20
6 TECHNOLOGY UPDATE AND REPRESENTATIVE APPLICATIONS . . . . . . . . . . . . . . . . . . . . 22Technology Update . . . . . . . . . . . . . . . . . . . . . . . . . . . . . . . . . . . . . . . . . . . . . . . . . . . . . . . . . . . . . . 22Representative Applications . . . . . . . . . . . . . . . . . . . . . . . . . . . . . . . . . . . . . . . . . . . . . . . . . . . . . . . . 23Refereed Papers . . . . . . . . . . . . . . . . . . . . . . . . . . . . . . . . . . . . . . . . . . . . . . . . . . . . . . . . . . . . . . . . 23
7 REFERENCES . . . . . . . . . . . . . . . . . . . . . . . . . . . . . . . . . . . . . . . . . . . . . . . . . . . . . . . . . . . . . . . . 24
APPENDIX: RI’s FAST 2000 Sample Results Compared with Reference Laboratory Results . . . . . . . . . . . . . . . . . . 25
v
List of Figures
1 The FAST 2000 . . . . . . . . . . . . . . . . . . . . . . . . . . . . . . . . . . . . . . . . . . . . . . . . . . . . . . . . . . . . 32 Comparability of reference laboratory water results with FAST 2000 results for all TNT
concentrations . . . . . . . . . . . . . . . . . . . . . . . . . . . . . . . . . . . . . . . . . . . . . . . . . . . . . . . . . . . . . 153 Comparability of reference laboratory water results with FAST 2000 results for vendor RDX
concentrations less than 500 µg/L . . . . . . . . . . . . . . . . . . . . . . . . . . . . . . . . . . . . . . . . . . . . . . . 164 Range of percent difference values for RDX and TNT . . . . . . . . . . . . . . . . . . . . . . . . . . . . . . . . 175 The FAST 6000 . . . . . . . . . . . . . . . . . . . . . . . . . . . . . . . . . . . . . . . . . . . . . . . . . . . . . . . . . . . . 22

vi

vii
List of Tables
1 FAST 2000 Cross-reactivity . . . . . . . . . . . . . . . . . . . . . . . . . . . . . . . . . . . . . . . . . . . . . . . . . . 4 2 Summary of Soil and Water Samples . . . . . . . . . . . . . . . . . . . . . . . . . . . . . . . . . . . . . . . . . . . . 8 3 Summary of the Reference Laboratory Performance for Soil Samples . . . . . . . . . . . . . . . . . . . 11 4 Summary of the Reference Laboratory Performance for Water Samples . . . . . . . . . . . . . . . . . 11 5 Summary of the Reference Laboratory Performance on Blank Samples . . . . . . . . . . . . . . . . . . 12 6 Summary of the FAST 2000 Precision for Water Samples . . . . . . . . . . . . . . . . . . . . . . . . . . . . 13 7 Summary of the FAST 2000 Accuracy for Water Samples . . . . . . . . . . . . . . . . . . . . . . . . . . . . 13 8 Summary of FAST 2000 False Positives on Blank Water Samples . . . . . . . . . . . . . . . . . . . . . . 14 9 Summary of the FAST 2000 Detect/Nondetect Performance Relative to the Reference Laboratory
Results . . . . . . . . . . . . . . . . . . . . . . . . . . . . . . . . . . . . . . . . . . . . . . . . . . . . . . . . . . . . . . . . . 1410 FAST 2000 Correlation with Reference Data for Various Vendor Water Concentration Ranges . 1411 Evaluation of FAST 2000 Comparison with Reference Laboratory Results by Matrix . . . . . . . . . 1612 Estimated Analytical Costs for Explosives-Contaminated Samples . . . . . . . . . . . . . . . . . . . . . . . 2013 Performance Summary for the FAST 2000 Water Analyses . . . . . . . . . . . . . . . . . . . . . . . . . . . 21


ix
Acknowledgments
The authors wish to acknowledge the support of all those who helped plan and conduct the demonstration,analyze the data, and prepare this report. In particular, we recognize Dr. Thomas Jenkins (U.S. Army, ColdRegions Research and Engineering Laboratory) and Dr. Michael Maskarinec (Oak Ridge NationalLaboratory), who served as the technical experts for this project. We thank the people who helped us toobtain the samples from the various sites, including Dr. Jenkins, Danny Harrelson (Waterways ExperimentStation), Kira Lynch (U.S. Army Corps of Engineers, Seattle District), Larry Stewart (Milan ArmyAmmunition Plant), and Dick Twitchell and Bob Elmore (Volunteer Army Ammunition Plant). For externalpeer review, we thank Dr. C. L. Grant (Professor Emeritus, University of New Hampshire). For internal peerreview, we thank Stacy Barshick of Oak Ridge National Laboratory and Harry Craig of EPA Region 10. Theauthors also acknowledge the participation of Lisa Shriver-Lake, Paul Charles, Paul Gauger, David Holt, andCharles Patterson of the Naval Research Laboratory and Ann Wilson of Research International, whoperformed the analyses during the demonstration.
For more information on the Explosives Detection Technology Demonstration contact
Eric N. Koglin Amy B. DindalProject Technical Leader Technical LeadEnvironmental Protection Agency Oak Ridge National LaboratoryEnvironmental Sciences Division Chemical and Analytical Sciences DivisionNational Exposure Research Laboratory P.O .Box 2008P.O. Box 93478 Oak Ridge, TN 37831- 6120Las Vegas, Nevada 89193-3478 (865) 574-4863(702) 798-2432 [email protected]@epa.gov
For more information on Research International’s FAST 2000 contact
Elric SaaskiResearch International18706 142nd Avenue NEWoodinville, WA 98072-8523(425) [email protected]


xi
Abbreviations and Acronyms
2-Am-DNT 2-amino-4,6-dinitrotoluene, CAS # 35572-78-24-Am-DNT 4-amino-2,6-dinitrotoluene, CAS # 1946-51-0CFI Continuous Flow ImmunosensorCRREL U.S. Army Cold Regions Research and Engineering Laboratory2,4-DNT 2,4-dinitrotoluene, CAS # 121-14-22,6-DNT 2,6-dinitrotoluene, CAS # 606-20-2DNT isomeric dinitrotoluene (includes both 2,4-DNT and 2,6-DNT)DoD U.S. Department of DefenseEPA U.S. Environmental Protection AgencyERA Environmental Resource AssociatesESTCP Environmental Security Technology Certification ProgramETV Environmental Technology Verification Programfn false negative resultfp false positive resultGC gas chromatographyHMX octahydro-1,3,5,7-tetranitro-1,3,5,7-tetrazocine, CAS # 2691-41-0HPLC high-performance liquid chromatographyIMS ion mobility spectrometryLAAAP Louisiana Army Ammunition PlantME matrix effectsMLAAP Milan Army Ammunition PlantNERL National Exposure Research Laboratory (EPA)NRL U.S. Naval Research LaboratoryORNL Oak Ridge National LaboratoryPE performance evaluation sampleQA quality assuranceQC quality controlRDX hexahydro-1,3,5-trinitro-1,3,5-triazine, CAS # 121-82-4RI Research International, Inc.RSD relative standard deviationSCMT Site Characterization and Monitoring Technologies Pilot of ETVSD standard deviationTNB 1,3,5-trinitrobenzene, CAS # 99-35-4TNT 2,4,6-trinitrotoluene, CAS # 118-96-7


1
Section 1 — Introduction
The U.S. Environmental Protection Agency (EPA)created the Environmental Technology VerificationProgram (ETV) to facilitate the deployment ofinnovative or improved environmental technologiesthrough performance verification and disseminationof information. The goal of the ETV Program is tofurther environmental protection by substantiallyaccelerating the acceptance and use of improvedand cost-effective technologies. ETV seeks toachieve this goal by providing high-quality, peer-reviewed data on technology performance to thoseinvolved in the design, distribution, financing,permitting, purchase, and use of environmentaltechnologies.
ETV works in partnership with recognized standardsand testing organizations and stakeholder groupsconsisting of regulators, buyers, and vendororganizations, with the full participation of individualtechnology developers. The program evaluates theperformance of innovative technologies bydeveloping verification test plans that are responsiveto the needs of stakeholders, conducting field orlaboratory tests (as appropriate), collecting andanalyzing data, and preparing peer-reviewed reports.All evaluations are conducted in accordance withrigorous quality assurance (QA) protocols to ensurethat data of known and adequate quality aregenerated and that the results are defensible.
ETV is a voluntary program that seeks to provideobjective performance information to all of theparticipants in the environmental marketplace and toassist them in making informed technology decisions.ETV does not rank technologies or compare theirperformance, label or list technologies as acceptableor unacceptable, seek to determine “best availabletechnology,” or approve or disapprove technologies.The program does not evaluate technologies at thebench or pilot scale and does not conduct or supportresearch. Rather, it conducts and reports on testingdesigned to describe the performance oftechnologies under a range of environmentalconditions and matrices.
The program now operates 12 pilots covering abroad range of environmental areas. ETV has begunwith a 5-year pilot phase (1995–2000) to test a widerange of partner and procedural alternatives invarious pilot areas, as well as the true marketdemand for and response to such a program. Inthese pilots, EPA utilizes the expertise of partner“verification organizations” to design efficientprocesses for conducting performance tests ofinnovative technologies. These expert partners areboth public and private organizations, includingfederal laboratories, states, industry consortia, andprivate sector entities. Verification organizationsoversee and report verification activities based ontesting and QA protocols developed with input fromall major stakeholder/customer groups associatedwith the technology area. The verification describedin this report was administered by the SiteCharacterization and Monitoring Technologies(SCMT) Pilot, with Oak Ridge National Laboratory(ORNL) serving as the verification organization. (Tolearn more about ETV, visit ETV’s Web site athttp://www.epa.gov/etv.) The SCMT pilot isadministered by EPA’s National Exposure ResearchLaboratory (NERL), Environmental SciencesDivision, in Las Vegas, Nevada.
The Department of Defense (DoD) has a similarverification program known as the EnvironmentalSecurity Technology Certification Program(ESTCP). The purpose of ESTCP is to demonstrateand validate the most promising innovativetechnologies that target DoD’s most urgentenvironmental needs and are projected to pay backthe investment within 5 years through cost savingsand improved efficiencies. ESTCP responds to(1) concern over the slow pace and cost ofremediation of environmentally contaminated sites onmilitary installations, (2) congressional direction toconduct demonstrations specifically focused on newtechnologies, (3) Executive Order 12856, whichrequires federal agencies to place high priority onobtaining funding and resources needed for thedevelopment of innovative pollution preventionprograms and technologies for installations and inacquisitions, and (4) the need to improve defense
2
readiness by reducing the drain on the Department’soperation and maintenance dollars caused by realworld commitments such as environmentalrestoration and waste management. ESTCPdemonstrations are typically conducted underoperational field conditions at DoD facilities. Thedemonstrations are intended to generate supportingcost and performance data for acceptance orvalidation of the technology. The goal is to transitionmature environmental science and technologyprojects through the demonstration/ validation phase,enabling promising technologies to receive regulatoryand end user acceptance in order to be fielded andcommercialized more rapidly. (To learn more aboutESTCP, visit ESTCP’s web site athttp://www.estcp.org.)
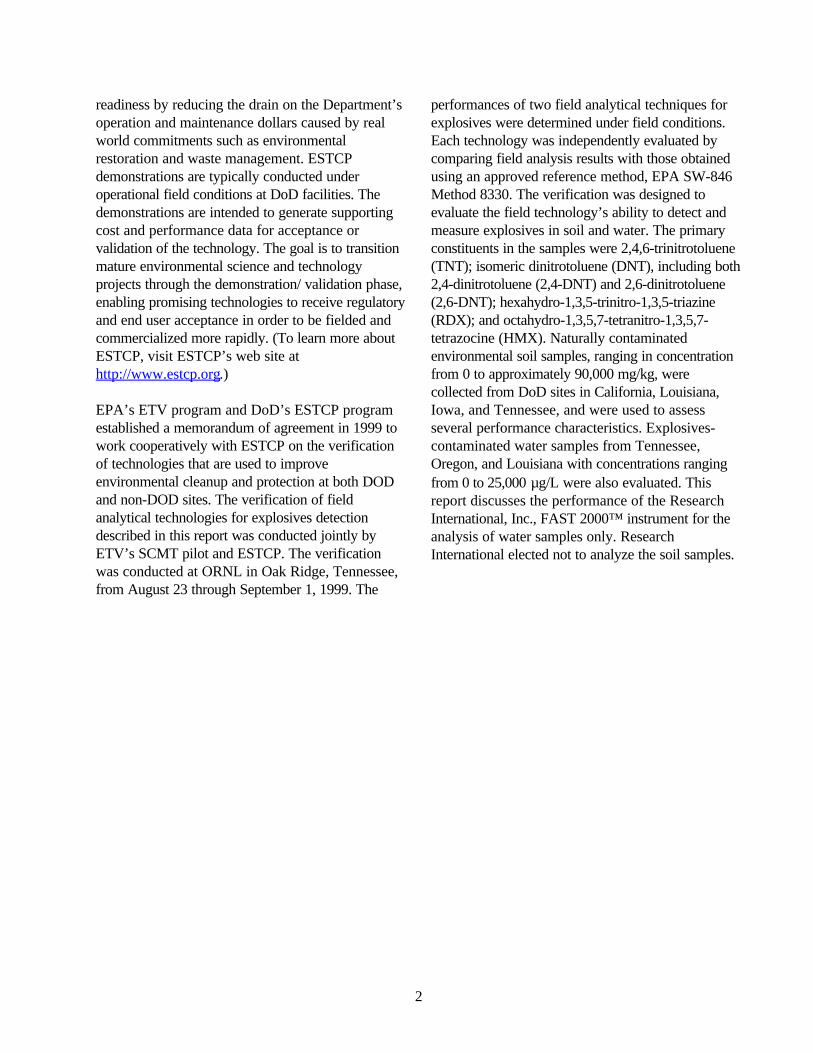
EPA’s ETV program and DoD’s ESTCP programestablished a memorandum of agreement in 1999 towork cooperatively with ESTCP on the verificationof technologies that are used to improveenvironmental cleanup and protection at both DODand non-DOD sites. The verification of fieldanalytical technologies for explosives detectiondescribed in this report was conducted jointly byETV’s SCMT pilot and ESTCP. The verificationwas conducted at ORNL in Oak Ridge, Tennessee,from August 23 through September 1, 1999. The
performances of two field analytical techniques forexplosives were determined under field conditions.Each technology was independently evaluated bycomparing field analysis results with those obtainedusing an approved reference method, EPA SW-846Method 8330. The verification was designed toevaluate the field technology’s ability to detect andmeasure explosives in soil and water. The primaryconstituents in the samples were 2,4,6-trinitrotoluene(TNT); isomeric dinitrotoluene (DNT), including both2,4-dinitrotoluene (2,4-DNT) and 2,6-dinitrotoluene(2,6-DNT); hexahydro-1,3,5-trinitro-1,3,5-triazine(RDX); and octahydro-1,3,5,7-tetranitro-1,3,5,7-tetrazocine (HMX). Naturally contaminatedenvironmental soil samples, ranging in concentrationfrom 0 to approximately 90,000 mg/kg, werecollected from DoD sites in California, Louisiana,Iowa, and Tennessee, and were used to assessseveral performance characteristics. Explosives-contaminated water samples from Tennessee,Oregon, and Louisiana with concentrations rangingfrom 0 to 25,000 µg/L were also evaluated. Thisreport discusses the performance of the ResearchInternational, Inc., FAST 2000™ instrument for theanalysis of water samples only. ResearchInternational elected not to analyze the soil samples.

3
Figure 1. The FAST 2000.
Section 2 — Technology Description
In this section, the vendor (with minimal editorial changes by ORNL) provides a description of thetechnology and the analytical procedure used during the verification testing activities.
General Technology DescriptionThe Continuous Flow Immunosensor (CFI) is basedon a displacement assay that utilizes antibodies andfluorescence as a means of detection. Thetechnology was originally developed by the U.S.Naval Research Laboratory (NRL). The field-portable version of the CFI, the FAST 2000, hasbeen engineered and manufactured by ResearchInternational, Inc. (RI). The FAST 2000 unit (shownin Figure 1) can be easily carried into the field(weight: 2.8 lb; dimensions: 6 × 15.5 × 16 cm) andplugged directly into a portable PC for on-site dataacquisition and analysis.
The key elements of the sensor are (1) antibodiesspecific for the analyte; (2) signal molecules that aresimilar to the analyte but are labeled with afluorophore (a cyanine-based fluorescent dye, Cy5)to enable fluorescence detection; and (3) afluorescence detector. For analysis, the analyte-specific antibodies are immobilized onto a solidsupport and then saturated with the fluorescentlylabeled signal molecule, creating an antibody/signalmolecule complex. Monoclonal antibodies (the NavalResearch Laboratory’s 11B3 TNT and StrategicDiagnostics RDX) are immobilized onto porousmembrane supports and
saturated with the fluorescent tag using the detailedprotocols outlined in draft U.S. EPA Method 4655.The membrane is inserted into a disposable couponand placed in the FAST 2000, and the buffer flow isstarted by a computer command. Once thefluorescence background signal due to unbound Cy5has stabilized (generally 15–20 min), the biosensor isready for sample injection. If the sample contains thetarget analyte, a proportional amount of the labeledsignal molecule is displaced from the antibody anddetected by the fluorimeter downstream. Thecoupon and membrane can be used for repeatedassays. The life of the membrane is dependent uponthe number and concentration of positive assays thatare run.
At the time of the demonstration, the cost ofpurchasing the FAST 2000 was $23,650. Instrumentpurchase included the FAST 2000 instrumentdesigned for use with an immunoassay-basedsensor; a data acquisition card and a cable linkingthe instrument to the laptop computer; a fluid storageunit; one assay coupon kit; the software required torun the instrument and analyze data; and aninstruction manual. This price did not include the costof the laptop. The FAST 2000 could also be leasedfor $1970 per month.
Preparation of StandardsThe TNT and RDX calibration standards wereprepared by drying down 20 µL of stock explosivestandard (1,000,000 µg/L stored in acetonitrile) witha nitrogen air stream. Using a micropipettor, 2.0 mLof system flow buffer (10 mM sodiummonophosphate, 2.5% ethanol, and 0.01% Tween,pH 7.4) was added to the tube to dissolve theexplosive residue, forming a 10,000-µg/L explosivestandard. Serial dilutions of the 10,000-µg/L standardwere made in flow buffer to obtain 25-, 50-, 100-,250-, 500-, and 1,000-µg/L standards.
4
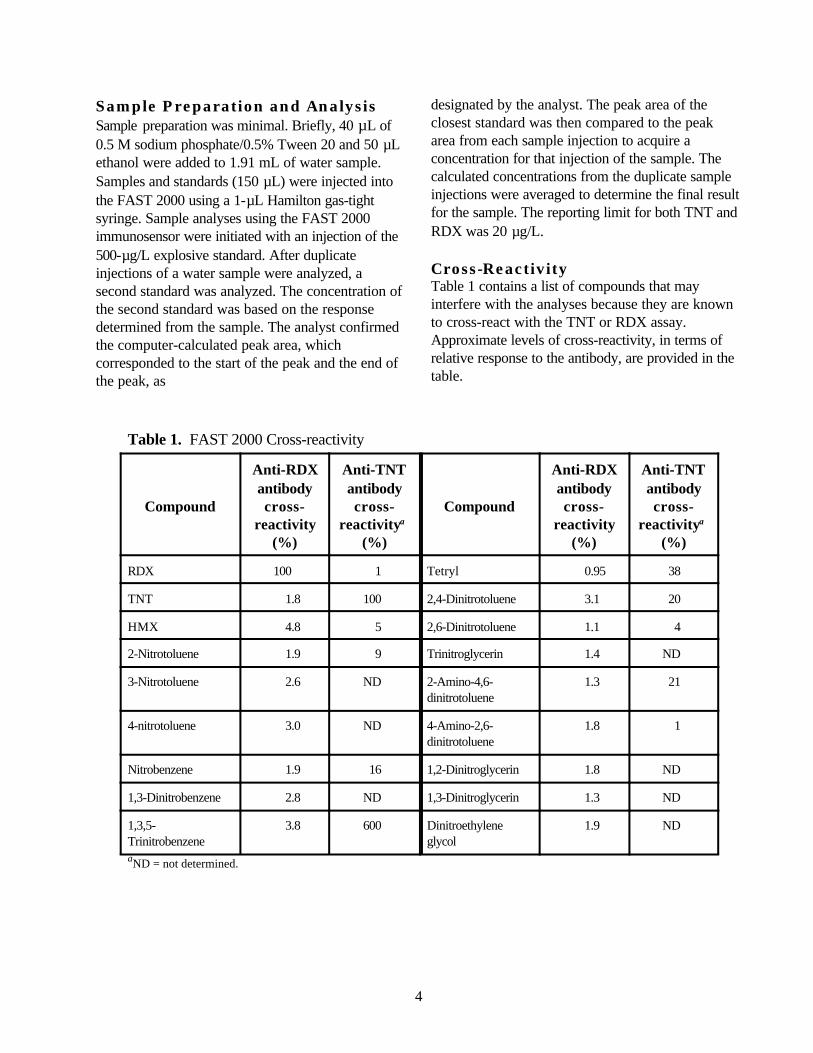
Sample Preparation and AnalysisSample preparation was minimal. Briefly, 40 µL of0.5 M sodium phosphate/0.5% Tween 20 and 50 µLethanol were added to 1.91 mL of water sample.Samples and standards (150 µL) were injected intothe FAST 2000 using a 1-µL Hamilton gas-tightsyringe. Sample analyses using the FAST 2000immunosensor were initiated with an injection of the500-µg/L explosive standard. After duplicateinjections of a water sample were analyzed, asecond standard was analyzed. The concentration ofthe second standard was based on the responsedetermined from the sample. The analyst confirmedthe computer-calculated peak area, whichcorresponded to the start of the peak and the end ofthe peak, as
designated by the analyst. The peak area of theclosest standard was then compared to the peakarea from each sample injection to acquire aconcentration for that injection of the sample. Thecalculated concentrations from the duplicate sampleinjections were averaged to determine the final resultfor the sample. The reporting limit for both TNT andRDX was 20 µg/L. Cross-ReactivityTable 1 contains a list of compounds that mayinterfere with the analyses because they are knownto cross-react with the TNT or RDX assay.Approximate levels of cross-reactivity, in terms ofrelative response to the antibody, are provided in thetable.
Table 1. FAST 2000 Cross-reactivity
Compound
Anti-RDXantibodycross-
reactivity(%)
Anti-TNTantibodycross-
reactivitya (%)
Compound
Anti-RDXantibodycross-
reactivity(%)
Anti-TNTantibodycross-
reactivitya (%)
RDX 100 1 Tetryl 0.95 38
TNT 1.8 100 2,4-Dinitrotoluene 3.1 20
HMX 4.8 5 2,6-Dinitrotoluene 1.1 4
2-Nitrotoluene 1.9 9 Trinitroglycerin 1.4 ND
3-Nitrotoluene 2.6 ND 2-Amino-4,6-dinitrotoluene
1.3 21
4-nitrotoluene 3.0 ND 4-Amino-2,6-dinitrotoluene
1.8 1
Nitrobenzene 1.9 16 1,2-Dinitroglycerin 1.8 ND
1,3-Dinitrobenzene 2.8 ND 1,3-Dinitroglycerin 1.3 ND
1,3,5-Trinitrobenzene
3.8 600 Dinitroethyleneglycol
1.9 ND
aND = not determined.

5
Section 3 — Demonstration Design
ObjectiveThe purpose of this section is to describe thedemonstration design. It is a summary of thetechnology demonstration plan (ORNL 1999).
Demonstration Testing Location andConditionsThe verification of field analytical technologies forexplosives was conducted at the ORNL Freels BendCabin site, in Oak Ridge, Tennessee. The site issomewhat primitive, with no running water, but thevendors were provided with some shelter (porchoverhang) and electrical power. The temperatureand relative humidity were monitored during fieldtesting. Over the ten days of testing, the averagetemperature was 77ºF, and ranged from 60 to 88ºF.The average relative humidity was 67%, and rangedfrom 35 to 96%.
The samples used in this study were brought to thedemonstration testing location for evaluation by thevendors. Explosives-contaminated soils from Armyammunition plants in Iowa, Louisiana, andTennessee and a former Army base in California(Fort Ord) were used in this verification. In addition,explosives-contaminated water samples wereanalyzed from DoD sites in Oregon, Louisiana, andTennessee. Because samples were obtained frommultiple DoD sites, the samples represented areasonable cross section of the population ofexplosives-contaminated matrices, such that theversatility of the field technology could be evaluated.The vendors had the choice of analyzing either soilor water samples, or both matrices. More specificdetails about the samples are presented below.
Soil Sample DescriptionsThe primary constituents in the soil samples wereTNT, DNT, RDX, and HMX. The samples alsocontained trace amounts of 2-amino-4,6-dinitrotoluene (2-Am-DNT) and 4-amino-2,6-dinitrotoluene (4-Am-DNT), which are degradationproducts of TNT. The total concentration ofexplosives ranged from 0 to approximately90,000 mg/kg. The following sections describe thesites from which the samples were collected.
Sources of SamplesIowa Army Ammunition PlantCurrently an active site, the Iowa Army AmmunitionPlant was constructed to load, assemble, and packvarious conventional ammunition and fusing systems.Current production includes 120-mm tank rounds,warheads for missiles, and mine systems. During theearly years of use, the installation used surfaceimpoundments, landfills, and sumps for disposal ofindustrial wastes containing explosives. The majorcontaminants in these samples were TNT, RDX, andHMX.
Louisiana Army Ammunition PlantThe Louisiana Army Ammunition Plant (LAAAP),near Shreveport, Louisiana, is a government-ownedfacility that began production in 1942. The facility iscurrently an Army Reserve plant. Production itemsat LAAAP have included metal parts for artilleryshells; the plant also loads, assembles, and packsartillery shells, mines, rockets, mortar rounds, anddemolition blocks. As a result of these activities andthe resulting soil and groundwater contamination,EPA placed LAAAP on the National Priorities Listof contaminated sites (Superfund) in 1989. Themajor constituents in the samples from this site wereTNT, RDX, and HMX, with trace levels of 1,3,5-trinitrobenzene (TNB), DNT, 2-Am-DNT, and 4-Am-DNT.
Milan Army Ammunition PlantCurrently active, the Milan Army Ammunition Plant(MLAAP) in Milan, Tennessee, was established inlate 1940 as part of the pre–World War II buildup.The facility still has ten ammunition loading,assembly, and packaging lines. Munitions-relatedwastes have resulted in soil contamination. Theprimary contaminants in these soils were RDX andTNT.
Volunteer Army Ammunition PlantThe Volunteer Army Ammunition Plant, inChattanooga, Tennessee, was built in 1941 tomanufacture TNT and DNT. All production ceasedin 1977. Past production practices resulted insignificant soil and groundwater contamination. Inthe samples from this site, concentrations of TNT
6
and DNT ranged from 10 to 90,000 mg/kg, withsignificantly smaller concentrations of Am-DNTisomers.
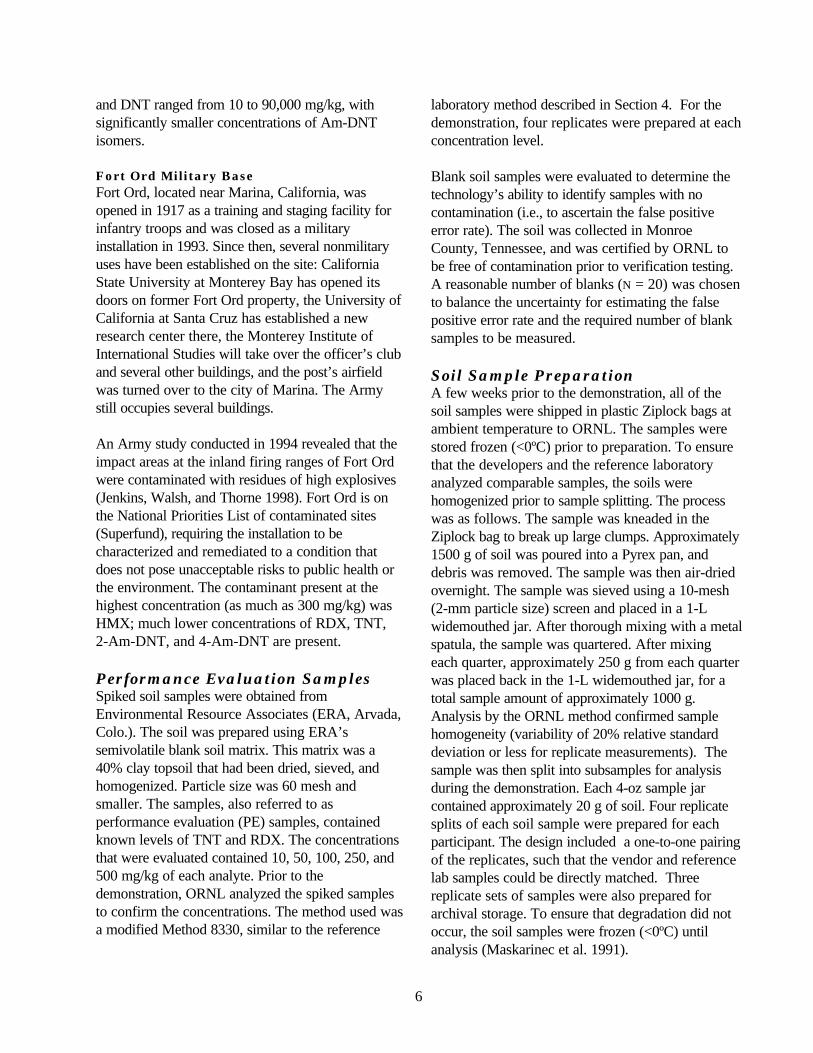
Fort Ord Military BaseFort Ord, located near Marina, California, wasopened in 1917 as a training and staging facility forinfantry troops and was closed as a militaryinstallation in 1993. Since then, several nonmilitaryuses have been established on the site: CaliforniaState University at Monterey Bay has opened itsdoors on former Fort Ord property, the University ofCalifornia at Santa Cruz has established a newresearch center there, the Monterey Institute ofInternational Studies will take over the officer’s cluband several other buildings, and the post’s airfieldwas turned over to the city of Marina. The Armystill occupies several buildings.
An Army study conducted in 1994 revealed that theimpact areas at the inland firing ranges of Fort Ordwere contaminated with residues of high explosives(Jenkins, Walsh, and Thorne 1998). Fort Ord is onthe National Priorities List of contaminated sites(Superfund), requiring the installation to becharacterized and remediated to a condition thatdoes not pose unacceptable risks to public health orthe environment. The contaminant present at thehighest concentration (as much as 300 mg/kg) wasHMX; much lower concentrations of RDX, TNT,2-Am-DNT, and 4-Am-DNT are present.
Performance Evaluation SamplesSpiked soil samples were obtained fromEnvironmental Resource Associates (ERA, Arvada,Colo.). The soil was prepared using ERA’ssemivolatile blank soil matrix. This matrix was a40% clay topsoil that had been dried, sieved, andhomogenized. Particle size was 60 mesh andsmaller. The samples, also referred to asperformance evaluation (PE) samples, containedknown levels of TNT and RDX. The concentrationsthat were evaluated contained 10, 50, 100, 250, and500 mg/kg of each analyte. Prior to thedemonstration, ORNL analyzed the spiked samplesto confirm the concentrations. The method used wasa modified Method 8330, similar to the reference
laboratory method described in Section 4. For thedemonstration, four replicates were prepared at eachconcentration level.
Blank soil samples were evaluated to determine thetechnology’s ability to identify samples with nocontamination (i.e., to ascertain the false positiveerror rate). The soil was collected in MonroeCounty, Tennessee, and was certified by ORNL tobe free of contamination prior to verification testing.A reasonable number of blanks (N = 20) was chosento balance the uncertainty for estimating the falsepositive error rate and the required number of blanksamples to be measured.
Soil Sample PreparationA few weeks prior to the demonstration, all of thesoil samples were shipped in plastic Ziplock bags atambient temperature to ORNL. The samples werestored frozen (<0ºC) prior to preparation. To ensurethat the developers and the reference laboratoryanalyzed comparable samples, the soils werehomogenized prior to sample splitting. The processwas as follows. The sample was kneaded in theZiplock bag to break up large clumps. Approximately1500 g of soil was poured into a Pyrex pan, anddebris was removed. The sample was then air-driedovernight. The sample was sieved using a 10-mesh(2-mm particle size) screen and placed in a 1-Lwidemouthed jar. After thorough mixing with a metalspatula, the sample was quartered. After mixingeach quarter, approximately 250 g from each quarterwas placed back in the 1-L widemouthed jar, for atotal sample amount of approximately 1000 g.Analysis by the ORNL method confirmed samplehomogeneity (variability of 20% relative standarddeviation or less for replicate measurements). Thesample was then split into subsamples for analysisduring the demonstration. Each 4-oz sample jarcontained approximately 20 g of soil. Four replicatesplits of each soil sample were prepared for eachparticipant. The design included a one-to-one pairingof the replicates, such that the vendor and referencelab samples could be directly matched. Threereplicate sets of samples were also prepared forarchival storage. To ensure that degradation did notoccur, the soil samples were frozen (<0ºC) untilanalysis (Maskarinec et al. 1991).

7
Water Sample DescriptionsSources of SamplesExplosives-contaminated water samples fromTennessee, Oregon, and Louisiana were analyzed.The contamination in the water samples ranged inconcentration from 0 to about 25,000 µg/L. Watersamples were collected from LAAAP, MLAAP,and Volunteer, described in the previous section (see“Sources of Samples”). Water samples were alsoobtained from Umatilla Chemical Depot, describedbelow.
Umatilla Chemical Depot is located in northeasternOregon. The mission of the facility recently changedto storage of chemical warfare ammunition. Oncethe chemicals are destroyed, the installation isscheduled to close. Several environmental sites havebeen identified for cleanup prior to base closure.One site has explosives-contaminated groundwater;the cleanup identified for this site is to pump andtreat the water with granulated activated carbon.The major contaminants in these samples wereTNT, RDX, HMX, and TNB. According to aremedial investigation conducted at the site, thesesamples were not contaminated with any chemicalwarfare agents.
Performance Evaluation SamplesWater samples of known concentration wereprepared by the U.S. Army Cold Regions Researchand Engineering Laboratory (CRREL) in Hanover,New Hampshire. These samples were used todetermine the technology’s accuracy. Theconcentrations of TNT and RDX in the spikeddistilled water samples were 25, 100, 200, 500, and1000 µg/L for each analyte; four replicates wereprepared at each concentration. Prior to thedemonstration, ORNL analyzed the spiked samplesto confirm the concentrations.
Distilled water obtained from ORNL was used forthe blanks. As with the soil samples, 20 blanksamples were analyzed.
Water Sample PreparationThe water samples were collected in 2.5-gal carboysapproximately 7 to 10 days prior to the start of thedemonstration and shipped on ice to ORNL. Toensure that degradation did not occur, the samples
were stored under refrigeration until analysis (~4ºC)(Maskarinec et al. 1999). Sample splitting wasperformed in a small laboratory cold room, whichwas maintained at 4ºC. To prepare the watersample, a spout was attached to the 2.5-gal carboy,and the water sample was split by filling multiple250-mL amber glass bottles. As with the soilsamples, four replicate splits of each water samplewere prepared for each participant, and three sets ofsamples were also prepared for archival storage.
Sample RandomizationThe samples were randomized in two stages. First,the order in which the filled jars were distributedwas randomized so that the same developer did notalways receive the first jar filled for a given sampleset. Second, the order of analysis was randomized sothat each participant analyzed the same set ofsamples, but in a different order. Each jar waslabeled with a sample number. Replicate sampleswere assigned unique (but not sequential) samplenumbers. Spiked materials and blanks were labeledin the same manner, such that these quality controlsamples were indistinguishable from other samples.All samples were analyzed blindly by both thedeveloper and the reference laboratory.
Summary of Experimental DesignThe distribution of samples from the various sites isdescribed in Table 2. A total of 108 soil sampleswere analyzed, with approximately 60% of thesamples being naturally contaminated environmentalsoils, and the remaining 40% being spikes andblanks. A total of 176 water samples were analyzed,with approximately 75% of the samples beingnaturally contaminated environmental water, and theremaining 25% being spikes and blanks. Fourreplicates were analyzed for each sample type. Forexample, four replicate splits of each of three FortOrd soils were analyzed, for a total of 12 individualFort Ord samples.
Description of Performance FactorsIn Section 5, technology performance is evaluated interms of precision, accuracy, completeness, andcomparability, which are indicators of data quality(EPA 1998). False positive and negative results,sample throughput, and ease of use are also

8
evaluated. Each of these performancecharacteristics is defined in this section.
Table 2.Summary of Soil and Water Samples
Samplesource or
type
No. of soilsamples
No. of watersamples
Fort Ord 12 0
Iowa 4 0
LAAAP 16 80
MLAAP 20 20
Umatilla 0 24
Volunteer 12 8
Spiked 24 24
Blank 20 20
Total 108 176
PrecisionPrecision is the reproducibility of measurementsunder a given set of conditions. Standard deviation(SD) and relative standard deviation (RSD) forreplicate results are used to assess precision, usingthe following equation:
RSD = (SD / average concentration) × 100% .(Eq. 1)
The overall RSD is characterized by three summaryvalues:
• mean — i.e., average;• median — i.e., 50th percentile value, at which
50% of all individual RSD values are below and50% are above; and
• range — i.e., the highest and lowest RSD valuesthat were reported.
The average RSD may not be the bestrepresentation of precision, but it is reported forconvenient reference. RSDs greater than 100%should be viewed as indicators of large variabilityand possibly non-normal distributions.
AccuracyAccuracy represents the closeness of the tech-nology’s measured concentrations to known (in thiscase, spiked/PE) values. Accuracy is assessed interms of percent recovery, calculated by thefollowing equation:
% recovery = (measured concentration / known concentration) × 100% .
(Eq. 2)
As with precision, the overall percent recovery ischaracterized by three summary values: mean,median, and range.
False Positive/Negative ResultsA false positive (fp) result is one in which thetechnology detects explosives in the sample whenthere actually are none (Berger, McCarty, and Smith1996). A false negative (fn) result is one in whichthe technology indicates that no explosives arepresent in the sample, when there actually are(Berger, McCarty, and Smith 1996). The evaluationof fp and fn results is influenced by the actualconcentration in the sample and includes anassessment of the reporting limits of the technology.False positive results are assessed in two ways.First, the results are assessed relative to the blanks(i.e., the technology reports a detected value whenthe sample is a blank). Second, the results areassessed on environmental and spiked sampleswhere the analyte was not detected by the referencelaboratory (i.e., the reference laboratory reports anondetect and the field technology reports adetection). False negative results, also assessed forenvironmental and spiked samples, indicate thefrequency that the technology reported a nondetect(i.e., < reporting limits) and the reference laboratoryreported a detection. Note that the referencelaboratory results were confirmed by the ORNLlaboratory so that fp/fn assessment would not beinfluenced by faulty laboratory data. The reportinglimit is considered in the evaluation. For example, ifthe reference laboratory reported a result as0.9 mg/kg, and the technology’s paired result wasreported as below reporting limits (<1 mg/kg), thetechnology’s result was considered correct and not afalse negative result.

9
CompletenessCompleteness is defined as the percentage of mea-surements that are judged to be usable (i.e., theresult is not rejected). The acceptable completenessis 95% or greater.
ComparabilityComparability refers to how well the field technologyand reference laboratory data agree. The differencebetween accuracy and comparability is that whereasaccuracy is judged relative to a known value,comparability is judged relative to the results of astandard or reference procedure, which may or maynot report the results accurately. A one-to-onesample comparison of the technology results and thereference laboratory results is performed inSection 5.
A correlation coefficient quantifies the linearrelationship between two measurements (Draperand Smith 1981). The correlation coefficient isdenoted by the letter r; its value ranges from –1 to+1, where 0 indicates the absence of any linearrelationship. The value r = –1 indicates a perfectnegative linear relation (one measurement decreasesas the second measurement increases); the value r =+1 indicates a perfect positive linear relation (onemeasurement increases as the second measurementincreases). The slope of the linear regression line,denoted by the letter m, is related to r. Whereas rrepresents the linear association between the vendorand reference laboratory concentrations, mquantifies the amount of change in the vendor’smeasurements relative to the reference laboratory’smeasurements. A value of +1 for the slope indicatesperfect agreement. Values greater than 1 indicatethat the vendor results are generally higher than thereference laboratory, while values less than 1indicate that the vendor results are usually lowerthan the reference laboratory. In addition, a directcomparison between the field technology andreference laboratory data is performed by evaluatingthe percent difference (%D) between the measuredconcentrations, defined as
%D = ([field technology] – [ref lab]) / (ref lab) × 100% (Eq. 3)
The range of %D values is summarized and reportedin Section 5.
Sample ThroughputSample throughput is a measure of the number ofsamples that can be processed and reported by atechnology in a given period of time. This is reportedin Section 5 as number of samples per hour times thenumber of analysts.
Ease of UseA significant factor in purchasing an instrument or atest kit is how easy the technology is to use. Severalfactors are evaluated and reported on in Section 5:
• What is the required operator skill level (e.g.,technician, B.S., M.S., or Ph.D.)?
• How many operators were used during thedemonstration? Could the technology be run by asingle person?
• How much training would be required in order torun this technology?
• How much subjective decision-making isrequired?
CostAn important factor in the consideration of whetherto purchase a technology is cost. Costs involved withoperating the technology and the standard referenceanalyses are estimated in Section 5. To account forthe variability in cost data and assumptions, theeconomic analysis is presented as a list of costelements and a range of costs for sample analysis.Several factors affect the cost of analysis. Wherepossible, these factors are addressed so that decisionmakers can independently complete a site-specificeconomic analysis to suit their needs.
Miscellaneous FactorsAny other information that might be useful to aperson who is considering purchasing the technologyis documented in Section 5. Examples of informationthat might be useful to a prospective purchaser arethe amount of hazardous waste generated during theanalyses, the ruggedness of the technology, theamount of electrical or battery power necessary tooperate the technology, and aspects of thetechnology or method that make it user-friendly oruser-unfriendly.
10
Section 4 — Reference Laboratory Analyses
Reference Laboratory SelectionThe verification process is based on the presence ofa statistically validated data set against which theperformance goals of the technology may becompared. The choice of an appropriate referencemethod and reference laboratory are critical to thesuccess of the demonstration. To assess theperformance of the explosives field analyticaltechnologies, the data obtained from demonstrationparticipants were compared to data obtained usingconventional analytical methods. Selection of thereference laboratory was based on the experience ofprospective laboratories with QA procedures,reporting requirements, and data quality parametersconsistent with the goals of the program. SpecializedAssays, Inc. (currently part of Test America, Inc.),of Nashville, Tennessee, was selected to performthe analyses based on ORNL’s experience withlaboratories capable of performing explosivesanalyses using EPA SW-846 Method 8330. ORNLreviewed Specialized Assays’ record of laboratoryvalidation performed by the U.S. Army Corps ofEngineers (Omaha, Nebraska). EPA and ORNLdecided that, based on the credibility of the ArmyCorps program and ORNL’s prior experience withthe laboratory, Specialized Assays would be selectedto perform the reference analyses.
ORNL conducted an audit of Specialized Assays’laboratory operations on May 4, 1999. Thisevaluation focused specifically on the proceduresthat would be used for the analysis of thedemonstration samples. Results from this auditindicated that Specialized Assays was proficient inseveral areas, including quality management,document/record control, sample control, andinformation management. Specialized Assays wasfound to be compliant with implementation ofMethod 8330 analytical procedures. The companyprovided a copy of its QA plan, which details all ofthe QA and quality control (QC) procedures for alllaboratory operations (Specialized Assays 1999).The audit team noted that Specialized Assays hadexcellent procedures in place for data backup,retrievability, and long-term storage. ORNLconducted a second audit at Specialized Assays
while the analyses were being performed. Since theinitial qualification visit, management of thislaboratory had changed because Specialized Assaysbecame part of Test America. The visit includedtours of the laboratory, interviews with keypersonnel, and review of data packages. Overall, nomajor deviations from procedures were observedand laboratory practices appeared to meet the QArequirements of the technology demonstration plan(ORNL 1999).
Reference Laboratory MethodThe reference laboratory’s analytical method,presented in the technology demonstration plan,followed the guidelines established in EPA SW-846Method 8330 (EPA 1994). According to SpecializedAssays’ procedures, soil samples were prepared byextracting 2-g samples of soil in acetonitrile bysonication for approximately 16 h. An aliquot of theextract was then combined with a calcium chloridesolution to precipitate out suspended particulates.After the solution was filtered, the filtrate was readyfor analysis. For the water samples, 400 mL ofsample were combined with sodium chloride andacetonitrile in a separatory funnel. After mixing andallowing the solutions to separate, the bottomaqueous layer was discarded and the organic layerwas collected. The acetonitrile volume was reducedto 2 mL, and the sample was diluted with 2 mL ofdistilled water for a final volume of 4 mL. Thesample was then ready for analysis. The analyteswere identified and quantified using a high-performance liquid chromatograph (HPLC) with a254-nm UV detector. The primary analytical columnwas a C-18 reversed-phase column withconfirmation by a secondary cyano column. Thepractical quantitation limits were 0.5 µg/L for waterand 0.5 mg/kg for soils.
Reference Laboratory PerformanceORNL validated all of the reference laboratory dataaccording to the procedure described in thedemonstration plan (ORNL 1999). During thevalidation, the following aspects of the data werereviewed: completeness of the data package,adherence to holding time requirements, correctness
11
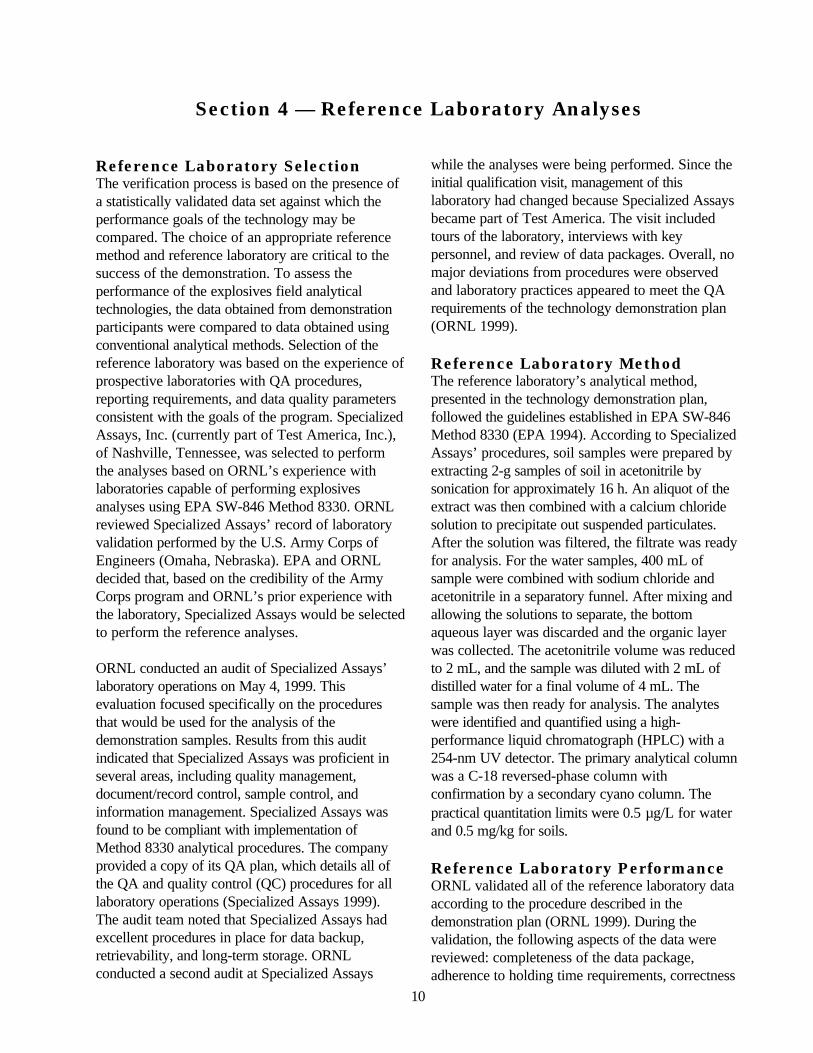
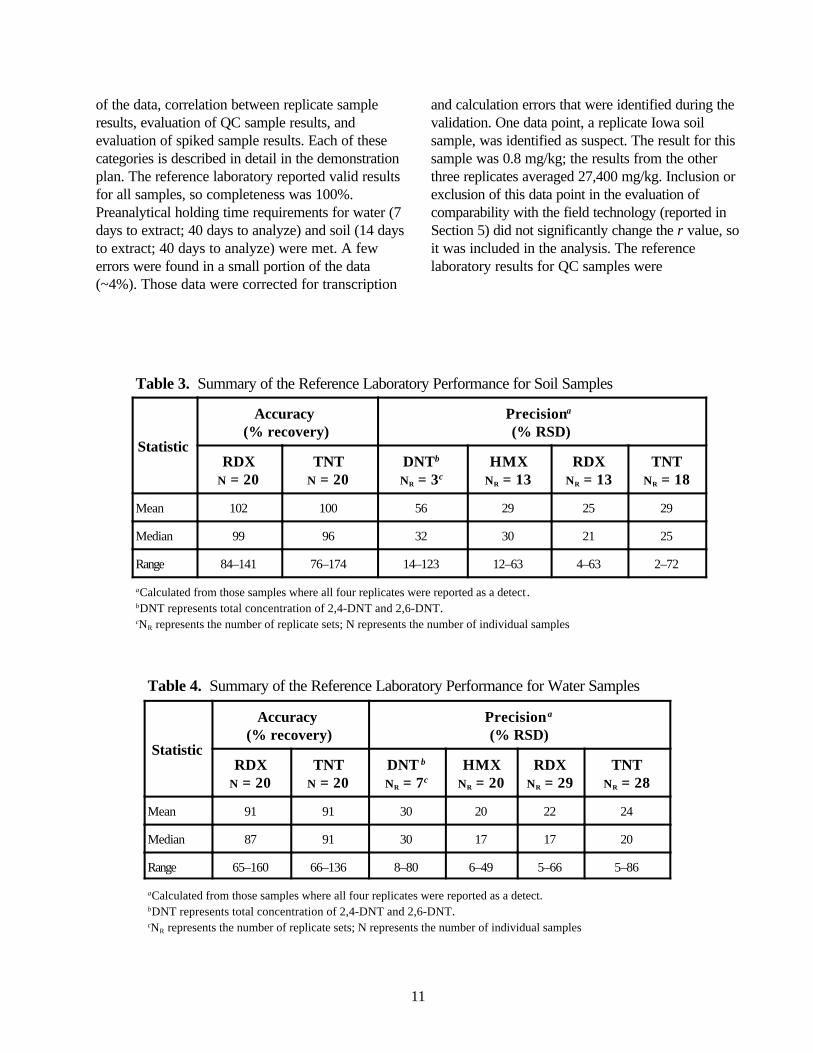
of the data, correlation between replicate sampleresults, evaluation of QC sample results, andevaluation of spiked sample results. Each of thesecategories is described in detail in the demonstrationplan. The reference laboratory reported valid resultsfor all samples, so completeness was 100%.Preanalytical holding time requirements for water (7days to extract; 40 days to analyze) and soil (14 daysto extract; 40 days to analyze) were met. A fewerrors were found in a small portion of the data(~4%). Those data were corrected for transcription
and calculation errors that were identified during thevalidation. One data point, a replicate Iowa soilsample, was identified as suspect. The result for thissample was 0.8 mg/kg; the results from the otherthree replicates averaged 27,400 mg/kg. Inclusion orexclusion of this data point in the evaluation ofcomparability with the field technology (reported inSection 5) did not significantly change the r value, soit was included in the analysis. The referencelaboratory results for QC samples were
Table 3. Summary of the Reference Laboratory Performance for Soil Samples
Statistic
Accuracy (% recovery)
Precisiona (% RSD)
RDXN = 20
TNTN = 20
DNTb
NR = 3cHMX
NR = 13RDX
NR = 13TNT
NR = 18
Mean 102 100 56 29 25 29
Median 99 96 32 30 21 25
Range 84–141 76–174 14–123 12–63 4–63 2–72
aCalculated from those samples where all four replicates were reported as a detect.bDNT represents total concentration of 2,4-DNT and 2,6-DNT.cNR represents the number of replicate sets; N represents the number of individual samples
Table 4. Summary of the Reference Laboratory Performance for Water Samples
Statistic
Accuracy (% recovery)
Precision a
(% RSD)
RDXN = 20
TNTN = 20
DNT b
NR = 7cHMX
NR = 20RDX
NR = 29TNT
NR = 28
Mean 91 91 30 20 22 24
Median 87 91 30 17 17 20
Range 65–160 66–136 8–80 6–49 5–66 5–86
aCalculated from those samples where all four replicates were reported as a detect.bDNT represents total concentration of 2,4-DNT and 2,6-DNT.cNR represents the number of replicate sets; N represents the number of individual samples
12
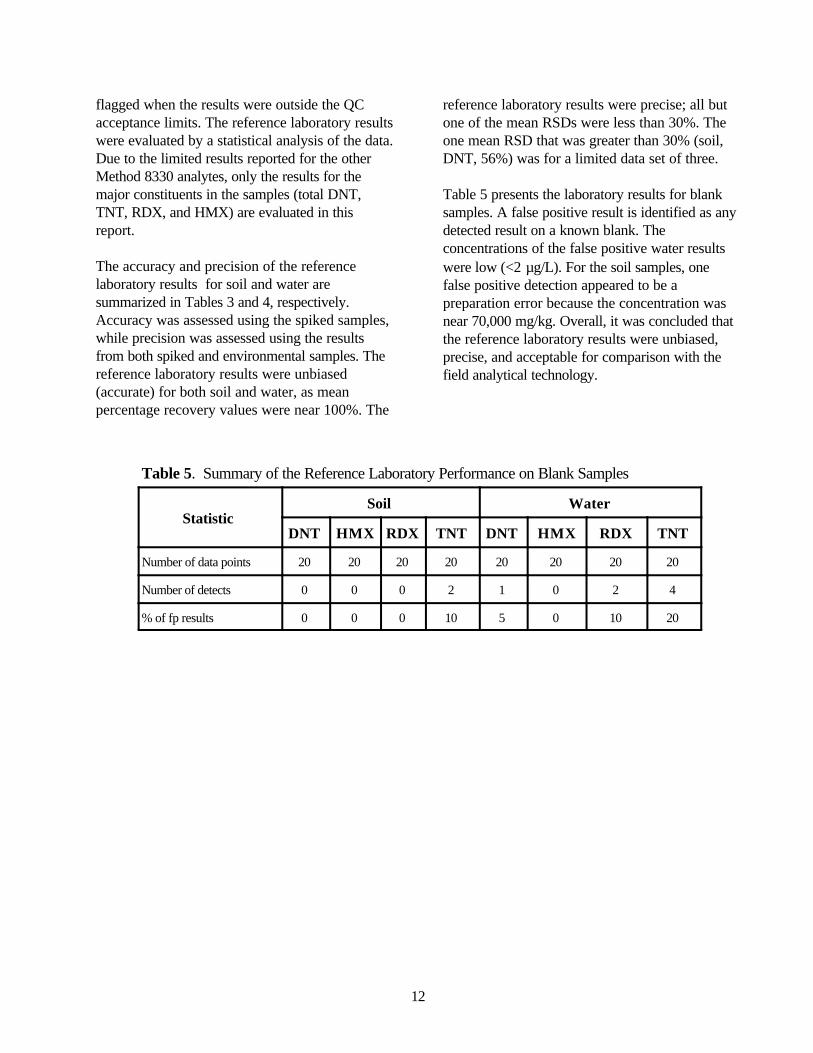
flagged when the results were outside the QCacceptance limits. The reference laboratory resultswere evaluated by a statistical analysis of the data.Due to the limited results reported for the otherMethod 8330 analytes, only the results for themajor constituents in the samples (total DNT,TNT, RDX, and HMX) are evaluated in thisreport.
The accuracy and precision of the referencelaboratory results for soil and water aresummarized in Tables 3 and 4, respectively.Accuracy was assessed using the spiked samples,while precision was assessed using the resultsfrom both spiked and environmental samples. Thereference laboratory results were unbiased(accurate) for both soil and water, as meanpercentage recovery values were near 100%. The
reference laboratory results were precise; all butone of the mean RSDs were less than 30%. Theone mean RSD that was greater than 30% (soil,DNT, 56%) was for a limited data set of three.
Table 5 presents the laboratory results for blanksamples. A false positive result is identified as anydetected result on a known blank. Theconcentrations of the false positive water resultswere low (<2 µg/L). For the soil samples, onefalse positive detection appeared to be apreparation error because the concentration wasnear 70,000 mg/kg. Overall, it was concluded thatthe reference laboratory results were unbiased,precise, and acceptable for comparison with thefield analytical technology.
Table 5. Summary of the Reference Laboratory Performance on Blank Samples
StatisticSoil Water
DNT HMX RDX TNT DNT HMX RDX TNT
Number of data points 20 20 20 20 20 20 20 20
Number of detects 0 0 0 2 1 0 2 4
% of fp results 0 0 0 10 5 0 10 20
13
Section 5 — Technology Evaluation
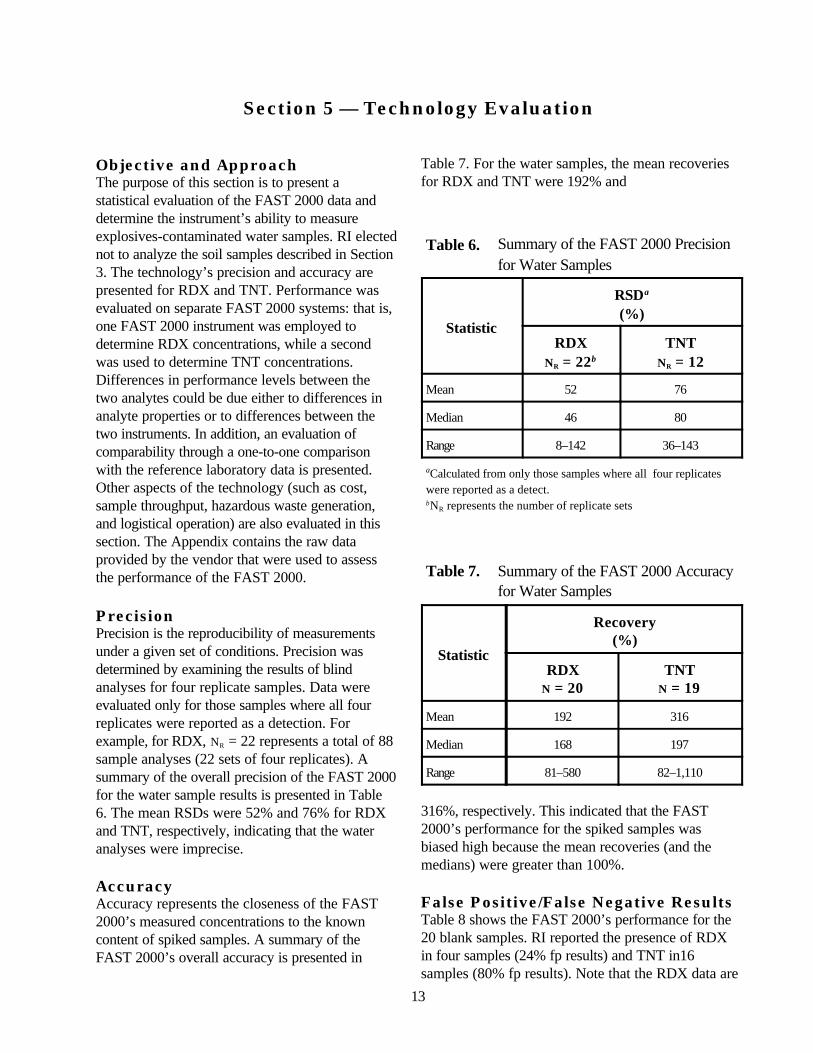
Objective and ApproachThe purpose of this section is to present astatistical evaluation of the FAST 2000 data anddetermine the instrument’s ability to measureexplosives-contaminated water samples. RI electednot to analyze the soil samples described in Section3. The technology’s precision and accuracy arepresented for RDX and TNT. Performance wasevaluated on separate FAST 2000 systems: that is,one FAST 2000 instrument was employed todetermine RDX concentrations, while a secondwas used to determine TNT concentrations.Differences in performance levels between thetwo analytes could be due either to differences inanalyte properties or to differences between thetwo instruments. In addition, an evaluation ofcomparability through a one-to-one comparisonwith the reference laboratory data is presented.Other aspects of the technology (such as cost,sample throughput, hazardous waste generation,and logistical operation) are also evaluated in thissection. The Appendix contains the raw dataprovided by the vendor that were used to assessthe performance of the FAST 2000.
PrecisionPrecision is the reproducibility of measurementsunder a given set of conditions. Precision wasdetermined by examining the results of blindanalyses for four replicate samples. Data wereevaluated only for those samples where all fourreplicates were reported as a detection. Forexample, for RDX, NR = 22 represents a total of 88sample analyses (22 sets of four replicates). Asummary of the overall precision of the FAST 2000for the water sample results is presented in Table6. The mean RSDs were 52% and 76% for RDXand TNT, respectively, indicating that the wateranalyses were imprecise.
Accuracy Accuracy represents the closeness of the FAST2000’s measured concentrations to the knowncontent of spiked samples. A summary of theFAST 2000’s overall accuracy is presented in
Table 7. For the water samples, the mean recoveriesfor RDX and TNT were 192% and
Table 6. Summary of the FAST 2000 Precisionfor Water Samples
Statistic
RSDa
(%)
RDXNR = 22b
TNTNR = 12
Mean 52 76
Median 46 80
Range 8–142 36–143
aCalculated from only those samples where all four replicateswere reported as a detect.bNR represents the number of replicate sets
Table 7. Summary of the FAST 2000 Accuracyfor Water Samples
Statistic
Recovery(%)
RDXN = 20
TNTN = 19
Mean 192 316
Median 168 197
Range 81–580 82–1,110
316%, respectively. This indicated that the FAST2000’s performance for the spiked samples wasbiased high because the mean recoveries (and themedians) were greater than 100%.
False Positive/False Negative ResultsTable 8 shows the FAST 2000’s performance for the20 blank samples. RI reported the presence of RDXin four samples (24% fp results) and TNT in16samples (80% fp results). Note that the RDX data are
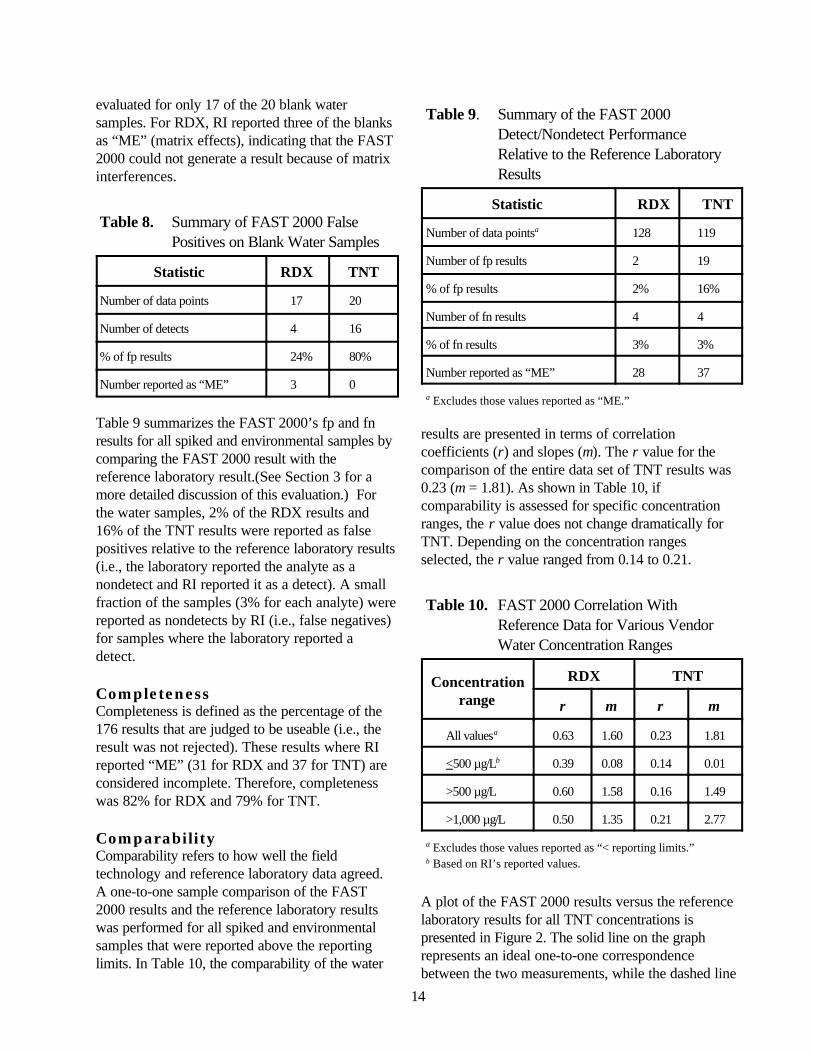
14
evaluated for only 17 of the 20 blank watersamples. For RDX, RI reported three of the blanksas “ME” (matrix effects), indicating that the FAST2000 could not generate a result because of matrixinterferences.
Table 8. Summary of FAST 2000 FalsePositives on Blank Water Samples
Statistic RDX TNT
Number of data points 17 20
Number of detects 4 16
% of fp results 24% 80%
Number reported as “ME” 3 0
Table 9 summarizes the FAST 2000’s fp and fnresults for all spiked and environmental samples bycomparing the FAST 2000 result with thereference laboratory result.(See Section 3 for amore detailed discussion of this evaluation.) Forthe water samples, 2% of the RDX results and16% of the TNT results were reported as falsepositives relative to the reference laboratory results(i.e., the laboratory reported the analyte as anondetect and RI reported it as a detect). A smallfraction of the samples (3% for each analyte) werereported as nondetects by RI (i.e., false negatives)for samples where the laboratory reported adetect.
CompletenessCompleteness is defined as the percentage of the176 results that are judged to be useable (i.e., theresult was not rejected). These results where RIreported “ME” (31 for RDX and 37 for TNT) areconsidered incomplete. Therefore, completenesswas 82% for RDX and 79% for TNT.
ComparabilityComparability refers to how well the fieldtechnology and reference laboratory data agreed.A one-to-one sample comparison of the FAST2000 results and the reference laboratory resultswas performed for all spiked and environmentalsamples that were reported above the reportinglimits. In Table 10, the comparability of the water
Table 9. Summary of the FAST 2000Detect/Nondetect PerformanceRelative to the Reference LaboratoryResults
Statistic RDX TNT
Number of data pointsa 128 119
Number of fp results 2 19
% of fp results 2% 16%
Number of fn results 4 4
% of fn results 3% 3%
Number reported as “ME” 28 37
a Excludes those values reported as “ME.”
results are presented in terms of correlationcoefficients (r) and slopes (m). The r value for thecomparison of the entire data set of TNT results was0.23 (m = 1.81). As shown in Table 10, ifcomparability is assessed for specific concentrationranges, the r value does not change dramatically forTNT. Depending on the concentration rangesselected, the r value ranged from 0.14 to 0.21.
Table 10. FAST 2000 Correlation WithReference Data for Various VendorWater Concentration Ranges
Concentrationrange
RDX TNT
r m r m
All valuesa 0.63 1.60 0.23 1.81
<500 µg/Lb 0.39 0.08 0.14 0.01
>500 µg/L 0.60 1.58 0.16 1.49
>1,000 µg/L 0.50 1.35 0.21 2.77
a Excludes those values reported as “< reporting limits.”b Based on RI’s reported values.
A plot of the FAST 2000 results versus the referencelaboratory results for all TNT concentrations ispresented in Figure 2. The solid line on the graphrepresents an ideal one-to-one correspondencebetween the two measurements, while the dashed line

15
r = 0.23
0
5,000
10,000
15,000
20,000
25,000
30,000
35,000
40,000
0 1,000 2,000 3,000 4,000 5,000 6,000 7,000 8,000 9,000
Reference Laboratory TNT Water Results (µg/L)
FAST
200
0 TN
T W
ater
Res
ults
( µg/L
)LAAAP
MLAAP
Spike
Umatilla
Volunteer
one-to-one correspondence
linear regression line
Figure 2. Comparability of reference laboratory water results with FAST 2000 results for all TNT concentrations. Theslope of the linear regression line is 1.81 and the intercept is 2,135 µg/L. For clarity, one outlying MLAAP datapoint that is included in the regression analysis was excluded from the graph.
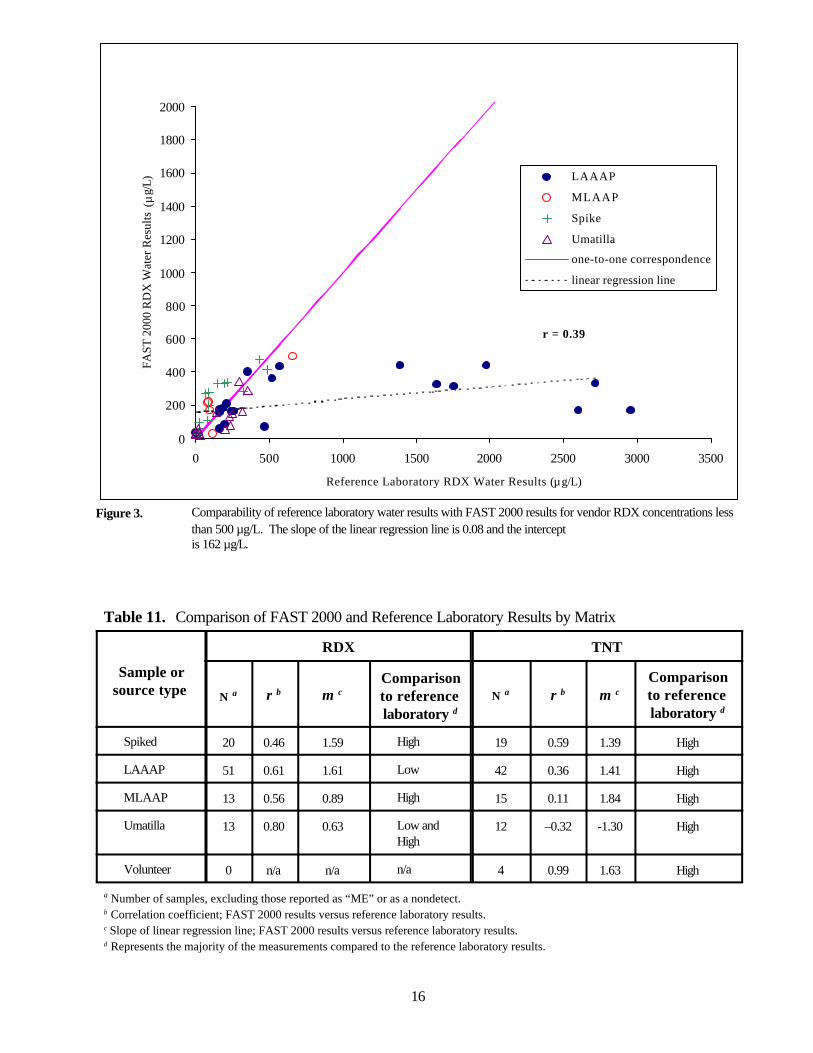
is the linear regression line. Overall, the FAST2000’s TNT results were generally higher thanthose of the reference laboratory, as indicated bythe fact that the majority of the data points areabove the solid line. For RDX, the correlation ofthe FAST 2000 results with the referencelaboratory results was higher than for TNT, with acalculated r value of 0.63 and m of 1.60. Figure 3,a plot of the RDX comparability data forconcentrations less than 500 µg/L, shows aninteresting trend that further elaborates on theaccuracy data previously presented. While theaccuracy results were biased high for RDX spikedinto distilled water, Figure 3 indicates that severalof the FAST 2000 data were lower than thereference laboratory data. Further investigation ofthese data showed that the majority of the RDXresults on the LAAAP samples were lower thanthe reference laboratory’s matching results. TheFAST 2000 results were generally higher for thespiked and MLAAP samples, and evenly
distributed higher and lower than the referencelaboratory results for the Umatilla samples. Thisevaluation, summarized in Table 11, suggests a matrix-dependent effect. It should be noted, however, thatthe largest number of samples were analyzed fromLAAAP; it is not known whether a similar trendwould be observed with the samples from the othersites had more samples been analyzed. The evaluationof the TNT sample data by matrix concurred with theconclusion presented in theaccuracy section, that the TNT results were generallybiased high.
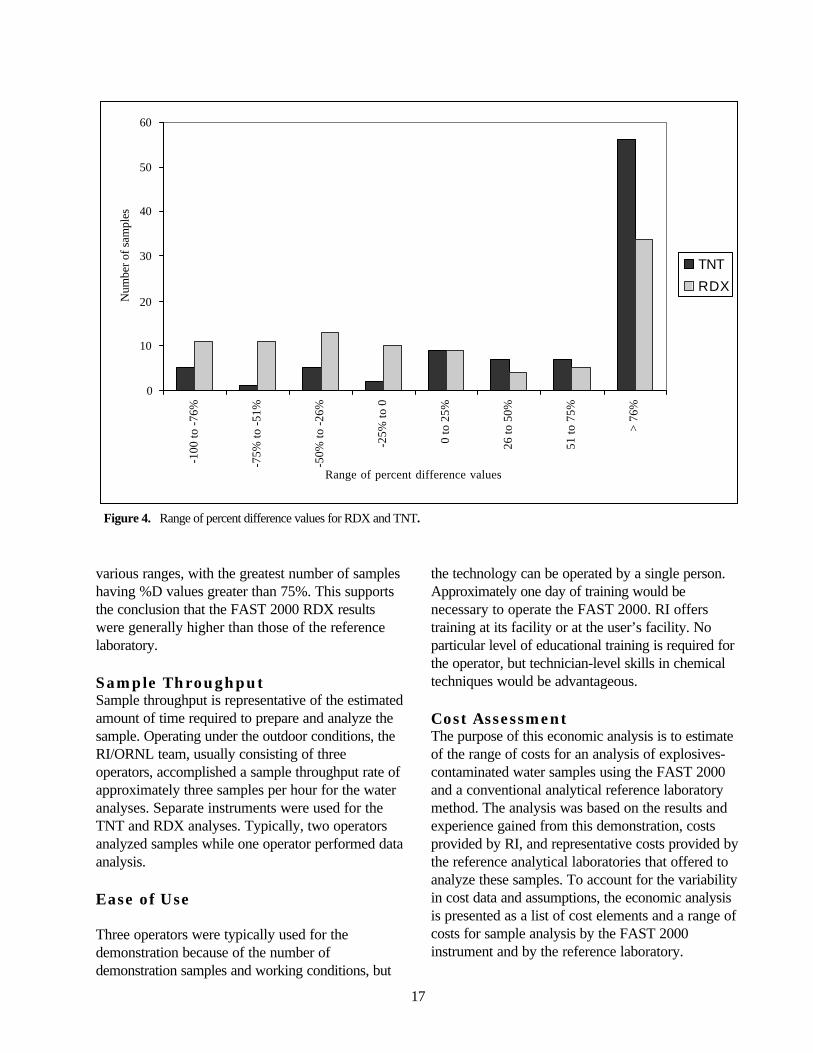
Another metric of comparability is the percentdifference (%D) between the reference laboratoryand the FAST 2000 results. The ranges of %D valuesfor TNT and RDX are presented in Figure 4.Acceptable %D values would be between –25% and25%, or near the middle of the x-axis of the plot. ForTNT, the %D values were mostly greater than 75%.For RDX, the %D values were distributed among the
16
r = 0.39
0
200
400
600
800
1000
1200
1400
1600
1800
2000
0 500 1000 1500 2000 2500 3000 3500
Reference Laboratory RDX Water Results (µg/L)
FAST
200
0 R
DX
Wat
er R
esul
ts(µ
g/L) LAAAP
MLAAP
Spike
Umatilla
one-to-one correspondence
linear regression line
Figure 3. Comparability of reference laboratory water results with FAST 2000 results for vendor RDX concentrations lessthan 500 µg/L. The slope of the linear regression line is 0.08 and the intercept is 162 µg/L.
Table 11. Comparison of FAST 2000 and Reference Laboratory Results by Matrix
Sample orsource type
RDX TNT
N a r b m cComparisonto referencelaboratory d
N a r b m cComparisonto referencelaboratory d
Spiked 20 0.46 1.59 High 19 0.59 1.39 High
LAAAP 51 0.61 1.61 Low 42 0.36 1.41 High
MLAAP 13 0.56 0.89 High 15 0.11 1.84 High
Umatilla 13 0.80 0.63 Low and High
12 –0.32 -1.30 High
Volunteer 0 n/a n/a n/a 4 0.99 1.63 High
a Number of samples, excluding those reported as “ME” or as a nondetect.b Correlation coefficient; FAST 2000 results versus reference laboratory results.c Slope of linear regression line; FAST 2000 results versus reference laboratory results.d Represents the majority of the measurements compared to the reference laboratory results.
17
0
10
20
30
40
50
60
-100
to -7
6%
-75%
to -5
1%
-50%
to -2
6%
-25%
to 0
0 to
25%
26 to
50%
51 to
75%
> 76
%
Range of percent difference values
Num
ber o
f sam
ples
TNT
RDX
Figure 4. Range of percent difference values for RDX and TNT.
various ranges, with the greatest number of sampleshaving %D values greater than 75%. This supportsthe conclusion that the FAST 2000 RDX resultswere generally higher than those of the referencelaboratory.
Sample ThroughputSample throughput is representative of the estimatedamount of time required to prepare and analyze thesample. Operating under the outdoor conditions, theRI/ORNL team, usually consisting of threeoperators, accomplished a sample throughput rate ofapproximately three samples per hour for the wateranalyses. Separate instruments were used for theTNT and RDX analyses. Typically, two operatorsanalyzed samples while one operator performed dataanalysis.
Ease of Use
Three operators were typically used for thedemonstration because of the number ofdemonstration samples and working conditions, but
the technology can be operated by a single person.Approximately one day of training would benecessary to operate the FAST 2000. RI offerstraining at its facility or at the user’s facility. Noparticular level of educational training is required forthe operator, but technician-level skills in chemicaltechniques would be advantageous.
Cost AssessmentThe purpose of this economic analysis is to estimateof the range of costs for an analysis of explosives-contaminated water samples using the FAST 2000and a conventional analytical reference laboratorymethod. The analysis was based on the results andexperience gained from this demonstration, costsprovided by RI, and representative costs provided bythe reference analytical laboratories that offered toanalyze these samples. To account for the variabilityin cost data and assumptions, the economic analysisis presented as a list of cost elements and a range ofcosts for sample analysis by the FAST 2000instrument and by the reference laboratory.

18
Several factors affected the cost of analysis. Wherepossible, these factors were addressed so thatdecision makers can complete a site-specificeconomic analysis to suit their needs. The followingcategories are considered in the estimate:
• sample shipment costs, • labor costs,• equipment costs, and• waste disposal costs.
Each of these cost factors is defined and discussedand serves as the basis for the estimated cost rangespresented in Table 12. This analysis assumed thatthe individuals performing the analyses were fullytrained to operate the technology. Costs for sampleacquisition and pre-analytical sample preparation,which are tasks common to both methods, were notincluded here.
FAST 2000 CostsThe costs associated with using the FAST 2000included labor, equipment, and waste disposal costs.No sample shipment charges were associated withthe cost of operating the FAST 2000 instrumentbecause the samples were analyzed on-site.
Labor Labor costs included mobilization/demobilization,travel, per diem expenses and on-site labor.
• Mobilization/demobilization. This cost elementincluded the time for one person to prepare forand travel to each site. This estimate rangedfrom 5 to 8 h, at a rate of $50/h.
• Travel. This element was the cost for theanalyst(s) to travel to the site. If the analyst islocated near the site, the cost of commuting tothe site (estimated to be 50 miles at $0.30/mile)would be minimal ($15). The estimated cost ofan analyst traveling to the site for thisdemonstration ($1000) included the cost ofairline travel and rental car fees.
• Per diem expenses. This cost element includedfood, lodging, and incidental expenses. Theestimate ranged from zero (for a local site) to$150/day for each analyst.
• Rate. The cost of the on-site labor wasestimated at a rate of $30–75/h, depending on
the required expertise level of the analyst. Thiscost element included the labor involved with theentire analytical process, comprising samplepreparation, sample management, analysis, andreporting.
Equipment Equipment costs included mobilization/demobilization, rental fees or purchase of equipment,and the reagents and other consumable suppliesnecessary to complete the analysis.
• Mobilization/demobilization. This included thecost of shipping the equipment to the test site. Ifthe site is local, the cost would be zero. For thisdemonstration, the cost of shipping equipmentand supplies was estimated at $460.
• Instrument purchase. At the time of thedemonstration, the cost of purchasing the FAST2000 was $23,650. The instrument purchaseincluded a FAST 2000 instrument designed foruse with an immunoassay-based sensor; a dataacquisition card and a cable linking theinstrument to the laptop computer; a fluidstorage unit; one assay coupon kit; the softwarerequired to run the instrument and analyze data;and instruction manual. This price does notinclude the cost of the laptop computer. Theinstrument can be leased for $1970 per month.
• Reagents/supplies. These items are consumableand are purchased on a per sample basis. At thetime of the demonstration, the cost of thereagents and supplies needed to prepare andanalyze water samples using the FAST 2000was $43 per sample. This cost included thesample preparation supplies, assay supplies, andconsumable reagents. An ampule of standardwas also available for approximately $22.
Waste DisposalWaste disposal costs are based on the 1999regulations for disposal of explosives-contaminatedwaste. The analyses performed using the FAST2000 instrument generated approximately 18 L ofaqueous waste. ORNL’s cost to dispose of theexplosives-contaminated aqueous waste at acommercial facility was estimated at $165 per 55-galdrum (the size that was used to contain this amount
19
of aqueous waste). There are mostly likely additionalcosts for labor associated with the waste disposal,but those costs are not estimated here.
Reference Laboratory CostsSample ShipmentSample shipment costs to the reference laboratoryincluded the overnight shipping charges, as well aslabor charges associated with the variousorganizations involved in the shipping process.
• Labor. This cost element included all of thetasks associated with the shipment of thesamples to the reference laboratory. Tasksincluded packing the shipping coolers, completingthe chain-of-custody documentation, andcompleting the shipping forms. The estimate tocomplete this task ranged from 2 to 4 h at $50per hour.
• Overnight shipping. The overnight expressshipping service cost was estimated to be $50for one 50-lb cooler of samples.
Labor, Equipment, and Waste DisposalThe labor bids from commercial analytical referencelaboratories that offered to perform the referenceanalysis for this demonstration ranged from $150 to$188 per sample. The bid was dependent on manyfactors, including the perceived difficulty of thesample matrix, the current workload of thelaboratory, and the competitiveness of the market.This rate was a fully loaded analytical cost thatincluded equipment, labor, waste disposal, and reportpreparation.
Cost Assessment SummaryAn overall cost estimate for use of the FAST 2000instrument versus use of the reference laboratorywas not made because of the extent of variation inthe different cost factors, as outlined in Table 12.The overall costs for the application of eachtechnology will be based on the number of samplesrequiring analysis, the sample type, and the sitelocation and characteristics. Decision-making
factors, such as turnaround time for results, mustalso be weighed against the cost estimate todetermine the value of the field technology’sproviding immediate answers versus the referencelaboratory’s provision of reporting data within 30days of receipt of samples.
Miscellaneous FactorsThe following are general observations regarding thefield operation and performance of the FAST 2000instrument:
• The system, which weighed approximately 3 lb,was easily transportable.
• The RI/NRL team completely disassembledtheir work station at the close of each day. Ittook the team less than an hour each morning toprepare for sample analyses.
• The FAST 2000 was interfaced to the notebookcomputer through a PCMCIA card, throughwhich both data and power connections weremade. RI claimed that the instrument could runexclusively off of the computer’s battery power.During the demonstration, the team found thatthe instrument worked best when the batterywas removed and the computer was pluggedinto an electrical outlet.
• Sample preparation was minimal.• Each sample was analyzed in duplicate, with the
average concentration reported as the result. Atleast two calibration standards were analyzedwith each sample.
• To analyze the 176 water samples, the RI/NRLteam used 33 TNT-labeled membranes and 18RDX-labeled membranes, averaging 5 samplesper membrane for TNT and 10 samples permembrane for RDX.
• Data processing was performed using an NRL-written software program rather than with thedata acquisition software package supplied withthe instrument. The results were dependent onthe user’s designation of the start and the end ofthe analyte peak.
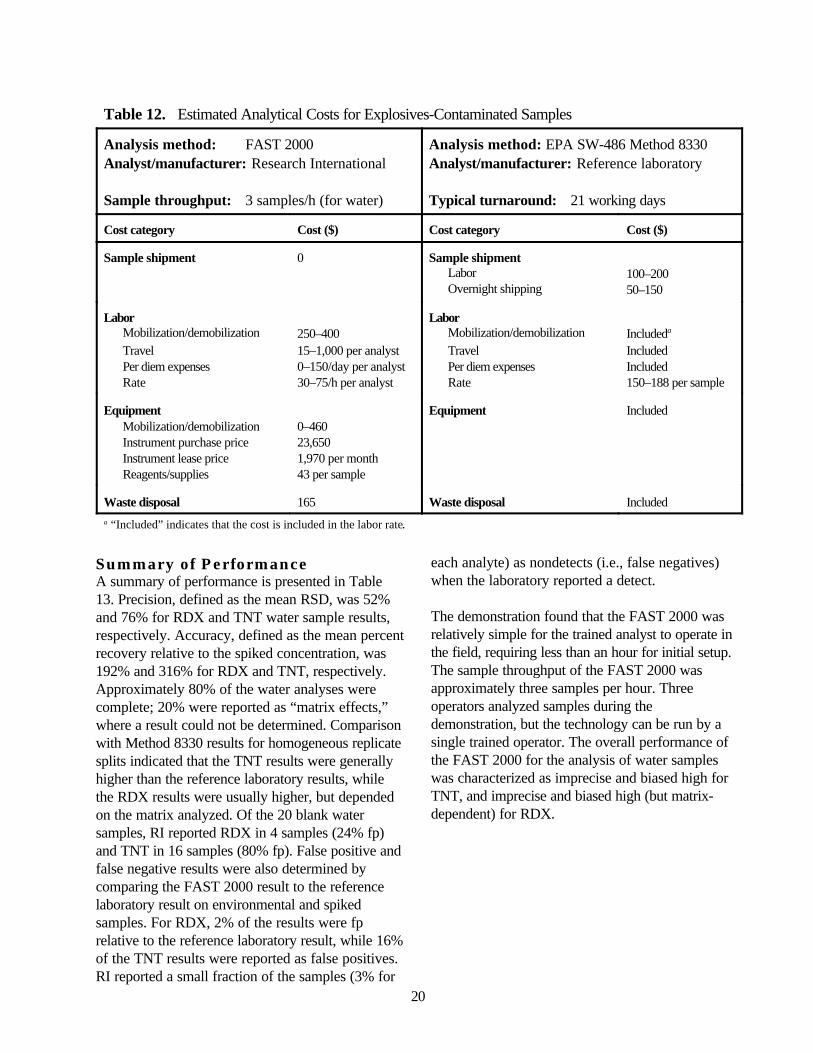
20
Table 12. Estimated Analytical Costs for Explosives-Contaminated Samples
Analysis method: FAST 2000Analyst/manufacturer: Research International
Sample throughput: 3 samples/h (for water)
Analysis method: EPA SW-486 Method 8330Analyst/manufacturer: Reference laboratory
Typical turnaround: 21 working days
Cost category Cost ($) Cost category Cost ($)
Sample shipment 0 Sample shipmentLaborOvernight shipping
100–20050–150
LaborMobilization/demobilizationTravelPer diem expensesRate
250–40015–1,000 per analyst0–150/day per analyst30–75/h per analyst
LaborMobilization/demobilizationTravelPer diem expensesRate
Includeda
IncludedIncluded150–188 per sample
EquipmentMobilization/demobilizationInstrument purchase priceInstrument lease priceReagents/supplies
0–46023,6501,970 per month43 per sample
Equipment Included
Waste disposal 165 Waste disposal Includeda “Included” indicates that the cost is included in the labor rate.
Summary of PerformanceA summary of performance is presented in Table13. Precision, defined as the mean RSD, was 52%and 76% for RDX and TNT water sample results,respectively. Accuracy, defined as the mean percentrecovery relative to the spiked concentration, was192% and 316% for RDX and TNT, respectively.Approximately 80% of the water analyses werecomplete; 20% were reported as “matrix effects,”where a result could not be determined. Comparisonwith Method 8330 results for homogeneous replicatesplits indicated that the TNT results were generallyhigher than the reference laboratory results, whilethe RDX results were usually higher, but dependedon the matrix analyzed. Of the 20 blank watersamples, RI reported RDX in 4 samples (24% fp)and TNT in 16 samples (80% fp). False positive andfalse negative results were also determined bycomparing the FAST 2000 result to the referencelaboratory result on environmental and spikedsamples. For RDX, 2% of the results were fprelative to the reference laboratory result, while 16%of the TNT results were reported as false positives.RI reported a small fraction of the samples (3% for
each analyte) as nondetects (i.e., false negatives)when the laboratory reported a detect.
The demonstration found that the FAST 2000 wasrelatively simple for the trained analyst to operate inthe field, requiring less than an hour for initial setup.The sample throughput of the FAST 2000 wasapproximately three samples per hour. Threeoperators analyzed samples during thedemonstration, but the technology can be run by asingle trained operator. The overall performance ofthe FAST 2000 for the analysis of water sampleswas characterized as imprecise and biased high forTNT, and imprecise and biased high (but matrix-dependent) for RDX.
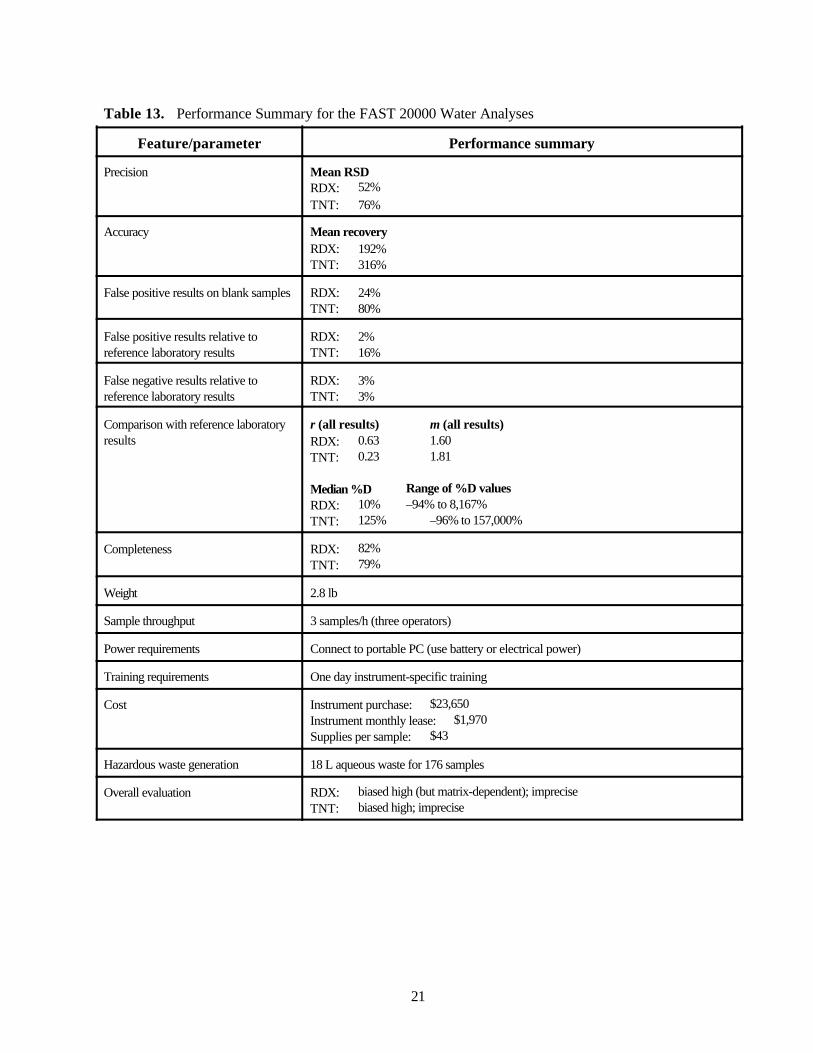
21
Table 13. Performance Summary for the FAST 20000 Water Analyses
Feature/parameter Performance summary
Precision Mean RSDRDX: 52%TNT: 76%
Accuracy Mean recoveryRDX: 192%TNT: 316%
False positive results on blank samples RDX: 24%TNT: 80%
False positive results relative toreference laboratory results
RDX: 2%TNT: 16%
False negative results relative toreference laboratory results
RDX: 3%TNT: 3%
Comparison with reference laboratoryresults
r (all results) m (all results)RDX: 0.63 1.60TNT: 0.23 1.81
Median %D Range of %D valuesRDX: 10% –94% to 8,167%TNT: 125% –96% to 157,000%
Completeness RDX: 82%TNT: 79%
Weight 2.8 lb
Sample throughput 3 samples/h (three operators)
Power requirements Connect to portable PC (use battery or electrical power)
Training requirements One day instrument-specific training
Cost Instrument purchase: $23,650Instrument monthly lease: $1,970Supplies per sample: $43
Hazardous waste generation 18 L aqueous waste for 176 samples
Overall evaluation RDX: biased high (but matrix-dependent); impreciseTNT: biased high; imprecise

22
Figure 5. The FAST 6000.
Section 6 — Technology Update andRepresentative Applications
In this section, the vendor (with minimal editorial changes by ORNL) provides information regardingnew developments with its technology since the verification activities. In addition, the vendor providesa list of representative applications in which its technology has been used.
Technology UpdateAs an outcome of the EPA trials, a decision hasbeen made to improve the software algorithms usedto quantify the assay data. After the trials it wasdiscovered that approximately 10% of the errors inthe FAST data were due to user error in analyzingthe data. This was purportedly due to operatorfatigue, after running assays for 10 hours a day overthe period of several days. To avoid this problem inthe future, the FAST software will be modified sothat the assay quantification process is automated,eliminating the possibility of user error inpostprocessing of the data.
In addition to the software improvements mentionedabove, the Flow Assay Sensing and Testing system(FAST 2000) has now been replaced with a second-generation instrument, the FAST 6000 (shown inFigure 5). Research International has developed theFAST 6000 under contract to the U.S. NavalResearch Laboratory (NRL). Unlike the FAST2000, which requires connection to a laptopcomputer to run, the FAST 6000 is capable of stand-alone operation, running on a rechargeable lithium-ion battery pack. The instrument can be purchasedin either a single-channel or a six-channelconfiguration. The form factor for a single-channel
coupon is the same as that of a six-channel coupon,allowing single-channel FAST 6000 systems to beupgraded to six-channel systems at a later time if theuser so desires. The six-channel instrument willsignificantly improve sample throughput and reducethe time needed for analysis of multiple analytes.
The FAST 6000 has a built-in 386 computer and 4 × 16 character LCD display. A computer-controlled pump and valves completely automate theassay process for the user. Assay results aredisplayed on the LCD display, and the assay data issaved in an internal 2-MB FLASH disk. Assay datafiles taken into the field can be downloaded to adesktop computer at a later time via an RS-232 link.An advanced Windows-based software program hasbeen developed to allow the user to transfer assaydata and recipe files between an IBM-compatiblepersonal computer and the FAST 6000. Files can besaved to the computer hard disk for later viewingand analysis. After a recipe is optimized, it can betransferred to the FAST 6000 for use in the field.This is useful for new assay development, in whichtiming and flow rates are being optimized bymodifying easy to use assay recipes.
The software provides a real-time display of the datafrom the FAST 6000 in both a table format and agraphical format. The Windows-based softwareprogram also allows the user to run the FAST 6000from a remote computer. With the addition of anoptional RF data link, the FAST 6000 system can berun from a remote computer up to 20 miles awayfrom the FAST 6000. This technology also makes itpossible to create an array of systems that areoperated and monitored by a single centralcomputer.
The FAST 6000 has been improved considerablythrough the addition of a positive displacement pumpand redesigned electronics with higher signal-to-

23
noise ratios. The ability to simultaneously runmultiple assays for different analytes on a singlesystem also represents a significant improvement.Research International continues to develop andimprove the FAST technology. Work is under wayon a six-channel version of the FAST that will beused to detect explosives underwater. This system isbeing designed to automatically sample salt water atdepths up to 300 feet and run assays for TNT andRDX.
Representative Applications1995: Prototypes of the laboratory version of thecontinuous flow immunosensor participated in fielddemonstrations with funding from the StrategicEnvironmental Research and Development Program(SERDP). It was tested at Umatilla Army Depot inHermiston, Oregon, and SUBASE Bangor inBangor, Washington, in collaboration with U.S. EPARegion 10. Results for the continuous flowimmunosensor can be found in several refereedpapers (see below). EPA coordinator Harry Craigand associates have written a report of the fieldtrials and has a proceedings paper describing bothsensors.
1997: At the National Environmental TechnologyTest Site (NETTS) at the Volunteer ArmyAmmunition Plant in Chattanooga, Tennessee, anon-site demonstration of FAST 2000 was conductedSeptember 23–27. Groundwater was tested for TNTin samples from 10 monitoring wells during a 4-daytrial. The demonstration was conducted as part of aSERDP research program. Also, Harry Craig, EPARegion 10, purchased two FAST 2000 units formonitoring at SUBASE Bangor and Umatilla ArmyDepot.
1997–1998: Three field trials for groundwateranalysis and one for soil were performed using theFAST 2000 to perform on-site analysis for validationstudies. The first groundwater test for this projectwas conducted June 23–27, 1997 at
SUBASE Bangor, Bangor, Washington The secondsite was Umatilla Army Depot in Hermiston,Oregon, where the second field trial took placeAugust 4–8, 1997. The third field trial site was theNaval Surface Weapons Center in Crane, Indiana,
where groundwater tests were performedSeptember 8–12, 1997. The soil field trial was heldApril 27– May 1, 1998 at Manchester, Washington,on samples from Umatilla Army Depot. Harry Craig,EPA Region 10, coordinated the sites and samplecollection and provided non-developer operators forthese trials.
Refereed PapersBart, J. C., L. L. Jidd, K. E. Hoffman, A. M.Wilkins, P. T. Charles, and A. W. Kusterbeck. 1997.“Application of a Portable Immunosensor to DetectExplosives TNT and RDX in GroundwaterSamples.” Environmental Science andTechnology 31(5): 1505–11.
Bart, J. C., L. L. Jidd, and A. W. Kusterbeck. 1997.“Environmental Immunosensors for the ExplosiveRDX using a Fluorescent-Dye-Labeled Antigen andthe Continuous Flow Immunosensor.” Sensors andActuators B 38–39, 411–18.
Craig, H., G. Furguson, A. Markos, A. Kusterbeck,L. Shriver-Lake, T. Jenkins, and P. Thorne. 1996.“Field Demonstration of On-Site Analytical Methodsfor TNT and RDX in Groundwater.” Pp. 204–19 inProceedings of the Great Plains–RockyMountain Hazardous Substance Research Center(HSRC)/ Waste Education and ResearchConsortium (WERC) Joint Conference on theEnvironment, May 21–23, Albuquerque, N.M.
Kusterbeck, A. W., P. R. Gauger, and P. T.Charles. 1997. “Portable Flow Immunosensor forDetecting Drugs and Explosives.” SPIE2937:191–96.
24
Section 7 — References
Berger, W., H. McCarty, and R-K. Smith. 1996. Environmental Laboratory Data Evaluation. GeniumPublishing Corp., Schenectady, N.Y.
Draper, N. R., and H. Smith. 1981. Applied Regression Analysis. 2nd ed. John Wiley & Sons, New York.
EPA (U.S. Environmental Protection Agency). 1994. “Method 8330: Nitroaromatics and Nitramines by HighPerformance Liquid Chromatography (HPLC).” In Test Methods for Evaluating Solid Waste: Physical/Chemical Methods, Update II. SW-846. U.S. Environmental Protection Agency, Washington, D.C.,September.
EPA (U.S. Environmental Protection Agency). 1998. EPA Guidance for Quality Assurance Project Plans.EPA QA/G-5, EPA 600/R-98/018. U.S. Environmental Protection Agency, Washington, D.C., February.
Jenkins, T. F., M. E. Walsh, and P. G. Thorne. 1998. “Site Characterization for Explosives Contamination at aMilitary Firing Range Impact Area.” Special Report 98-9. U.S. Army Cold Regions Research andEngineering Laboratory, Hanover, N.H. Available at http://www.crrel.usace.army.mil/
Maskarinec, M. P., C. K. Bayne, L. H. Johnson, S. K. Holladay, R. A. Jenkins, and B. A. Tomkins. 1991.Stability of Explosives in Environmental Water and Soil Samples. ORNL/TM-11770. Oak Ridge NationalLaboratory, Oak Ridge, Tenn., January.
ORNL (Oak Ridge National Laboratory). 1999. “Technology Demonstration Plan: Evaluation of ExplosivesField Analytical Techniques.” Oak Ridge National Laboratory, Oak Ridge, Tenn., August.
Specialized Assays, Inc. 1999. “Comprehensive Quality Assurance Plan.” SAL-QC-Rec 5.0. January 6.

25
Appendix
RI’s FAST 2000 Sample Results Compared with ReferenceLaboratory Results
Sample siteor type
Sample no.
Samplereplicate
RDX a
(µµg/L)TNT a
(µµg/L)RI
analysisorder bRI Ref Lab RI Ref Lab
Blank 6 1 <20.0 1.5 46 1.9 2068
Blank 6 2 <20.0 <0.5 65 1.2 2069
Blank 6 3 <20.0 <0.5 <20.0 <0.5 2005
Blank 6 4 <20.0 <0.5 226 <0.5 2112
Blank 7 1 <20.0 <0.5 97 <0.5 2142
Blank 7 2 ME c <0.5 124 0.9 2065
Blank 7 3 22 <0.5 160 <0.5 2038
Blank 7 4 <20.0 <0.5 <20.0 <0.5 2012
Blank 8 1 81 <0.5 116 <0.5 2045
Blank 8 2 131 <0.5 172 <0.5 2044
Blank 8 3 ME 0.5 196 <0.5 2027
Blank 8 4 60 <0.5 194 1.3 2050
Blank 9 1 <20.0 <0.5 <20.0 <0.5 2025
Blank 9 2 <20.0 <0.5 120 <0.5 2078Blank 9 3 <20.0 <0.5 112 <0.5 2165
Blank 9 4 <20.0 <0.5 112 <0.5 2146
Blank 10 1 <20.0 <0.5 48 <0.5 2176
Blank 10 2 ME <0.5 81 <0.5 2034
Blank 10 3 <20.0 <0.5 <20.0 <0.5 2042
Blank 10 4 <20.0 <0.5 46 <0.5 2004
Louisiana 5 1 84 200 1280 170 2123
Louisiana 5 2 58 159 2862 136 2104
Louisiana 5 3 181 180 757 151 2049
Louisiana 5 4 153 158 311 138 2033
Louisiana 6 1 203 210 213 162 2031
Louisiana 6 2 162 238 207 176 2163
Louisiana 6 3 176 160 ME 113 2094
Louisiana 6 4 162 256 273 178 2159
Louisiana 7 1 ME <0.5 ME 0.5 2130
Louisiana 7 2 ME <0.5 59 <0.5 2026

Sample siteor type
Sample no.
Samplereplicate
RDX a
(µµg/L)TNT a
(µµg/L)RI
analysisorder bRI Ref Lab RI Ref Lab
26
Louisiana 7 3 ME <0.5 ME <0.5 2139Louisiana 7 4 20 <0.5 25 <0.5 2039
Louisiana 8 1 ME <0.5 <20.0 <0.5 2003
Louisiana 8 2 <20.0 1.1 217 0.5 2103
Louisiana 8 3 ME <0.5 ME <0.5 2010
Louisiana 8 4 ME <0.5 ME <0.5 2160
Louisiana 9 1 894 1760 1986 300 2153
Louisiana 9 2 434 1390 700 240 2052
Louisiana 9 3 1300 1410 2331 320 2157
Louisiana 9 4 323 1640 ME 330 2134
Louisiana 10 1 1099 560 ME 65 2119Louisiana 10 2 67 470 ME 40 2150
Louisiana 10 3 364 520 <20.0 30 2116
Louisiana 10 4 906 256 138 28 2035
Louisiana 11 1 <20.0 18.6 106 <0.5 2121
Louisiana 11 2 <20.0 17.2 ME <0.5 2066
Louisiana 11 3 <20.0 13 ME <0.5 2147
Louisiana 11 4 28 13.9 250 <0.5 2030
Louisiana 12 1 ME 89 ME 101 2096
Louisiana 12 2 <20.0 34 ME 59 2155
Louisiana 12 3 ME 52 184 134 2089Louisiana 12 4 <20.0 104 ME 131 2076
Louisiana 13 1 <20.0 2.5 287 1.1 2154
Louisiana 13 2 <20.0 1.8 20 <0.5 2014
Louisiana 13 3 <20.0 2 ME <0.5 2156
Louisiana 13 4 <20.0 2.3 179 <0.5 2141
Louisiana 14 1 <20.0 11.8 1396 <0.5 2082
Louisiana 14 2 <20.0 11.4 ME <0.5 2086
Louisiana 14 3 <20.0 14 367 <0.5 2120
Louisiana 14 4 26 14 ME <0.5 2067
Louisiana 15 1 ME <0.5 ME <0.5 2013Louisiana 15 2 ME <0.5 ME <0.5 2070
Louisiana 15 3 ME <0.5 ME <0.5 2124

Sample siteor type
Sample no.
Samplereplicate
RDX a
(µµg/L)TNT a
(µµg/L)RI
analysisorder bRI Ref Lab RI Ref Lab
27
Louisiana 15 4 ME <0.5 700 <0.5 2028
Louisiana 16 1 <20.0 <0.5 <20.0 <0.5 2118
Louisiana 16 2 <20.0 <0.5 1005 <0.5 2115
Louisiana 16 3 <20.0 <0.5 715 <0.5 2168
Louisiana 16 4 29 0.8 ME 0.7 2058
Louisiana 17 1 514 2160 1899 1360 2102
Louisiana 17 2 328 2720 925 1620 2006
Louisiana 17 3 170 2600 832 1580 2032
Louisiana 17 4 312 1760 ME 1240 2093
Louisiana 18 1 3367 19600 ME 6900 2151
Louisiana 18 2 31270 16700 358 5800 2040Louisiana 18 3 55700 22800 664 8400 2062
Louisiana 18 4 16097 18400 38230 6000 2114
Louisiana 19 1 73070 6100 5582 3100 2085
Louisiana 19 2 5330 3100 19114 1600 2173
Louisiana 19 3 7260 3500 11674 2400 2143
Louisiana 19 4 7684 4900 1322 2500 2110
Louisiana 20 1 430 570 3310 1720 2001
Louisiana 20 2 398 350 12960 950 2113
Louisiana 20 3 589 380 5666 990 2164
Louisiana 20 4 526 315 4864 985 2172
Louisiana 21 1 863 940 6904 440 2161
Louisiana 21 2 756 1180 8467 490 2057
Louisiana 21 3 561 1410 4860 540 2088
Louisiana 21 4 701 1130 2283 400 2075
Louisiana 22 1 3942 3780 1501 1280 2002
Louisiana 22 2 166 2960 ME 1080 2135
Louisiana 22 3 702 2780 2220 1210 2117
Louisiana 22 4 6891 2680 1739 1000 2071
Louisiana 23 1 2924 2340 59 1520 2041
Louisiana 23 2 564 1430 917 850 2009Louisiana 23 3 991 1710 221 1040 2011
Louisiana 23 4 887 1930 ME 1260 2072

Sample siteor type
Sample no.
Samplereplicate
RDX a
(µµg/L)TNT a
(µµg/L)RI
analysisorder bRI Ref Lab RI Ref Lab
28
Louisiana 24 1 583 1770 9440 1260 2097
Louisiana 24 2 672 3000 5260 2500 2162
Louisiana 24 3 730 2260 1637 1860 2109
Louisiana 24 4 434 1980 102 1810 2083
Milan 6 1 744 9 110 80 2149
Milan 6 2 756 235 292 100 2175
Milan 6 3 582 250 375 105 2023
Milan 6 4 657 170 258 60 2101
Milan 7 1 1622 670 3984 3600 2127
Milan 7 2 492 660 6936 3800 2063
Milan 7 3 826 580 3807 2960 2140Milan 7 4 549 650 ME 2650 2128
Milan 8 1 ME <50.0 3536 320 2132
Milan 8 2 55 <50.0 96893 1610 2091
Milan 8 3 24 120 20080 540 2043
Milan 8 4 ME <50.0 3770 2800 2131
Milan 9 1 ME 36 2130 <10.0 2136
Milan 9 2 ME <10.0 28546 <10.0 2137
Milan 9 3 ME 19 20450 13 2166
Milan 9 4 <20.0 <10.0 7370 <10.0 2051
Milan 10 1 166 93 72 154 2111
Milan 10 2 220 91 169 149 2079
Milan 10 3 210 84 <20.0 150 2107
Milan 10 4 503 96 1193 167 2133
Spike/PE 7 1 106 83 116 19.8 2020
Spike/PE 7 2 275 88 257 22 2074
Spike/PE 7 3 197 88 ME 20.5 2092
Spike/PE 7 4 271 65.5 168 17.4 2036
Spike/PE 8 1 22 17 316 72 2148
Spike/PE 8 2 91 19 225 77 2126
Spike/PE 8 3 56 22 145 90.5 2169Spike/PE 8 4 44 19 140 66 2015
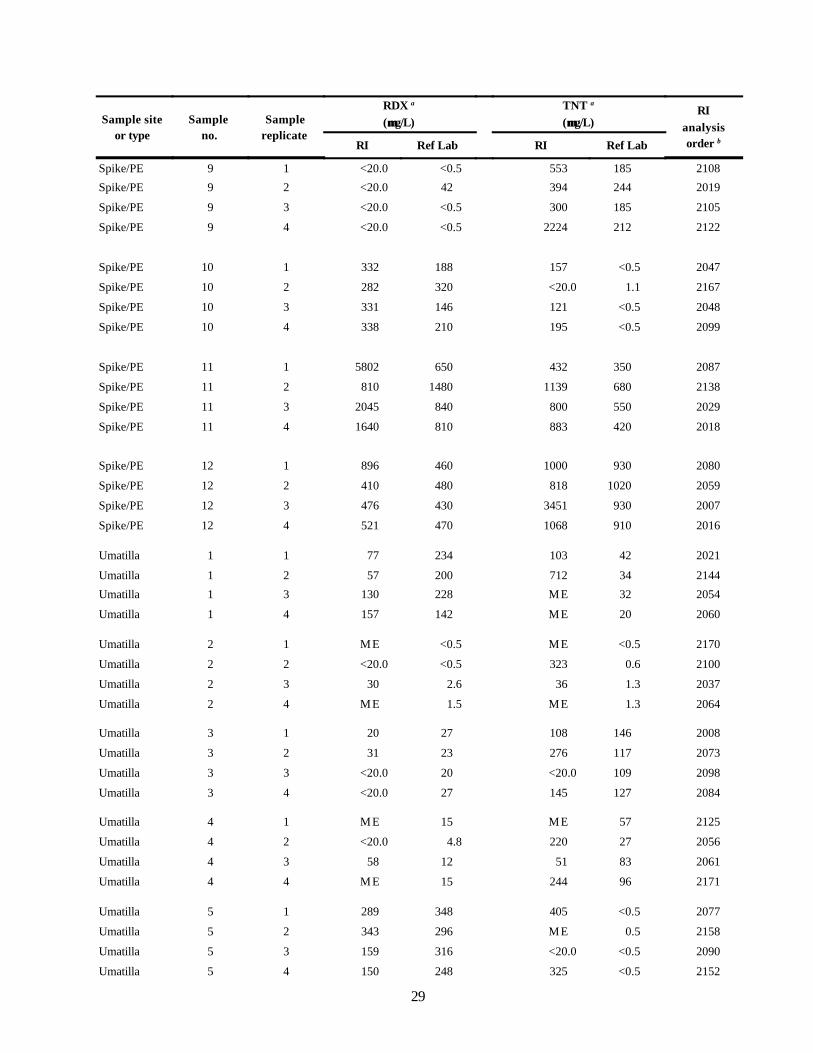
Sample siteor type
Sample no.
Samplereplicate
RDX a
(µµg/L)TNT a
(µµg/L)RI
analysisorder bRI Ref Lab RI Ref Lab
29
Spike/PE 9 1 <20.0 <0.5 553 185 2108Spike/PE 9 2 <20.0 42 394 244 2019
Spike/PE 9 3 <20.0 <0.5 300 185 2105
Spike/PE 9 4 <20.0 <0.5 2224 212 2122
Spike/PE 10 1 332 188 157 <0.5 2047
Spike/PE 10 2 282 320 <20.0 1.1 2167
Spike/PE 10 3 331 146 121 <0.5 2048
Spike/PE 10 4 338 210 195 <0.5 2099
Spike/PE 11 1 5802 650 432 350 2087
Spike/PE 11 2 810 1480 1139 680 2138
Spike/PE 11 3 2045 840 800 550 2029
Spike/PE 11 4 1640 810 883 420 2018
Spike/PE 12 1 896 460 1000 930 2080
Spike/PE 12 2 410 480 818 1020 2059
Spike/PE 12 3 476 430 3451 930 2007
Spike/PE 12 4 521 470 1068 910 2016
Umatilla 1 1 77 234 103 42 2021
Umatilla 1 2 57 200 712 34 2144Umatilla 1 3 130 228 ME 32 2054
Umatilla 1 4 157 142 ME 20 2060
Umatilla 2 1 ME <0.5 ME <0.5 2170
Umatilla 2 2 <20.0 <0.5 323 0.6 2100
Umatilla 2 3 30 2.6 36 1.3 2037
Umatilla 2 4 ME 1.5 ME 1.3 2064
Umatilla 3 1 20 27 108 146 2008
Umatilla 3 2 31 23 276 117 2073
Umatilla 3 3 <20.0 20 <20.0 109 2098
Umatilla 3 4 <20.0 27 145 127 2084
Umatilla 4 1 ME 15 ME 57 2125
Umatilla 4 2 <20.0 4.8 220 27 2056
Umatilla 4 3 58 12 51 83 2061
Umatilla 4 4 ME 15 244 96 2171
Umatilla 5 1 289 348 405 <0.5 2077
Umatilla 5 2 343 296 ME 0.5 2158
Umatilla 5 3 159 316 <20.0 <0.5 2090
Umatilla 5 4 150 248 325 <0.5 2152

Sample siteor type
Sample no.
Samplereplicate
RDX a
(µµg/L)TNT a
(µµg/L)RI
analysisorder bRI Ref Lab RI Ref Lab
30
Umatilla 6 1 ME 5.1 ME 28 2129
Umatilla 6 2 ME 3.5 226 22.5 2106
Umatilla 6 3 25 3.3 605 12.3 2046
Umatilla 6 4 ME 5.9 <20.0 20.8 2145
Volunteer 4 1 <20.0 <0.5 ME 54 2055
Volunteer 4 2 ME <0.5 ME 44.5 2017
Volunteer 4 3 ME <0.5 224 63 2081
Volunteer 4 4 <20.0 1.8 231 105 2022
Volunteer 5 1 <20.0 <5.0 ME 840 2053
Volunteer 5 2 ME <5.0 2276 1290 2174
Volunteer 5 3 <20.0 <5.0 1812 1130 2024Volunteer 5 4 ME <50.0 ME 890 2095a The data are presented exactly as reported. Note that the data are not consistently reported with the same number of significantfigures.b These are the sample numbers from which the analysis order can be discerned. For example, 2001 was analyzed first, then 2002,etc.c “ME” indicates that the sample contained matrix effects and the result could not be reported by the FAST 2000.