ageing research reviews - zakboekdietetiek.nlzakboekdietetiek.nl/wp-content/uploads/2014/12/... ·...
TRANSCRIPT

R
Do
RCa
b
a
ARRAA
KPACDSO
C
h1
Ageing Research Reviews 18 (2014) 112–131
Contents lists available at ScienceDirect
Ageing Research Reviews
jou rn al hom epage: www.elsev ier .com/ locate /ar r
eview
eterminants of protein–energy malnutrition in community-dwellinglder adults: A systematic review of observational studies
achel van der Pols-Vijlbriefa,∗, Hanneke A.H. Wijnhovena, Laura A. Schaapb,aroline B. Terweeb, Marjolein Vissera,b
Department of Health Sciences, EMGO+ Institute for Health and Care Research, VU University, Amsterdam, The NetherlandsDepartment of Epidemiology and Biostatistics, EMGO+ Institute for Health and Care Research, VU University Medical Center, Amsterdam, The Netherlands
r t i c l e i n f o
rticle history:eceived 23 December 2013eceived in revised form 5 September 2014ccepted 15 September 2014vailable online 22 September 2014
eywords:rotein–energy malnutritiongingommunity-dwellingeterminantsystematic reviewbservational studies
a b s t r a c t
Protein–energy malnutrition is associated with numerous poor health outcomes, including high healthcare costs, mortality rates and poor physical functioning in older adults. This systematic literature reviewaims to identify and provide an evidence based overview of potential determinants of protein–energymalnutrition in community-dwelling older adults.
A systematic search was conducted in PUBMED, EMBASE, CINAHL and COCHRANE from the earliestpossible date through January 2013. Observational studies that examined determinants of protein–energymalnutrition were selected and a best evidence synthesis was performed to summarize the results.
In total 28 studies were included in this review from which 122 unique potential determinants werederived. Thirty-seven determinants were examined in sufficient number of studies and were included ina best evidence synthesis. The best evidence score comprised design (cross-sectional, longitudinal) andquality of the study (high, moderate) to grade the evidence level. Strong evidence for an association withprotein–energy malnutrition was found for poor appetite, and moderate evidence for edentulousness,having no diabetes, hospitalization and poor self-reported health. Strong evidence for no associationwas found for anxiety, chewing difficulty, few friends, living alone, feeling lonely, death of spouse, highnumber of diseases, heart failure and coronary failure, stroke (CVA) and the use of anti-inflammatory
medications.This review shows that protein–energy malnutrition is a multifactorial problem and that differentdomains likely play a role in the pathway of developing protein–energy malnutrition. These resultsprovide important knowledge for the development of targeted, multifactorial interventions that aimto prevent the development of protein–energy malnutrition in community-dwelling older adults.
© 2014 Elsevier B.V. All rights reserved.
ontents
1. Introduction . . . . . . . . . . . . . . . . . . . . . . . . . . . . . . . . . . . . . . . . . . . . . . . . . . . . . . . . . . . . . . . . . . . . . . . . . . . . . . . . . . . . . . . . . . . . . . . . . . . . . . . . . . . . . . . . . . . . . . . . . . . . . . . . . . . . . . . . . 1132. Methods . . . . . . . . . . . . . . . . . . . . . . . . . . . . . . . . . . . . . . . . . . . . . . . . . . . . . . . . . . . . . . . . . . . . . . . . . . . . . . . . . . . . . . . . . . . . . . . . . . . . . . . . . . . . . . . . . . . . . . . . . . . . . . . . . . . . . . . . . . . . . 114
2.1. Overview . . . . . . . . . . . . . . . . . . . . . . . . . . . . . . . . . . . . . . . . . . . . . . . . . . . . . . . . . . . . . . . . . . . . . . . . . . . . . . . . . . . . . . . . . . . . . . . . . . . . . . . . . . . . . . . . . . . . . . . . . . . . . . . . . . . . . 1142.2. Literature search . . . . . . . . . . . . . . . . . . . . . . . . . . . . . . . . . . . . . . . . . . . . . . . . . . . . . . . . . . . . . . . . . . . . . . . . . . . . . . . . . . . . . . . . . . . . . . . . . . . . . . . . . . . . . . . . . . . . . . . . . . . . . 1142.3. Study selection. . . . . . . . . . . . . . . . . . . . . . . . . . . . . . . . . . . . . . . . . . . . . . . . . . . . . . . . . . . . . . . . . . . . . . . . . . . . . . . . . . . . . . . . . . . . . . . . . . . . . . . . . . . . . . . . . . . . . . . . . . . . . . . 1142.4. Quality assessment/methodological assessment . . . . . . . . . . . . . . . . . . . . . . . . . . . . . . . . . . . . . . . . . . . . . . . . . . . . . . . . . . . . . . . . . . . . . . . . . . . . . . . . . . . . . . . . . . . 1142.5. Data extraction . . . . . . . . . . . . . . . . . . . . . . . . . . . . . . . . . . . . . . . . . . . . . . . . . . . . . . . . . . . . . . . . . . . . . . . . . . . . . . . . . . . . . . . . . . . . . . . . . . . . . . . . . . . . . . . . . . . . . . . . . . . . . . 1142.6. Best evidence synthesis . . . . . . . . . . . . . . . . . . . . . . . . . . . . . . . . . . . . . . . . . . . . . . . . . . . . . . . . . . . . . . . . . . . . . . . . . . . . . . . . . . . . . . . . . . . . . . . . . . . . . . . . . . . . . . . . . . . . . 114
3. Results . . . . . . . . . . . . . . . . . . . . . . . . . . . . . . . . . . . . . . . . . . . . . . . . . . . . . . . . . . . . . . . . . . . . . .
3.1. Search results . . . . . . . . . . . . . . . . . . . . . . . . . . . . . . . . . . . . . . . . . . . . . . . . . . . . . . .
3.2. Quality assessment . . . . . . . . . . . . . . . . . . . . . . . . . . . . . . . . . . . . . . . . . . . . . . . . .
∗ Corresponding author. Tel.: +31 0 20 59 83 701; fax: +31 0 20 59 86 940.E-mail address: [email protected] (R. van der Pols-Vijlbrief).
ttp://dx.doi.org/10.1016/j.arr.2014.09.001568-1637/© 2014 Elsevier B.V. All rights reserved.
. . . . . . . . . . . . . . . . . . . . . . . . . . . . . . . . . . . . . . . . . . . . . . . . . . . . . . . . . . . . . . . . . . . . . . . . . 115
. . . . . . . . . . . . . . . . . . . . . . . . . . . . . . . . . . . . . . . . . . . . . . . . . . . . . . . . . . . . . . . . . . . . . . . . . 115
. . . . . . . . . . . . . . . . . . . . . . . . . . . . . . . . . . . . . . . . . . . . . . . . . . . . . . . . . . . . . . . . . . . . . . . . . 115

R. van der Pols-Vijlbrief et al. / Ageing Research Reviews 18 (2014) 112–131 113
3.3. Study characteristics . . . . . . . . . . . . . . . . . . . . . . . . . . . . . . . . . . . . . . . . . . . . . . . . . . . . . . . . . . . . . . . . . . . . . . . . . . . . . . . . . . . . . . . . . . . . . . . . . . . . . . . . . . . . . . . . . . . . . . . . . 1153.4. Best evidence synthesis . . . . . . . . . . . . . . . . . . . . . . . . . . . . . . . . . . . . . . . . . . . . . . . . . . . . . . . . . . . . . . . . . . . . . . . . . . . . . . . . . . . . . . . . . . . . . . . . . . . . . . . . . . . . . . . . . . . . . 115
3.4.1. Demographic domain . . . . . . . . . . . . . . . . . . . . . . . . . . . . . . . . . . . . . . . . . . . . . . . . . . . . . . . . . . . . . . . . . . . . . . . . . . . . . . . . . . . . . . . . . . . . . . . . . . . . . . . . . . . . . . 1153.4.2. Financial domain . . . . . . . . . . . . . . . . . . . . . . . . . . . . . . . . . . . . . . . . . . . . . . . . . . . . . . . . . . . . . . . . . . . . . . . . . . . . . . . . . . . . . . . . . . . . . . . . . . . . . . . . . . . . . . . . . . . 1153.4.3. Food and appetite domain . . . . . . . . . . . . . . . . . . . . . . . . . . . . . . . . . . . . . . . . . . . . . . . . . . . . . . . . . . . . . . . . . . . . . . . . . . . . . . . . . . . . . . . . . . . . . . . . . . . . . . . . . 1153.4.4. Lifestyle domain . . . . . . . . . . . . . . . . . . . . . . . . . . . . . . . . . . . . . . . . . . . . . . . . . . . . . . . . . . . . . . . . . . . . . . . . . . . . . . . . . . . . . . . . . . . . . . . . . . . . . . . . . . . . . . . . . . . 1253.4.5. Psychological domain . . . . . . . . . . . . . . . . . . . . . . . . . . . . . . . . . . . . . . . . . . . . . . . . . . . . . . . . . . . . . . . . . . . . . . . . . . . . . . . . . . . . . . . . . . . . . . . . . . . . . . . . . . . . . . 1253.4.6. Physical functioning domain . . . . . . . . . . . . . . . . . . . . . . . . . . . . . . . . . . . . . . . . . . . . . . . . . . . . . . . . . . . . . . . . . . . . . . . . . . . . . . . . . . . . . . . . . . . . . . . . . . . . . . 1253.4.7. Disease and care domain . . . . . . . . . . . . . . . . . . . . . . . . . . . . . . . . . . . . . . . . . . . . . . . . . . . . . . . . . . . . . . . . . . . . . . . . . . . . . . . . . . . . . . . . . . . . . . . . . . . . . . . . . . 1253.4.8. Oral domain . . . . . . . . . . . . . . . . . . . . . . . . . . . . . . . . . . . . . . . . . . . . . . . . . . . . . . . . . . . . . . . . . . . . . . . . . . . . . . . . . . . . . . . . . . . . . . . . . . . . . . . . . . . . . . . . . . . . . . . . 1263.4.9. Social domain . . . . . . . . . . . . . . . . . . . . . . . . . . . . . . . . . . . . . . . . . . . . . . . . . . . . . . . . . . . . . . . . . . . . . . . . . . . . . . . . . . . . . . . . . . . . . . . . . . . . . . . . . . . . . . . . . . . . . . 126
4. Discussion . . . . . . . . . . . . . . . . . . . . . . . . . . . . . . . . . . . . . . . . . . . . . . . . . . . . . . . . . . . . . . . . . . . . . . . . . . . . . . . . . . . . . . . . . . . . . . . . . . . . . . . . . . . . . . . . . . . . . . . . . . . . . . . . . . . . . . . . . . . 126Author contributions . . . . . . . . . . . . . . . . . . . . . . . . . . . . . . . . . . . . . . . . . . . . . . . . . . . . . . . . . . . . . . . . . . . . . . . . . . . . . . . . . . . . . . . . . . . . . . . . . . . . . . . . . . . . . . . . . . . . . . . . . . . . . . . . 129Sources of support . . . . . . . . . . . . . . . . . . . . . . . . . . . . . . . . . . . . . . . . . . . . . . . . . . . . . . . . . . . . . . . . . . . . . . . . . . . . . . . . . . . . . . . . . . . . . . . . . . . . . . . . . . . . . . . . . . . . . . . . . . . . . . . . . . 129Acknowledgements . . . . . . . . . . . . . . . . . . . . . . . . . . . . . . . . . . . . . . . . . . . . . . . . . . . . . . . . . . . . . . . . . . . . . . . . . . . . . . . . . . . . . . . . . . . . . . . . . . . . . . . . . . . . . . . . . . . . . . . . . . . . . . . . . 129
. . . . . .
1
pc221be2annBttgiitdDsaP
irwfpbiwknifetadr2vdK
References . . . . . . . . . . . . . . . . . . . . . . . . . . . . . . . . . . . . . . . . . . . . . . . . . . . . . . . . . . . .
. Introduction
Protein–energy malnutrition (PEM) is a worldwide healthroblem among community-dwelling older adults in developedountries (Halfens et al., 2010; Health Council of the Netherlands,011; Schilp et al., 2012; de Hollander et al., 2012; Lee et al.,005; Locher et al., 2007; Margetts et al., 2003; Martyn et al.,998; Shahar et al., 2009; Wijnhoven et al., 2010) and coulde defined as a wasting condition resulting from a diet inad-quate in either protein or energy (calories) or both (Mosby,009). The World Health Organization emphasized the need forn accepted classification and definition of protein–calorie mal-utrition already in 1972 (Waterlow, 1972). However, up to now,o generally accepted definition is available (White et al., 2012).esides the challenge to define PEM, there is no gold standardo operationalize PEM. Many different criteria are currently usedo measure PEM across different health care settings and targetroups. The Academy of Nutrition and Dietetics and the Amer-can Society for Parenteral and Enteral Nutrition recommendedn 2012 that no single criteria is definitive for PEM, and thathe identification of two or more criteria is recommended foriagnosis (White et al., 2012). The upcoming ESPEN initiative foriagnostic Criteria for PEM and approach for international con-
ensus is expected in 2014 (personal communication) to provide consensus statement for the diagnosis and operationalization ofEM.
Because there is no consensus on a set of criteria to operational-ze PEM, we selected four criteria to operationalize PEM and toestrict our literature search: thinness (as measured by low bodyeight, low body mass index (BMI), or low mid-upper arm circum-
erence (MUAC)), unintentional weight loss, low energy intake oroor appetite. The selection of these four criteria was supportedy a consensus statement of the Academy of Nutrition and Dietet-
cs and the American Society for Parenteral and Enteral Nutritionhere insufficient energy intake and weight loss were defined as
ey criteria of PEM (White et al., 2012), a Delphi study among 30utritional expert (from nine different countries) where low BMI,
nvoluntary weight loss and poor nutritional intake were mostlyrequently indicated as criteria to operationalize PEM (Meijerst al., 2010). And finally, two recent Dutch reports on malnutri-ion (“Results Report: National Prevalence Survey of Care Problems”nd “Malnutrition in the elderly” from the Dutch Health Council)escribed low BMI, weight loss and decreased food intake as crite-ia of PEM (Halfens et al., 2010; Health Council of the Netherlands,
011). Poor appetite was included since it is included in severalalidated screening tools that assess (risk of) PEM in community-welling older adults (Kaiser et al., 2009; Wijnhoven et al., 2012;eller et al., 2000, 2005) and because poor appetite is shown to be. . . . . . . . . . . . . . . . . . . . . . . . . . . . . . . . . . . . . . . . . . . . . . . . . . . . . . . . . . . . . . . . . . . . . . . . . 129
an independent determinant of PEM (Dean et al., 2009; Schilp et al.,2011; Shahar et al., 2003).
Studies determining the prevalence of PEM in community-dwelling older adults are scarce and vary from 7 to 35% (Halfenset al., 2010; Schilp et al., 2012). In the Netherlands, the prevalenceof PEM in older adults is estimated to be 33% in hospitals, 21% innursing homes and 16% in home care. This is based on either a bodymass index ≤20 kg/m2, unintentional weight loss of 3 kg in the lastmonth or 6 kg in the previous 6 months, or a recently decreased foodintake (3 days hardly/no food intake, or 1 week a decreased foodintake) in combination with a BMI between 20.1 and 23.0 kg/m2.The percentage PEM in community-dwelling older adults withouthomecare was estimated at 7%, based on a BMI < 20 kg/m2 or unin-tentional weight loss of 5% in the previous 6 months (Health Councilof the Netherlands, 2011). Although the prevalence of PEM is low-est in the older home-living adults (with or without home care)compared to hospitals or nursing homes, the absolute number ishighest in this community setting because 95% of the populationaged 65 years and older live at home (Garssen and Harmsen, 2011).
PEM is associated with numerous poor health outcomes inindividuals and adverse consequences for society. In severalprospective studies among older community-dwelling adults,low BMI, low MUAC or unintentional weight loss were signif-icantly associated with an increased risk of all-cause mortality(de Hollander et al., 2012; Locher et al., 2007; Wijnhoven et al.,2010), an increased risk for mobility limitations (Lee et al., 2005),and with a poor health status (Margetts et al., 2003). Two otherstudies show that low BMI and unintentional weight loss wereassociated with high use of health care resources ‘among olderadults’ (Martyn et al., 1998) and high health care costs in hospital-ized adults (aged >18) (Freijer et al., 2013). Decreased food intakeand poor appetite were found to be associated with an increasedmortality risk among hospitalized (Sullivan et al., 2002) and well-functioning, community-dwelling older adults (Shahar et al., 2009).However, causality of the above mentioned associations cannot beestablished due to the observational nature of the studies.
Previous research mainly focused on the treatment of PEM byoral nutritional supplements or dietetic counseling, but these stud-ies showed limited effects of health outcomes. On the other hand,little attention has been paid to the prevention of PEM targetingthe potential underlying determinants. Recent systematic reviewsthat summarized the results of (quasi) randomized controlled tri-als on the effect of extra protein and energy supplementationin older undernourished adults found a small statistically signif-
icant effect on weight gain but not on mortality (Health Councilof the Netherlands, 2011; Chapman et al., 2009; McMurdo et al.,2009; Persson et al., 2007; Rabadi et al., 2008; Neelemaat et al.,2011; Starke et al., 2011). Despite positive short-term effects on
1 ng Res
wmtvnieaS
PtoSaKJSapd
2
2
sasLamMFa
2
PrtdsimSrc
2
rsr
(tsilmta
14 R. van der Pols-Vijlbrief et al. / Agei
eight gain, long term beneficial effects of nutritional supple-ents may be less as these products are not well appreciated and
olerated by older adults (Milne et al., 2009; Gosney, 2003). Pre-ious RCTs examining dietetic counseling with or without extrautritional supplementation, in different settings (i.e. Hospital-
zed, post-discharged, home living) have reported no or only smallffects on weight gain or quality of life and physical functioningmong community-dwelling older adults (Neelemaat et al., 2011;chilp et al., 2013; Weekes et al., 2009; Wyers et al., 2013).
Because treatment of PEM appears to be difficult, prevention ofEM may be a more (cost) effective approach. To develop effec-ive prevention strategies, evidence-based knowledge is neededn the determinants of PEM in community-dwelling older adults.everal studies and narrative reviews describe the determinantsnd consequences of PEM (Margetts et al., 2003; Brownie, 2006;ubrak and Jensen, 2007; Feldblum et al., 2007; Han et al., 2009;
ohansson et al., 2009; Martin et al., 2007; Payette et al., 1995;uominen et al., 2005; Thomas et al., 2002), but systematic reviewsre lacking. Therefore, the objective of this systematic review is torovide a comprehensive overview of the evidence for potentialeterminants of PEM in community-dwelling older adults.
. Methods
.1. Overview
The selection and review procedure included a systematicearch in electronic databases by a specialized librarian (IJ) and
first selection of title and abstracts based on predefined inclu-ion and exclusion criteria by two reviewers (RvdP and HW orS). Titles and abstracts were blinded for publishing journal anduthors. Next, the selected papers were read in full text to deter-ine eligibility based on the same inclusion and exclusion criteria.ethodological quality criteria of the selected papers were scored.
inally, a best evidence synthesis was used to report, summarizend grade the level of evidence of all determinants.
.2. Literature search
A systematic search was conducted in the electronic databasesUBMED, EMBASE, CINAHL and the library of Cochrane Collabo-ation from the earliest possible date through January 17th 2013o identify relevant observational studies on PEM in community-welling older adults. The systematic search was conducted by apecialized librarian (IJ) from the library of the VU University Med-cal Center. The search criteria combined text words related to three
ain themes: “PEM”, “older persons”, and “community-dwelling”.everal publication types (i.e. congress posters, letters, and edito-ials) and animal studies were excluded. See Appendix 1 for theomplete search including all terms and limits.
.3. Study selection
The specialized librarian (IJ) excluded duplicate studies. Threeesearchers (RvdP, HW and LS) independently performed the firstelection based on titles and abstracts. Consensus for exclusion waseached during consensus meetings.
Predefined inclusion criteria were used to select the studies:1) observational studies that examined determinants of PEM asheir main topic. Because there is no gold standard how to mea-ure PEM in a general older population, we decided on forehand tonclude papers on either low appetite, low energy intake, weight
oss, or thinness as measured by low body weight, low BMI, or lowid-upper arm circumference as indicators of PEM; (2) study par-icipants were non-institutionalized, community-dwelling olderdults (if a mixed population was described, at least 50% had to
earch Reviews 18 (2014) 112–131
meet this criterion); (3) study participants were 65 years or older(if a mixed population was described, the mean age had to be≥65 years (Milne et al., 2009)); (4) multivariate analyses were per-formed; and (5) results were published in English or Dutch as fullreport studies in peer reviewed scientific journals.
Exclusion criteria were: (1) trials and qualitative studies; (2)observational studies that examined associations with supplemen-tation (i.e. protein drinks), medication, or hormones (i.e. Ghrelin);(3) studies that examined voluntary weight loss, obesity or over-weight; (4) studies that assessed PEM by screening or assessmenttools that include risk factors of PEM (such as Nutritional ScreeningInitiative (DETERMINE), Mini Nutritional Assessment (MNA), Mal-nutrition Universal Screening Tool (MUST), Nutritional Form forThe Elderly (NUFFE) etc.); (5) studies not performed in West-ern countries; (6) studies examining specific patient groups (i.e.oesophageal cancer patients).
The studies that seemed eligible for inclusion were examined infull text by the same reviewers (RvdP, HW and LS) and subsequentlydiscussed during a consensus meeting. If no consensus was met oninclusion, a third independent researcher (MV) was consulted.
2.4. Quality assessment/methodological assessment
The methodological quality assessment of the papers selectedbased on full text evaluation was performed by three reviewersindependently (RvdP, HW or LS) using a short form including 11 inconsensus selected items (Appendix 2) from a previously developedquality checklist (17 items) designed for reviews of observationalstudies based on the QUIPS tool (Appendix 2) (Oosterom-Calo et al.,2012). The QUIPS tool consists of an evaluation of six potentialbiases: (1) bias due to patient selection; (2) study attrition; (3)measurement of prognostic factors; (4) outcome measurement;(5) confounding measurement; and (6) statistical analyses (Haydenet al., 2006). The 11 items in the short form quality questionnairedescribe each of the potential biases in one or more questions, thesequestions could be answered with yes or no and were scored sep-arately. Thereafter, the overall quality of the study was assessedand summarized by comparing each of the 11-items in a consensusmeeting (RvdP, HW or LS). Finally, the studies were classified intothree quality levels: low (≤5 items sufficient), moderate (>5 and<9 items sufficient) and high (≥9 quality items sufficient). A thirdreviewer (MV) was consulted to reach consensus when necessary.
2.5. Data extraction
Data extraction was performed based on original data describedin the manuscript and authors were approached when essentialdata were not provided or were inconsistent. Of the selected stud-ies data was extracted regarding study design (cross-sectional orlongitudinal), characteristics of the analytical study sample (num-ber of participants, mean age or age range, percentage of females,study setting), publication year and data collection year, duration offollow-up for studies with a longitudinal design, country, the def-inition of the outcome PEM as applied in the study, multivariatelyanalysed statistically significant determinants (p ≤ 0.05) and statis-tically non-significant determinants (p > 0.05), statistics and effectmeasures with 95% confidence limits.
2.6. Best evidence synthesis
Due to heterogeneity between studies regarding study design,study population, determinants, outcome measures and statistical
analyses, a quantitative approach or meta-analysis was not pos-sible. We performed a best evidence synthesis to systematicallyreport, summarize and grade the level of evidence for all deter-minants included in the review. This approach is well suited to
ng Res
siH
iordpSsnic1twadspnbfatn(tsanIsi(Fecf
3
3
wpsflrforFs
3
slra
R. van der Pols-Vijlbrief et al. / Agei
ummarize heterogeneous studies (Slavin, 1995) and has been usedn previous studies (Slavin, 1995; Xing et al., 2012; Gomes andigginson, 2006; Lievense et al., 2002).
The best evidence synthesis was performed as follows. First, thencluded studies were rated according to the quality and designf the study. High quality studies with a longitudinal design wereated with 4 points, moderate quality studies with longitudinalesign with 3 points, high quality cross-sectional studies with 2oints and moderate quality cross-sectional studies with 1 point.econd, we summed the scores of all studies that investigated theame determinant separately for the statistically significant andon-significant results. For example: DETERMINANT-A was assessed
n 3 studies. One study was rated with 3 points and provided a statisti-ally non-significant association, 1 study was rated with 4 points, and
study with 1 point both reporting a statistically significant associa-ion for DETERMINANT-A. The total sum score of this DETERMINANT-Aas 8 points (3 + 4 + 1), 3 points for a statistically non-significant
ssociation and 5 for a statistically significant association. Third,eterminants with a total sum score (summing the score of thetatistically significant and non-significant results, which was 8oints for DETERMINANT-A) of less than 4 points and/or determi-ants described in a single study only were not included in theest evidence synthesis because of insufficient evidence. Fourth,or all determinants with a total sum score of 4 or more pointsnd described in at least two studies, the total score of the sta-istically significant results and the total score of the statisticallyon-significant results were divided to reach a best evidence scoreBES). For example: the previously used DETERMINANT-A was not sta-istically significantly associated with PEM in study 1 (3 points) andtatistically significantly associated with PEM in study 2 (1 point)nd study 3 (4 points), the BES was calculated as: 5 points (sig-ificant) divided by 3 points (statistical non-significant) = BES: 1.67.n case there were no studies with a statistically non-significantcore, the BES was based on the score of the statistically signif-cant studies. For example: DETERMINANT-B had a sum score of 7significant) and 0 (non-significant), resulting in a BES of 7 points.ifth, cut-off values for the BES were interpreted as: ≥4 = strongvidence for an association; 2–4 = moderate evidence for an asso-iation; 0.5–2 = inconclusive evidence; >0–0.5 = moderate evidenceor no association; and 0 = strong evidence for no association.
. Results
.1. Search results
The systematic literature search resulted in 17498 studies fromhich 6007 duplicate studies were deleted. In total the searchrovided 11491 studies which were screened for in- and exclu-ion criteria based on title and abstract and 166 were read inull-text. Two full text studies were not traceable through interibrary loaning or authors and were therefore excluded from thiseview (Donkin et al., 1998; Miller and Daniels, 2000). The mostrequent reasons for exclusion after reading full text papers were:utcome not PEM (n = 65), study design other than inclusion crite-ia (n = 23) and study population not community-dwelling (n = 16).ig. 1 shows the flow diagram for the identification of the includedtudies.
.2. Quality assessment
The methodological quality was determined for 32 studies. Four
tudies were excluded from further data extraction because of aow quality score. Of the remaining 28 studies included in thiseview, 13 were rated as high quality and 15 were rated as moder-te quality. In high quality studies, the outcome and determinantsearch Reviews 18 (2014) 112–131 115
were clearly described. In moderate quality studies often informa-tion on the measurement of the determinants (i.e. by means of aquestionnaire or test) or information on study attrition was lacking.
3.3. Study characteristics
Table 1 shows the characteristics of the 28 included studiesin this review. The total number of participants in the 10 longi-tudinal studies varied from 563 to 4512 subjects and in the 18cross-sectional studies from 49 to 12,883 subjects. All studies wereperformed in a mixed sample of males and females. The follow-up period of the longitudinal studies ranged from one to 12 years.All studies were published between 1995 and 2012. Of the 28studies, 11 were conducted in the USA, five in Canada, two inthe Netherlands and two in Sweden, one each performed in Cuba,France, Japan, Brazil, UK, Israel, Russia and one multi-country study.PEM was defined as weight loss over a certain time period (11 stud-ies), low nutritional intake (6 studies), low body weight (6 studies),poor appetite (1 study) or a combination of these outcome meas-ures (referred to as miscellaneous, 4 studies).
3.4. Best evidence synthesis
In total, 122 independent determinants were studied in the 28included studies. Of these, 37 were included in the best evidencesyntheses based on a total sum score of at least 4 and a minimumof two studies. Table 2 shows the results of the best evidence syn-thesis. We found strong evidence for a positive association withPEM for: poor appetite. Moderate evidence for a positive associa-tion was found for hospitalization, no diabetes, edentulousness andself-reported health. For 13 determinants there was inconclusiveevidence for an association. For 18 determinants there was moder-ate evidence for no association and for 11 determinants there wasstrong evidence for no association with PEM. These were alcoholuse, anxiety, chewing difficulty, few friends, living alone, feelinglonely, death of spouse, high number of diseases, heart failure andcoronary failure, stroke (CVA) and the use of anti-inflammatorymedications. Table 3 shows the determinants, ordered by domain,which could not be included in the best evidence synthesis becausetoo few studies of high quality were performed. In the paragraphsbelow, the findings for all 122 determinants are described, catego-rized into nine domains: demographic; financial; food and appetite;lifestyle; psychological; physical functioning; disease and care; oraldomain and social domain.
3.4.1. Demographic domainFor sex, inconclusive evidence for an association was found (BES:
0.79) in 17 studies. Seven studies showed female sex was associatedwith PEM while in one study male sex was associated with PEM(regarded as statistically non-significant when summarizing theresults of female sex). For older age (BES: 0.48, 20 studies), region(BES: 0.17, three studies) and low education (BES: 0.11, seven stud-ies) moderate evidence for no association with PEM was found. Fourdeterminants could not be included in the best evidence synthesis:marital status; ethnicity; race and religion.
3.4.2. Financial domainModerate evidence showed that a low income was not asso-
ciated with PEM (BES: 0.22) in four studies performed in France(n = 1), Canada (n = 2) and USA (n = 1). Two determinants could notbe included in the best evidence synthesis: not enough money forfood and not enough money for medication.
3.4.3. Food and appetite domainStrong evidence for an association with PEM was found for a
poor appetite in five studies (BES: 12.00). A statistically significant

116
R.
van der
Pols-Vijlbrief
et al.
/ A
geing R
esearch R
eviews
18 (2014)
112–131Table 1Full text data extraction.
Reference Studytype
Analytical sample Year Country Outcome Determinants Statistics Qualityscore
Studyscore
N Age (y)mean (SD)
Female%
Setting
RodriguesBarbosaet al., 2010
CS 1905 71.1 (8.6) 65.2 Populationbasedhouseholdsurvey
PY:2010DCY:1999–2000
Cuba Low weight (M)BMI < 22 kg/m2
vs. Normal weightBMI ≥ 22–27 kg/m2
M: Mean of 3×height and weight
(Questionnaire)Age (older)Smoker (current)Hypertension (vs. no)Diabetes (vs. no)Sex (male vs. female),Education (low vs. high),Physical activity (yes)
Odds Ratios (95% CI)2.05 (1.46, 2.88)1.83 (1.36, 2.45)0.77 (0.61, 0.99)0.58 (0.40, 0.84)NSAdjusted: all variablesabove
H 2
St-Arnaud-McKenzieet al., 2010
LT 1497 (67–84)* 52.3 Healthywell-functioningcommunity-dwellingolderadults
PY:2010DCY:2003–2005FU: 2y
Canada Weight loss (M)≥ 5% over 2yvs. Weight stable< 2% weightchange over 2y
(Measure + test)Physical performance(total score: range 0–32)Sum of biceps, quadriceps, gripstrength, timed up and go, chairstand, gait speed, balanceperformance scores (individual0–4 score)
Odds Ratios (95% CI)0.79 (0.63, 0.99)Adjusted: sex age, BMI,depressive symptoms,energy intake, PA,smoking, #medication,#chronic illnesses,albumin concentrations
H 4
Stephen andJanssen,2010
LT 4512 ≥65 57.1 Populationbasedcommunity-dwellingolderadults non-institutionalized
PY:2010DCY:1989–1990FU:7 ± 1.8y
Canada Weight loss (M)≥10% weight lossgroup
(Questionnaire)Physical activityInactive vs. Active
Hazard Ratio (95% CI)0.88 (0.74–1.03) NSAdjusted: sex, age, race,height, income,smoking, alcohol,baseline disease,incident disease,number of weightmeasures over 8 years
H 4
Meijers et al.,2009
CS 12883 76.2(12.0)
62.8 Olderadults inhome-careorganiza-tions
PY:2009DCY:2005
Netherlands MiscellaneousBMI (M)<18.5 kg/m2 orWeight loss (Q)6 kg in 6 monthsor 3 kg in 1monthorBMI (M)18.5–20 kg/m2
and nonutritional intake(Q) for 3 days orreduced intake>10 daysvs.Well-nourished
(Questionnaire + measure)Cancer (%)Diabetes mellitus (%)Gastrointestinal Tract (%)Sex (m/f), Age/groups,Region/ward type, Time sinceadmission, Infection disease,Blood disease, Dementia,Coronary heart disease, Stroke(CVA), COPD, Musculoskeletaldisorders, Prevalent disease
Odds Ratios (95% CI)4.19(3.32, 5.29)0.67(0.52, 0.87)1.58 (1.18, 2.11)NS
H 2
Locher et al.,2008
CS 230 79.1 (8.6) 78.7 Home boundolder adultsreceivinghome care
PY:2008
USA Low intakeUnder eating (Q)Caloric intake (24-hrecall) – estimatedenergy requirement(kcal)
(Questionnaire)Male sex (vs. female)Frequency of care (vs.>1time/day)
Odds Ratios (95% CI)4.02 (1.54, 10.52)
M 1
Once daily 0.29 (0.10, 0.80)1–3 time/week 6.69 (1.05, 42.42)
Prior hospitalization 2.08 (1.02, 4.25)BMI obese class II and III (vs.underweight)
48.07 (8.30, 278.57)

R.
van der
Pols-Vijlbrief
et al.
/ A
geing R
esearch R
eviews
18 (2014)
112–131
117
Age (younger), Education(lower), African/Americanethnicity, Social support,Caregiver, Religion
NS
Sorbye et al.,2008
CS 4010 Males: 80.9(7.5)Females: 82.8(7.3)
74 Older adults inhome care
PY:2008
Multicountry
Weight loss (Q)5% weight loss in 30days or10% in 180 daysvs. No weight loss
(Questionnaire) Odds Ratios (95% CI) M 1
Intake less than one meal aday
4.2 (2.8, 6.4)
Reduced appetite 2.5 (1.9, 3.4)Severe malnutrition 7.1 (4.2, 11.9)Reduced social activity 2.0 (1.6, 2.5)Hospitalization in last 90 days 2.1 (1.6, 2.7)Eating less 2.8 (1.8, 4.4)Constipation 1.9 (1.3, 2.7)Falls 1.5 (1.2, 1.9)Oral problems swallowingfood
2.8 (1.8, 4.4)
Flare-up of chronic disease 1.5 (1.1, 2.1)Pressure ulcers 1.5 (1.2, 1.9)Daily pain 1.3 (1.0, 1.6)Male Sex (vs. female), OlderAge, Living alone, Use of formalservices, Hospital visitEmergency unit visit,Emergency at home, Frequencyof care, Insufficient fluid/foodintake, Mouth pain duringeating, Dry mouth, Tubefeeding, Vomiting, Diarrhea,Pain, Vision decline (last 90days), IADL dependency >3(0–7), ADL dependency >3(0–8), Loneliness, Not out ofhouse last week, Depressionrisk ≥1 (0–9), Cognitionperformance >3 (0–6),Self-Reported health (bad vs.good), Terminal prognosis <6months, Cancer, Unstablecondition, Disease/chronicproblem, stroke, heart failure,dementia, Parkinson’s disease,psychiatric diagnosis
NS
Lee et al., 2006 CS 2169 (70–79)* 54.6 Community-dwelling olderadults
PY: 2006DCY:1997–1998
USA Impaired appetite (Q)(5 point Likert scale:very good, good,moderate, poor, verypoor)Impaired:moderate,poor and very poorappetite
(Questionnaires) Odds Ratios (95% CI) H 2Female sex 1.74 (1.29, 2.35)Smoking
Current 2.16 (1.42, 3.29)Former 1.38 (1.01, 1.89)
Weight change (M)Loss 1.78 (1.25, 2.54)

118
R.
van der
Pols-Vijlbrief
et al.
/ A
geing R
esearch R
eviews
18 (2014)
112–131
Table 1 (Continued )
Reference Studytype
Analytical sample Year Country Outcome Determinants Statistics Qualityscore
Studyscore
N Age (y)mean (SD)
Female%
Setting
Gain 0.60 (0.43, 0.84)Poor self-reported health 2.36 (1.72, 3.24)Depression (CES-D) 2.52 (1.55, 4.11)Chewing pain 1.97 (1.21, 3.20)Reported visual impairment 1.80 (1.32, 2.45)Log TNF-� 1.71 (1.23, 2.34)Age, Trying to lose weight,Cancer, Havinganti-inflammatory medicine,Death of spouse, Race,Education (< than high school),Not enough money to buy food,Current drinker, Physicalactivity (kcal/week), BMI(<25 kg/m vs. >25 kg/m2) (M),Having at least 1 chronicdisease, Coronary heartdisease, Diabetes, Number ofmedicines, Hospitalization(past 1 year), Staying in bed,Cutting down things, Difficultypreparing meals, Difficulty,shopping, Anxious, Eatingalone, Living alone, Familynetwork, Friends network,Edentulous, Denture use,Reported hearing impairment,IL-6
NS
Feart et al.,2007
CS 1786 (68–95)*
Males: 76.1Females: 76.8
62.7 Community-dwelling olderadults
PY: 2007DCY:1999–20002001–2002
France Low intake (Q)(kJ) (1× 24 h recallweekday)
(Questionnaire) Unstandardizedregression coefficients(95% CI)
H 2
Female sex −1970(−2184, −1754)Older age ≥ 85y −470 (−882, −58)Marital status
Single vs. married 572 (154, 991)Divorced vs. married 391 (3, 779)Widowed vs. married NS
Education NSHigh income vs. lowest B 521 (58, 984)BMI (<21 kg/m2) (M) NS
Ikebe et al.,2006
CS 807 60–64 (39.2%)65–69 (40.5%)70+ (20.3%)
49.4 Community-dwelling,independentlyliving healthyolder adults
PY:2006
Japan Low weight (Q?)UnderweightBMI <20.0 kg/m2
(Questionnaire) Odds Ratios (95% CI) M 1
Female sex 2.80 (1.76, 4.48)Low masticator performance(M)
1.98 (1.14, 3.43)
Age, Self-assessed generalhealth, Number of teeth (4cat.), Type of dentition, Lowchewing/occlusal force (M)
NS

R.
van der
Pols-Vijlbrief
et al.
/ A
geing R
esearch R
eviews
18 (2014)
112–131
119
Agostini et al.,2004
LT 885 81.0 (5.2) 72.0 Community-dwelling olderadults
PY: 2004DCY:1991-1992
USA Weight loss (Q)≥10 pounds in 1 yearfollow up
(Recorded by nurse) Odds Ratios (95% CI) M 3Medications (vs. none)
1–2 NS3–4 1.96 (1.08, 3.54)≥5 2.78 (1.38, 5.60)
Adjusted: age, sensoryimpairment, number ofchronic disease, numberof hospitalizations,cognitive impairment,depressive symptoms
Weyant et al.,2004
LT 1053 72.7 (2.8) 50.3 Olderadults
PY: 2004DCY:1997–1998FU: 2y
USA Weight loss (M)body weight ≥ 5% in 2years follow up
(Measure)Probing depth (mm)
Odds Ratios (95% CI)1.53 (1.32, 1.77)Adjusted: age, race,education, smoking,number of teethremaining, diabetes, BMI
H 4
Barreto et al.,2003
CS 1258 ≥60 43.5 Older adultsliving in atown
PY: 2003DCY: 1996
Brazil Low weight (M) Odds Ratios (95% CI) M 1
BMI <20.0 kg/m2 Female sex (vs. male) NSvs. BMI 20–30 kg/m2 Older age 2.5 (1.5, 4.0)
Higher education 0.3 (0.1, 0.7)Smoking current vs. never 1.7 (1.1, 2.6)Physical inactivity (y/n) NSHypertension (y/n) 0.6 (0.4, 0.8)Diabetes (y/n) 0.4 (0.2, 0.8)Anemia (y/n) 2.0 (1.0, 4.0)T. cruzi infection (y/n) 1.7 (1.2, 2.3)
Adjusted: listed aboveVisit to doctor (1 vs. none) NSHospitalization >2× in thelast years (vs. none)
2.4 (1.4, 4.2)
Poor self-related health (vs.good)
1.5 (1.0, 2.4)Adjusted: age, sex,education + above listed
Margetts et al.,2003
CS 1368 65–74 (37.1%)75–84 (38.5%)85+ (24.4%)
49.3 Free-livingolder adults(17%institution)
PY: 2002DCY: 1998
UK Miscellaneous (M+Q)- BMI < 18.5 kg/m2
or- BMI 18.5–20.0 kg/m2 andweight loss ≥3.2 kgor- BMI >20.0 and weightloss ≥6.4 kg)vs. low risk – BMI >20kg/m2
no weight loss
(Questionnaire) Odds Ratios (95% CI) M 1
Hospitalized lastyear (y/n)
M: 1.83 (1.06, 3.16)M: 2.17 (1.22, 3.88)
Institution (vs. freeliving)
M: 2.34 (1.20, 4.58)F: 2.98 (1.58, 5.62)
Longstanding illness(y/n)
M: 2.64 (1.30, 5.33)M: 2.81 (1.54, 5.11)
Older age(≥ 85years)
F: 2.82 (1.25, 6.38)Adjusted: age, sex, region,domicile, health status,illness, hospitalized
RegionBad health (vs. good)

120
R.
van der
Pols-Vijlbrief
et al.
/ A
geing R
esearch R
eviews
18 (2014)
112–131
Table 1 (Continued )
Reference Studytype
Analytical sample Year Country Outcome Determinants Statistics Qualityscore
Studyscore
N Age (y)mean (SD)
Female%
Setting
Shahar et al.,2003
CS 377 65–74 (59.4%)>75 (40.6%)
54.4 Community-dwellingolder adults
PY:2002
Israel Low intake (Q)Total MJ (24 h recall)vs. recommended dailyallowances
(Questionnaire) Standardizedregression coefficients
M 1
Higher frequency eatingalone
M:� 0.20, p:0.01F: NS
Poor appetite M:� 0.19, p:0.01F:� 0.27, p:0.001
Gastrointestinal problems NSHigher medication use M:� 0.24, p:0.002
F:� 0.16, p:0.03No snacking M:� 0.26, p:0.01
F:NSOlder age NS
Shatensteinet al., 2001
LT 584 70–79 (27%)80–89 (55%)90+ (18%)
59.6 Community-dwellingolder adults
PY: 2001DCY:1991–1992FU: 5y
Canada Weight loss (M)Risk: ≤ 95% of initialbody weightvs. No risk: >95% ofinitial body weight
(Questionnaire) Standardizedregression coefficients
H 4
Loss of interest in life (y/n) � 0.22 (0.12–0.42)Loss of appetite (y/n) � 0.56 (0.34–0.90)Age, Sex, Cognitive diagnosis(3MS score), Study region,Presence of spouse, Functionalvulnerability, Difficulty feedingself, Depressive symptoms,Weight loss self-reported,Clinical impression depression,Frailty scale (7cat.), Income
NS
Ritchie et al.,2000
LT 563 Males: 77.3(4.7)Females: 78.1(5.3)
57.9 Home livingcommunity-dwellingolder adults
PY:2000FU: 1y
USA Weight loss (Q)≥10% of total bodyweight in 1 year
(Questionnaire) Odds Ratios (95% CI) H 4Sex – female 3.77 (1.71, 8.33)Age ≥ 80 year NSAnnual income NSHigher baseline weight 1.02 (1.01, 1.03)Edentulous (M) 2.03 (1.05, 3.96)More than 2 diagnoses NSDependent in ADL 2.27 (1.08, 4.78)
Adjusted: depression,smoking, alcohol use,PA
Marshall et al.,1999
CS 1006 74.5(65–99)*
56 Ruralcommunity-dwellingadults
PY: 1999DCY:1993–1995
USA Weight loss (M) age adjusted M 1
>10 lb in past 6months
Hispanic ethnicity (vs. other) p:0.73 NSFemale sex (vs. male) p:0.34 NS

R.
van der
Pols-Vijlbrief
et al.
/ A
geing R
esearch R
eviews
18 (2014)
112–131
121
Keller et al.,1997
CS 5073 72.7(65–98)*
60 Communityliving olderadults
PY: 1997DCY: 1990
Canada Low intake (FFQ) kJ (Questionnaire) Unstandardizedregression coefficients(95% CI)
M 1
Poor perceived healthstatus (vs.good/excellent)
M: NSF: 581 (233, 929)
Dentate (y/n) M: −717 (−1097,−337)F: −290 (−576, −4)
Feeling happy (y/n) M: −1569 (−2242,−896)F: NS
Difficulty hearing (y/n) M: NSF: −724 (−1347,−102)
Current smoking (y/n) M: 644 (157, 1132)F: NS
Walking dependence(vs. independent)
M: NSF:483 (55.6, 909)
No longer drive (vs.drive)
M: −602 (−1111, −93)F: −452 (−735, −170)
IADL dependence (vs.independent)
M: 818 (76, 1560)F: NS
High Income (vs. low), Socialsupport, Low Education level(vs. high), Nutrition/healthlink, Chewing difficulties,Number of chronicdiseases/health problems,Number of medications, BMI,Cognition - think clearly, Age,Married
NS
Payette et al.,1995
CS 145 78.8(60–94)*
71 Communityliving olderadultspeople
PY: 1995DCY: 1991
Canada Low intake (Q)(total kJ in threenonconsecutive 24-hrecalls)
(Questionnaire) Unstandardizedregression coefficients
H 2
Female sex (vs. male) −1.29 (SE 0.26) p:<0.01
Age (y) NSBurden of disease (score) −0.05 (SE 0.02) p:
<0.05Level of stress (high, moderate,low)
NS
Good appetite (often,sometimes, vs. never)
0.39 (SE 0.15) p: <0.01
Vision (good, fair, poor) NSArthritis NSMedication use (psychotropic) NSFriends network NS
Rush andWelch, 1996
CS 2281 70–74 (38.5%)7579(28.7%)8084 (22.0%)85+ (10.8%)
76.1 Older ruralpensioners
PY: 1996DCY: 1992
Russia Weight loss (Q)≥5 kg in previous 6monthsvs. no weight loss
(Questionnaire) Odds Ratios (95% CI) M 1

122
R.
van der
Pols-Vijlbrief
et al.
/ A
geing R
esearch R
eviews
18 (2014)
112–131
Table 1 (Continued )
Reference Studytype
Analytical sample Year Country Outcome Determinants Statistics Qualityscore
Studyscore
N Age (y)mean (SD)
Female%
Setting
Not enough money forfood
M: NSF: 1.66 (1.36, 2.04)
< 3 meals a day M: 1.95 (1.19, 3.20)F: 1.93 (1.47, 2.52)
Eats alone M: NSF: 1.34 (1.10, 1.63)
Difficulty to cook forself
M: 1.71 (1.16, 2.51)F:1.24 (1.01, 1.52)
Difficulty to shop forself
M: 1.54 (1.06, 2.24)F: 1.44 (1.16, 1.79)
Illness affectingeating habits
M: 2.17 (1.50, 3.14)F: 1.82 (1.49, 2.23)
3+ drugs per day M: 2.13 (1.43, 3.19)F: 1.95 (1.57, 2.43)
Teeth/mouthproblems
M: NSF: 1.33 (1.09, 1.63)
Can’t affordmedication
M: 2.16 (1.43, 3.17)F: 1.45 (1.18, 1.79)
Medication notavailable in pharmacy
M: 1.89 (1.31, 2.75)F: 1.49 (1.21, 1.83)
Low diet score (<7) M: NSF: 1.45 (1.14, 1.86)Adjusted: age and BMIStandardizedregression coefficients
Age (y)Sex (m/f)
NSNSAdjusted: illnessaffecting eating,number of drugs, notenough money to buyfood
Dziura et al.,2004
LT 2812 Survivors:71.0 (5.0)
69 Non institu-tionalizedolder adults
PY: 2004DCY: 1982FU: 12y
USA Weight loss/changeper year (Q)(pounds body weightannually)
(Questionnaire) Unstandardizedregression coefficients(95% CI)
H 4
Non-survivors:76.0 (7.0)
51 Physical activity × time 0.09 (0.02, 0.15)Age (y) × time −0.07 (−0.08, −0.05)Chronic condition × time NSMobility × time 0.36 (0.09, 0.63)Smoking × time NS
Adjusted: sex, race,education, height,functional disabilityscore and housing andvariables above
Mamhidiret al., 2006
CS 508 86.2 (5.5) 72 Older adultsresiding inshelteredhousing
PY: 2006DCY:2000–2002FU: 1y
Sweden Miscellaneous (M)BMI <22 kg/m2
orWeight loss, 5%/10%over 1 year
(Questionnaire) Odds Ratios (95% CI) H 2Impaired Cognitiveperformance (CPS-scale 0–6)
1.84 (1.27, 2.68)

R.
van der
Pols-Vijlbrief
et al.
/ A
geing R
esearch R
eviews
18 (2014)
112–131
123
Impaired Activities of Daily 1.79 (1.16, 2.77)Living (ADL)Age 1.04 (1.00, 1.08)Difficulty eatingself/dependency
2.26 (1.68, 3.04)
Constipation 2.49 (1.19, 4.96)Dementia 2.14 (1.34, 3.41)Parkinson’s Disease 2.45 (1.01, 5.97)Depression (0-14 (DRS), Sex,Vision problems, Heart failure,Falls, Hip fracture, Stroke,Cancer, Chewing andswallowing difficulty, Mouthpain, Taste, Hunger, Intake 25%of food uneaten, Dietarysupplement use, Oralhealth/dental status, Numberof medication, Prescribedmedication
NS
Locher et al.,2005
CS 50 77.1 (8.7) 64 Homeboundolder adultsreceivinghome care
PY:2005
USA Low intake (Q)kcal per meal (24 hrecall)
(Questionnaire) Regression coefficients M 1
Eating alone NSLiving with someone vs. livingalone
NS
Female sex vs. men −76.6, p:0.045
Martin et al.,2007
CS 130 ≥65 55 Community-dwellingolder adults
PY: 2007DCY:2003–2004
USA Low weightBMI <19 kg/m2
vs. BMI ≥ 19kg/m2
(Questionnaire) Odds Ratios (95% CI) M 1Illness that changes thekind/amount of food
4.7 (1.6, 13.1)
Weight loss ≥10 lb in past 6months
4.0 (1.5, 10.7)
Assistance with traveling 4.0 (1.4, 11.3)<2 meals a day NSDepression (y/n) (GDS) NS≤1 fruit/juices a day NS
Ritchie et al.,1997
CS 49 78 (1.1) 78 Urbanhomeboundolder adults
PY:1997
USA Low weight (M)BMI <24 kg/m2
vs. BMI ≥24 kg/m2
(Questionnaire) Standardizedregression coefficients
M 1
Older Age � 0.39 (se 0.16)Less education NSDifficulty in chewing NSWearing of dentures NS
Schilp et al.,2011
LT 1120 74.1 (5.7) 51.5 Community-dwellingolder adults
PY: 2011DCY:1992–1993FU: 9y
Netherlands Miscellaneous (M)BMI <20 kg/m2orInvoluntary weightloss ≥5% in 6 months
(Questionnaire)Poor appetite
Hazard Ratios (95% CI)1.63 (1.02, 2.61)
H 4

124
R.
van der
Pols-Vijlbrief
et al.
/ A
geing R
esearch R
eviews
18 (2014)
112–131Table 1 (Continued )
Reference Studytype
Analytical sample Year Country Outcome Determinants Statistics Qualityscore
Studyscore
N Age (y)mean (SD)
Female%
Setting
Difficulties walking stairs<75 years 1.91 (1.14, 3.22)≥75 years NS
Female, Age ≥ 75 years (vs.younger), Depressivesymptoms (vs. no), Anxietysymptoms (vs. no), ≥ 2 chronicdisease (vs. none), ≥ 1Medication use (vs. no),Limitations of normal activitiesdue to a health problem,Physical performance test,Alcohol use (vs. no), Loneliness(vs. no), Having a partner (vs.yes)
NS
Fagerstromet al., 2011
LT 1230 76.1 (9.9)(60–96)*
57.6 Regularhousing
PY: 2011DCY:2001-2003
Sweden BMI ≤23 kg/m2 (M) Odds Ratios (95% CI)Female sex 2.31 (1.61, 3.31)Older age 1.02 (1.00, 1.04)Cognitive ability
Mild impairment NSModerate or severe 3.04 (1.54, 6.01)
Adjusted: livingarrangement, housingarrangement,functional ability andabove mentioned
Alley et al.,2010
LT 2690 Men:73.7 (2.8)73.7 (2.9)Women:73.5 (2.9)73.4 (2.8)
50.8 Generalpopulation
PY: 2010RP:1997–1998FU: 1y
USA Weightloss/change peryear (M)Total mass (kg)(DXA scan)
Regressioncoefficients (95% CI)
M 3
Hospitalization (vs. nohospitalization)
M: −0.79 (−1.04,−0.54)F: −0.79 (−1.07,−0.51)
(clinical visits and telephoneinterviews)
Adjusted:demographics (age,race, study site) healthbehaviors (smoking,walking for exercise),co morbidities(diabetes, cancer,cardiovascular disease,arthritis, chronic lungdisease, depression)and baseline values ofmass, fat mass, leanmass, strength or/inseparate regressions
Abbreviations: CS, cross-sectional; LT, longitudinal; Q, quality (H = high, M = moderate); Y, year; SD, standard deviation; PY, publication year; DCY, data collection year; FU, follow-up; outcome M, measure and Q, questionnaire;vs., versus; BMI, body mass index; PA, physical activity; #, number; MV, multivariate; CI, 95% confidence interval; ADL, activities of daily living; IADL, instrumental activities of daily living; COPD, chronic obstructive pulmonarydisease; CVA, cerebral vascular accident; M/F, male/female; Y/N, yes/no; IL-6, interleukine-6; OHRQoL, oral health related quality of life; SE, standard error; MJ, mega joule; KJ, kilo joule; RP, recruitment period.
* Age range.

R. van der Pols-Vijlbrief et al. / Ageing Research Reviews 18 (2014) 112–131 125
Abstracts retrieved from elec troni c se arc h (N=174 98)
EMBASE (N=7654), Cochrane (N =2030), PUBMED (N=5296)and CINAHL (N=2518)
Duplicat e exclud ed (N=6007)
(N=11491)selec�onfirstforStudies
onbasedexcludedStudies
�tle/abstract (N=11325)
Studies select ed as relevant an d read full text (N=166)
textfullonbasedexcludedStudies
(N=134)
(Outcome (N=65), Design/study type (N=23),
Se�n g (N=16), No mul�variabl e analyses
(N=10), Age (N =7), Doubl e (N =6), Lan gua ge
(N=4), Not traceabl e (N=2), Oth er (N=1)
qualitylowonbasedexcludedStudies
(N=4)
Studie s incl uded in be st evidence synthesis (N=28)
review
asanwinm
3
tsWsucw
3
Cta
Fig. 1. Flowchart
ssociation was found and the outcome measure was in these fivetudies other than appetite (weight loss (n = 2), low intake (n = 2)nd a combination of low BMI and weight loss (n = 1)). Determi-ants that could not be included in the best evidence synthesisere the number of meals consumed a day, low diet score, snack-
ng, eating less, eating less fruit and insufficient fluid of food intake,utritional health link, severe malnutrition, tube feeding, supple-ent use and hunger.
.4.4. Lifestyle domainWithin the lifestyle domain five determinants were included in
he best evidence synthesis. Low physical activity (BES: 1.60, fivetudies) and smoking (BES: 1.50, five studies) were inconclusive.
eight loss (BES: 0.25, two studies) and high BMI (BES: 0.20, fourtudies) showed moderate evidence for no association and alcoholse (BES: 0.0, two studies) provided strong evidence for no asso-iation. Insufficient evidence was found for high baseline weight,eight change and trying to lose weight.
.4.5. Psychological domain
Four determinants were included in the evidence synthesis.ognitive decline (BES: 0.83, five studies) and dementia (BES: 0.67,hree studies) were inconclusive, moderate evidence for no associ-tion was found for depression (BES: 0.17, six studies) and strong
study selection.
evidence for no association for anxiety (BES: 0.0) in two studies. Thedeterminants not included in the best evidence synthesis were lossof interest in life, feeling happy, cutting down things, psychiatricdiagnosis and stress.
3.4.6. Physical functioning domainInconclusive evidence was found for ADL dependency (BES:
1.40, five studies), low physical functioning (BES: 1.00, two studies)and difficulty feeding (BES: 0.50, two studies). There was moder-ate evidence that vision decline (BES: 0.40, four studies) was notassociated with PEM. The determinants with insufficient evidencewithin the physical domain were shown in Table 3.
3.4.7. Disease and care domainHospitalization (BES: 3.50, six studies), self-reported poor
health (BES: 2.50, six studies) and having no diabetes (BES: 2.50,four studies) showed moderate evidence for an association withPEM. The use of high number of medications (BES: 0.56, seven stud-ies) was inconclusive and for cancer (BES: 0.40, four studies) and
having a chronic disease (BES: 0.14, four studies) there was mod-erate evidence for no association. For heart and coronary failure,anti-inflammatory medication, stroke and increased number of dis-ease strong evidence was available for no association with PEM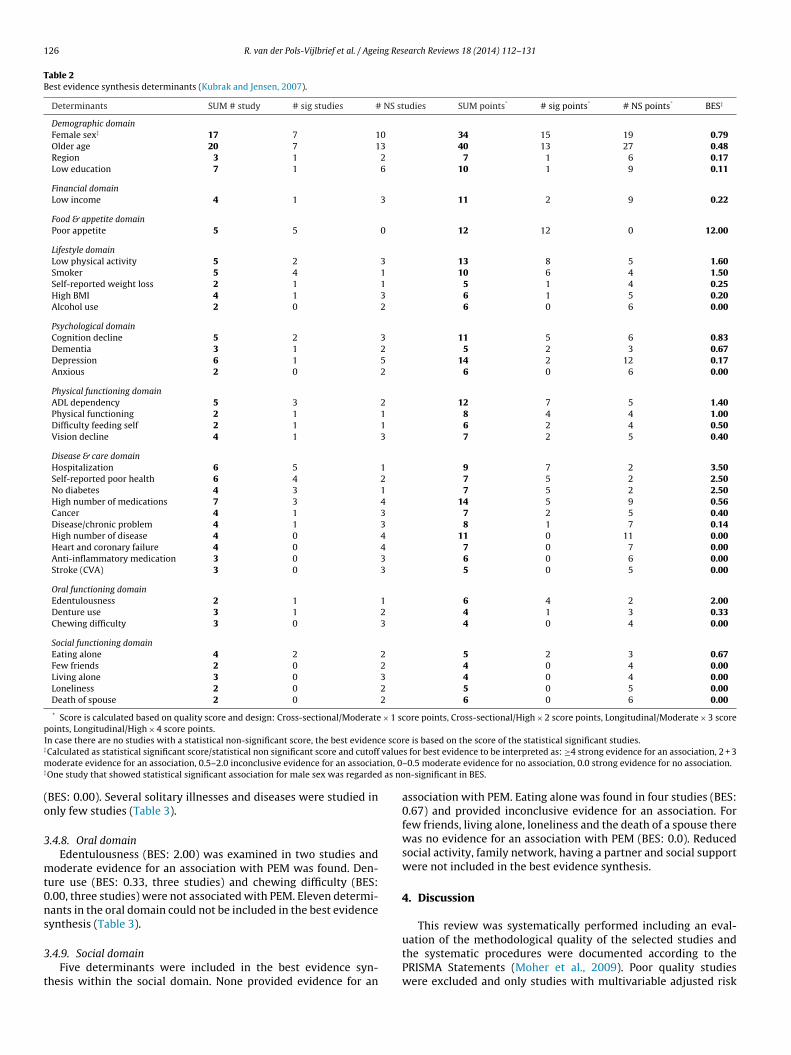
126 R. van der Pols-Vijlbrief et al. / Ageing Research Reviews 18 (2014) 112–131
Table 2Best evidence synthesis determinants (Kubrak and Jensen, 2007).
Determinants SUM # study # sig studies # NS studies SUM points* # sig points* # NS points* BES‡
Demographic domainFemale sex‡ 17 7 10 34 15 19 0.79Older age 20 7 13 40 13 27 0.48Region 3 1 2 7 1 6 0.17Low education 7 1 6 10 1 9 0.11
Financial domainLow income 4 1 3 11 2 9 0.22
Food & appetite domainPoor appetite 5 5 0 12 12 0 12.00
Lifestyle domainLow physical activity 5 2 3 13 8 5 1.60Smoker 5 4 1 10 6 4 1.50Self-reported weight loss 2 1 1 5 1 4 0.25High BMI 4 1 3 6 1 5 0.20Alcohol use 2 0 2 6 0 6 0.00
Psychological domainCognition decline 5 2 3 11 5 6 0.83Dementia 3 1 2 5 2 3 0.67Depression 6 1 5 14 2 12 0.17Anxious 2 0 2 6 0 6 0.00
Physical functioning domainADL dependency 5 3 2 12 7 5 1.40Physical functioning 2 1 1 8 4 4 1.00Difficulty feeding self 2 1 1 6 2 4 0.50Vision decline 4 1 3 7 2 5 0.40
Disease & care domainHospitalization 6 5 1 9 7 2 3.50Self-reported poor health 6 4 2 7 5 2 2.50No diabetes 4 3 1 7 5 2 2.50High number of medications 7 3 4 14 5 9 0.56Cancer 4 1 3 7 2 5 0.40Disease/chronic problem 4 1 3 8 1 7 0.14High number of disease 4 0 4 11 0 11 0.00Heart and coronary failure 4 0 4 7 0 7 0.00Anti-inflammatory medication 3 0 3 6 0 6 0.00Stroke (CVA) 3 0 3 5 0 5 0.00
Oral functioning domainEdentulousness 2 1 1 6 4 2 2.00Denture use 3 1 2 4 1 3 0.33Chewing difficulty 3 0 3 4 0 4 0.00
Social functioning domainEating alone 4 2 2 5 2 3 0.67Few friends 2 0 2 4 0 4 0.00Living alone 3 0 3 4 0 4 0.00Loneliness 2 0 2 5 0 5 0.00Death of spouse 2 0 2 6 0 6 0.00
* Score is calculated based on quality score and design: Cross-sectional/Moderate × 1 score points, Cross-sectional/High × 2 score points, Longitudinal/Moderate × 3 scorepoints, Longitudinal/High × 4 score points.
e scor‡
valuem ion, 0‡
as no
(o
3
mt0ns
3
t
In case there are no studies with a statistical non-significant score, the best evidencCalculated as statistical significant score/statistical non significant score and cutoff
oderate evidence for an association, 0.5–2.0 inconclusive evidence for an associatOne study that showed statistical significant association for male sex was regarded
BES: 0.00). Several solitary illnesses and diseases were studied innly few studies (Table 3).
.4.8. Oral domainEdentulousness (BES: 2.00) was examined in two studies and
oderate evidence for an association with PEM was found. Den-ure use (BES: 0.33, three studies) and chewing difficulty (BES:.00, three studies) were not associated with PEM. Eleven determi-ants in the oral domain could not be included in the best evidenceynthesis (Table 3).
.4.9. Social domainFive determinants were included in the best evidence syn-
hesis within the social domain. None provided evidence for an
e is based on the score of the statistical significant studies.s for best evidence to be interpreted as: ≥4 strong evidence for an association, 2 + 3–0.5 moderate evidence for no association, 0.0 strong evidence for no association.n-significant in BES.
association with PEM. Eating alone was found in four studies (BES:0.67) and provided inconclusive evidence for an association. Forfew friends, living alone, loneliness and the death of a spouse therewas no evidence for an association with PEM (BES: 0.0). Reducedsocial activity, family network, having a partner and social supportwere not included in the best evidence synthesis.
4. Discussion
This review was systematically performed including an eval-
uation of the methodological quality of the selected studies andthe systematic procedures were documented according to thePRISMA Statements (Moher et al., 2009). Poor quality studieswere excluded and only studies with multivariable adjusted risk
R. van der Pols-Vijlbrief et al. / Ageing Research Reviews 18 (2014) 112–131 127
Table 3Determinants (n = 85) excluded based on sum score and number of studies.
SUM # study # sig studies # NS studies SUM points* # sig points* # NS points*
Demographic domainMarital status 2 1 1 3 2 1Ethnicity 2 0 2 2 0 2Race 1 0 1 2 0 2Religion 1 0 1 1 0 1
Financial domainNot enough money for medication 1 1 0 1 1 0Not enough money for food 2 1 1 3 1 2
Food & appetite domainLess meals a day/number of meals 3 2 1 3 2 1Low diet score 1 1 0 1 1 0Severe malnutrition 1 1 0 1 1 0Snacking 1 1 0 1 1 0Eating less 2 1 1 3 1 2Fruit (less intake) 1 0 1 1 0 1Hunger 1 0 1 2 0 2Insufficient fluid/food intake 1 0 1 1 0 1Nutritional/health link 1 0 1 1 0 1Supplement use 1 0 1 2 0 2Tube feeding 1 0 1 1 0 1
Lifestyle domainHigh baseline weight 1 1 0 4 4 0Weight change 1 1 0 2 2 0Trying to lose weight 1 0 1 2 0 2
Psychological domainLoss of interest in life 1 1 0 4 4 0Feeling happy 1 1 0 1 1 0Cutting down things 1 0 1 2 0 2Psychiatric diagnosis 1 0 1 1 0 1Stress 1 0 1 2 0 2
Physical functioning domainWalking stairs difficulty 1 1 0 4 4 0Mobility 1 1 0 4 4 0Drive 1 1 0 1 1 0Falls 1 1 0 1 1 0IADL dependency 2 1 1 2 1 1Institutionalized 1 1 0 1 1 0Traveling with assistance 1 1 0 1 1 0Difficulty preparing meals 2 1 1 3 1 2Difficulty shopping 2 1 1 3 1 2Hearing impairment 2 1 1 3 1 2Frailty 1 0 1 4 0 4Functional vulnerability 1 0 1 4 0 4Not out of house last week 1 0 1 1 0 1Staying in bed 1 0 1 2 0 2
Disease & care domainConstipation 2 2 0 3 3 0Hypertension 2 2 0 3 3 0Disease affecting eating habits 2 2 0 2 2 0Burden of disease 1 1 0 2 2 0Gastrointestinal tract 2 1 1 3 2 1Log TNF-� 1 1 0 2 2 0Parkinson’s disease 2 1 1 3 2 1Anemia 1 1 0 1 1 0Flair up chronic diseases 1 1 0 1 1 0Frequency of care 2 1 1 2 1 1Medications not available 1 1 0 1 1 0Daily pain 1 1 0 1 1 0Pressure ulcers 1 1 0 1 1 0Infection 2 1 1 3 1 2Arthritis 1 0 1 2 0 2Blood diseases 1 0 1 2 0 2Caregiver 1 0 1 1 0 1COPD 1 0 1 2 0 2Diarrhea 1 0 1 1 0 1Doctor visit 1 0 1 1 0 1Emergency at home 1 0 1 1 0 1Emergency unit visit 1 0 1 1 0 1Hip fracture 1 0 1 2 0 2Hospital visits 1 0 1 1 0 1Infection markers (IL-6/TNF�) 1 0 1 2 0 2Musculoskeletal disorders 1 0 1 2 0 2

128 R. van der Pols-Vijlbrief et al. / Ageing Research Reviews 18 (2014) 112–131
Table 3 (Continued )
SUM # study # sig studies # NS studies SUM points* # sig points* # NS points*
Terminal prognosis <6mnd 1 0 1 1 0 1Time since admission 1 0 1 2 0 2Unstable condition 1 0 1 1 0 1Use of formal service 1 0 1 1 0 1Vomiting 1 0 1 1 0 1
Oral functioning domainProbing depth (extent of sites) 1 1 0 4 4 0Chewing pain 1 1 0 2 2 0Low masticator performance 1 1 0 1 1 0Low occlusal force 1 1 0 1 1 0Oral problems swallowing 1 1 0 1 1 0Teeth/Mouth problems 1 1 0 1 1 0Dental Type (edentulous vs. normal) 2 0 2 3 0 3Dry mouth 1 0 1 1 0 1Mouth pain during eating 2 0 2 3 0 3Taste complaints about the food 1 0 1 2 0 2Number of teeth 1 0 1 1 0 1
Social functioning domainReduced social activity 1 1 0 1 1 0Family network 1 0 1 2 0 2Partner (having partner) 1 0 1 4 0 4Social support 2 0 2 2 0 2
× 1 sp
etnctahiwt
dpiwaial(mtswsco2aaa
na(n(cdoc
* Score is calculated based on quality score and design: Cross-sectional/Moderateoints, Longitudinal/High × 4 score points.
stimates were included. We found moderate to strong evidencehat a poor appetite, hospitalization, poor self-reported health,o diabetes, and edentulousness are associated with PEM inommunity-dwelling older adults. Strong evidence for no associa-ion was found for anxiety, chewing difficulty, few friends, livinglone, feeling lonely, death of spouse, high number of diseases,eart failure and coronary failure, stroke (CVA) and the use of anti-
nflammatory medications. There were 85 potential determinantshich could not be included in the best evidence synthesis because
oo few studies of high quality were performed.Poor appetite was the single determinant for which strong evi-
ence for an association with PEM was found. Based on previousrospective work, we assumed that poor appetite would be an
mportant determinant of a low energy intake and subsequenteight loss (Schilp et al., 2011). Poor appetite is an intermedi-
te determinant for PEM, likely causally related, therefore we alsoncluded appetite as part of our outcome PEM. Poor appetite in olderdults is reflected in low energy intakes, and could develop weightoss and a low weight over time that could result in future PEMDonini et al., 2003). We found one study that examined the deter-
inants of a poor appetite. In this study the authors showed thathe determinants of poor appetite are divers and include depres-ion and chewing pain (Lee et al., 2006). This finding is in lineith other studies that showed physiological aspects (i.e. reduced
mell, reduced taste and prolonged feeling of satiety), psychologi-al aspects (i.e. depression or dementia), social aspects (i.e. povertyr isolation) and medical aspects (edentulous, pain) (Kmiec et al.,013; Hays and Roberts, 2006). Older adults with a poor appetitere an important target population for future prevention strategiesiming to prevent PEM and specific focus should be signaling poorppetite in this target population.
There was strong evidence for no association between a highumber of chronic diseases and PEM. Numerous specific diseasesnd disorders for example Chronic Obstructive Pulmonary DiseaseCOPD) and diarrhea were also examined as potential determi-ants, but did not provide a high enough best evidence scorebecause not enough studies, or studies with poor quality) to draw
onclusions. Besides, we were unable to combine these specificiseases into several overarching disease groups as they wereften studied in the same study. As a result many specific diseasesould not be included in the best evidence synthesis. We thereforecore points, Cross-sectional/High × 2 score points, Longitudinal/Moderate × 3 score
cannot exclude that specific, individual diseases may be importantdeterminants of PEM.
There was moderate evidence for an association between hav-ing no diabetes and PEM. This is most likely explained by the factthat people with diabetes are more likely to be obese which is oftencaused by excessive weight gain (Han et al., 2011; Houston et al.,2009; Overweight, 2000). The association between hospitalizationand PEM can be explained by multiple pathways. One is that illnessor acute stress caused by surgery during hospitalization increasesenergy demands. Other likely explanations are physical discom-fort (pain, nausea), compromising food intake, and poor quality offood or food services during hospitalization. In a prospective studyamong 306 older hospitalized patients, Chen et al. found that poorcognitive status, poor oral health, number of medication, poor func-tional status and depressive symptoms were determinants of poornutritional health (defined by 18-item MNA, <17 points) during andshortly after hospitalisation (Chen et al., 2009). In addition, based ona narrative review of the available literature it was concluded thathospitalization could contribute to nutritional deficiencies in olderadults, which was party explained by the medication prescriptionsduring hospitalization (Brownie, 2006). More studies are needed toidentify and target determinants of PEM during hospitalisation.
Several studies in the oral domain concluded that adequate oralhealth care is essential for healthy aging (Bots-van’t Spijker et al.,2006; Liu et al., 2010). We only found moderate evidence for a posi-tive association between edentulousness and PEM. Edentulousnessmay result in difficulty chewing, diminished intake of specific foodsand PEM. The specific oral health measures were included in fewstudies in our review using both subjective and various objec-tive measurements techniques to measure oral health problems.In general, there are mayor discrepancies between self-reportedoral health and clinically determined oral health status and specificdenture problems (Liu et al., 2010). Because of these discrepancies,it was difficult to draw evidence based conclusions of groups orspecific determinants like denture problems, masticatory problemsand teeth problems. More high quality studies with standardizedmeasurements on these potential determinants in the oral domain
are necessary to draw conclusions about their impact on PEM.As this is the first systematic review, we can only compare ourresults with previous narrative reviews on determinants of PEMin community-dwelling older adults. The narrative reviews were

ng Res
pttccimnr
Ct2galiwocPpMPlfift
bwmal>B2wtrmb
wdahsoslafidtaaAhc
nc(
R. van der Pols-Vijlbrief et al. / Agei
erformed in different settings, one in a general older popula-ion and one among acute care patients. Both reviews concludedhat PEM is a multi-factorial problem and that the determinantsould be classified into different domains (i.e. social, physiologi-al, and financial) (Brownie, 2006; Kubrak and Jensen, 2007). Thiss in line with our findings, but the narrative reviews have several
ethodological limitations. The setting of the included studies wasot specified clearly and the selection of studies included in theseeviews was not performed using a systematic approach.
Currently, no gold standard is available to define PEM (Healthouncil of the Netherlands, 2011). PEM is often defined as uninten-ional weight loss or low weight (Health Council of the Netherlands,011). Because there is no gold standard how to measure PEM in aeneral older population, we decided on forehand to include a lowppetite, low energy intake, weight loss, or thinness as measured byow body weight, low BMI, or low mid-upper arm circumference asndicators of PEM. We included weight loss and not unintentional
eight loss as an eligible outcome measure because intentionalityf weight loss is often not reported and more importantly not dis-ernable. It could be argued that a poor appetite reflects the risk ofEM and not its presence. However, anorexia of aging is a highlyrevalent problem in old age (Schilp et al., 2011; Lee et al., 2006;udge et al., 2011; Sullivan et al., 2004), and doubles the risk of
EM (Schilp et al., 2011). Determinants of a poor appetite thereforeikely resemble determinants of PEM. We excluded screening toolsor PEM as outcome measures (Phillips et al., 2010), because thesenstruments include potential determinants of PEM like physicalunctioning, chronic disease and depression, which would overes-imate the role of these potential determinants.
Due to heterogeneity in the measurements and definitions ofoth the determinants and outcomes within the included studies,e could not summarize and weigh the existing evidence using aeta-analysis approach. For example low body weight was defined
s either a BMI <22 kg/m2, <18.5 kg/m2, or <20 kg/m2, and weightoss was defined as >5% over 30 days, >10% over study follow-up or5% in two years (Ikebe et al., 2006; Meijers et al., 2009; Rodriguesarbosa et al., 2010; Sorbye et al., 2008; St-Arnaud-McKenzie et al.,010; Stephen and Janssen, 2010; Weyant et al., 2004). Therefore,e used a best evidence synthesis to describe, grade and summarise
he included heterogeneous studies in a systematically matter. Weecognize that by using this approach, the heterogeneity in deter-inants and outcome measures remains a limitation which cannot
e avoided.Other limitations that could have biased our results, because
e merely included observational studies based on secondaryata analyses, were selection bias, publication bias and incompletedjustments for confounding in some studies. Selection bias couldave occurred because not all relevant studies were indexed in theearch databases, and therefore we could have missed informationn potential determinants. Also, we cannot exclude that studieshowing non-significant findings were more likely not to be pub-ished (publication bias), which could have resulted in strongerssociations for potential determinants. In addition, adjustmentor confounders (or other potential determinants of PEM) var-ed largely between studies. For example Rush et al. studied theeterminants for weight loss and adjusted for age and BMI in mul-ivariate analyses, while St-Arnaud-McKenzie et al. studied thessociation between physical performance and weight loss anddjusted for more than 10 variables including age and BMI (St-rnaud-McKenzie et al., 2010; Rush and Welch, 1996). This couldave resulted in an overestimation or underestimation of statisti-ally significant associations reported in the included studies.
Based on professionals experience and expertise, as well asarrative reviews, we expected several determinants to be asso-iated with PEM, including low income, depression and lonelinessBrownie, 2006; Kubrak and Jensen, 2007). However, in our
earch Reviews 18 (2014) 112–131 129
systematic review we found strong or moderate evidence that thesepotential determinants were not associated with PEM. For somecriteria sufficient evidence from high quality studies was availablethat indicated no association with PEM (i.e. living alone, chewingdifficulties and alcohol use). These examples show that there is atendency to ‘know’ the determinants for PEM, while the evidencebased on the available literature does not confirm all expectedassociations.
In conclusion, this review shows that PEM is a multi-factorialproblem and that different domains likely play a role in the path-way of developing PEM. There are many potential determinants ofPEM, but for most determinants evidence is still insufficient or lack-ing. Of the identified evidence based determinants in this review,several are potentially modifiable determinants (i.e. poor appetite,edentulousness) which provide opportunities for new preventionstrategies in the home situation. The preventive strategies shouldtarget these underlying determinants in a multidisciplinary way,rather than treating PEM with nutritional supplements or dieteticadvices solely. Research should focus on the identification and con-firmation of potentially modifiable determinants of PEM amongcommunity-dwelling older adults to provide guidance in develop-ing future preventive strategies.
Author contributions
RvdP conducted the literature searches, screened all the refer-ences on title and abstract, full text on relevant studies, conducteda quality assessment and a data-extraction of the included studiesand wrote the manuscript. HW and LS both screened part of the ref-erences on title and abstract, full text on relevant studies, conducteda quality assessment and contributed to the overall manuscript andthe final draft. MV provided conceptualization of the study, wasconsulted when no consensus between the two reviewers (RvdPand HW or LS) could be obtained and contributed to the over-all manuscript and the final draft. CT edited the manuscript andprovided methodological expertise in the conceptualization of thestudy.
Sources of support
This study was funded by The Netherlands Organization forHealth Research and Development (ZonMw), Project number:200320004.
Acknowledgements
The authors would like to thank the Ilse Jansma (librarian) forher help with the extensive search.
References
Agostini, J.V., Han, L., Tinetti, M.E., 2004. The relationship between number of med-ications and weight loss or impaired balance in older adults. J. Am. Geriatr. Soc.52 (10), 1719–1723, PubMed PMID: 1991.
Alley, D.E., Koster, A., Mackey, D., Cawthon, P., Ferrucci, L., Simonsick, E.M., et al.,2010. Hospitalization and change in body composition and strength in apopulation-based cohort of older persons. J. Am. Geriatr. Soc. 58 (Nov (11)),2085–2091, PubMed PMID: 21054288. Pubmed Central PMCID: PMC3059115.Epub 2010/11/09. eng.
Barreto, S.M., Passos, V.M.A., Lima-Costa, M.F., 2003. Obesity and underweightamong Brazilian elderly: the Bambui Health and Aging Study (Cadernos de sa?dep?blica/Minist?rio da Sa?de, Funda??o Oswaldo Cruz). Escola Nacional de Sa?deP?blica. 19 (2), 605–612, PubMed PMID: 2332.
Bots-van’t Spijker, P.C., Wierink, C.D., de Bast, C., 2006. [Active oral health care forfrail elderly people, An increasing responsibility]. Ned. Tijdschr. Tandheelkd.
113 (May (5)), 197–201, PubMed PMID: 16729565. Proactieve mondzorg vooronzelfredzame ouderen. Een toenemende verantwoordelijkheid.Brownie, S., 2006. Why are elderly individuals at risk of nutritional deficiency? Int. J.Nurs. Pract. 12 (Apr (2)), 110–118, PubMed PMID: 16529597. Epub 2006/03/15.eng.

1 ng Res
C
C
d
D
D
D
D
F
F
F
F
G
G
G
H
H
H
H
H
H
H
I
J
K
K
K
30 R. van der Pols-Vijlbrief et al. / Agei
hapman, I.M., Visvanathan, R., Hammond, A.J., Morley, J.E., Field, J.B., Tai, K., et al.,2009. Effect of testosterone and a nutritional supplement, alone and in combi-nation, on hospital admissions in undernourished older men and women. Am.J. Clin. Nutr. 89 (Mar (3)), 880–889, PubMed PMID: 19144729.
hen, C.C., Tang, S.T., Wang, C., Huang, G.H., 2009. Trajectory and determinants ofnutritional health in older patients during and six-month post-hospitalisation.J. Clin. Nurs. 18 (Dec (23)), 3299–3307, PubMed PMID: 19735335. Epub2009/09/09. eng.
e Hollander, E.L., Van Zutphen, M., Bogers, R.P., Bemelmans, W.J., De Groot, L.C.,2012. The impact of body mass index in old age on cause-specific mortality.J. Nutr. Health Aging 16 (Jan (1)), 100–106, PubMed PMID: 22238008. Epub2012/01/13. eng.
ean, M., Raats, M.M., Grunert, K.G., Lumbers, M., 2009. Factors influencing eatinga varied diet in old age. Public Health Nutr. 12 (Dec (12)), 2421–2427, PubMedPMID: 19344544. Epub 2009/04/07. eng.
onini, L.M., Savina, C., Cannella, C., 2003. Eating habits and appetite control inthe elderly: the anorexia of aging. Int. Psychogeriatr./IPA 15 (Mar (1)), 73–87,PubMed PMID: 12834202.
onkin, A.J., Johnson, A.E., Morgan, K., Neale, R.J., Lilley, J.M., 1998. The interaction ofphysical, psychological, socioeconomic and sociodemographic variables on thebody mass index (MINDEX) of the community-dwelling elderly. J. Nutr., HealthAging 2 (3), 143–148, PubMed PMID: 2872.
ziura, J., De Leon, C.M., Kasl, S., DiPietro, L., 2004. Can physical activity attenuateaging-related weight loss in older people? The Yale Health and Aging study,1982–1994. Am. J. Epidemiol. 159 (8), 759–767, PubMed PMID: 7061.
agerstrom, C., Palmqvist, R., Carlsson, J., Hellstrom, Y., 2011. Malnutrition and cog-nitive impairment among people 60 years of age and above living in regularhousing and in special housing in Sweden: a population-based cohort study. Int.J. Nurs. Stud. 48 (Jul (7)), 863–871, PubMed PMID: 21316673. Epub 2011/02/15.eng.
eart, C., Jutand, M.A., Larrieu, S., Letenneur, L., Delcourt, C., Combe, N., et al.,2007. Energy, macronutrient and fatty acid intake of French elderly communitydwellers and association with socio-demographic characteristics: data from theBordeaux sample of the Three-City Study. Br. J. Nutr. 98 (5), 1046–1057, PubMedPMID: 1198.
eldblum, I., German, L., Castel, H., Harman-Boehm, I., Bilenko, N., Eisinger, M., et al.,2007. Characteristics of undernourished older medical patients and the iden-tification of predictors for undernutrition status. Nutr. J. 6, 37, PubMed PMID:17980023. eng.
reijer, K., Tan, S.S., Koopmanschap, M.A., Meijers, J.M., Halfens, R.J., Nuijten, M.J.,2013. The economic costs of disease related malnutrition. Clin. Nutr. (Edinb.,Scotland) 32 (Feb (1)), 136–141, PubMed PMID: 22789931. Epub 2012/07/14.eng.
arssen, J., Harmsen, C., 2011. Ouderen Wonen Steeds Langer Zelfstandig.CBS, Den Haag/Heerlen, Available from: 〈http://www.nationaalkompas.nl/bevolking/vergrijzing/huidig/〉.
omes, B., Higginson, I.J., 2006. Factors influencing death at home in terminallyill patients with cancer: systematic review. BMJ 332 (Mar (7540)), 515–521,PubMed PMID: 16467346. Pubmed Central PMCID: 1388126. Epub 2006/02/10.eng.
osney, M., 2003. Are we wasting our money on food supplements in elder carewards? J. Adv. Nurs. 43 (Aug (3)), 275–280, PubMed PMID: 12859786.
alfens, R.J., Meijers, J.M., Du Moulin, M.F., Van Nie, N.C., Neyens, J.C., Schols, J.M.,2010. Dutch National Prevalence Survey of Care Problems (LPZ) 2010. MaastrichtUniversity, Maastricht.
an, Y., Li, S., Zheng, Y., 2009. Predictors of nutritional status among community-dwelling older adults in Wuhan, China. Public Health Nutr. 12 (Aug (8)),1189–1196, PubMed PMID: 18789169. eng.
an, T.S., Tajar, A., Lean, M.E., 2011. Obesity and weight management in the elderly.Br. Med. Bull. 97, 169–196, PubMed PMID: 21325341. Epub 2011/02/18. eng.
ayden, J.A., Cote, P., Bombardier, C., 2006. Evaluation of the quality of prognosisstudies in systematic reviews. Ann. Intern. Med. 144 (Mar (6)), 427–437, PubMedPMID: 16549855.
ays, N.P., Roberts, S.B., 2006. The anorexia of aging in humans. Physiol. Behav. 88(Jun (3)), 257–266, PubMed PMID: 16769094. Epub 2006/06/14. eng.
ealth Council of the Netherlands, 2011. Malnutrition in the Elderly. Health Councilof the Netherlands, The Hague.
ouston, D.K., Nicklas, B.J., Zizza, C.A., 2009. Weighty concerns: the growingprevalence of obesity among older adults. J. Am. Diet. Assoc. 109 (Nov (11)),1886–1895, PubMed PMID: 19857630. Epub 2009/10/28. eng.
kebe, K., Matsuda, K.I., Morii, K., Nokubi, T., Ettinger, R.L., 2006. The relation-ship between oral function and body mass index among independently livingolder Japanese people. Int. J. Prosthodont. 19 (6), 539–546, PubMed PMID:1355.
ohansson, Y., Bachrach-Lindstrom, M., Carstensen, J., Ek, A.C., 2009. Malnutrition in ahome-living older population: prevalence, incidence and risk factors. A prospec-tive study. J. Clin. Nurs. 18 (May (9)), 1354–1364, PubMed PMID: 19077017.eng.
aiser, M.J., Bauer, J.M., Ramsch, C., Uter, W., Guigoz, Y., Cederholm, T., et al., 2009.Validation of the Mini Nutritional Assessment short-form (MNA-SF): a practicaltool for identification of nutritional status. J. Nutr. Health Aging Nov (13) (9),
782–788, PubMed PMID: 19812868. Epub 2009/10/09. eng.eller, H.H., Ostbye, T., Bright-See, E., 1997. Predictors of dietary intake in Ontarioseniors. Can. J. Public Health 88 (5), 305–309, PubMed PMID: 3281.
eller, H.H., Hedley, M.R., Wong Brownlee, S., 2000. The development of seniors inthe community: risk evaluation for eating and nutrition (SCREEN). Can. J. Diet.
earch Reviews 18 (2014) 112–131
Pract. Res. 61 (Summer (2)), 67–72 (a publication of Dietitians of Canada = Revuecanadienne de la pratique et de la recherche en dietetique: une publication desDietetistes du Canada) PubMed PMID: 11551350.
Keller, H.H., Goy, R., Kane, S.L., 2005. Validity and reliability of SCREEN II (seniors inthe community: risk evaluation for eating and nutrition, Version II). Eur. J. Clin.Nutr. 59 (Oct (10)), 1149–1157, PubMed PMID: 16015256.
Kmiec, Z., Petervari, E., Balasko, M., Szekely, M., 2013. Anorexia of aging. Vitam.Horm. 92, 319–355, PubMed PMID: 23601431.
Kubrak, C., Jensen, L., 2007. Malnutrition in acute care patients: a narrative review.Int. J. Nurs. Stud. 44 (Aug (6)), 1036–1054, PubMed PMID: 16996065. Epub2006/09/26. eng.
Lee, J.S., Kritchevsky, S.B., Tylavsky, F., Harris, T., Simonsick, E.M., Rubin, S.M., et al.,2005. Weight change, weight change intention, and the incidence of mobilitylimitation in well-functioning community-dwelling older adults. J. Gerontol. 60(Aug (8)), 1007–1012, PubMed PMID: 16127104. Epub 2005/08/30. eng.
Lee, J.S., Kritchevsky, S.B., Tylavsky, F., Harris, T.B., Ayonayon, H.N., Newman,A.B., 2006. Factors associated with impaired appetite in well-functioningcommunity-dwelling older adults. J. Nutr. Elder. 26 (1–2), 27–43, PubMed PMID:17890202. Epub 2007/09/25. eng.
Lievense, A.M., Bierma-Zeinstra, S.M., Verhagen, A.P., van Baar, M.E., Verhaar, J.A.,Koes, B.W., 2002. Influence of obesity on the development of osteoarthritis ofthe hip: a systematic review. Rheumatology (Oxford) 41 (Oct (10)), 1155–1162,PubMed PMID: 12364636. Epub 2002/10/05. eng.
Liu, H., Maida, C.A., Spolsky, V.W., Shen, J., Li, H., Zhou, X., et al., 2010. Calibra-tion of self-reported oral health to clinically determined standards. CommunityDent. Oral Epidemiol. 38 (Dec (6)), 527–539, PubMed PMID: 21054482. PubmedCentral PMCID: Pmc3058231. Epub 2010/11/09. eng.
Locher, J.L., Robinson, C.O., Roth, D.L., Ritchie, C.S., Burgio, K.L., 2005. The effect ofthe presence of others on caloric intake in homebound older adults. J. Gerontol.Ser. A; Biol. Sci. Med. Sci. 60A (11), 1475–1478, PubMed PMID: 11575.
Locher, J.L., Roth, D.L., Ritchie, C.S., Cox, K., Sawyer, P., Bodner, E.V., et al., 2007. Bodymass index, weight loss, and mortality in community-dwelling older adults. J.Gerontol. Dec (62) (12), 1389–1392, PubMed PMID: 18166690. eng.
Locher, J.L., Ritchie, C.S., Robinson, C.O., Roth, D.L., Smith West, D., Burgio, K.L., 2008. Amultidimensional approach to understanding under-eating in homebound olderadults: the importance of social factors. Gerontologist 48 (2), 223–234, PubMedPMID: 836.
Mamhidir, A.G., Ljunggren, G., Kihlgren, M., Kihlgren, A., Wimo, A., 2006. Under-weight, weight loss and related risk factors among older adults in shelteredhousing—a Swedish follow-up study. J. Nutr., Health Aging 10 (4), 255–262,PubMed PMID: 8458.
Margetts, B.M., Thompson, R.L., Elia, M., Jackson, A.A., 2003. Prevalence of risk ofundernutrition is associated with poor health status in older people in the UK.Eur. J. Clin. Nutr. 57 (Jan (1)), 69–74, PubMed PMID: 12548299. eng.
Marshall, J.A., Lopez, T.K., Shetterly, S.M., Morgenstern, N.E., Baer, K., Swenson, C.,et al., 1999. Indicators of nutritional risk in a rural elderly Hispanic and non-Hispanic white population: San Luis Valley Health and Aging Study. J. Am. Diet.Assoc. 99 (3), 315–322, PubMed PMID: 3124.
Martin, C.T., Kayser-Jones, J., Stotts, N.A., Porter, C., Froelicher, E.S., 2007. Risk for lowweight in community-dwelling, older adults. Clin. Nurse Spec. CNS 21 (Jul–Aug(4)), 203–211, quiz 12-3. PubMed PMID: 17622809. eng.
Martyn, C.N., Winter, P.D., Coles, S.J., Edington, J., 1998. Effect of nutritional statuson use of health care resources by patients with chronic disease living in thecommunity. Clin. Nutr. (Edinb., Scotland) 17 (Jun (3)), 119–123, PubMed PMID:10205328.
McMurdo, M.E., Price, R.J., Shields, M., Potter, J., Stott, D.J., 2009. Should oral nutri-tional supplementation be given to undernourished older people upon hospitaldischarge? A controlled trial. J. Am. Geriatr. Soc. 57 (Dec (12)), 2239–2245,PubMed PMID: 19925613. Epub 2009/11/21. eng.
Meijers, J.M.M., Schols, J.M.G.A., van Bokhorst-de van der Schueren, M., Dassen,T., Janssen, M.A.P., Halfens, R.J.G., 2009. Malnutrition prevalence in TheNetherlands: results of the annual dutch national prevalence measurement ofcare problems. Br. J. Nutr. 101 (3), 417–423, PubMed PMID: 818.
Meijers, J.M., van Bokhorst-de van der Schueren, M.A., Schols, J.M., Soeters, P.B.,Halfens, R.J., 2010. Defining malnutrition: mission or mission impossible? Nutri-tion 26 (Apr (4)), 432–440, PubMed PMID: 19954929.
Miller, M., Daniels, L., 2000. Nutritional risk factors and dietary intake in older adultswith Parkinson’s disease attending community-based therapy groups. Aust. J.Nutr. Diet. 57 (3), 152–158, PubMed PMID: 11712.
Milne, A.C., Potter, J., Vivanti, A., Avenell, A., 2009. Protein and energy supplemen-tation in elderly people at risk from malnutrition. Cochrane Database Syst. Rev.(2), CD003288, PubMed PMID: 19370584.
Moher, D., Liberati, A., Tetzlaff, J., Altman, D.G., 2009. Preferred reporting items forsystematic reviews and meta-analyses: the PRISMA statement. BMJ 339, b2535.
Mosby, 2009. Mosby’s Medical Dictionary, eighth ed. Elsevier, St. Louis.Mudge, A.M., Ross, L.J., Young, A.M., Isenring, E.A., Banks, M.D., 2011. Helping
understand nutritional gaps in the elderly (HUNGER): a prospective study ofpatient factors associated with inadequate nutritional intake in older medicalinpatients. Clin. Nutr. (Edinb., Scotland) 30 (Jun (3)), 320–325, PubMed PMID:21262553. Epub 2011/01/26. eng.
Neelemaat, F., Bosmans, J.E., Thijs, A., Seidell, J.C., van Bokhorst-de van der Schueren,
M.A., 2011. Post-discharge nutritional support in malnourished elderly indi-viduals improves functional limitations. J. Am. Med. Dir. Assoc. 12 (May (4)),295–301, PubMed PMID: 21527171. Epub 2011/04/30. eng.Oosterom-Calo, R., van Ballegooijen, A.J., Terwee, C.B., Te Velde, S.J., Brouwer, I.A.,Jaarsma, T., et al., 2012. Determinants of adherence to heart failure medication:

ng Res
N
P
P
P
R
R
R
R
R
S
S
S
S
S
S
S
S
R. van der Pols-Vijlbrief et al. / Agei
a systematic literature review. Heart Fail Rev. (Jun), PubMed PMID: 22723048.Epub 2012/06/23. Eng.
ational Task Force on the Prevention and Treatment of Obesity, 2000. Overweight,obesity, and health risk. Arch. Intern. Med. 160 (Apr (7)), 898–904, PubMedPMID: 10761953. Epub 2000/04/13. eng.
ayette, H., Gray-Donald, K., Cyr, R., Boutier, V., 1995. Predictors of dietary intakein a functionally dependent elderly population in the community. Am. J. PublicHealth 85 (May (5)), 677–683, PubMed PMID: 7733428. eng.
ersson, M., Hytter-Landahl, A., Brismar, K., Cederholm, T., 2007. Nutritional supple-mentation and dietary advice in geriatric patients at risk of malnutrition. Clin.Nutr. (Edinb., Scotland) 26 (Apr (2)), 216–224, PubMed PMID: 17275141. Epub2007/02/06. eng.
hillips, M.B., Foley, A.L., Barnard, R., Isenring, E.A., Miller, M.D., 2010. Nutritionalscreening in community-dwelling older adults: a systematic literature review.Asia Pac. J. Clin. Nutr. 19 (3), 440–449.
abadi, M.H., Coar, P.L., Lukin, M., Lesser, M., Blass, J.P., 2008. Intensive nutritionalsupplements can improve outcomes in stroke rehabilitation. Neurology 71 (Dec(23)), 1856–1861, PubMed PMID: 18946003. Epub 2008/10/24. eng.
itchie, C.S., Burgio, K.L., Locher, J.L., Cornwell, A., Thomas, D., Hardin, M., et al.,1997. Nutritional status of urban homebound older adults. Am. J. Clin. Nutr. 66(4), 815–818, PubMed PMID: 12003.
itchie, C.S., Joshipura, K., Silliman, R.A., Miller, B., Douglas, C.W., 2000. Oral healthproblems and significant weight loss among community-dwelling older adults.J. Gerontol. 55 (7), M366–M371, PubMed PMID: 2905.
odrigues Barbosa, A., da Silva Coqueiro, R., Ferreti Borgatto, A., 2010. Nutritionalstatus, health conditions and socio-demographic factors in the elderly of havana,cuba: data from sabe survey. J. Nutr., Health Aging 14 (10), 803–808.
ush, D., Welch, K., 1996. The first year of hyperinflation in the former Soviet Union:nutritional deprivation among elderly pensioners, 1992. Am. J. Public Health 86(3), 361–367, PubMed PMID: 5406.
chilp, J., Wijnhoven, H.A., Deeg, D.J., Visser, M., 2011. Early determinants for thedevelopment of undernutrition in an older general population: LongitudinalAging Study Amsterdam. Br. J. Nutr. 106 (Sep (5)), 708–717, PubMed PMID:21450117.
chilp, J., Kruizenga, H.M., Wijnhoven, H.A., Leistra, E., Evers, A.M., van Binsbergen,J.J., et al., 2012. High prevalence of undernutrition in Dutch community-dwellingolder individuals. Nutrition 28 (Nov–Dec (11–12)), 1151–1156, PubMed PMID:22749873.
chilp, J., Kruizenga, H.M., Wijnhoven, H.A., van Binsbergen, J.J., Visser, M., 2013.Effects of a dietetic treatment in older, undernourished, community-dwellingindividuals in primary care: a randomized controlled trial. Eur. J. Nutr. (Jan),PubMed PMID: 23361389.
hahar, D., Shai, I., Vardi, H., Fraser, D., 2003. Dietary intake and eating patterns ofelderly people in Israel: who is at nutritional risk? Eur. J. Clin. Nutr. 57 (1), 18–25,PubMed PMID: 2419.
hahar, D.R., Yu, B., Houston, D.K., Kritchevsky, S.B., Lee, J.S., Rubin, S.M., et al., 2009.Dietary factors in relation to daily activity energy expenditure and mortalityamong older adults. J. Nutr. Health Aging 13 (May (5)), 414–420, PubMed PMID:19390747. Pubmed Central PMCID: PMC2757288. Epub 2009/04/25. eng.
hatenstein, B., Kergoat, M.J., Nadon, S., 2001. Weight change, nutritional risk and itsdeterminants among cognitively intact and demented elderly Canadians. Can. J.Public Health 92 (2), 143–149, PubMed PMID: 2770.
lavin, R.E., 1995. Best evidence synthesis: an intelligent alternative to meta-analysis. J. Clin. Epidemiol. 48 (Jan (1)), 9–18, PubMed PMID: 7853053. Epub
1995/01/01. eng.orbye, L.W., Schroll, M., Finne Soveri, H., Jonsson, P.V., Topinkova, E., Ljunggren, G.,et al., 2008. Unintended weight loss in the elderly living at home: the aged inHome Care Project (AdHOC). J. Nutr., Health Aging 12 (1), 10–16, PubMed PMID:1007.
earch Reviews 18 (2014) 112–131 131
Starke, J., Schneider, H., Alteheld, B., Stehle, P., Meier, R., 2011. Short-term individualnutritional care as part of routine clinical setting improves outcome and qualityof life in malnourished medical patients. Clin. Nutr. (Edinb., Scotland) 30 (Apr(2)), 194–201, PubMed PMID: 20937544. Epub 2010/10/13. eng.
St-Arnaud-McKenzie, D., Payette, H., Gray-Donald, K., 2010. Low physical functionpredicts either 2-year weight loss or weight gain in healthy community-dwelling older adults. the NuAge Longitudinal Study. J. Gerontol. 65 (12),1362–1368.
Stephen, W.C., Janssen, I., 2010. Influence of physical activity on age-related weightloss in the elderly. J. Phys. Act Health 7 (1), 78–86.
Sullivan, D.H., Morley, J.E., Johnson, L.E., Barber, A., Olson, J.S., Stevens, M.R., et al.,2002. The GAIN (Geriatric Anorexia Nutrition) registry: the impact of appetiteand weight on mortality in a long-term care population. J. Nutr. Health Aging 6(4), 275–281, PubMed PMID: 12486448. Epub 2002/12/18. eng.
Sullivan, D.H., Johnson, L.E., Bopp, M.M., Roberson, P.K., 2004. Prognostic significanceof monthly weight fluctuations among older nursing home residents. J. Geron-tol. 59 (Jun (6)), M633–M639, PubMed PMID: 15215284. Epub 2004/06/25.eng.
Suominen, M., Muurinen, S., Routasalo, P., Soini, H., Suur-Uski, I., Peiponen, A., et al.,2005. Malnutrition and associated factors among aged residents in all nurs-ing homes in Helsinki. Eur. J. Clin. Nutr. 59 (Apr (4)), 578–583, PubMed PMID:15744328. eng.
Thomas, D.R., Zdrowski, C.D., Wilson, M.M., Conright, K.C., Lewis, C., Tariq, S., et al.,2002. Malnutrition in subacute care. Am. J. Clin. Nutr. 75 (Feb (2)), 308–313,PubMed PMID: 11815323. eng.
Waterlow, J.C., 1972. Classification and definition of protein–calorie malnutrition.Br. Med. J. 3 (Sep (5826)), 566–569, PubMed PMID: 4627051. Pubmed CentralPMCID: 1785878.
Weekes, C.E., Emery, P.W., Elia, M., 2009. Dietary counselling and food fortificationin stable COPD: a randomised trial. Thorax 64 (Apr (4)), 326–331, PubMed PMID:19074931. Epub 2008/12/17. eng.
Weyant, R.J., Newman, A.B., Kritchevsky, S.B., Bretz, W.A., Corby, P.M., Ren, D., et al.,2004. Periodontal disease and weight loss in older adults. J. Am. Geriatr. Soc. 52(4), 547–553, PubMed PMID: 2131.
White, J.V., Guenter, P., Jensen, G., Malone, A., Schofield, M., Academy MalnutritionWork, G., et al., 2012. Consensus statement: Academy of Nutrition and Dietet-ics and American Society for Parenteral and Enteral Nutrition: characteristicsrecommended for the identification and documentation of adult malnutrition(undernutrition). JPEN J. Parenteral Enteral Nutr. 36 (May (3)), 275–283, PubMedPMID: 22535923.
Wijnhoven, H.A., van Bokhorst-de van der Schueren, M.A., Heymans, M.W., de Vet,H.C., Kruizenga, H.M., Twisk, J.W., et al., 2010. Low mid-upper arm circumfer-ence, calf circumference, and body mass index and mortality in older persons. J.Gerontol. 65 (Oct (10)), 1107–1114, PubMed PMID: 20547497. Pubmed CentralPMCID: PMC3304296. Epub 2010/06/16. eng.
Wijnhoven, H.A., Schilp, J., van Bokhorst-de van der Schueren, M.A., de Vet, H.C.,Kruizenga, H.M., Deeg, D.J., et al., 2012. Development and validation of criteriafor determining undernutrition in community-dwelling older men and women:the short nutritional assessment questionnaire 65+. Clin. Nutr. (Edinb., Scotland)31 (Jun (3)), 351–358, PubMed PMID: 22119209.
Wyers, C.E., Reijven, P.L., Evers, S.M., Willems, P.C., Heyligers, I.C., Verburg, A.D.,et al., 2013. Cost-effectiveness of nutritional intervention in elderly subjectsafter hip fracture. A randomized controlled trial. Osteoporos Int. 24 (Jan (1)),151–162, PubMed PMID: 22638708. Pubmed Central PMCID: Pmc3536976.
Epub 2012/05/29. eng.Xing, D., Ma, J.X., Ma, X.L., Song, D.H., Wang, J., Chen, Y., et al., 2012. A methodological,systematic review of evidence-based independent risk factors for surgical siteinfections after spinal surgery. Eur. Spine J. (Sep), PubMed PMID: 23001381.Epub 2012/09/25. Eng.