ageing of zink alloys
TRANSCRIPT

International Foundry Research 64 (2011) No. 12
2.3 Advantages of zinc alloys
A big advantage of zinc alloys is the low melting tempera-ture below 400 °C. As a result cooling and cycle times are very short. In addition the life of die casting dies lies in the range of one million and more shots exceeding the values for aluminum by the factor of ten.
As an disadvantage the creep already starts at room tem-perature at loads exceeding 50 MPa. The very high mechan-ical properties diminish within one year and also measured data of parts change.
2.4 Usage of Zinc
In 2007 more than 11 million tons of zinc have been used worldwide, most of it for corrosion protection, zinc die cast-ings and alloying of copper (Figure 3).
The usage of zinc in automotive application increases and a passenger car already includes more than 10 kg of zinc [5].
2.5 Literature
Until today there are few data available for ageing of zinc al-loys most of them deal with measure changes (Figure 4). In [6] describes the solubility of Al in Zn and the eutectoid phase change of the b-phase into b´-Phase. The addition of copper increases the solubility of Al. The measure changes describe [8, 9], especially Z430 contracts more than Z400 or Z 410 [8, 10]. To get around the measure changes the automotive in-dustry suggests to heat treat the parts at 105 °C for 24 hours.
Zinc alloys change also their mechanical properties with time [11, 12]. A comparison between artificial and natural ageing is given in [13]. An improved creep resistance is based on the copper rich e-phase, however the production condi-tions under which the specimens have been produced are not available in the literature [14, 15].
Ageing processes:Basically all alloys undergo ageing as the solubility in the liquid phase differs from the solid phase. Zinc alloys age al-ready at room temperature as diffusion at room temperature is relatively high due to the low melting point of zinc (Fig-ure 5).
1 IntroductionHot chamber die casting is a highly productive production technology for zinc parts of highest quality. Main custom-ers are manufactures of cars, furniture and other mechani-cal parts. Although zinc alloys have a rather high density of 6.7 g/cm³ they are used in automotive applications due to their high mechanical properties, thin wall thicknesses and their plating properties. Zinc parts can be recycled 100 %.
The low melting temperature of 390 °C leads to an in-creased creep rate. In addition, zinc alloys loose mechani-cal properties over time due to ageing effects. The natural ageing is typically compensated by artificial ageing. The parts are tested typically between -35 °C and +85 °C as these are the temperatures used in automotive applications.
Until today only few statistical reliable data have been published on these temper-ate ranges.
2 State of the knowledge
2.1 Chemical composition of the die casting alloys
The chemical composition of the zinc alloys influences the fluidity, the mechanical properties, the feeding properties and the structure. For most of the parts ZP0410 (Z410) with 4 wt % aluminum and 1 wt % copper is used. Besides the al-loys ZP0430 (Z430) and ZP0400 (Z400) are used. All of these alloys are hyper eutectic alloys with small amounts of Pb, Cd, Sn, Fe, Ni and Si. The melting temperatures are below 400 °C.
The phase diagram of aluminum-zinc (Figure 1) shows an extremely low solubility of zinc in aluminum and vice versa.
Copper which is typically used between 0.3 and 3 wt % increases the solubility of aluminum in zinc (Figure 2) and therefore increases the strengthening effect.
2.2 Zinc die casting alloys
Worldwide only four alloys are used which are described in the European Norm EN12844. Table 1 shows the alloy elements in these alloys. In row 3 of this table the measured composition of the alloys used in this research are shown.
Ageing of Zink AlloysGoal of the research was the investigation of the material properties of zinc alloys under natu-ral and artificial ageing to find a correlation between artificial and natural ageing. As zinc die castings are produced under a variety of production conditions it was necessary to produce test castings using different parameters under extremely controlled conditions.
Lothar H. Kallien and Walter Leis, Aalen, Germany
Manuscript received 2 September 2010; accepted 4 November 2010
Casting alloys, behaviour

3
Casting alloys, behaviour
International Foundry Research 64 (2011) No. 1
- fatigue data at RT;- density;- hardness;- creep behavior.
Process parameters have been varied (Figure 8):- wall thickness: 0.8 mm, 1.5 mm and 3.0 mm;- gate velocity: 25 m/s, 40 m/s and 55 m/s;- die temperatures: 120 °C, 160 °C and 200 °C.
The influence of the natural ageing has been tested after 3 and 6 weeks, 3 and 6 months and after 1 year. After 2 years a last measurement will be conducted.
The artificial ageing was carried out using a 24 hour tem-pering at 65 °C, 85 °C and 105 °C.
DOE:To reduce the amount of run DOE was used using Design-Expert 7 by Stat-Ease. The design of the plan included cen-ter point conditions 1.5 mm wall thicknesses, 160 °C die temperature and 40 m/s gate velocity.
3.2 Die casting machine Frech DAW 80
A newly updated hot chamber machine with 200 tons lock-ing force has been used to produce the test specimen.Measure data were piston velocity, pressure, internal die pres-sure and temperature (Figures 9 and 10).
Plate size was 50 mm by 150 mm with the volumes, showed in Table 2. Piston diameter was dK = 60 mm; the gate area was 0.41 cm². The piston velocities and the resulting fill times are shown in Tables 3 and 4. The solidification time is calculated after Chworinoffs equation (Table 5). Af-ter production the plates were frozen to -20 °C (Figure 11).
3.3 Ageing
Artificial ageing:Five specimens have been aged at +65 °C, +85 °C and +105 °C for 24 hours.
Natural Ageing: Natural Ageing was performed at room temperature in a cli-mate controlled room where also the measuring took place (Figure 12).
3.4 Mechanical data
3.4.1 Tensile testing
Test equipment:The tensile test machine is a 100 kN Universal „Schenck“ with modern computerized control (Figure 13). The speci-mens have been tested under as cast conditions, naturally aged condition and artificially aged condition under three test temperatures.
The tests at +85 °C and -35 °C are executed in a climate chamber. The cooling of the probes is performed using CO2-gas. Control was done using a thermocouple.
Stress-strain diagram:More than 3000 specimen have been tested. For each probe the stress-strain-diagram is available indicating the test con-ditions and the production conditions (Figure 14).
2.6 Creep processes
Creep is plastic deformation under load caused by atom movements without concentration differences. Creep is al-so evident at pure metals. A typical creep curve is depicted in Figure 6.
Technical important is the phase of stationary creep. The creep rate is a function of the mechanical load and the tem-perature and the diffusion [1] provides the following equa-tion:
(1)
A coefficient of creep in 1/s (%/h)s …G shear modulus in MPak ….n …T temperatureQ …
For the most materials creep is related to the liquidus tem-perature Tl:
0.6 < T/Tl < 1 fast creep0.3-0.4 < T/Tl < 0.6 slow creep 0 < T/Tl < 0.3 no creep
Comparison Al and Zn:The low melting point of Zn of 420 °C (693 K) causes slow creep at 0 °C which increases at room temperature. Figure 7 shows the differences between temperature and creep for Al and Zn.
Creep is proportional to the mechanical load when the diffusion is only caused along grain boundaries. Then equa-tion (2) describes the creep rate:
(2)
3 Experiments
3.1 Experimental program
The experiments have been carried out for ZP0400, ZP0410 and ZP0430 according to DIN EN 12844.
To analyze the mechanical properties die cast plates have been cast with thicknesses of 0.8 mm, 1.5 mm and 3 mm us-ing a hot chamber die casting machine Type DAW 80 by Frech.
From these plates probes have been machined for the ten-sile test according to DIN 50125. A variety of casting param-eters have been used to cover all different die cast parts.
Sensors for pressures and temperatures within the ma-chine and within the die have been used to control the pro-cess during test part production.
The following material properties have been investigat-ed using as cast probes, artificially aged probes and natural-ly aged probes:- yield strength, tensile strength, elongation and Young’s modulus;- at testing temperatures; - -35 °C, RT (room temperature) and +85 °C;- creep rate at RT and 85 °C;
TkQn
s eG
A ⋅−
⋅⎟⎠⎞
⎜⎝⎛ σ⋅=ε
TkQ
s eG
A ⋅−
⋅⎟⎠⎞
⎜⎝⎛ σ⋅=ε

4
Casting alloys, behaviour
International Foundry Research 64 (2011) No. 1
Figure 1: Phase diagram zinc – aluminum [1]
Figure 2: Ternary system Zn – Al – Cu and positions of zinc die casting alloys [2]
Figure 3: Usage of zinc [4]
Figure 4: Dimension-al stability of zinc die casting parts at room temperature (ageing time: 5.5 years; die temperature: 180 °C; quenching: air) [7]

5
Casting alloys, behaviour
International Foundry Research 64 (2011) No. 1
Figure 5: Natural ageing (left) and artificial ageing (right) as a function of copper content
Figure 7: Homologue temperature for zinc and aluminumFigure 6: Typical creep curve
3 die temperatures
3 gate velocities
3 wall thicknesses
3 alloys
3 testing temperatures
11 ageing conditions
3 die temperatures
3 gate velocities
3 wall thicknesses
3 alloys
3 testing temperatures
11 ageing conditions
Figure 8: Varied process param-eters Figure 9: Position of the thermocouple 2 mm under the surface

6
Casting alloys, behaviour
International Foundry Research 64 (2011) No. 1
Figure 10: Position of the ejector pins with load sensors
60
10
15
150
Figure 11: Geometry of the specimens for static tensile tests
Figure 12: Boxes for the specimens for natural ageing (23 °C, room air conditioned)

7
Casting alloys, behaviour
International Foundry Research 64 (2011) No. 1
Figure 14: Stress-strain-curve run 23 (3 mm; 160 °C; 40 m/s) mea-sured in as cast condi-tion at RT (23 °C)
Figure 13: Upgraded tensile testing machine
Figure 15: Stress-strain-curve measured in as cast condition (sample thickness 3 mm)

8
Casting alloys, behaviour
International Foundry Research 64 (2011) No. 1
tions. The main influence is the test temperature (Table 6).Tensile strength Rm and yield strength Rp0,2:Both tensile strength and yield strength depend on the production data. High-est values achieve thin specimens as cast and low die temperature at -35 °C testing temperature (Figure 18).
The influence of wall thickness, die temperature and gate velocity is linear according to the Design Expert. The largest impact has the wall thickness, followed by the die temperature and the gate velocity. The influence of the testing temperature on the measured mechanical data is not linear (Fig-ure 19).
Artificial ageing leads to mechani-cal properties corresponding to a one year natural ageing. The Figures 20 and 21 are shown the influence of the wall thickness and the die temperature on the mechanical properties after artifi-cial ageing (105 °C, 24 hours).
3.4.2 Static testing Z400 and Z430
Elongation at fracture:The elongation data show a wide band of values. The data measured at -35 °C (ca. 1 % to 2 %) are the lowest, the high-est data are at +85 °C (ca. 20 % to 25 %) (Table 7).
3.4.3 Creep testingThe creep testing equipment is shown in Figure 22 and is performed as a func-tion of time and temperature accord-ing to DIN 50118. The system allows the measurement of changes in specimen’s length within a resolution of 1 µm up to 20 % of the original length.
Results of Creep testing:For the creep tests stresses between 40 MPa and 100 MPa have been used at room temperature. At testing temper-ature of +85 °C stresses between
12 MPa und 50 MPa have been applied to the specimen. With these data stress exponent and activation energy
can be calculated. Specimen as cast and artificially aged at 120 °C over 15 hours and over ageing of 150 °C and 15 hours have been tested 1000 hours (Figures 23 to 25).
The primary creep is strong and ends at 2 % creep. Then the cross section of the specimen decreases which again in-creases the stress load and the creep rate increases (Figure 24). If the stress in the cross section was constant the creep rate would then decrease up to 10 % of elongation.
Some specimens have been averaged at 150 °C for 15 hours. These probes show a creep rate which is 5 time high-er than the artificially aged probes (120 °C for 15 hours). All tests follow the creep based on self diffusion. For all mea-surements with Z 410 the exponent n had a value of 4.1 when 0.5 % to 1 % creep elongation was archived and the activa-
As Zn alloys show no yield strength data are provided for the elongation of 0,2 %.
Porosity influences the elongation properties which lead to a high variation of the elongation data between 2 % and 12 % (Figure 15). The tensile strength data show a standard variation of only 5 %. The ageing behavior can therefore be checked using the tensile test data. Using a test temperature of -35 °C the tensile strength and the yield strength increase by 5 %. The elongation data are lower (Figure 16). At +85 °C the stress-strain-curve shows data depicted in Figure 17. The data are 20 % lower compared to room temperature. Elon-gation is in the range of 20 %.
Young’s modulus: The data for Young’s modulus is calculated out of the stress strain curves using software. The ageing shows no influence on the Young’s modulus, neither do the production condi-
Table 1: Specification of zinc die casting alloys after EN12844 [3] AlloyContent of chemical ZP3 ZP5 ZP2 ZP8elements, wt % ZP0400 ZP0410 ZP0430 ZP0810 ZnAl4 ZnAl4Cu1 ZnAl4Cu3 ZnAlCu1
Aluminum max 4.3 4.3 4.3 8.8 min 3.7 3.7 3.7 8
Copper max 0.1 1.2 3.3 1.3
min 0.7 2.7 0.8
Magnesium max 0.05 0.05 0.05 0.03
min 0.025 0.025 0.025 0.015
Lead max 0.005 0.005 0.005 0.006
Cadmium max 0.005 0.005 0.005 0.006
Tin max 0.002 0.002 0.002 0.003
Iron max 0.05 0.05 0.05 0.06
Nickel max 0.02 0.02 0.02 0.02
Silicon max 0.03 0.03 0.03 0.045
Zinc rest rest rest rest
Table 2: Volume of the different parts
Thickness, mm Volume VPart, cm³
0.8 6.0
1.5 11.25
3.0 22.5
Table 3: Gate velocities for the three parts
Thickness, mm Gate velocity, m/s Piston velocity, m/s
0.8 25 0.36
1.5 40 0.58
3.0 55 0.79

9
Casting alloys, behaviour
International Foundry Research 64 (2011) No. 1
3.4.5 HardnessHardness has been tested for all specimen and all ageing con-ditions. The values for as cast probes are in the range of
tion energy was 94 kJ/mol. According to this finding the creep rate can be cal-culated between 0 °C and 100 °C and stresses between 10 MPa and 100 MPa using the following equation:
(3)
R …
The activation energy leads to an in-crease of the creep rate of 25 °C to 85 °C by the factor of 700 (Figure 26).
If one accepts a creep rate of 1 % per year as a limit as a result you can read the maximal allowable stresses as a function of temperature as depicted in (Figure 27).
Creep rate of Z400 and Z430:Figure 28 shows the creep data of the three alloys in comparison. The copper content influences the creep by a fac-tor of 4, between Z410 and Z430 is on-ly a small difference.
Out of Figure 26 and Figure 28 one can extract the parameters for second-ary creep according to equation (1) in Table 8.
3.4.4 Fatique testing
Fatique testing equipment: For fatigue testing a resonance testing machine by Russenberger & Müller, type Mikroton 654 with maximal 20 kN load has been used Figure 29. The test frequency was 150 Hz. The speci-men is shown in Figure 30.
The tests have been conducted at R = -1 (tension-compression) and R = 0 (tension). As small probes up to 2 mm break under compression for the probes with 0.8 mm and 1.5 mm only tension has been tested. The data vary extreme-ly heavily with internal defects, much more than the static data. Therefore all specimens have been X-rayed before testing.
Results of the fatigue tests: The zinc alloy does not show a sharp edge between time strength and per-manent strength. For 10 million cycles one can assume 85 MPa, after artificial ageing the value drops down to 80 MPa (Figure 31).
For Z400 the lower tensile data lead to a smaller decline of the slope and the higher ductility leads to a higher per-manent time value.
The sensitivity for combination of static and dynamic loads can be calculated from values at R = -1 and R = 0 and has the value of 0.45 (Figure 32).
Table 4: Calculated filling time
Thickness, mm Filling time, m/s
vA = 25 m/s vA = 40 m/s vA = 55 m/s
0.8 5.9 3.7 2.7
1.5 11.1 6.9 5.0
3.0 22.1 13.7 10.1
Table 5: Calculated solidification time
Thickness, mm Solidification time, ms
TF = 120 °C TF = 160 °C TF = 200 °C
0.8 16 19 23
1.5 57 68 83
3.0 228 270 330
Table 6: Young’s modulus as function of testing temperature and ageing conditions
Ageing condition Young’s modulus, GPa
T = +23 °C T = +85 °C T = -35 °C
As cast condition 90 ± 8 82 ± 8 92 ± 8
1 year natural ageing 88 ± 8 78 ± 8 90 ± 8
Table 7: Fracture elongation as a function of testing temperature and ageing
Alloy / ageing condition Fracture elongation, %
Z400 T = +23 °C T = +85 °C T = -35 °C
as cast 5.0 ± 3.0 20 ± 8 2.0 ± 1.0
2 month natural ageing 9.0 ± 5.0
artificial ageing 105 °C/24 h 10 ± 5 25 ± 5 2.0 ± 1.0
Alloy / ageing condition Fracture elongation, %
Z410 T = +23 °C T = +85 °C T = -35 °C
as cast 2.7 ± 1.0 22.7 ± 8.6 1.5 ± 0.4
1 year natural ageing 5.5 ± 1.7 22.6 ± 6.8 2.0 ± 0.5
Alloy / ageing condition Fracture elongation, %
Z430 +23 °C +85 °C -35 °C
as cast 3.0 ± 1.0 15 ± 8 1.1 ± 0.5
4 month natural ageing 5.0 ± 1.5
artificial ageing 105 °C/24 h 4.6 ± 1.5 24 ± 8 1.7 ± 0.9
KmolTRkJ94
ns eA ⋅⋅⋅
−⋅σ⋅=ε

10
Casting alloys, behaviour
International Foundry Research 64 (2011) No. 1
Figure 16: Stress-strain-curve run 26 (3 mm; 200 °C; 55 m/s) measured in as cast condition at -35 °C
Figure 17: Stress-strain-curve run 26 (3 mm; 200 °C;55 m/s) measured in as cast condition at 85 °C
Design-Expert® Softw are
Rm as cast446.25
259.4
X1 = A: wall thicknessX2 = B: die temperature
Actual FactorsC: gate velocity = 40D: test temperature = 25
0.8 1.4
1.9 2.5
3.0 120
140
160
180
200
260
290
320
350
380
410
Rm
as
cast
A: wall thickness B: die temperature
Design-Expert® Softw are
Rm as cast446.25
259.4
X1 = B: die temperatureX2 = C: gate velocity
Actual FactorsA: wall thickness = 1.54D: test temperature = 25
120 140
160 180
200 20
30
40
50
60
330
340
350
360
370
380
390
Rm
as
cast
B: die temperature C: gate velocity
Figure 18: Tensile strength as a function of wall thickness and die temperature (left) and as a function of die temperature and gate velocity (right) as cast condition
test e
die egate velocity
Figure 19: Tensile strength as a function of wall thickness and test temperature as cast con-dition

11
Casting alloys, behaviour
International Foundry Research 64 (2011) No. 1
Design-Expert® Softw areOriginal ScaleRm 105 °, 24 h
359.25
219
X1 = A: wall thicknessX2 = B: die temperature
Actual FactorsC: gate velocity = 40D: test temperature = 25
0.5 1.0
1.5 2.0
2.5 3.0 120
140
160
180
200
220
270
320
370
420
Rm
105
°, 2
4 h
A: wall thickness B: die temperature
Design-Expert® Softw areOriginal ScaleRm 105 °, 24 h
359.25
219
X1 = A: wall thicknessX2 = D: test temperature
Actual FactorsB: die temperature = 160C: gate velocity = 40
0.5 1.0
1.5 2.0
2.5 3.0
-35
-5
25
55
85
220
270
320
370
420
Rm
105
°, 2
4 h
A: wall thickness D: test temperature
Design-Expert® Softw areOriginal ScaleRm 105 °, 24 h
359.25
219
X1 = A: wall thickness X2 = D: test temperature
Actual FactorsB: die temperature = 160C: gate velocity = 40
0.5 1.0
1.5 2.0
2.5 3.0
-35
-5
25
55
85
220
270
320
370
420
Rm
105
°, 2
4 h
A: wall thickness D: test temperature
Figure 20: Tensile strength as a function of wall thickness and die temperature (left) and as a function of testing temperature and wall thickness (right) artificially aged at 105 °C for 24 hours
Figure 21: Tensile strength as a func-tion of wall thickness and testing temperature, artificially aged at 105 °C for 24 hours
Figure 22: Creep testing equipment with 12 temperature controlled test stations

12
Casting alloys, behaviour
International Foundry Research 64 (2011) No. 1
0
1
2
3
4
5
6
7
8
9
10
0 200 400 600 800 1000 1200 1400 1600 1800 2000
Time , hours
Cree
p st
rain, %
v
K1 K2 K4
100 MPa
75 MPa
50 MPa
Z410 3 mm
Room temperature
artificial ageing 120 °C,15 hours
Figure 23: Creep elongation as a func-tion of time and stress of Z410 at room temperature
Figure 24: Prima-ry and secondary creep rate of Z410
Figure 25: Creep elongation as a function of time and stress of Z410 at +85 °C

13
Casting alloys, behaviour
International Foundry Research 64 (2011) No. 1
.
.
.
.
.
, a
0 1
1 0
10 0
0 10 20 30 40 50 60 70 80 90 100
Temperatur °C
% a
20 MPA30 MPA75 MPA 50 MPA
1 %
10 MPA
reep limlit 1 % per Year
y = 2E-13x5 4708
y = 2E-14x5 5021
y = 2E-14x5.5421
0.00001
0.0001
0.001
0.01
0.1
10 100Stress, MPa
Cre
ep ra
te, %
/h o
Z400 - RT 1 5 mm 105 °C 24 hours
Z410 - RT 3 mm 105 °C 24 hours
Z430 - RT 1 5 mm105 °C 24 hours
1 % per month (730 h)
1 % per year (8760 h)
50
Room temperaturevalues measured at 2 %
creep elongation
Stress exponent n = 5 5
Figure 26: Stress exponent and ac-tivation energy for secondary creep of Z410 measured at 1 % creep elonga-tion
Figure 28: Stress ex-ponent for second-ary creep of Z400, Z410 and Z430 mea-sured at 1 % creep elongation
Figure 27: Maximum of stress un-der creep exposure as a function of temperature, Z410

14
Casting alloys, behaviour
International Foundry Research 64 (2011) No. 1
Figure 29: Mikroton 654 res-onant testing machine for fa-tigue tests (20 kN)
10
10
20
120
Figure 30: Shape of the utilized specimens for fatigue tests
1,750
1,800
1,850
1,900
1,950
2,000
2,050
2,100
2,150
10.000 100.000 1.000.000 10.000.000 100.000.000
Number of cycles
Stre
ss a
mpl
itude
a,
MP
a
60
80
75
70
65
10095
9085
140
130
120
110
Run 25: 3 - 120 - 25over aged 16 hours at 150 °C
Run 26: 3 - 200 - 55as cast condition
.
R = -1 .
Figure 31: S/N-curves (ex-tended fatigue test) at R = -1 (compression and tension) of specimens in as cast condi-tion and after artificial ageing (over ageing)
Figure 32: S/N-curves at R = -1 of artificially aged Z400 in compari-son of 20 year natural-ly aged Z410 specimens from Umicore

15
Casting alloys, behaviour
International Foundry Research 64 (2011) No. 1
0.8 mm /120 °C
0.8 mm /160 °C
0.8 mm /200 °C 1.5 mm /
120 °C 1.5 mm /160 °C
1.5 mm /200 °C 3 mm /
120 °C 3 mm /160 °C
3 mm /200 °C
vA 25 m/svA 40 m/s
vA 55 m/s0
20
40
60
80
100
120
140
Hardness HB
Wall thickness, temperature
Gate velocity
100
104
108
112
116
120
1 180 360Ageing time days
Har
dnes
s H
B
120 °C 160 °C 200 °C
0 8 mm1 5 mm
3 mm
0
20
40
60
80
100
120
140
Die temperatureWall
thickness
120 °C 160 °C 200 °C
0 8 mm1 5 mm
3 mm
0
20
40
60
80
100
120
140
Die temperatureWall
thickness
Figure 33: Hardness as a function of processing pa-rameters of Z410 as cast condition, thickness and die temperature show strong in-fluence on hardness. Gate ve-locity has no influence on the hardness.
Figure 34: Hardness of Z410 as a func-tion of natural ageing time
Figure 35: Hardness of Z400 (a) and Z430 (b), as cast condition

16
Casting alloys, behaviour
International Foundry Research 64 (2011) No. 1
Figure 36: Hardness (average values) as a function of copper content
0.8 mm /120 °C
0.8 mm /160 °C
0.8 mm /200 °C
1.5 mm /120 °C
1.5 mm /160 °C
1.5 mm /200 °C
3 mm /120 °C
3 mm /160 °C
3 mm /200 °C
vA 25 m/s
vA 40 m/svA 55 m/s
6
6.1
6.2
6.3
6.4
6.5
6.6
6.7
6.8
6.9
7
Density, g/cm³
Wall thickness, temperatureGate velocity
Figure 37: Density of the parts as a function of processing param-eters
Figure 38: Decrease of tensile strength at RT for Z410 as a function of time and wall thick-ness through the ageing process

17
Casting alloys, behaviour
International Foundry Research 64 (2011) No. 1
Table 10: Correlation of time and temperature for the ageing behavior of Z410
Temperature in °C -20 0 23 50 80 105 120
Time 100 years 10 years 1 year 37 days 4 days 1 day 0.4 days
Table 9: Average values of density and porosity of Z410
Wall thickness, mm
0.8 1.5 3.0
Density, g/cm³ 6.54 ± 0.06 6.61 ± 0.02 6.64 ± 0.01
Porosity, % 1.97 ± 0.94 1.02 ± 0.26 0.48 ± 0.13
Table 8: Creep parameters for secondary creep (coefficient of creep rate A, stress exponent n, activation energy Q for self diffusion of zinc)
Alloy / thickness A, %/h n Q, kJ/mol
Z410 / 3.0 mm 4.7 · 105 4.15 94.1
Z400 / 1.5 mm 2.1 · 106 4.6 94.1
Z430 / 1.5 mm 3.9 · 105 4.15 94.1
Table 11: Chemical composition of the used alloys
Chemical elements, wt %
Alloy Al Cu Mg Fe Pb Cd Sn Ni Si
Z400 4.0 0.000 0.041 0.013 0.0024 0.0004 0.0001 0.0003 0.0008
Z410 4.0 0.85 0.053 0.0009 0.002 0.0004 0.0001 0.0001 0.0011
Z430 3.8 2.95 0.040 0.001 0.002 0.0005 0.0002 0.0003 0.0005
200
220
240
260
280
300
320
340
360
380
400
420
0.8 / -35 1.5 / -35 3.0 / -35 0.8/RT 1.5/RT 3,0/RT 0.8 / 85 1.5 / 85 3.0 / 85
Tensile strength Rm, MPa
as cast 3 weeks 6 weeks 3 month 6 month 12 month
mean values
Wall thickness, mm/Temperature,°C
Figure 39: Tensile strength as a function of testing temperature and wall thickness through the natural ageing process of Z410

18
Casting alloys, behaviour
International Foundry Research 64 (2011) No. 1
0.8 / -35 1.5 / -35 3.0 / -35 0.8/RT 1.5/RT 3,0/RT 0.8 / 85 1.5 / 85 3.0 / 85
Wall thickness, mm/Temperature,°C
200
220
240
260
280
300
320
340
360
380
400
420
Tensile strength R m, MPa
as cast 1 week 2 month 4 month
mean values
0.8 / -35 1.5 / -35 3.0 / -35 0.8/RT 1.5/RT 3,0/RT 0.8 / 85 1.5 / 85 3.0 / 85
Wall thickness, mm/Temperature,°C
180
200
220
240
260
280
300
320
340
360
380
400
as cast 3 weeks 6 weeks 3 month 6 month 12 month
mean values
0.8 / -35 1.5 / -35 3.0 / -35 0.8/RT 1.5/RT 3,0/RT 0.8 / 85 1.5 / 85 3.0 / 85
Wall thickness, mm/Temperature,°C
Figure 40: Tensile strength as a function of testing tem-perature and wall thickness through the natural ageing process of Z400
Figure 41: Tensile strength as a function of testing temperature and wall thickness through the natural ageing process of Z430
Figure 42: Yield strength as a function of testing tem-perature and wall thickness through the natural ageing process of Z410
19
Casting alloys, behaviour
International Foundry Research 64 (2011) No. 1
0.8 / -35 1.5 / -35 3.0 / -35 0.8/RT 1.5/RT 3,0/RT 0.8 / 85 1.5 / 85 3.0 / 85
Wall thickness, mm/Temperature,°C
180
200
220
240
260
280
300
320
340
360
380
400
mean values
0.8 / -35 1.5 / -35 3.0 / -35 0.8/RT 1.5/RT 3,0/RT 0.8 / 85 1.5 / 85 3.0 / 85
Wall thickness, mm/Temperature,°C
180
200
220
240
260
280
300
320
340
360
380
400
mean values
0.8 / -35 1.5 / -35 3.0 / -35 0.8/RT 1.5/RT 3,0/RT 0.8 / 85 1.5 / 85 3.0 / 85
Wall thickness, mm/Temperature,°C
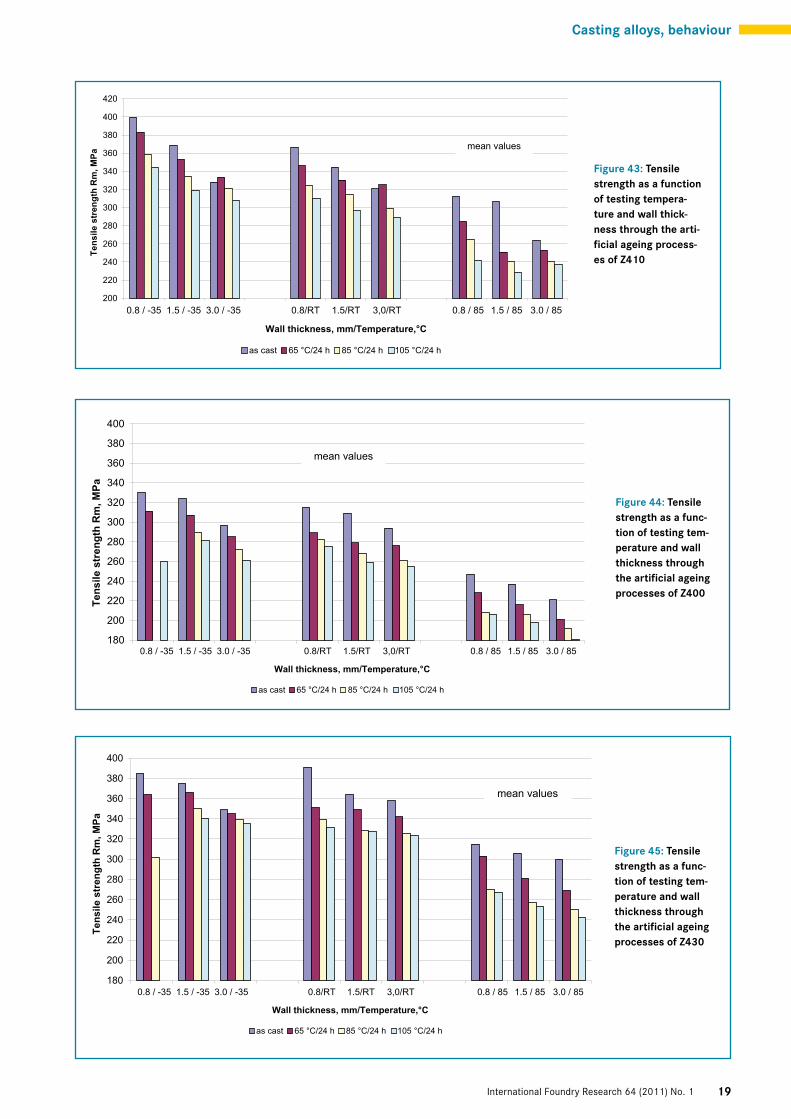
Figure 43: Tensile strength as a function of testing tempera-ture and wall thick-ness through the arti-ficial ageing process-es of Z410
Figure 44: Tensile strength as a func-tion of testing tem-perature and wall thickness through the artificial ageing processes of Z400
Figure 45: Tensile strength as a func-tion of testing tem-perature and wall thickness through the artificial ageing processes of Z430

20
Casting alloys, behaviour
International Foundry Research 64 (2011) No. 1
180
200
220
240
260
280
300
320
340
360
380
400
Center-Point-Conditions
0.8 / -35 1.5 / -35 3.0 / -35 0.8/RT 1.5/RT 3,0/RT 0.8 / 85 1.5 / 85 3.0 / 85
Wall thickness, mm/Temperature,°C
y = -8062.8x + 27.314
0
1
2
3
4
5
6
0.00250 0.00270 0.00290 0.00310 0.00330 0.00350
1/T 1/K
ln (t)
23 °C65 °C85 °C105 °C
Figure 46: Yield strength as a function of testing tempera-ture and wall thick-ness through the arti-ficial ageing process-es of Z410
Figure 48: Arrhenius plot of time ln(t) ver-sus influence of tem-perature 1/T during ageing for calcula-tion of the activation energy
Figure 47: Ageing be-haviour (decreas of ten-sile strength) in compar-ison of natural and arti-ficial ageing of Z410 as a function of wall thick-ness

21
Casting alloys, behaviour
International Foundry Research 64 (2011) No. 1
0
30
60
90
120
150
180
210
240
270
300
330
360
0 20 40 60 80 100 120
Tens
ile s
tren
gth
Rm
MPa
Figure 50: Additional value of tensile strength (average value of 25 specimens with 1.5 mm wall thickness, un-known process parameters) after 20 years natural ageing (Umicore)
Figure 49: Required time as a function of temper-ature for artificial age-ing to build up a natu-ral ageing of 1 year at RT of Z410
Figure 51: Ageing be-havior (decrease of tensile strength) in comparison of natural and artificial ageing of Z400, Z410 and Z430 as a function of time, broken lines repre-sents expected values

22
Casting alloys, behaviour
International Foundry Research 64 (2011) No. 1
The tensile strength after artificial ageing for Z410 is shown in Figure 43, for Z400 in Figure 44 and for Z430 in Figure 45 as a function of testing temperature and wall thick-ness at center-point-conditions and Figure 46 depicts the change of the yield strength after artificial ageing for Z410.
Figure 47 shows that for Z410 artificial ageing at 65 °C for 24 hours equals a natural ageing of 45 days. Ageing at 85 °C for 24 hours equals approx. 120 days and 105 °C for 24 hours equals natural ageing of 1 year.
If depicted in a diagram temperature 1/T against the log of time one achieves the activation energy as -Q/k (Fig-ure 48). With this slope in Figure 48 one achieves the acti-vation energy for ageing for Z410:
Q = 8062 · 8,31 J/mol = 67 kJ/mol (4)
Figure 49 shows the time which is necessary at a certain temperature for artificial ageing for Z410 to achieve natural ageing of 1 year contents numeric data for this. As a result the storage at -20 °C of the probes prevents natural ageing for 2 years (Table 10).
Umicore supplied probes out of Z410 which have been aged for 20 years Figure 50. These probes fit very nicely in-to the test data and show that after 1 year natural ageing is more or less finished.
3.5 Comparison between ZP0400, ZP0410 and ZP0430
Table 11 depicts the chemical composition of the 3 alloys. As discussed in 2 („State of the knowledge”) and shown in Figure 5 copper increases the strength and increases the sol-ubility of aluminum.
Figure 51 shows the direct comparison for all 3 alloys and a wall thickness of 1.5 mm for center-point-conditions (die temperature 160 °C, gate velocity 40 m/s) for tensile strength at room temperature.
Figure 51 shows that all alloys age. Copper increases the strength and decelerates the ageing behavior.
Related to the as cast strength after artificial ageing of at 105 °C for 24 hours Z400 shows 83 %, Z410 84 % and Z430 still 88 % of the original strength.
110 HB. One can detect that the gate velocity has no influ-ence on the hardness (Figures 33 and 34).
A cold die leads to high hardness data, probes under 0.8 mm show deflection and cannot tested properly. The com-parison of the hardness data for Z400 and Z430 as cast is de-picted in Figure 35. Out of DOE one can calculate the influ-ence of the copper content on the hardness (Figure 36).
3.4.6 Density and porosityDensity and porosity have been tested according to Archi-medes through weight in air and in water. Figure 37 shows the influence of die temperature wall thickness and gate ve-locity on the density. The wall thickness shows a strong in-fluence. The porosity varies 0.5 % and 2 % (Table 9).
3.4.7 Natural Ageing
Natural ageing: Tensile strength and yield strength decrease with ageing, the elongation increases. Data have been achieved for Z410 for up to 1 year so far, for Z400 until 2 months and Z430 un-til 4 months.
For Z410 the drop in tensile strength is shown in Fig-ure 38. This behavior is similar for all alloys. The drop in strength should follow according the 2. Fick-Law. However there are differences based upon the following facts:- The error function is described using a diffusion coeffi- cient which is independent from the concentration, this is not the case. - Not only aluminum but also copper diffuses.
Figure 39 shows the ageing behavior of Z410, Figure 40 of Z400 and Figure 41 of Z430 as a function of testing temper-ature, wall thickness, die temperature and gate velocity. Fig-ure 42 shows the same influences on the yield strength for Z410.
Artificial ageing:Artificial ageing was performed for all alloys:- 65 °C for 24 hours;- 85 °C for 24 hours;- 105 °C for 24 hours.
80
85
90
95
100
105
110
115
0 0 5 1 1 5 2 2 5 3
Kupfergehalt in Gew.%
Copper content, wt %
Figure 52: Influence of copper on tensile strength (referring to Z410 as 100 %) at RT af-ter artificial ageing 24 hours/105 °C

23
Casting alloys, behaviour
International Foundry Research 64 (2011) No. 1
- For Z410 ageing at room temperature is finished after 1 year, for Z400 half a year (expected) and for Z430 after 2 years (expected).- The drop in tensile strength and yield strength after com- pleted ageing is ~15 %.- Natural ageing can be simulated by an artificial ageing at 105 °C for 24 hours.- The mechanical properties of zinc die casting alloys after ageing are high compared to aluminum- and magne sium alloys.- The creep behavior of zinc die casting alloys is caused by self diffusion of zinc and is thermally activated accord- ing to Arrhenius law.- Creep in zinc die casting alloys is a function of time, the creep rate decreases with time when stress is constant.
Funded by: IGF Industrielle Gemeinschaftsforschung; AiF-Vorha-ben Nr. 15421N: Ursachen und Möglichkeiten zur Minimierung der Alterungsvorgänge bei Zinkdruckgusslegierungen” L. H. Kallien and W. Leis, Aalen University of Applied Sciences, Aalen, Beethovenstr. 1, Germany
Literature:[1] Gottstein, G.: Physikalische Grundlagen der Materialkunde. Springer, 2007. ISBN 978-3-540-71104-9.[2] Coster, L.: Oner, M.; Rollez, D.: Giesserei-Praxis (1996) no. 21/22, pp. 458-460.[3] www.zinc-diecasting.info. Engineering database (access 10.03.2009).[4] www.ilzsg.org. International Lead and Zinc Study Group (ac-cess 10.03.2009).[5] www.pressebox.de. BoxID 85023, 29.11.2006 (access 11.03.2009).[6] Opitz, H.: Allgemeine Werkstoffkunde für Ingenieurschulen. VEB Fachbuchverlag, Leipzig, 1971.[7] Johnen, H. J.: Gießen mit Zink. Zinkberatung Düsseldorf 1982. ISBN 3-88754-002-6.[8] Hänsel, G.: Zinklegierungen – Zusammensetzung und Eigen-schaften. Metall 42 (1988) no. 9, pp. 871-874.[9] Goodwin, F. E.; Ponikwar, A. L.: Engineering properties. Inter-national Lead Zinc Research Organisation.[10] Gebhard, E.: Über den Aufbau des Systems Zink-Aluminium-Kupfer und die Volumenänderung der Gusslegierung. Giesserei 29 (….) no. 24, pp. 397-403.[11] Klein, F.; Roos, G.: Maßänderungen der Zinkdruckgusslegier-ungen in Abhängig-keit vom Kupfergehalt. 4. Aalener Giesserei-Symposium 1983, Aalen, Germany.[12] Schumann, H.: Metallographie. Deutscher Verlag für Grund-stoffindustrie, Leip-zig, VLN: 152-915/3/91.[13] Klein, F.: ….. Aalener Giesserei-Symposium 1984.[14] Schaller, Y.: Zink-Druckguss – Neue Legierungen, neue An-wendungen. VDI Bericht 1173.[15] Birch, J.: Computerized properties data for zinc casting al-loys. Die Casting Engineer 20.
The copper free alloy ages according to Figure 51 much faster which is in correlation to literature data [6] (Fig-ure 52).
4 Summary
Compared to other die casting alloys zinc-alloys gain the highest mechanical values. The low melting temperature al-lows high production rates using hot chamber technology and die lives exceed 1.000.000 shots. Zinc alloys can be cast in extremely small wall thicknesses down to 0.5 mm or less. However, the low liquidus temperature leads to ageing phe-nomena depending on time, changes in measures and creep under load.
The results show that all phenomena are thermally acti-vated and follow an Arrhenius law. The activation energy however is different: for ZP0410 and ageing it is approx. 67 kJ/mol and for creep it is approx. 94 kJ/mol.
The maximal solubility of aluminum in zinc is 0.05 wt % at room temperature. Ageing is based upon the segrega-tion of aluminum into cubic face centered phase at room temperature which leads also to the measure changes as the centered cubic face structure has a smaller lattice con-stant. Copper is basically responsible for the higher me-chanical properties but copper also segregates at lower tem-peratures.
Ageing is based upon diffusion. Micro structural investi-gations using TEM show that ageing is based upon segrega-tion. Aluminum segregates completely. Copper increases the solubility of Aluminum and increases the strength. The measurement shows a reduction of tensile strength after one year of up to 16 % at the Z410 alloy. The strongest effect among the tested parameters is the wall thickness which strongly influences the cooling rate and the structure of the material. The influence of the gate velocity and the die tem-perature is much lower and only changes the mechanical properties by 3-4 %. Using an artificial ageing of 105 °C and 24 hours all processes influencing the mechanical proper-ties are terminated and the material properties are stable over time.
The creep behavior is a self diffusion process which can be described using diffusion kinetics. The production pa-rameters only have small influence on the creep behavior. Overageing of the material at 150 °C and 15 hours increas-es the creep rate by the factor of 4-5. All data have been gained using DOE and statistical analysis.
Artificial ageing is always necessary when using zinc al-loys to finish the diffusion processes. The artificial ageing at 105 °C for 24 hours should be used. Temperatures over 120 °C must be avoided as other phase transformations will take place.Conclusions:- The ageing behavior of zinc die casting alloys is activat- ed at room temperature and caused by the low solubility of aluminum in zinc at room temperature.- Ageing is diffusion controlled. The diffusion process starts immediately after ejection out of the die.
Keywords