age-related effects on markers of inflammation and
TRANSCRIPT

AGE-RELATED EFFECTS ON MARKERS OF INFLAMMATION AND
CARTILAGE METABOLISM IN RESPONSE TO AN INTRA-ARTICULAR
LIPOPOLYSACCHARIDE CHALLENGE IN HORSES
A Thesis
by
MEREDITH KAHN
Submitted to the Office of Graduate and Professional Studies of Texas A&M University
in partial fulfillment of the requirements for the degree of
MASTER OF SCIENCE Chair of Committee, Josie A. Coverdale Committee Members, Jessica L. Lucia Thomas H. Welsh Jr. Tryon A. Wickersham Head of Department, H. Russell Cross
December 2014
Major Subject: Animal Science
Copyright 2014 Meredith Kahn

ii
ABSTRACT
Eighteen Quarter Horses were utilized in a randomized complete design for a
28 d experiment to evaluate age-related effects on inflammation and cartilage turnover
after induction of a single inflammatory insult using lipopolysaccharide (LPS). Horses
were grouped by age, with yearlings (yearling; n = 3 males, n = 3 females), 2 to 3 yr olds
(2/3; n = 2 males, n = 4 females), and mature 5 to 8 yr olds (mature; n = 2 males, n = 4
females). On d 0, all horses were housed individually and fed diets that met or exceeded
NRC (2007) requirements. On d 14, horses were challenged with an intra-articular
injection of LPS. Carpal joints were randomly assigned to receive 0.5 ng LPS solution
obtained from E. coli O55:B5, or 0.8mL sterile lactated Ringer’s solution as a
contralateral control. Synovial fluid was collected prior to LPS injection at pre-injection
h 0 (PIH 0) and 6, 12, 24, 168, and 336 h post-injection. Samples were later analyzed
using commercial ELISA kits for prostaglandin E2 (PGE2), collagenase cleavage
neoepitope (C2C), and carboxypropeptide of type II collagen (CPII). Heart rate (HR),
respiratory rate (RR), and rectal temperature (RT) were monitored over the first 24 h and
carpal circumference and surface temperature were recorded with additional
measurements at 168 and 336 h. Data were analyzed using PROC MIXED procedure of
SAS.
Values for RT, HR, and RR were within normal range. HR and RT were
influenced by age (P < 0.01), while RR was unaffected by age (P ≤ 0.21). Joint
circumference was not influenced by age (P = 0.84), but circumference and surface

iii
temperature increased (P < 0.01) over time across all age groups. Synovial PGE2
concentrations tended (P = 0.09) to be influenced by age with yearlings having lower (P
= 0.03) concentrations than mature horses. Synovial C2C concentrations were affected
by age with yearlings and 2/3 yr olds having lower (P < 0.01) concentrations than
mature horses. Concentrations of synovial CPII were influenced by age with yearlings
and 2/3 yr old having lower (P ≤ 0.02) concentrations than mature horses. Ratios of
CPII:C2C were influenced by age with mature and 2/3 yr old horses having increased (P
< 0.01) values compared to yearlings. These results indicate that inflammation and
corresponding cartilage turnover in response to LPS administration vary with age.

iv
DEDICATION
For Mom, Dad, and Jeremy

v
ACKNOWLEDGEMENTS
First, I would like to thank my committee chair, Dr. Josie Coverdale, for her
guidance and support, and for giving me this amazing opportunity. I would also like to
thank committee members Dr. Jessica Lucia for her vital contributions to this project and
Dr. Thomas Welsh for his help and for the use of his laboratory. I would like to extend
my gratitude to Dr. Carolyn Arnold and Dr. Robin Dabareiner for contributing their time
to this project. Thank you to my committee member Dr. Tryon Wickersham for being
supportive and for always making me laugh. I also want to extend my gratitude to my
fellow graduate students, especially Amanda Bradbery, for being my confidant, for her
hard work and dedication, and for those long hours in the lab. Thank you also to Allison
Millican for sacrificing part of her summer to help with this trial and for taking one for
the team, holding knees on LPS day. Lastly, I would like to thank my mom, dad, and
brother for their incredible support throughout this process and my friends for always
being there for me. This project would not have been possible without you all and I am
truly grateful beyond words. Thank you.

vi
TABLE OF CONTENTS
Page
ABSTRACT .............................................................................................................. ii
DEDICATION .......................................................................................................... iv
ACKNOWLEDGEMENTS ...................................................................................... v
TABLE OF CONTENTS .......................................................................................... vi
LIST OF FIGURES ................................................................................................... viii
LIST OF TABLES .................................................................................................... x
CHAPTER I INTRODUCTION .......................................................................... 1
CHAPTER II REVIEW OF THE LITERATURE ................................................ 3
Introduction.......................................................................................................... 3 Synovial Joint Structure and Anatomy ................................................................ 3
Effects of Age on Articular Cartilage Metabolism ............................................. 10 Joint Disease in Horses ....................................................................................... 13
Experimental Joint Disease ................................................................................. 18 Synovial Fluid Biomarkers .................................................................................. 22 Conclusion........................................................................................................... 30
CHAPTER III MATERIALS AND METHODS ................................................... 32
Horses and Treatments ........................................................................................ 32 Sample Collection ............................................................................................... 33 Synovial Fluid Analysis ...................................................................................... 34 Statistical Analysis .............................................................................................. 35
CHAPTER IV RESULTS ....................................................................................... 37
Physical Variables ............................................................................................... 37 Synovial Joint Inflammation ............................................................................... 42
PGE2............................................................................................................... 42 Biomarkers of Cartilage Metabolism .................................................................. 44
Catabolic C2C ............................................................................................... 44

vii
Page
Anabolic CPII ................................................................................................ 46 CPII:C2C........................................................................................................ 48
CHAPTER V DISCUSSION ................................................................................ 50
CHAPTER VI SUMMARY ................................................................................... 56
LITERATURE CITED ............................................................................................. 57
APPENDIX ............................................................................................................... 66

viii
LIST OF FIGURES
Page
Figure 1 Organization of the extracellular matrix components in articular cartilage....................................................................................................
6
Figure 2 The arachidonic acid cascade...................................................................
20
Figure 3 Illustration of the principle behind detecting a marker of collagen degradation. Specific epitopes are direct markers, but most indirect markers are also detected with help of antibodies................................... .
26
Figure 4 Type II procollagen synthesis and fibril formation, showing removal of propeptides as the triple helix is formed. The released propeptides form the basis of the carboxypropeptide of type II collagen (CPII) marker.......................................................................................................
30
Figure 5 Carpal circumference (cm; LS mean ± SEM) in horses after intra-articular injection with 0.5 ng lipopolysaccharide (LPS: derived from Escherichia coli O55:B5) or 0.8 mL sterile lactated Ringer’s solution (CON) at 0, 6, 12, 24, 168 and 336 h post-injection. 1Age group: yearlings (yearling; n = 6), 2 to 3 yr olds (2/3; n = 6), and skeletally mature 5 to 8 yr olds (Mature; n = 6) ......................................................
40
Figure 6 Carpal joint surface temperature (°C; LS mean ± SEM) in horses after intra-articular injection with 0.5 ng lipopolysaccharide (LPS: derived from Escherichia coli O55:B5) or 0.8 mL sterile lactated Ringer’s solution (CON) at 0, 6, 12, 24, 168 and 336 h post-injection. 1Age group: yearlings (yearling; n = 6), 2 to 3 yr olds (2/3; n = 6), and skeletally mature 5 to 8 yr olds (Mature; n = 6). *,**,***Different superscripts indicate differences (P ≤ 0.05) in carpal joint surface temperature among different age groups at specific time points post-injection....................................................................................................
41
Figure 7 Mean synovial fluid concentrations (pg/mL) of PGE2 in horses in the LPS knee (Panel A; 0.5 ng of intra-articular lipopolysaccharide derived from Escherichia coli O55:B5) and in the CON knee (Panel B; 0.8 mL of intra-articular sterile lactated Ringer’s solution) at 0, 6, 12, 24, 168 and 336 h post-injection. 1Age group: yearlings (yearling; n = 6), 2 to 3 yr olds (2/3; n = 6), and 5 to 8 yr olds (Mature; n = 6).........................
43

ix
Figure 8 Mean synovial fluid concentrations (ng/mL) of catabolic collagenase cleavage neoepitope of type II collagen (C2C) in horses in the LPS knee (Panel A; 0.5 ng of intra-articular lipopolysaccharide derived from Escherichia coli O55:B5) and in the CON knee (Panel B; 0.8 mL of intra-articular sterile lactated Ringer’s solution) at 0, 6, 12, 24, 168 and 336 h post-injection. 1Age group: yearlings (yearling; n = 6), 2 to 3 yr olds (2/3; n = 6), and 5 to 8 yr olds (Mature; n = 6). a,bDifferent superscripts indicate differences (P ≤ 0.05) in synovial C2C concentration among different age groups at specific time points after injection....................................................................................................
45
Figure 9 Mean synovial fluid concentrations (ng/mL) of anabolic carboxypropeptide of type II collagen (CPII) in horses in the LPS knee (Panel A; 0.5 ng of intra-articular lipopolysaccharide derived from Escherichia coli O55:B5) and in the CON knee (Panel B; 0.8 mL of intra-articular sterile lactated Ringer’s solution) at 0, 6, 12, 24, 168 and 336 h post-injection. 1Age group: yearlings (yearling; n = 6), 2 to 3 yr olds (2/3; n = 6), and 5 to 8 yr olds (Mature; n = 6). a,bDifferent superscripts indicate differences (P ≤ 0.05) in synovial CPII concentration among different age groups at specific time points after injection....................................................................................................
47 Figure 10
Ratio of the mean synovial fluid concentration of carboxypropeptide of type II collagen (CPII) to the mean synovial fluid concentration of collagenase cleavage neoepitope of type II collagen (C2C) in horses in the LPS knee (Panel A; 0.5 ng of intra-articular lipopolysaccharide derived from Escherichia coli O55:B5) and in the CON knee (Panel B; 0.8 mL of intra-articular sterile lactated Ringer’s solution) at 0, 6, 12, 24, 168 and 336 h post-injection. 1Age group: yearlings (yearling; n = 6), 2 to 3 yr olds (2/3; n = 6), and 5 to 8 yr olds (Mature; n = 6). a,bDifferent superscripts indicate differences (P ≤ 0.05) in synovial CPII:C2C among different age groups at specific time points after injection....................................................................................................
49

x
LIST OF TABLES
Page
Table 1 Nutrient analysis of diet components..........................................................
33
Table 2 Clinical assessment of equine vital signs following intra-articular lipopolysaccharide (LPS) injection.............................................................
38

1
CHAPTER I
INTRODUCTION
Osteoarthritis (OA) is one of the most significant causes of lameness and
decreased performance that often leads to early retirement of the equine athlete
(Todhunter and Lust, 1990). Surveys estimate that up to 60% of lameness is related to
OA (Caron and Genovese, 2003). In young horses, adaptation of bone and soft tissue
occurs during growth and training, potentially leading to the overproduction of
inflammatory mediators, including interleukins and prostaglandins, and the enzymatic
breakdown of the articular cartilage (Brama et al., 1998; Kidd et al., 2001; Lucia et al.,
2013). A metabolic shift toward synthesis takes place in the young equine model,
serving to mend damage to the cartilage framework (Lucia et al., 2013). This response
is not as well understood in skeletally mature horses, although it has been speculated that
the process of cartilage turnover takes place at a much slower rate (Todhunter, 1996).
While mature horses may be common subjects for the development of OA, it is probable
that the disease process begins during skeletal immaturity with overloading during early
training and exercise. Therefore, there may be differences in inflammation and cartilage
metabolism responses between horses of varying age.
Lipopolysaccharide (LPS) is an established model of inflammation that is
transient, local and repeatable. Various studies have utilized this model to study
biomarkers of inflammation and cartilage turnover using young or mature horses (de
Grauw et al., 2009; Lucia et al., 2013). Results showed variation across studies, which

2
may be due to differences in age of horse under investigation. Prostaglandin E2 (PGE2),
collagenase cleavage neoepitope (C2C) and carboxypropeptide of type II collagen (CPII)
are examples of markers of inflammation and cartilage metabolism that have been
shown to vary in timeline and concentration across various studies utilizing the LPS
model in young or mature horses (de Grauw et al., 2009; Lucia et al., 2013). While
these differences exist, it may not be accurate to compare LPS data between studies from
mature horses to the young, growing model.
It is clear that OA can be life changing for the athletic horse. Since current
treatments focus solely on pain management and can have negative side effects, early
preventative methods are a current focus in research. A study utilizing horses of varying
age, exposed to the same experimental conditions is needed to clarify the differences that
have been observed across studies for inflammation and cartilage metabolism. Further
exploration could help identify an age range in which addition of preventative nutritional
strategies or change in exercise protocol may be the most beneficial to the working
horse.

3
CHAPTER II
REVIEW OF THE LITERATURE
Introduction
Equine OA is a naturally occurring, progressive disease of the synovial joints that
often leads to lameness, poor performance and early retirement of equine athletes
(Todhunter and Lust, 1990). The osteoarthritic joint is often characterized by damage to
and reduction of articular cartilage matrix components, in addition to reduced joint
function (McIlwraith, 2005). For maintenance of a healthy joint, the processes of
degradation and synthesis involved in cartilage metabolism are adjusted for net growth
and remodeling. In the osteoarthritic state, the balance of these processes is disrupted,
resulting in a shift toward tissue degeneration (Kidd et al., 2001). Prolonged exposure to
inflammatory mediators and degradative enzymes with chronic inflammation
perpetuates cartilage destruction. The response to prolonged inflammation and cartilage
metabolism may vary with age. The osteoarthritic diseased state exists primarily in the
aged horse, but the disease condition results from cartilage degradation that likely begins
early in the training process.
Synovial Joint Structure and Anatomy
The synovial joint functions to enable movement and to transfer load. Its
structure is designed to facilitate these two major functions. A healthy joint relies on the
integrity of normal anatomy and cellular function of all components. The synovial
membrane, synovial fluid, articular cartilage and bone make up these components and

4
are structures that contribute to the development of joint disease. Understanding normal
structure and function of the healthy synovial joint is helpful for a better understanding
of what happens in a diseased state.
The synovial membrane lines the joint cavity and is composed of two layers: the
intima and the subintima. The intima is an incomplete layer, one to four synoviocytes
thick, with no basement membrane that overlies a layer of connective tissue called the
subintima (Todhunter, 1996; Frisbie, 2006). Synoviocytes are a unique feature of the
membrane, which have secretory and phagocytic functions including: phagocytosis and
synthesis of hyaluronan, interleukins, prostaglandins, and proteases, all of which
significantly affect the state of cartilage (Goodrich and Nixon, 2006).
The intimal layer of the synovial membrane is largely responsible for
composition of the synovial fluid, which is a highly viscous, lubricating fluid and the
medium through which nutrients reach articular cartilage (Todhunter, 1996).
Hyaluronan and lubricin glycoproteins are synthesized by the synovial membrane cells
and are secreted into the synovial fluid. These molecules are thought to be important for
boundary lubrication of the joint surfaces and for regulating synovial fluid composition
by steric exclusion of larger molecules from the synovial cavity (Frisbie, 2006).
The articular cartilage is a specialized connective tissue, elastic and compressible
in nature, which covers opposing subchondral bone. It functions to reduce the stress
applied to bone and to provide the nearly frictionless movement of the joint (Frisbie,
2006). Within the synovial joint, when cartilage loading results in increased hydrostatic
pressure, water is released from the extracellular matrix, contributing to lubrication of

5
the joint surfaces (Dijkgraaf et al., 1995). Articular cartilage is avascular and
alymphatic, depending completely upon diffusion through the cartilage matrix to and
from the synovial fluid for nutrition and elimination of waste products (Dijkgraaf et al.,
1995). The cartilage is also anueral, and pain perception within the synovial joints is
dependent on nerve endings in the synovium, capsule, muscle, and subchondral bone
(Dijkgraaf et al., 1995). Chondrocytes, the cellular component of articular cartilage, are
responsible for synthesis and maintenance of the extracellular matrix (Neil et al., 2005).
During normal activity and exercise, joint loading encourages diffusion of chondrocyte
nutrients and waste products through the matrix (Dijkgraaf et al., 1995; Todhunter,
1996). The extracellular matrix is composed primarily of water, collagens and
proteoglycans, with a small percentage of glycoproteins (Fig. 1). The biochemical
composition of the extracellular matrix is responsible for the biomechanical features of
the tissue, including resilience and elasticity (Dijkgraaf et al., 1995).
Collagen fibrils are the main component of the extracellular matrix, constituting
about 60% dry weight of hyaline cartilage and providing the fibrous, structural backbone
to the matrix (Dijkgraaf et al., 1995; Poole et al., 2002). The anatomical arrangement of
collagen fibrils at various depths of cartilage provides structural support (Goodrich and
Nixon, 2006). The collagen network provides cartilage with flexibility and strength and
serves to counteract the swelling pressure of hydrophobic proteoglycans (Dijkgraaf et
al., 1995). Collagen fibrils are more concentrated at the articular surface where they are
required to resist tensile strain during weight bearing (Todhunter, 1996).

6
Fig. 1. Organization of the extracellular matrix components in articular cartilage. (Adapted from Frisbie, 2006).
Chondrocyte produced type II collagen is the primary collagen type found in
articular cartilage, comprising about 85 to 90% of the total collagen content (Todhunter,
1996). Type II collagen is a homotrimeric right-handed helix, composed of three
identical α1(II) chains arranged in fibrils, that is thought to provide articular cartilage
with its tensile strength (Todhunter, 1996; Frisbie, 2006). Each α chain contains nearly
1000 amino acid residues, and, except for the short sequences at the end of the chains,
every third amino acid is glycine (Todhunter, 1996). The repeating triplet of amino

7
acids can be represented by Gly-X-Y, where X and Y represent other amino acids, 22%
of which are proline and 4-hydroxyproline, respectively (Platt, 1996).
Fibril formation is critical for achieving the physiologic strength of the collagen
framework (Ray et al., 1996). Type II collagen is synthesized and secreted from the
chondrocyte as a procollagen molecule that contains nonhelical propeptide extensions at
the amino and carboxy terminal ends (McIlwraith, 2005). Extracellular cleavage of
these extensions yields the collagen molecule, with the cleaved extensions serving as
useful markers to monitor collagen synthesis. As collagen is synthesized, the newly
released type II collagen molecules associate in the matrix to form the collagen fibrils by
means of intermolecular cross-linking (Platt, 1996). Cross-linking occurs once the basic
fibril has been formed within the same collagen molecule and between adjacent collagen
molecules, forming a 3-dimensional meshwork (McIlwraith, 2005).
Conversely, during the remodeling process, when type II collagen fibrils are
cleaved by collagenases, normally hidden epitopes are uncovered and can be quantified
to study cartilage metabolism (Todhunter, 1996). The helical portion of the type II
collagen molecule can be cleaved across all three chains or in nonhelical sites (Platt,
1996; Billinghurst, 1997). During intrahelical cleavage, collagenases cleave the fibrillar
type II collagen at a single site (Gly775-Leu/Ile776) within each α chain of the triple
helical collagen molecule, about three quarters of the distance from the amino-terminal
end of each chain (Billinghurst, 1997). This yields both three-quarter and one-quarter
length collagen fragments (Billinghurst, 1997). These cleaved collagen fragments
spontaneously denature and become susceptible to continued degradation by

8
collagenases, including MMP-1, -8, and -13, proteinases, such as MMP-3, and the
gelatinases MMP-2 and -9 (Billinghurst, 1997).
Proteoglycans are complex macromolecules that make up the remaining 40% of
the matrix. They consist of one or more glycosaminoglycan (GAG) chains covalently
attached to a protein core (Todhunter, 1996). Negatively charged GAG side-chains repel
each other and draw water into the extracellular matrix, providing compressive stiffness
(Frisbie, 2006; Goodrich and Nixon, 2006). Aggrecan, the most abundant proteoglycan
found in cartilage, associates with collagens and other proteoglycans, including
hyaluronan. Link protein simultaneously binds hyaluronan and the aggrecan monomer,
decreasing the dissociation constant. Hyaluronan functions to perform a space-filling or
lubrication role within the synovial joint (Todhunter, 1996). As many as 100 aggrecan
monomers associate with hyaluronan in the form of large aggregates, providing
compressive stiffness, resiliency and durability (McDonald et al., 1994). The
concentration of proteoglycan increases with increasing depth from the articular surface,
most likely to resist compression (Todhunter, 1996).
The articular cartilage extracellular matrix is a dynamic system, constantly
exposed to catabolic and anabolic factors (Dijkgraaf et al., 1995). In healthy cartilage, at
each stage of development, relative rates of matrix synthesis and degradation are
adjusted in order to achieve net growth or remodeling. Chondrocytes, while only
constituting a small percentage of the cartilage, maintain and turn over the entire matrix
(Todhunter, 1996). Dynamic load and cytokines, such as interleukins (IL) and tumor
necrosis factor α (TNFα) have been shown to accelerate matrix turnover (Todhunter,

9
1996). These factors influence production and activation of degradative enzymes that
can break down the matrix. This process is offset by the synthesis of enzyme inhibitors
and growth factors, including insulin-like growth factor 1 (IGF-1) and transforming
growth factor β (TGF β), that have been shown to increase the production of collagens
and proteoglycans while reducing their degradation (Platt, 1996). Normal degradation of
the matrix is under tight regulation. Matrix metalloproteinases 1 and 3 (MMP 1 and
MMP 3), collagenase and stromelysin, respectively, degrade collagen and proteoglycan
components of the matrix and are inhibited by tissue inhibitors of metalloproteinase 1
and 2 (TIMP 1 and TIMP 2; Todhunter, 1996). In normal articular cartilage, there is a
slight excess of TIMPs over MMPs (Dean et al., 1989). Pathologic processes, such as
degenerative joint disease (DJD), that involve gradual deterioration of the extracellular
matrix of articular cartilage may result from a shift in the tight regulatory control of
chondrocyte metabolism.
By increasing the rate of degradation and decreasing synthesis, cytokines induce
the depletion of proteoglycan in normal cartilage (Todhunter, 1996). Interleukin-1 (α
and β; IL-1α and β) has been studied with regard to its effect on chondrocyte and
synovial lining cell metabolism. Activity of IL-1 is present in normal equine synovial
fluid, and induction of equine articular cartilage degradation occurred when recombinant
human IL-1 was added to explant culture (McDonald et al., 1994; May et al., 1994a). In
vitro studies have confirmed IL-1 as a potent stimulator of MMP secretion by
chondrocytes in normal equine cartilage (McDonald et al., 1994). The effects of IL-1 on
articular cartilage metabolism can be repressed by IGF-1 and transforming growth

10
factor-β (TGF-β). Hyaluronan has also been shown to inhibit IL-1 mediated
proteoglycan degradation in bovine articular cartilage explants (Morris et al., 1992).
Antagonistic effects of IL-1 on synovial lining cells may occur through the action of
inhibitors residing in equine synovial fluid (May et al., 1994a).
The synovial joint relies on the health of each of its components to function
properly, with particular emphasis placed on cartilage maintenance. In order to remodel
and maintain articular cartilage, a certain amount of joint loading is required, which can
be accomplished by normal activity and exercise. However, overloading of cartilage can
lead to overproduction and prolonged exposure to deleterious enzymes and
inflammatory mediators. Chronic exposure to inflammation and overloading of the
joint, which can result from overtraining, can shift normal homeostatic processes of
cartilage metabolism. This response to loading and overloading for the joint varies with
age of horse.
Effects of Age on Articular Cartilage Metabolism
There are few reports on the effects of ageing and maturation on healthy and
diseased equine articular cartilage. Adaptation of bone and soft tissue occurs during
growth and training in the young equine model (Brama et al., 1998). During this
adaptation, horses experience repetitive trauma and stress to synovial joints, which can
result in an overproduction of inflammatory mediators, eventually leading to breakdown
of the articular cartilage (Kidd et al., 2001). Early modifications can influence mature
cartilage, known to have little capacity for repair and remodeling (Todhunter, 1996).
Maroudas et al. (1992) stated that due to slow turnover of collagen in mature articular
11
cartilage, the collagen framework is laid down prior to maturity and undergoes little
change thereafter. This statement was supported by a later study, which demonstrated
that enzymatic modifications of the collagen network are not affected by age after
maturity in both human and equine articular cartilage (Brama et al., 1999). Little and
Ghosh (1997) hypothesized that the regional chondrocyte phenotype of mature cartilage
results from factors such as weight-bearing and articulation, imposed on the joint
postpartum. If heterogeneous characteristics of the collagen network are induced by
biomechanical loading, early changes may be decisive for the final makeup of the tissue
and, consequently for future strength and resilience to injury.
During periods of rapid growth, in the initial stages of life, composition of the
extracellular matrix changes dramatically. Brama et al. (1998) found MMP activity in
the synovial fluid of joints of juvenile horses, 5 to 11 mo in age, to be almost twice that
of adult joints, aged 4-30, indicative of a greater matrix turnover in juvenile horses.
With the completion of this maturation phase, the cartilage remodeling continues, but at
a slower rate, as the need for greater tissue turnover for net growth decreases
(Todhunter, 1996; Brama et al., 2000). Brama et al. (2000) investigated functional
adaptations of equine articular cartilage, and discovered that the foal is born with a
biochemically homogeneous joint with regard to proteoglycan and collagen content, as
well as, the posttranslational modifications of the collagen network, such as cross-
linking. It was also determined that the content of water, DNA and GAGs declines
significantly during maturation, while the content of collagen and hydroxylysine
increase (Brama et al., 2000). The water content of articular cartilage has been shown to

12
decrease with age in numerous species, including horses (Kempson, 1980; Todhunter,
1996). Decreases in DNA content have also been shown in other species, verifying
cellular density of articular cartilage declines with age up to the time of skeletal maturity
(Stockwell, 1971; Igarashi and Hayashi, 1980).
With increasing age, composition of the extracellular matrix changes and this is
accompanied by reduced sensitivity of chondrocytes to cytokines, demonstrated by
McDonald et al. (1994) using recombinant human IL-1 (Todhunter, 1996). Results
showed increased GAG synthesis in cartilage explants from young horses, aged 11 mo to
1 yr, in response to recombinant human IL-1 exposure. It was also shown that for a
given increase in IL-1 dose, the change in GAG synthesis was greater for cartilage from
young horses than mature horses. Fubini et al. (1993) concluded similar results in vivo,
demonstrating an age-effect response on equine articular cartilage injected with the
corticosteroid methylprednisolone acetate. Younger ponies, aged less than 10 yr,
showed more severe depletion of proteoglycan than older ponies, aged greater than 10
yr, signifying decreased chondrocyte responsiveness as horses age. Therefore,
depending on the age under investigation, healing and restoration of articular cartilage
will vary.
According to the available research, it appears that the composition and
responsiveness of equine articular cartilage changes with age. The processes of
degradation and synthesis involved in cartilage metabolism differ depending on the age
of horse, with younger, growing horses experiencing a metabolic shift toward synthesis
to achieve net cartilage synthesis. While this continues in the mature horse, it does so at

13
a much slower rate. Although normal articular cartilage metabolism seems to vary
among immature and mature horses, differences may also exist when the natural balance
of degradation and synthesis is disrupted in a diseased state.
Joint Disease in Horses
The term OA is a broad description of a group of disorders characterized by
varying degrees of articular cartilage deterioration, often accompanied by changes in the
bone and soft tissue (Todhunter, 1996). Factors associated with the pathogenesis of OA
include age, genetic predisposition, and excessive mechanical loading of the joint
(Briston et al., 2009). Clinical manifestation mostly commonly involves a slowly
progressive lameness with probable joint pain, decreased range of motion and variable
joint effusion and inflammation (Kidd, et al. 2001). Inflammation that gives rise to
secondary synovitis within the synovial lining and joint capsule usually manifests later
from irritation due to the release of articular cartilage degradation products (Briston et
al., 2009). Within a diseased joint there is a disturbance in the normal balance between
degradation and repair of articular cartilage as evidenced by net cartilage degeneration
(Kidd et al., 2001). The pathogenesis of OA is complex and the disease can develop in a
number of different ways. Still, the result is consistent, often producing clinical
symptoms of pain and lameness in the horse.
Inflammation as a result of repeated trauma, also termed use trauma, is common
in the joints of athletic horses (Palmer and Bertone, 1994b; Kidd et al., 2001). A
common clinical characteristic in the carpal and fetlock joints of young, actively training
racehorses, for example, is primary synovitis in the absence of articular cartilage

14
damage, defined as inflammation of the synovial membrane (McIlwraith, 2002).
Primary synovitis occurs as a result of severe injury or inadequately treated injuries.
With sufficient rehabilitation and rest, horses can recover. Yet, in reality, the rest period
is often shortened or neglected completely and horses often return to work too soon
since it can be difficult to objectively monitor recovery. The result is prolonged
production and exposure to inflammatory mediators, such as IL-1 and prostaglandin E2
(PGE2), and the subsequent release of enzymes, such as MMPs, with potential to damage
the articular cartilage matrix. Chronic joint inflammation may eventually result in an
imbalance of normal articular cartilage metabolism, with an increase in matrix
destruction, as evident by alteration in the biomechanical properties of the articular
cartilage and resultant limitations in the athletic capabilities of the horse (Palmer and
Bertone, 1994b). Matrix degradation is often accompanied by an increase in the
synthesis of type II collagen and aggrecan, however these newly synthesized molecules
are often damaged, compromising any effective attempts at repair (Poole et al., 2002).
Ultimately, the combination of insufficient rest and sustained work will lead to reduced
performance and lameness.
Mechanical factors of joint loading play a role in the pathogenesis of OA via use
trauma. In the healthy joint, a certain level of joint loading is required for lubrication
and production of the matrix components. Through repeated loading and hyperextension
of the limbs, the equine athlete is constantly testing the ability of the joint to withstand
mechanical demand. Under normal conditions, stimulation of extracellular matrix
synthesis, namely proteoglycan, is dependent on the magnitude and duration of applied

15
load. Strenuous exercise decreases GAG concentrations and can promote remodeling of
the subchondral bone, decreasing the natural compressive stiffness of the articular
cartilage (Palmer and Bertone, 1994b). Therefore, while moderate and cyclic
compression is beneficial, heavy and/or continuous loads can be harmful to the joints
(Palmer and Bertone, 1996).
Release of cytokines and inflammatory mediators is up regulated in OA
compared to the healthy joint. Catabolic cytokines IL-1 and TNFα increase beyond
normal levels, promoting production of MMPs and PGE2 and inhibiting synthesis of key
matrix components such as aggrecan and type II collagen (Frisbie, 2006). Bertone et al.
(2001) found significant differences in PGE2 concentrations between normal and
diseased joints from 89 horses aged 3 to 10 yr and subsequently described PGE2 above a
concentration of 22.5 pg/mL as a good-excellent marker for any joint disease. IL-1 has
also been shown to amplify the catabolic cascade by inhibiting production of naturally
occurring anti-arthritic molecules, including interleukin-1 receptor antagonist (IL-Ra)
and TIMPs (Frisbie, 2006). Anabolic cytokines such as IGF and TGF promote
chondrocytes to synthesize proteoglycans and type II collagen (Frisbie, 2006). Such
molecules play a role in osteoarthritis by promoting reparative efforts in diseased joints
(Frisbie, 2006).
The release of cytokines and inflammatory mediators initiates action of
deleterious enzymes that are also active in healthy joints. The MMPs collectively
possess the ability to degrade all major components of articular cartilage and, therefore,
play a large role in both health and disease of the articular cartilage. A key deleterious

16
effect of acute inflammation resides with the ability of IL-1 to encourage production and
activation of matrix destructive MMPs. In a diseased joint, the normal homeostasis of
anabolic chondrocyte synthetic activity and enzymatic breakdown of the matrix is
disrupted. Research suggests MMPs 1 and 3 are particularly important in the
pathogenesis of OA (Todhunter, 1996). Brama et al. (1998) found elevated MMP
activity in the synovial fluid of OA adult metacarpophalangeal joints compared to
normal joints, indicative of a shift toward net degradation of tissue.
Structural changes with OA include alterations in the articular cartilage. Mild
OA manifests as fibrillation of the cartilage surface with some loss of chondrocytes,
accompanied by initial increases in the water content (Kidd et al., 2001). As the
collagen framework of the matrix is further disrupted, water is increasingly attracted to
the negatively charged GAGs, causing cartilage to swell. Eventually resistance to force
is reduced and deep clefts develop with the progression of OA. This process can be
characterized microscopically by a loss of proteoglycan. With continued damage to the
cartilage, small pieces of cartilage and subchondral bone are released into the joint
space, further encouraging the inflammatory cycle (Kidd et al., 2001).
The joint capsule becomes increasingly vascular and starts to thicken in response
to inflammation in OA. A cyclic inflammatory cycle begins with the release of
inflammatory mediators and cytokines, such as IL-1 and TNFα from synoviocytes and
chondrocytes. With the release of MMPs and cytokines the inflammatory cycle is
perpetuated, causing hypertrophy of the synovial lining of the joint (Kidd et al., 2001).
While the synovial membrane itself has no known role in the biomechanics of the joint,

17
injury to this area may have negative consequences for the joint. Damage to
synoviocytes potentially causes release of degradative enzymes and cytokines, which
ultimately contribute to changes in the articular cartilage (Evans, 1992).
Pain associated with OA is a common reason for the development of joint-related
problems in the horse. While the articular cartilage itself is aneural, surrounding tissues
are not and have been defined as sources of pain in cases of OA (Frisbie, 2006). Sensory
nerves in these tissues respond to chemical mediators and mechanical stimuli. With
joint inflammation, local mediators are released that act on these nerves to stimulate
activation directly or lower the threshold to other stimuli (Schaible et al., 2002; Hinz and
Brune, 2004). Substance P, an 11-amino acid neuropeptide, is released into the synovial
fluid from articular type C nerve fibers, and has been suggested as a mediator
responsible for equine articular pain (Caron, 1996; de Grauw et al., 2006). Multiple
studies have demonstrated increased levels of synovial fluid substance P in arthritic
versus normal equine joints (Caron et al., 1992; Kirker-Head et al., 2000). de Grauw et
al. (2006) found higher levels of substance P in clinically painful joints that responded
positively to intra-articular anaesthesia (IAA), suggesting a direct role in articular
nociception in horses.
Prostaglandins, specifically PGE2, are also thought to play a role in pain
associate with equine OA because of the pain relief from treatment with non-steroidal
anti-inflammatory (NSAID) drugs (May et al., 1994b). Elevated levels of PGE2 have
been found in previous experiments with horses diagnosed with various types of joint
disease when compared to sound, non-arthritic horses (May et al., 1994b; Bertone et al.,

18
2001). Researchers have concluded that PGE2 is a good indicator of joint disease and
correlates with pain and severity of lameness. The pathological changes and clinical
manifestations associated with equine OA vary and are often undetectable before the
disease is well established. Early detection is key for prevention and current research is
focusing on methods for continued improvement in this area by studying OA in the
horse using various models to induce experimental osteoarthritic conditions.
Experimental Joint Disease
A model that produces joint disease is necessary for solving important questions
related to equine joint pathophysiology and repair. Previous studies have utilized intra-
articular injection with cartilaginous particles or monoiodoacetate to stimulate cartilage
destruction (Hurtig, 1988; Gustafson et al., 1992). These models failed to provide
information on the effects of synovial inflammation on articular cartilage in the absence
of primary cartilage damage. Other studies have applied more extreme techniques such
as euthanasia or permanent mechanical alteration to the joint to mimic acute joint disease
(Frisbie et al., 2008). Utilization of small doses of intra-articular E. coli derived LPS, an
integral structural component of the outer leaflet of the outer membrane of all gram-
negative bacteria, has been established as a model that mimics acute, local synovitis in
horses and provides a method for evaluation of cartilage metabolism and inflammatory
markers without permanent alteration to the joint (Raetz et al., 1991; Palmer and
Bertone, 1994a). Horses are thought to be 10 times more susceptible to LPS when
compared to other mammals, suggesting that equine chondrocytes may also be more
responsive to LPS (MacDonald et al., 1994). This high level of sensitivity may

19
predispose horses to rapid cartilage breakdown when synovial joints are exposed to LPS.
This is an important consideration for the utilization of this model to produce severe, but
transient joint inflammation.
The LPS endotoxin acts by reacting with receptors present on the membrane of
target cells, resulting in release of various inflammatory mediators including cytokines
and eicosanoids (Morris, 1991). When interacting with the cell surface of macrophages,
LPS activates membrane-bound phospholipase A2, liberating arachidonic acid and
increasing its metabolism via the cyclooxygenase and lipoxygenase enzyme systems
(Fig. 2). This ultimately produces physiologically active eicosanoids including PGE2, a
cyclooxygenase end product of arachidonic acid (Morris, 1991). Previous investigators
have used varying doses of E. coli derived LPS in the horse to produce a temporary,
local inflammatory response similar to clinical inflammatory conditions. Firth et al.
(1987) utilized high doses of LPS, ranging from 25 to 45 μg, in the middle carpal joint of
ponies to produce a severe, sterile arthritis as a model to study infectious arthritis. All
ponies were reported as lame within 2 h post-injection and all showed systemic signs of
endotoxemia, including fever and depression, all of which subsided by 36 h post-
injection (Firth et al., 1987). A decreased dosage of 3 μg/joint was used more recently to
study the response of the antebrachiocarpal joint to a severe inflammation with respect to
eicosanoid and cytokine production (Hawkins et al., 1993). Injection induced signs of
acute inflammatory arthritis, including increases in PGE2 concentration in principal

20
Fig. 2. The arachidonic acid cascade (Adapted from Caron and Genovese, 1993).
versus control joints, yet only mild, transient discomfort and minimal systemic effect.
Palmer and Bertone (1994a), utilizing mature horses, found LPS doses of 0.125 ng to
5,000 ng per joint adequate to induce synovitis clinically similar to acute synovitis in the
horse. Synovial fluid total nucleated cell count and total protein were linearly related to
increasing dosages of intra-articular LPS ranging from 0.125 to 0.5 ng. Intra-articular
LPS injections of 0.5 ng resulted in mild to moderate joint effusion without any signs of
systemic illness, while doses greater than 0.5 ng caused fever, depression and non-
weight-bearing lameness (Palmer and Bertone, 1994a). The 0.125 ng dose produced
mild to moderate effusion and warmth of the injected joint, mild resistance to palpation
and grade 2 lameness, yet in order to maintain synovitis, repeated injections were

21
performed at 48, 96 and 144 h. Other studies since have used 0.25 ng and 0.5 ng of LPS
to prevent the need for multiple injections.
More recent studies have confirmed use of LPS in small doses for the induction
of temporary, local joint inflammation. Meulyzer et al. (2009) observed no signs of
systemic illness in mature horses (aged 14.4 ± 2.1 yr) injected with 0.25 and 0.5 ng intra-
articular LPS into both radiocarpal joints. Resultant pain and lameness was resolved by
48 h post-injection. Also using mature horses (aged 5 to 8 yr), de Grauw et al. (2009)
found the clinical response to LPS and changes in routine synovial fluid parameters to
closely parallel previous results reported by Meulyzer et al. (2009) and Palmer and
Bertone (1994a). An overt inflammatory response, prompted by 0.5 ng intra-articular
LPS assigned to a random carpal joint, was transient and did not produce systemic signs
of endotoxemia, confirming effects as localized and limited to the injected joint.
Following a similar protocol to induce inflammation, Lucia et al. (2013) demonstrated
differences in the relative time course and concentrations of cartilage and inflammatory
mediators in the carpal joints of weanling horses (aged 184 to 327 d) injected with 0.25
ng and 0.5 ng intra-articular LPS. A contralateral control, injected with 0.8 mL sterile
lactated Ringer’s solution (LRS), was utilized to establish the effects of intra-articular
LPS compared to the effects of repeated arthrocentesis alone. Synovial PGE2 levels
increased in both the LPS and LRS-injected joints, yet levels were higher in response to
0.25 and 0.5 ng intra-articular LPS, demonstrating the importance of a sham-injected
control joint in these types of studies (Lucia et al., 2013).

22
LPS in ng quantities is an established model that can be used to study the
inflammatory response in equine synovial joints, without permanent alteration to the
joint. Previous studies have utilized this model to investigate levels of PGE2, however
other processes, including the process of cartilage metabolism in response to a single
inflammatory insult using LPS, are also the subject of much of the current research.
Measurement and analysis of synovial fluid biomarkers can provide valuable
information for investigating diagnostic differences between diseased and healthy joints,
to distinguish the degree of degradation in articular cartilage and to assess potential
variation in these factors between horses of different ages.
Synovial Fluid Biomarkers
The term biomarker is a general term used to describe direct or indirect indicators
of abnormal tissue turnover (McIlwraith, 2005). These markers are usually molecular
products formed during normal metabolic processes. However, with diseases like OA,
when the natural balance of anabolism and catabolism is altered, concentrations of
biomarkers may increase or decrease. With disruption to the articular cartilage,
biomarkers are released into the synovial fluid. These markers can indicate repair,
synthesis, and degradation of articular cartilage, increased bone turnover or
inflammation, and can be used to help quantify these processes (Kidd et al., 2001).
When comparing concentrations of biomarkers utilized across several previous studies, it
seems there is an age related response to induced inflammation.
Several biomarkers have been implicated for measuring inflammation and
cartilage metabolism. A number of cytokines and eicosanoids can be used as indirect

23
biomarkers that are not derived primarily from the tissues that make up the joint, but
have the potential to influence the metabolism of these tissues or the integrity of the
matrix (McIlwraith, 2005). Bertone et al. (2001) concluded that IL-6 is sensitive and
specific, while TNFα and IL-1β cannot adequately detect the presence of joint disease in
general. van den Boom et al. (2005) observed increases in synovial fluid TNFα 2 h post
exercise in response to exercise and repeated arthrocentesis. However, Jouglin et al.
(2000) found no correlation between degree of joint damage and TNFα levels.
Conclusions have also been made about eicosanoids, including PGE2, which has been
indicated a good to excellent marker of joint disease (Bertone et al., 2001). Gibson et al.
(1996) reported greater PGE2 concentrations in diseased middle carpal or
antebrachiocarpal joints compared to control joints. No differences were found in mean
concentrations of other eicosanoids: prostaglandin F2α (PGF2α), 6-keto-prostaglandin F1α
(6-keto-PGF1α), and leukotriene B4 (LTB4) (Gibson et al., 1996). Bertone et al. (2001)
found that concentrations of thromboxane B2 (TXB2) were actually less in severe, acute,
and chronic joints than normal joints, and therefore only concentrations below 31.5
pg/mL were reported as a very good predictor of joint disease. Eicosanoids are released
into synovial fluid with most any joint disease, with some variation among eicosanoids,
and are therefore a more sensitive indicator of joint disease in general (Bertone et al.,
2001).
Synovial PGE2 is an eicosanoid and mediator of local inflammation that has been
identified as an excellent marker of OA in naturally occurring arthritis (Bertone et al.,
2001). Eicosanoids are released into the synovial fluid with most any joint disease, and

24
are a sensitive indicator of joint disease in general. While PGE2 is elevated with any
joint disease, there is little information in the literature to establish normal values
(Bertone et al., 2001). Synovial PGE2 concentrations increase in response to intra-
articular LPS in both young and skeletally mature horses (de Grauw et al., 2009; Lucia et
al., 2013). Lucia et al. (2013) reported peak PGE2 values at 12 h post LPS injection in
young horses while de Grauw et al. (2009) saw increases at 8 h post-injection in mature
horses. Both studies observed sharp, short-lived increases in synovial PGE2
concentrations, yet the variations between studies may be due to differences in the age of
horse under investigation.
Briston et al. (2009) reported age-related differences in PGE2 synthesis by equine
cartilage explants from 3 age groups: A (≤ 10 yr), B (11-20 yr), and C (≥ 20 yr).
Explants from group A were the least sensitive to LPS, while explants from group C
were the most responsive. Increases in PGE2 concentrations were observed for aged
horses (group C) in response to LPS concentrations of 10 μg/mL by 18 h and by 24 h
and all subsequent times for LPS concentrations of 1.0 μg/mL. Explants from young
horses (group A) were resistant at all concentrations (0.1 to 100 μg/mL) and at all times
between 12 and 48 h. Group B horses demonstrated a strong initial response to 10
μg/mL LPS at both 12 and 18 h, however PGE2 concentrations did not increase after this
time. Results from this study demonstrate increased PGE2 concentrations with age when
exposed to LPS, and the continued release of inflammatory mediators like PGE2.
Synovial concentrations of PGE2 and length of exposure may contribute to the activation
of degradative pathways via chondrocytes and play a role in the progression of OA.

25
Ultimately this could lead to degenerative changes in articular cartilage in response to
mechanical load or the enhanced degradative sensitivity in older horses (Briston et al.,
2009).
Cartilage metabolism can be measured using biomarkers for the degradation and
synthesis of the two major articular cartilage components: type II collagen and
proteoglycan. Antibodies have been developed to identify type II collagen fragments
that have been cleaved and/or denatured, uncovering neoepitopes that were formerly
inaccessible (Fig. 3; Hollander et al., 1994). Elevated levels of degraded type II collagen
have been demonstrated in synovial fluid and serum from horses, dogs, and rabbits using
various experimental models for OA (Billinghurst et al., 1997). The COL2-3/4Cshort ,
also known as C1,2C, immunoassay detects collagenase-cleaved collagen fragments, but
is not specific, detecting the degradation of both types I and II collagens (McIlwraith,
2005). Keratan sulphate (KS) is a specific GAG molecule found in proteoglycan
molecules of aggrecan that has been evaluated as an indicator of cartilage turnover.
However, in one study, synovial fluid KS concentrations were found to be less valuable
indicators of joint disease despite findings that total sulphated GAG levels were found to
be useful (Palmer et al., 1995). Additionally, Frisbie et al. (1999) concluded KS to be a
marker with little potential value in the horse. Chondroitin sulphate (CS) is the major
GAG of aggrecan and has proven to be a useful marker of aggrecan synthesis
(McIlwraith, 2005). Frisbie et al. (1999) demonstrated higher synovial fluid CS-846
concentrations in joints with osteochondral fragmentation than in control joints,
indicating higher re-synthesis of aggrecan in OA compared to normal joints. The CS-

26
846 epitope is found in fetal and OA cartilage, but is almost completely absent in
healthy, mature cartilage, indicating that it may not be a reliable biomarker to measure
the effects of age on cartilage metabolism (McIlwraith, 2005).
Fig. 3. Illustration of the principle behind detecting a marker of collagen degradation. Specific epitopes are direct markers, but most indirect markers are also detected with help of antibodies. (Adapted from McIlwraith, 2005). Direct biomarkers of cartilage turnover include breakdown products of type II
collagen and proteoglycan fragments, which are liberated in increased concentrations
into the synovial fluid (Ray et al., 1996). Initiated by IL-1, this catabolic process in
articular cartilage leads to the stimulated release of MMPs that have been implicated as
useful biomarkers to monitor early OA (Brama et al., 1998; McIlwraith, 2005). In
27
humans, total MMP activity was shown to be 136% increased in OA joints compared to
control joints. van den Boom et al. (2005a) found increased concentrations of equine
synovial MMP-1 in response to inflammation as a result of repeated arthrocentesis. In
another study, synovial MMP activity was higher in in adult (mean age 13.4, range 4-30)
osteoarthritic metacarpophalangeal joints than in normal joints (Brama et al., 1998).
Results from the same study also demonstrated an age-related effect on MMP activity
with decreased activity in normal adult metacarpophalangeal joints compared to normal
juvenile (aged 5 to 11 mo) joints (Brama et al., 1998). Since MMPs are essential for
matrix turnover and because they play a key role in OA, they have the potential to act as
useful tools to assess the status of articular cartilage.
In healthy cartilage, rates of matrix synthesis and degradation vary depending on
maturity and are adjusted to achieve net growth or remodeling (Todhunter, 1996). The
major biomarkers of collagen turnover in cartilage are epitopes of type II collagen
(Garvican et al., 2010). With OA, normal joint metabolism homeostasis is disrupted.
Degradation exceeds repair and the result is a net loss of articular cartilage. With
continued exposure to inflammation, the reparative efforts of articular cartilage fail and
collagen is cleaved by collagenases. This degradative process forms tropocollagen,
which is composed of three identical α helixes each containing an amino and a carboxy
terminus. Further degradation of tropocollagen by collagenases produces α chains and
peptide fragments that expose epitopes that are normally hidden (Todhunter, 1996).
These small peptide fragments are taken up by the chondrocytes, enter into circulation,
and are further degraded by lysosomal enzymes or diffuse into the synovial fluid.

28
Peptide fragments can be easily measured in synovial fluid or serum and can potentially
help identify early or subtle tissue damage.
Type II collagen is the major component of the extracellular matrix and in OA,
degradation of type II collagen increases (Poole et al., 2002). Analysis of these
breakdown product fragments can provide valuable information with regard to cartilage
turnover. The C2C antibody recognizes collagenase-cleaved type II collagen fragments
Garvican et al., 2010). The concentration of C2C increases in anterior cruciate
transection in dogs (Matyas et al., 2004). Chu et al. (2002) found increased synovial
fluid C2C concentrations at 4, 8 and 16 weeks after induction of experimental arthritis
using monopolar radiofrequency energy applied arthroscopically to the cranial cruciate
ligament compared to normal dogs. These findings indicate that the C2C antibody may
serve as a useful biomarker to determine the condition of a joint, and particularly
articular cartilage
There are limited studies investigating effect of age on levels of synovial fluid
C2C in horses. However, two different studies found increased levels of catabolic C2C
in weanling and skeletally mature horses subjected to a single inflammatory insult using
0.5 ng LPS and a similar arthrocentesis protocol (de Grauw et al., 2009; Lucia et al.,
2013). In young horses, C2C concentrations decreased from 0 to 6 h, but peaking at 24
h post LPS injection (Lucia et al., 2013). A similar rise in C2C was seen in mature
horses, with peak values also occurring at 24 h post-injection, however, values were 2
times greater (800 ng/mL; de Grauw et al., 2009) in mature horses than those (400
ng/mL; Lucia et al., 2013) observed in young horses. While these results suggest that

29
levels of C2C are influenced by LPS injection, there also may be a varied response with
age of horse.
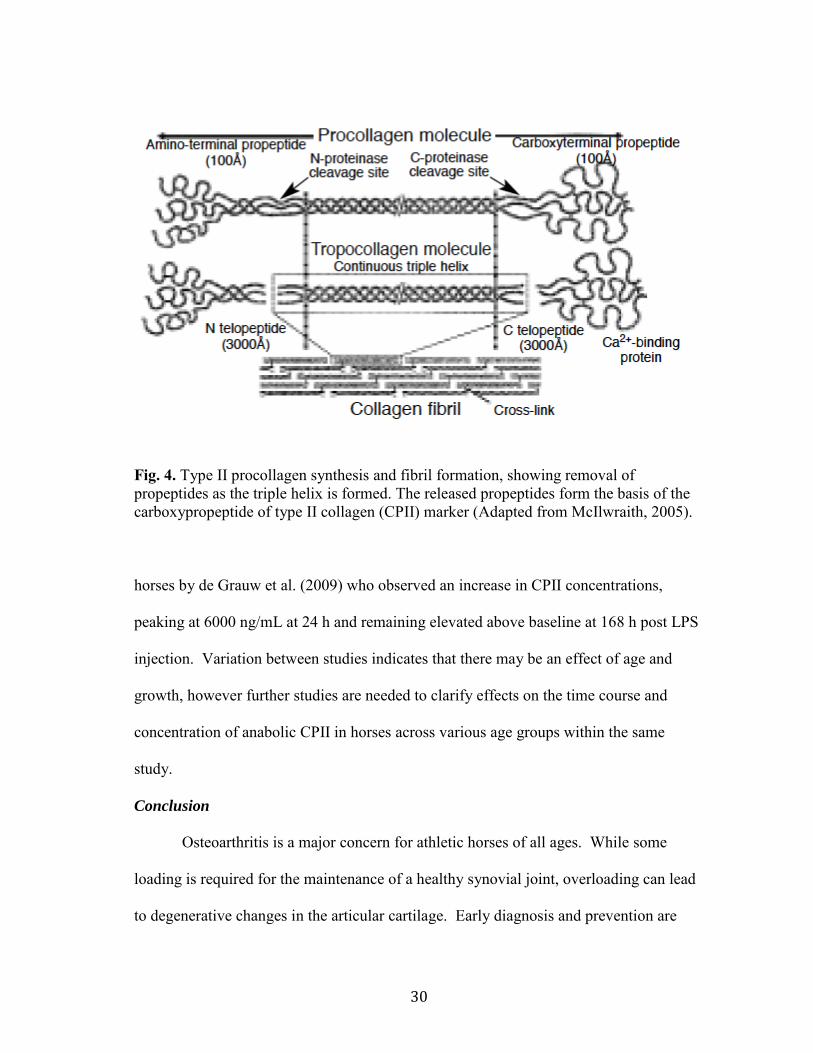
During fibril formation, carboxypropeptide of type II collagen (CPII) is
proteolytically cleaved from the procollagen strand and, thus represents a marker of type
II collagen synthesis (Fig. 4). The concentration of this peptide has been directly related
to the rate of collagen synthesis, which increases in arthritic joints (de Grauw et al.,
2006). A metabolic shift towards cartilage synthesis that serves to mend damage to the
collagen framework has been observed in the young equine model. Lucia et al. (2013)
discovered increasing concentrations of CPII with increasing dosage of intra-articular
LPS. Anabolic CPII was linearly influenced by treatment with the exception of 12 and
168 h post-injection, when the 0.25 ng dosage of LPS yielded greater concentrations
than 0.5 ng. At 6 and 24 h, horses receiving the greatest LPS dosage had greater CPII
concentrations than horses that received intermediate and control doses. Since the half-
life within synovial fluid is only about 16 h, the cleaved propeptide is a good indicator of
recent collagen synthesis (Garvican et al., 2010). Type II procollagen is expressed at
much lower levels in adult horses, which may have relevance to changes that occur
naturally in the cartilage of older horses (McIlwraith, 2002).
The CPII molecule increases in response to 0.5 ng LPS in the joints of young and
skeletally mature horses. Frisbie et al. (1999) found increased CPII concentrations in
young (2 to 4 yr) exercising horses in response to osteochondral fragmentation. Lucia et
al. (2013) observed peak values of about 3500 ng/mL at 24 h post LPS injection in
young horses. These values are about 2 times lower than those observed in mature
30
Fig. 4. Type II procollagen synthesis and fibril formation, showing removal of propeptides as the triple helix is formed. The released propeptides form the basis of the carboxypropeptide of type II collagen (CPII) marker (Adapted from McIlwraith, 2005). horses by de Grauw et al. (2009) who observed an increase in CPII concentrations,
peaking at 6000 ng/mL at 24 h and remaining elevated above baseline at 168 h post LPS
injection. Variation between studies indicates that there may be an effect of age and
growth, however further studies are needed to clarify effects on the time course and
concentration of anabolic CPII in horses across various age groups within the same
study.
Conclusion
Osteoarthritis is a major concern for athletic horses of all ages. While some
loading is required for the maintenance of a healthy synovial joint, overloading can lead
to degenerative changes in the articular cartilage. Early diagnosis and prevention are

31
key and the subject of much of the current research. In order to conduct research
regarding OA in young horses, a model of inflammation must be used. Previously LPS
has been used as a model for the study of transient, local inflammation. Biomarkers,
which show promise for early detection of equine OA and serve as a sensitive indicator
for experimental measurements, can be detected in synovial fluid from horses exposed to
a single inflammatory insult using ng quantities of LPS to quantify inflammation and
cartilage metabolism.
Previous studies using LPS and a number of other models have used immature or
mature horses to investigate the processes of OA. Adaptation of bone and soft tissue
takes place in the young equine model during growth and early training. In comparison
to the immature model, the response of bone and soft tissue in mature horses is
questionable. Comparing data across studies may not be accurate because horses may
have been exposed to different variables. A study using horses exposed to the same
experimental protocol and conditions, investigating inflammation and cartilage
metabolism to study the effects of age on these processes is needed. Therefore, the
objective of this study is to evaluate the influence of age on inflammation and cartilage
metabolism in horses in response to an acute inflammatory insult using LPS. The long-
term goal of this work will be to properly evaluate response of the equine joint,
specifically inflammation and cartilage metabolism, to an acute inflammatory insult
using LPS.

32
CHAPTER III
MATERIALS AND METHODS
All care, handling, and sampling of horses were approved by the Texas A&M University
Institutional Animal Care and Use Committee (AUP #2011-170).
Horses and Treatments
Eighteen Quarter Horses (n = 7 males, n = 11 females) were used in a
randomized complete design for a 28 d experiment. All horses were selected for age
from the Texas A&M University herd and had no history of lameness or use of anti-
inflammatory drugs for one year prior to the experiment. Horses were assigned to
treatment groups according to age, with yearlings (yearling; n = 3 males; n = 3 females),
2 to 3 yr olds (2/3; n = 2 males; n = 4 females), or skeletally mature 5 to 8 yr olds
(mature; n = 2 males; n = 4 females). Starting on d 0, horses were housed in individual
3.0 × 3.0 m stalls and fed diets that met or exceeded NRC (2007) requirements for the
age group. Horses were fed a commercially available 14% CP sweet feed (Producer’s
Cooperative Association, Bryan, TX) and coastal Bermuda grass hay (Cynodon
dactylon) twice daily at 0600 and 1730 (Table 1). They were allowed ad libitum access
to water and provided free exercise in dry lots from 0930 to 1700.
On d 14, horses were challenged with an intra-articular injection of LPS derived
from Escherichia coli O55:B5 (Sigma-Aldrich, St. Louis, MO). Intra-articular
treatments of LPS were assigned to a randomly selected radial carpal joint with the
remaining carpal joint serving as the contralateral control (CON). The LPS was

33
administered at 0.5 ng as previously described by Lucia et al. (2013) using weanling
horses. Purified LPS was reconstituted in sterile lactated Ringer’s solution (LRS) to
yield a stock solution of 1 mg/mL. Serial dilutions were performed from the stock
concentration to yield individual doses of 0.8 ml as described by de Grauw et al. (2009).
CON joints were injected with 0.8 ml of LRS.
Table 1. Nutrient analysis of diet components
Component Concentrate1 Coastal Bermudagrass Hay
(Cynodon dactylon) Moisture, % 7.65 7.55 Dry Matter, % 92.35 92.45 Crude Protein,2 % 18.82 11.26 ADF,2 % 9.47 33.87 NDF,2 % 16.83 61.05 DE,2 Mcal/kg 3.42 2.51 EE,2 % 6.84 3.53 Ca,2 % 1.14 0.6 P,2 % 0.73 0.22 K,2 % 1.35 1.12 Mg,2 % 0.26 0.34
114% CP sweet feed concentration (Producer’s Cooperative Association, Bryan, TX) 2Dry matter basis
Sample Collection
Prior to arthrocentesis, at pre-injection h 0 (PIH 0), both carpal joints were
clipped and aseptically prepared. Horses were sedated using 1.5 mL Sedivet®
(romifidine hydrochloride 1% Injection, Boehringer Ingelheim, Fremont, CA).
Additional lip and neck twitch restraint was used when necessary. Arthrocentesis was
performed by veterinarians from the Texas A&M University Large Animal Clinic.

34
Treatments (0.8 mL) were administered aseptically at a location medial to the extensor
carpi radialis tendon in the palpable depression between the radial carpal bone and the
third carpal bone to the depth of approximately 12.7 nm to avoid unnecessary contact
with the articular cartilage (McIlwraith and Trotter, 1996).
Synovial fluid samples (0.5 to 5.8 mL) were collected via arthrocentesis at PIH 0
and 6, 12, 24, 168 and 336 h post-injection and transferred into sterile, non-additive
tubes (BD Vacutainer® Blood Serum Collection Tubes, Franklin Lakes, NJ). Following
collection, samples were immediately placed on ice and further divided into small
aliquots (1.25 mL) that were stored at -20°C for later analysis. Heart rate (HR;
beats/min), respiratory rate (RR; breaths/min), and rectal temperature (RT; °C) were
recorded prior to arthrocentesis at PIH 0, and 6, 12, an 24 h post-injection. Prior to all
sample collections, at PIH 0, and 6, 12, 24, 168, and 336 h post-injection, carpal
circumference (cm) was measured at the level of the accessory carpal bone using a soft
tape measure and surface temperature (°C) of each carpal joint was determined using an
infrared camera (FLIR E60, FLIR Systems, Boston, MA). Wall temperature was
consistently measured to monitor ambient temperature and to provide consistent
temperature data. Horses were continuously monitored for signs of anaphylaxis
throughout the first 24 hours post LPS injection.
Synovial Fluid Analysis
Synovial fluid samples were analyzed to determine concentrations of PGE2 using
commercial ELISA kits (R&D Systems, Minneapolis, MN) previously validated for use
in horses (Bertone et al., 2001; de Grauw et al., 2006). Synovial fluid samples required a

35
1:1.5, 1:2, 1:3, 1:4 or 1:5 dilution, depending on time post-injection using the calibrator
diluent provided in the kit. The mean minimum detectable dose was 30.9 pg/mL. The
interassay coefficient of variation (cv) averaged 10.6% and the mean intraassay cv was
6.7%.
A commercially available ELISA kit (IBEX Pharmaceuticals Inc., Quebec,
Montreal, Canada), previously validated for use in horses (Billinghurst et al., 2001;
Frisbie et al., 2008), was used to measure concentrations of synovial C2C. Standards
were diluted following kit recommendations, and samples were diluted at a 1:4 or a 1:5
dilution, depending on time post-injection. Samples and standards were diluted using an
assay buffer solution provided by the manufacturer. The minimum detectable dose for
C2C was 10 ng/mL. The interassay cv averaged 2.9% and the average intraassay cv was
4.8%.
A commercially available ELISA kit (IBEX Pharmaceuticals Inc., Quebec,
Montreal, Canada) with a similar protocol to the C2C ELISA kit was used to measure
concentrations of synovial CPII. Samples required a 1:4, 1:5, 1:6 or 1:7 dilution,
depending on time post-injection and standards were diluted following kit
recommendations using an assay buffer solution provided with the kit. The minimum
detectable dose for CPII was 50 ng/mL. The interassay cv averaged 3.0% and the mean
intraassay cv was 4.8%.
Statistical Analysis
Data were analyzed using PROC MIXED procedure of SAS (SAS Inst. Inc.,
Cary, NC). The model contained effects for age, time, knee, age by time interaction, and

36
age by time by knee interaction. This model uses both RANDOM and REPEATED
statements. This covariance structure specifies a random effect of differences between
animals and creates a correlation structure within animals that decreases with increasing
amount of time between measurements (Littell et al., 1998). A paired t-test was used to
compare age groups and individual time points. Significance differences were declared
as P ≤ 0.05, and P ≤ 0.10 was considered a trend toward significance.

37
CHAPTER IV
RESULTS
Physical Variables
All values for HR, RR, and RT were within normal range for each age group
(Gore et al., 2008). There was an age by time interaction observed for RT, with values
for yearlings being higher (P ≤ 0.03) than 2/3 yr olds and mature horses at 0, 12 and 24 h
post-injection (Table 2). Both HR and RT were affected by age, regardless of time, with
yearlings having greater (P ≤ 0.02) values (44.5 ± 0.7 beats/min; 38.1 ± 0.1°C)
compared to 2/3 yr olds and mature horses (37.0 ± 0.7 beats/min; 37.8 ± 0.1 °C and 33.2
± 0.7 beats/min; 37.7 ± 0.1 °C, respectively). In addition, 2/3 yr olds had faster (P <
0.01) HR values than mature horses. Values for HR and RT were influenced by time (P
< 0.01) for all horses, with peak values at 12 h post-injection (Table 2). Peak HR and
RT values correlated with measures of inflammation in all horses, as indicated by peak
synovial PGE2 concentrations at 12 h post-injection. Values for RR were unaffected by
age of horse, with no difference (P = 0.21) between age groups; however, RR tended to
be affected by time (P = 0.07), also peaking at 12 h post-injection for all horses (Table
2).

38
Table 2. Clinical assessment of equine vital signs following intra-articular lipopolysaccharide (LPS) injection.
Measure Age1
SEM P-Value
Yearling 2/3 Mature Age1 Time Age1 × Time HR4, beats/min 44.5 37.0 33.2 0.7 < 0.01 < 0.01 0.50
Hour 02 45.3 38.0 36.7 1.6
63 41.3 34.7 28.7 1.6 123 46.7 36.3 35.3 1.6 243 44.7 39.0 32.0 1.6 RR5, breaths/min 22.2 19.7 20.0 1.0 0.21 0.07 0.15
Hour 02 21.0 22.3 21.3 1.7
63 18.7 19.0 19.7 1.7 123 25.0 19.7 20.0 1.7 243 24.0 17.7 18.7 1.7
RT6, °C 38.1 37.8 37.7 0.1 0.01 < 0.01 0.01
Hour 02 38.3 37.9 37.6 0.1
63 37.7 37.6 37.5 0.1 123 38.3 38.0 37.9 0.1 243 38.2 37.9 37.8 0.1 1Age group: yearlings (yearling; n = 6), 2 to 3 yr olds (2/3; n = 6), and skeletally
mature 5 to 8 yr olds (Mature; n = 6). 2Pre-injection hour: prior to intra-articular LPS injection. 3Post-injection hour: after intra-articular LPS injection. 4Heart rate. 5Respiratory rate. 6Rectal temperature.

39
There were no differences (P = 0.58) in joint circumference (cm) between LPS
and CON knees, therefore data was combined into a single graph (Fig. 5). Joint
circumference was not influenced by age of horse (P = 0.84), however circumference
increased (P < 0.01) in both LPS and CON joints for all horses over time, with peak
values at 168 h post-injection (Fig. 5). Joint surface temperature (°C) was not different
(P = 0.24) in LPS and CON knees; therefore the data was combined and is shown in Fig.
6. There was an age by time interaction for carpal joint surface temperature that was
evident at PIH 0, and 6, 12, 168, and 336 h post-injection, when yearlings had higher (P
< 0.01) temperature values than mature horses (Fig. 6). At PIH 0 and 6, 12, 24, 168 and
336 h post-injection, yearlings had greater (P ≤ 0.05) or tended to have greater (P ≤
0.09) carpal surface temperatures than 2/3 yr olds (Fig. 6). Carpal joint surface
temperature was influenced by age, with yearlings having elevated (P < 0.01) values
(34.7 ± 0.1 °C) compared to 2/3 yr old and mature horses at all time points (33.8 ± 0.1
°C and 33.6 ± 0.1 °C, respectively; Fig. 6). There was also an effect of time (P < 0.01)
on surface temperature in LPS and CON joints, with values peaking at 6 h post-injection
for all horses (Fig. 6).

40
Fig. 5. Carpal circumference (cm; LS mean ± SEM) in horses after intra-articular injection with 0.5 ng lipopolysaccharide (LPS: derived from Escherichia coli O55:B5) or 0.8 mL sterile lactated Ringer’s solution (CON) at 0, 6, 12, 24, 168 and 336 h post-injection. 1Age group: yearlings (yearling; n = 6), 2 to 3 yr olds (2/3; n = 6), and skeletally mature 5 to 8 yr olds (Mature; n = 6).

41
Fig. 6. Carpal joint surface temperature (°C; LS mean ± SEM) in horses after intra-articular injection with 0.5 ng lipopolysaccharide (LPS: derived from Escherichia coli O55:B5) or 0.8 mL sterile lactated Ringer’s solution (CON) at 0, 6, 12, 24, 168 and 336 h post-injection. 1Age group: yearlings (yearling; n = 6), 2 to 3 yr olds (2/3; n = 6), and skeletally mature 5 to 8 yr olds (Mature; n = 6). *,**,***Different superscripts indicate differences (P ≤ 0.05) in carpal joint surface temperature among different age groups at specific time points post-injection.

42
Synovial Joint Inflammation
PGE2
Synovial PGE2 concentrations in LPS and CON joints from PIH 0, over 336 h are
shown in Fig. 7. Synovial PGE2 tended (P = 0.09) to be influenced by age, regardless of
time post-injection, with yearlings having decreased (P = 0.03) concentrations (528.8 ±
108.8 pg/mL) compared to mature horses (870.4 ± 101.3 pg/mL). Synovial PGE2 was
influenced by time post-injection for all horses, increasing (P < 0.01) to peak values at
12 h post-injection and returning to baseline by 336 h post- injection (Fig. 7). There was
a tendency for PGE2 values to be affected by knee for all horses across time, with LPS
injected joints tending to have higher (P = 0.06) concentrations (827.9 ± 84.5 pg/mL)
than CON joints (590.9 ± 87.2 pg/mL). Additionally, LPS joints had increased (P <
0.01) concentrations of synovial PGE2 at 6 and 12 h post-injection compared to CON
joints.

43
Fig. 7. Mean synovial fluid concentrations (pg/mL) of PGE2 in horses in the LPS knee (Panel A; 0.5 ng of intra-articular lipopolysaccharide derived from Escherichia coli O55:B5) and in the CON knee (Panel B; 0.8 mL of intra-articular sterile lactated Ringer’s solution) at 0, 6, 12, 24, 168 and 336 h post-injection. 1Age group: yearlings (yearling; n = 6), 2 to 3 yr olds (2/3; n = 6), and 5 to 8 yr olds (Mature; n = 6).

44
Biomarkers of Cartilage Metabolism
Catabolic C2C
Synovial concentrations of catabolic C2C over 336 h in LPS and CON injected
joints are displayed in Fig. 8. At 6 and 168 h post-injection, yearling horses had
decreased (P < 0.01) C2C concentrations compared to 2/3 yr olds and lower (P ≤ 0.03)
values compared to mature horses at 6, 24, 168, and 336 h (Fig. 8). At 12 h post-
injection 2/3 yr olds had lower (P = 0.03) concentrations of C2C than mature horses and
tended to have decreased (P = 0.07) concentrations over mature horses at 168 h.
Yearlings had increased (P < 0.01) levels of C2C over 2/3 yr olds and tended to have
increased (P = 0.09) levels over mature horses at 12 h (Fig. 8). Yearlings and 2/3 yr olds
had lower (P < 0.01) concentrations (200.1 ± 11.0 ng/mL and 219.7 ± 11.0 ng/mL) than
mature horses (275.1 ± 11.0 ng/mL) at all time points post-injection. For all age groups,
the LPS injected joint had higher (P = 0.02) concentrations (246.8 ± 9.0 ng/mL)
compared to CON joints (216.5 ± 9.0 ng/mL). There was an effect of time for all horses,
with concentrations increasing (P < 0.01) to peak values at 24 h (342.6 ± 13.1 ng/mL),
and returning to baseline by 336 h (Fig. 8).

45
Fig. 8. Mean synovial fluid concentrations (ng/mL) of catabolic collagenase cleavage neoepitope of type II collagen (C2C) in horses in the LPS knee (Panel A; 0.5 ng of intra-articular lipopolysaccharide derived from Escherichia coli O55:B5) and in the CON knee (Panel B; 0.8 mL of intra-articular sterile lactated Ringer’s solution) at 0, 6, 12, 24, 168 and 336 h post-injection. 1Age group: yearlings (yearling; n = 6), 2 to 3 yr olds (2/3; n = 6), and 5 to 8 yr olds (Mature; n = 6). a,bDifferent superscripts indicate differences (P ≤ 0.05) in synovial C2C concentration among different age groups at specific time points after injection.

46
Anabolic CPII
Synovial concentrations of anabolic CPII in LPS and CON joints from PIH 0,
over 336 h are shown in Fig. 9. There was an age by time interaction, most notable at 0,
24, 168 and 336 h. At PIH 0 and 336 h yearlings had lower (P ≤ 0.03) CPII
concentrations than 2/3 and mature horses (Fig. 9). Anabolic CPII levels in yearlings
and 2/3 yr olds were lower (P < 0.01) than mature horses at 24 h post-injection, while at
168 h yearling CPII tended to be lower (P = 0.06) than 2/3 yr olds and was decreased (P
< 0.01) compared to mature horses (Fig. 9). Anabolic CPII was influenced by age at all
time points post-injection, with yearlings tending to have lower (P = 0.06)
concentrations than 2/3 yr olds (2252.4 ± 196.4 ng/mL) and lower (P ≤ 0.02)
concentrations (1560.3 ± 253.9 ng/mL) compared to mature horses (2891.2 ± 216.1
ng/mL). Anabolic CPII was affected by time, in both LPS and CON joints for all horses,
with concentrations increasing (P ≤ 0.02) to 168 h, and returning to baseline by 336 h
post-injection (Fig. 9).

47
Fig. 9. Mean synovial fluid concentrations (ng/mL) of anabolic carboxypropeptide of type II collagen (CPII) in horses in the LPS knee (Panel A; 0.5 ng of intra-articular lipopolysaccharide derived from Escherichia coli O55:B5) and in the CON knee (Panel B; 0.8 mL of intra-articular sterile lactated Ringer’s solution) at 0, 6, 12, 24, 168 and 336 h post-injection. 1Age group: yearlings (yearling; n = 6), 2 to 3 yr olds (2/3; n = 6), and 5 to 8 yr olds (Mature; n = 6). a,bDifferent superscripts indicate differences (P ≤ 0.05) in synovial CPII concentration among different age groups at specific time points after injection.

48
CPII:C2C
Ratios of synovial fluid CPII to C2C concentrations in LPS and CON joints from
PIH 0, over 336 h are shown in Fig. 10. An age by time interaction for both LPS and
CON knees was observed and was most notable at 6 h post-injection when yearlings
showed higher (P = 0.04) ratio values than mature horses and at PIH 0 and 336 h post-
injection when yearling horses had lower (P < 0.01) ratio values than both 2/3 and
mature horses (Fig. 10). CPII:C2C was influenced by age, regardless of time post-
injection, with mature and 2/3 yr old horses having increased (P < 0.01) values
compared to yearlings. There was also an effect of time, with peak values for all horses
increasing (P < 0.01) up to 336 h post-injection.

49
Fig. 10. Ratio of the mean synovial fluid concentration of carboxypropeptide of type II collagen (CPII) to the mean synovial fluid concentration of collagenase cleavage neoepitope of type II collagen (C2C) in horses in the LPS knee (Panel A; 0.5 ng of intra-articular lipopolysaccharide derived from Escherichia coli O55:B5) and in the CON knee (Panel B; 0.8 mL of intra-articular sterile lactated Ringer’s solution) at 0, 6, 12, 24, 168 and 336 h post-injection. 1Age group: yearlings (yearling; n = 6), 2 to 3 yr olds (2/3; n = 6), and 5 to 8 yr olds (Mature; n = 6). a,bDifferent superscripts indicate differences (P ≤ 0.05) in synovial CPII:C2C among different age groups at specific time points after injection.

50
CHAPTER V
DISCUSSION
In the current study, measurements for HR, RR, and RT were all within normal
range for each age group. Values for HR and RT were greater in younger horses
compared older horses, however normal vitals are expected to be elevated in young
horses compared to mature (Gore et al., 2008). Additionally, HR, RR, and RT values
peaked at 12 h post LPS injection for all horses, which corresponds to peak
inflammation, as indicated by peak synovial PGE2 concentrations. All vitals returned to
baseline values by 24 h post- injection, which is most likely an indication of horses
becoming more comfortable with handling procedures. Clinical responses of HR, RR,
and RT showed no signs of systemic illness and were similar to those previously
reported in studies utilizing young or mature horses exposed to a single inflammatory
insult using nanogram quantities of LPS (de Grauw et al., 2009; Lucia et al., 2013).
Joint effusion as a result of LPS-induced inflammation and/or repeated
arthrocentesis, can lead to increased joint circumference. Joint circumference did not
differ between age groups, however circumference values did increase above baseline by
168 h in all horses in response to LPS injection and repeated arthrocentesis. This differs
from a previous study that showed peak circumference values at 24 h post-injection
(Lucia et al., 2013). However, Lucia et al. (2013) only recorded circumference values
up to 24 h post-injection, and did not report values at168 h. In the current study, surface
temperature of carpal joints was greater in yearlings than the 2/3 yr olds and mature
horses. Values peaked 6 h post-injection, prior to peak synovial PGE2 concentrations

51
and decreased back to baseline by 24 h in all horses as inflammation subsided. No
previous studies examining the effects of an LPS challenge on carpal joint surface
temperature have been found, therefore no comparisons can be made at this time.
Synovial PGE2 is a mediator of inflammation that has been described as an
excellent indicator of equine OA (Bertone et al., 2001). Increases in synovial PGE2 have
been demonstrated using various experimental models including exercise, osteochondral
fragmentation, and LPS (Frisbie et al., 2008; de Grauw et al., 2009; Lucia et al., 2013).
With experimental induction of inflammation using LPS, eicosanoid concentrations,
including PGE2, vary depending on time post-injection. In the current study, an
inflammatory response was observed across age groups as indicated by increases in
synovial PGE2 concentrations. Synovial PGE2 tended to be greater in mature horses
compared to yearling horses. These results indicate an increased inflammatory response
in older horses in response to LPS injection. This is consistent with a previous in vitro
study that demonstrated age-related differences in PGE2 production by equine cartilage
explants (Briston et al., 2009). Explants from aged horses were the most sensitive to
LPS, producing significantly greater concentrations of PGE2, suggesting that PGE2
concentrations increase with age (Briston et al., 2009). Over time, with chronic
exposure to inflammatory mediators like PGE2, degradative changes to the articular
cartilage could result from mechanical load or an increased sensitivity to degradation in
older horses.
Values for PGE2 peaked for all horses at 12 h post-injection, returning to
baseline by 336 h, indicating a transient inflammation in response to intra-articular LPS
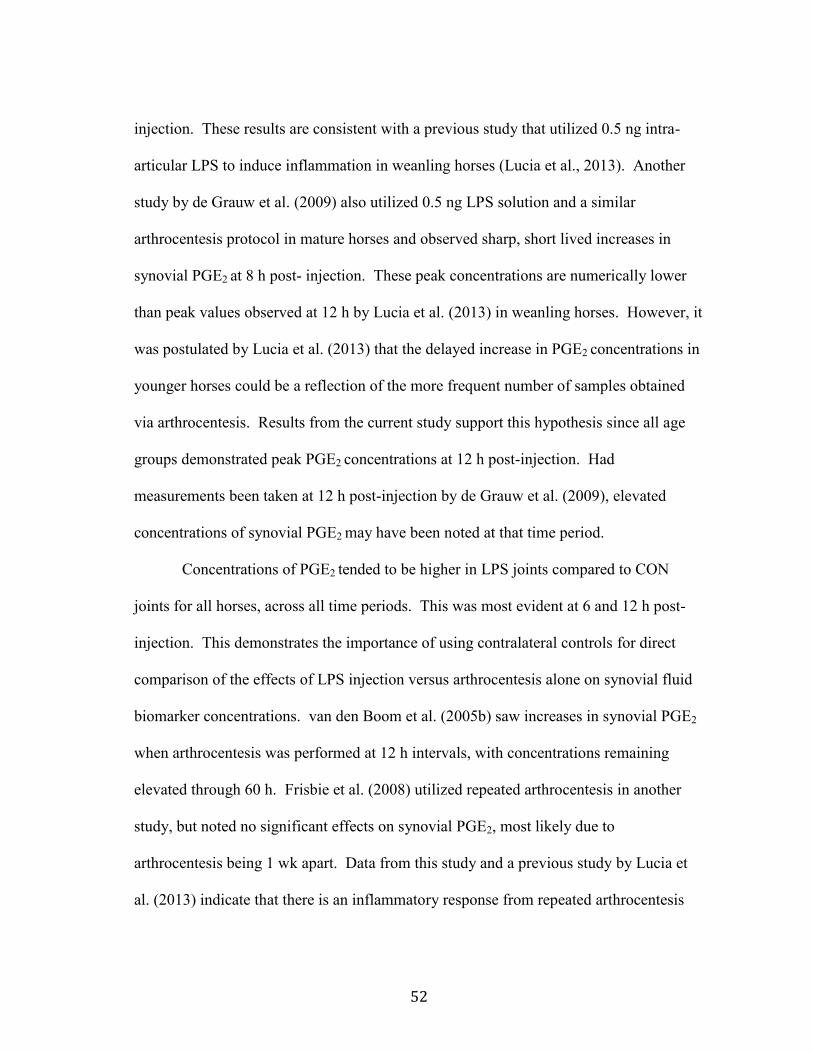
52
injection. These results are consistent with a previous study that utilized 0.5 ng intra-
articular LPS to induce inflammation in weanling horses (Lucia et al., 2013). Another
study by de Grauw et al. (2009) also utilized 0.5 ng LPS solution and a similar
arthrocentesis protocol in mature horses and observed sharp, short lived increases in
synovial PGE2 at 8 h post- injection. These peak concentrations are numerically lower
than peak values observed at 12 h by Lucia et al. (2013) in weanling horses. However, it
was postulated by Lucia et al. (2013) that the delayed increase in PGE2 concentrations in
younger horses could be a reflection of the more frequent number of samples obtained
via arthrocentesis. Results from the current study support this hypothesis since all age
groups demonstrated peak PGE2 concentrations at 12 h post-injection. Had
measurements been taken at 12 h post-injection by de Grauw et al. (2009), elevated
concentrations of synovial PGE2 may have been noted at that time period.
Concentrations of PGE2 tended to be higher in LPS joints compared to CON
joints for all horses, across all time periods. This was most evident at 6 and 12 h post-
injection. This demonstrates the importance of using contralateral controls for direct
comparison of the effects of LPS injection versus arthrocentesis alone on synovial fluid
biomarker concentrations. van den Boom et al. (2005b) saw increases in synovial PGE2
when arthrocentesis was performed at 12 h intervals, with concentrations remaining
elevated through 60 h. Frisbie et al. (2008) utilized repeated arthrocentesis in another
study, but noted no significant effects on synovial PGE2, most likely due to
arthrocentesis being 1 wk apart. Data from this study and a previous study by Lucia et
al. (2013) indicate that there is an inflammatory response from repeated arthrocentesis

53
alone. However, this response appears to be decreased compared to LPS injection and
the accompanying arthrocentesis protocol.
The C2C antibody recognizes fragments of collagenase-cleaved type II collagen.
A previous study observed increases in type II collagen degradation in response to
exercise and joints subjected to osteochondral fragmentation (Frisbie et al., 2008).
Increased concentrations of catabolic C2C have been observed using LPS-induced
inflammation in both young and skeletally mature horses (de Grauw et al., 2009; Lucia
et al., 2013). Variation in C2C concentrations exists across studies, with peak
concentrations at 24 h observed by de Grauw et al. (2009) in mature horses being two
times greater than values seen by Lucia et al. (2013) in weanlings also at 24 h. In the
current study, peak synovial C2C values occurred at 24 h post-injection for all age
groups. At this time, mature horses had concentrations of synovial C2C (443.17 ± 23.46
ng/mL) that were approximately one and a half times higher than yearling and 2/3 yr old
horses (312.83 ± 22.40 ng/mL and 271.76 ± 22.41 ng/mL, respectively). The results
from the current study, in conjunction with those from previous studies, show increased
C2C concentrations with age, indicating an increased degradative response in mature
horses exposed to intra-articular LPS compared to younger horses.
Synovial C2C concentrations were also elevated in LPS joints compared to CON
joints in the current study. An increased inflammatory response in LPS joints, as
indicated by greater levels of synovial PGE2, can lead to cartilage breakdown.
Degradation of the articular cartilage, quantified using concentrations of synovial C2C,
is most likely increased in joints exposed to LPS injection rather than repeated

54
arthrocentesis alone, due to an increased inflammatory response (Garvican et al., 2010).
Concentrations of synovial C2C have been shown to increase with joint inflammation in
rabbits and with osteochondral injury in Thoroughbred racehorses (Kojima et al., 2001;
Trumble et al., 2009). Therefore, it is probable that LPS injection, which is an
established model of experimental inflammation, has an effect on synovial C2C
concentrations, through its ability to induce the release of inflammatory mediators such
as PGE2, leading to the enzymatic breakdown of type II collagen (de Grauw et al., 2009;
Lucia et al., 2013).
Associated with the increased cleavage of collagen by collagenases is a rise in
the synthesis of matrix molecules, including type II collagen, which is proteolytically
cleaved from the procollagen strand during fibril formation. Frisbie et al. (2008)
demonstrated increased collagen synthesis with exercise and osteochondral
fragmentation as evidenced by increased synovial fluid CPII under these conditions.
Values for CPII have also been found to increase in response to intra-articular LPS
injection in both growing and mature horses, with variation in concentration between
studies (de Grauw et al., 2009; Lucia et al., 2013). Results from the current study are
consistent with the previous data that reported synovial CPII values in mature horses to
be two times greater than young horses. In the current study peak CPII values (4,886.74
± 435.74 ng/mL) at 24 h in mature horses are approximately two times greater than those
observed at 24 h for yearling and 2/3 yr old horses (2,046.67 ± 455.35 ng/mL and
1901.20 ± 426.08 ng/mL, respectively), indicating increased synthesis of the type II
collagen component of articular cartilage in mature horses.

55
A metabolic shift toward re-synthesis serves to mend damage to the cartilage
framework after exposure to inflammatory mediators and deleterious enzymes. While
articular cartilage repair involves replacement of the damaged matrix, the tissue does not
necessarily return to its original structure or function (Frisbie, 2006). Newly synthesized
matrix molecules are often damaged, compromising any effective attempts at cartilage
matrix repair (Poole et al., 2002). Matrix turnover in mature horses is slow and in young
individuals metabolism is sustained at a higher level to allow for growth and remodeling
(Brama et al., 1998). In the current study ratios of CPII to C2C showed a shift toward
re-synthesis in both the young and the mature equine model, which, for young horses,
correlates with results by Lucia et al. (2013). In the current study, mature horses showed
increased ability for articular cartilage repair over young horses, possibly because the
amount of degradation in these horses was higher overall. This elevated ability towards
re-synthesis in mature horses may also be accompanied by increased damage to matrix
molecules shown to be important for the integrity of the joint and its ability to function.
The results in the current study were surprising, however values for mature horses did
peak at 336 h, later than younger horses at 168 h, possibly indicating the slower turnover
rate in mature horses compared to young horses. Therefore, the current study suggests
that mature horses may have an increased ability to re-synthesize cartilage in response to
inflammation and enzymatic breakdown when compared to younger horses, however the
process takes longer and may be accompanied by increased damage to newly
synthesized matrix molecules. Further studies are needed to clarify this relationship
between horses of varying age.

56
CHAPTER VI
SUMMARY
Although OA is believed to exist primarily in the aged horse, the disease is
thought to result from cartilage damage that may develop when training occurs early in
life. Results from this study indicate an increasing inflammatory response with age in
horses. This increased inflammation is accompanied by greater amounts of cartilage
degradation and repair and, likely, greater amounts of damage in the newly synthesized
cartilage. Additionally, with age, the rate of cartilage re-synthesis decreases. After a
single inflammatory insult, this decreased rate does not appear to limit the ability of the
mature horse to repair damaged cartilage. However, it is possible that without an
adequate rest period, the older equine athlete returning to work may not have time to
sufficiently complete the cartilage repair process. Therefore, further studies are needed,
to confirm the effects of age on inflammation and cartilage metabolism in exercising
horses exposed to chronic joint inflammation.

57
LITERATURE CITED
Bertone, A. L., J. L. Palmer, and J. Jones. 2001. Synovial fluid cytokines and
eicosanoids as markers of joint disease in horses. Vet. Surg. 30:528-538.
Billinghurst, R. C., L. Dahlberg, M. Ionescu, A. Reiner, R. Bourne, C. Rorabeck, P.
Mitchell, J. Hambor, O. Diekmann, H. Tschesche, J. Chen, H. van Wart, and A.
R. Poole. 1997. Enhanced cleavage of type II collagen by collagenases in
osteoarthritic articular cartilage. J. Clin. Invest. 99:1534-1545.
Brama, P. J., J. M. TeKoppele, R. A. Bank, A. Barneveld and P. R. van Weeren. 2000.
Functional adaptation of regional biochemical characteristics up to age one year.
Equine Vet. J. 32:217-221.
Brama, P. J., J. M. TeKoppele, R. A. Bank, P. R. van Weeren, and A. Barneveld. 1999.
Influence of site and age on biochemical characteristics of the collagen network
of equine articular cartilage. Am. J. Vet. Res. 60:341-345.
Brama, P. J., J. M. TeKoppele, B. Beekman, P. R. van Weeren, and A. Barneveld. 1998.
Matrix metalloproteinase activity in equine synovial fluid: influence of age,
osteoarthritis, and osteochondrosis. Ann. Rheum. Dis. 57:697-699.
Briston, L., J. Dudhua, and P. Lees. 2009. Age-related differences in prostaglandin E2
synthesis by equine cartilage explants and synoviocytes. J. Vet. Pharmacol.
Therap. 33:268-276.

58
Caron, J. P. 1996. Neurogenic factors in joint pain and disease pathogenesis. In: C. W.
McIlwraith, and G. W. Trotter, editors, Joint disease in the horse. W. B.
Saunders, Philadelphia, PA. p. 70-80.
Caron, J. P. and D. H. Genovese. 2003. Principles and practices of joint disease
treatment. In: M. W. Ross, and S. J. Dyson, editors, Diagnosis and management
of lameness in the horse. Elsevier, Philadelphia, PA. p. 746-764.
Caron, J. P., R. M Bowker, R. H. Abhold, D. S. Toppin, I. M. Sonea, and K. B. Vex.
1992. Substance P in the synovial membrane and fluid of the equine middle
carpal joint. Equine Vet. J. 24:364-366.
Chu, Q., M. Lopez, K. Hayashi, M. Ionescu, R. C. Billinghurst, K. A. Johnson, A. R.
Poole, and M. D. Markel. 2002. Elevation of a collagenase generated type II
collagen neoepitope and proteoglycan epitopes in synovial fluid following
induction of joint instability in the dog. Osteoarthr. Cartil.. 10:662-669.
de Grauw, J. C., C. H. van de Lest, and P. R. van Weeren. 2009. Inflammatory mediators
and cartilage biomarkers in synovial fluid after a single inflammatory insult: a
longitudinal experimental study. Arth. Res. Ther. 11:R35.
de Grauw, J. C., C. H. van de Lest, P. R. van Weeren, H. Brommer, and P. J. Brama.
2006. Arthrogenic lameness of the fetlock: synovial fluid markers of
inflammation and cartilage turnover in relation to clinical joint pain. Equine Vet.
J. 38:305-311.

59
Dean, D. D., J. Martel-Pelletier, J. P. Pelletier, D. S. Howell, and J. F. Woessner. 1989.
Evidence for metalloproteinase and metalloproteinase inhibitor imbalance in
human osteoarthritic cartilage. J. Clin. Invest. 84:678-685.
Dijkgraaf, L. C., L. G. Debont, G. Boering, and R. S. Liem. 1995. Normal cartilage
structure, biochemistry, and metabolism: a review of the literature. J. Oral.
Maxillofac. Surg. 53:924-929.
Evans, C. H. 1992. Response of synovium to mechanical injury. In: G. A. M. Finerman,
and F. R. Noyes, editors, Biology and biomechanics of the traumatized synovial
joint. American Academy of Orthopedic Surgery, Rosemont, IL, p. 17-26.
Firth, E. C., T. Wensing, and F. Seyren. 1987. An induced synovitis disease model in
ponies. Cornell Vet. 77:107-118.
Frisbie, D. D. Synovial joint biology and pathobiology. 2006. In: J. A. Auer, and J. A.
Stick, editors, Equine surgery. Elsevier, St. Louis, MO. p. 10376-1055.
Frisbie, D. D., F. Al-Sobayil, R. C. Bilinghurst, C. E. Kawcak, and C. W. McIlwraith.
2008. Changes in synovial fluid and serum biomarkers with exercise and early
osteoarthritis in horses. Osteoarthr. Cartil. 16:1196-1204.
Frisbie, D. D., C. S. Ray, M. Ionescu, A. R. Poole, P. L. Chapman, and C. W.
McIlwraith. 1999. Measurement of the 846 epitope of chondroitin sulfate and of
carboxy propeptides of type II collagen for diagnosis of osteochondral
fragmentation in horses. Am. J. Vet. Res. 60:306-309.
Fubini, S. L., C. Boatwright, R. J. Todhunter, and G. Lust. 1993. Effect of
intramuscularly administered polysulfated glycosaminoglycan on articular

60
cartilage from equine joints injected with methylprednisolone acetate. Am. J.
Vet. Res. 54:1359-1365.
Garvican, E. R., A. Vaughn-Thomas, J. F. Innes, and P. D. Clegg. 2010. Biomarkers of
cartilage turnover. Part 1: markers of collagen degradation and synthesis. Vet. J.
185:36-42.
Gibson, K. T., H. Hodge, and T. Whittem. 1996. Inflammatory mediators in equine
synovial fluid. Aust. Vet. J. 73:148-151.
Goodrich, L. R., and A. J. Nixon. 2006. Medical treatment of osteoarthritis in the horse-a
review. Vet. J. 171:51-69.
Gore, T., P. Gore, and J. M. Giffin. 2008. Normal physiological data. In: B. Adelman,
editor, Horse owner’s veterinary handbook. Wiley Publishing, Inc., Hoboken,
NJ. p. 619-624.
Gustafson, S. B., G. W. Trotter, R. W. Norrdin, R. H. Wrigley, and C. Lamar. 1992.
Evaluation of intra-articularly administered sodium monoiodoacetate-induced
chemical injury to articular cartilage of horses. Am. J. Vet. Res. 53:1193-1202.
Hawkins, D. L., R. J. MacKay, G. G. Gun, P. T. Colahan, and J. C. Meyer. 1993. Effects
of intra-articularly administered endotoxin on clinical signs of disease and
synovial fluid tumor necrosis factor, interleukin 6, and prostaglandin E2 values in
horses. Am. J. Vet. Res. 54: 379-386.
Hinz, B., and K. Brune. 2004. Pain and osteoarthritis: new drugs and mechanisms. Curr.
Opin. Rheumatol. 16:628-633.
Hollander, A. H., T. F. Heathfield, C. Webber, Y. Iwata, R. Bourne, C. Rorabeck, and A.

61
R. Poole. 1994. Increased damage to type II collagen in osteoarthritic articular
cartilage detected by a new immunoassay. J. Clin. Invest. 93:1722-1732.
Hurtig, M. B. 1988. Use of autogenous cartilage particles to create a model of naturally
occurring degenerative joint disease in the horse. Equine Vet. J. 6:19-22.
Igarashi, M. and Y. Hayashi. 1980. Aging of in vivo cartilage cell. Adv. Expt. Med.
Biol. 129:111-122.
Jouglin, M., C. Robert, J. P. Valette, F. Gavard, F. Quintin-Colonna, and J. M. Denoix.
2000. Metalloproteinases and tumor necrosis factor-alpha activities in synovial
fluid of horses, correlation with articular cartilage alterations. Vet. Res. 31:507-
515.
Kempson, G. E. 1980. The mechanical properties of articular cartilage. In: L. Sokoloff,
editor, The joints and synovial fluid, volume II. Academic Press, New York,
NY. p. 177-238.
Kidd, J. A., C. Fuller, and A. R. S. Barr. 2001. Osteoarthritis in the horse. Equine Vet.
Edu. 13:160-168.
Kirker-Head, C. A., V. K. Chandna, R. K. Agarwal, E. A. Morris, A. Tidwell, M. O.
O’Callaghan, W. Rand, and S. A. Kumar. 2000. Concentrations of substance P
and prostaglandin E2 in synovial fluid of normal and abnormal joints of horses.
Am. J. Vet. Res. 61:714-718.
Kojima, T., F. Mwale, T. Yasuda, C. Girad, A. R. Poole, and S. Laverty. 2001. Early
degradation of type IX and type II collagen with the onset of experimental
inflammatory arthritis. Arthritis Rheum. 44:120-127.

62
Little, C. B., and P. Ghosh. 1997. Variation in proteoglycan metabolism by articular
chondrocytes in different joint regions is determined by post-natal mechanical
loading. Osteoarthr. Cartil. 5:49-62.
Lucia, J. L., J. A. Coverdale, C. E. Arnold, and K. N Winsco. 2013. Influence of an
intra-articular lipopolysaccharide challenge on markers of inflammation and
cartilage metabolism in young horses. J. Anim. Sci. 91:2693-2699.
MacDonald, M. H., S. M. Stover, N. H. Willits, and H. P. Benton. 1994. Regulation of
matrix metabolism in equine cartilage explant cultures by interleukin 1. Am. J.
Vet. Res. 53:2278-2285.
Maroudas, A., G. Palla, and E. Gilav. 1992. Racemization of aspartic acid in human
articular cartilage. Connect. Tissue Res. 28:161-169.
Matyas, J. R., L. Atley, M. Ionescu, D. R. Eyre, and A. R. Poole. 2004. Analysis of
cartilage biomarkers in the early phases of canine experimental osteoarthritis.
Arthritis Rheum. 50:543-552.
May, S. A., R. E. Hooke, and P. Lees. 1994a. Interleukin-1 stimulation of equine
articular cells. Res. Vet. Sci. 52:342-348.
May, S. A., R. E. Hooke, K. Y. Peremans, F. Verschooten, and P. Lees. 1994b.
Prostaglandin E2 in equine joint disease. Tijdschr. Diergeneeskd. 63:187-191.
McIlwraith, C. W. 2002. Diseases of joints, tendons, ligaments, and related structures.
In: T. S. Stashak, editor, Adams’ lameness in horses. Lea and Febiger,
Philadelphia, PA. p. 459-644.

63
McIlwraith, C. W. 2005. Use of synovial fluid and serum biomarkers in equine bone and
joint disease: a review. Equine Vet. J. 37:473-482.
Meulyzer, M., P. Vachon, F. Beaudry, T. Vinardell, H. Richard, G. Beauchamp, and S.
Laverty. 2009. Joint inflammation increases glucosamine levels attained in
synovial fluid following oral administration of glucosamine hydrochloride.
Osteoarthr. Cartil. 17:228-234.
Morris, D. D. 1991. Endotoxemia in horses: a review of cellular and humoral mediators
involved in its pathogenesis. J. Vet. Internal Med. 5:167-181.
Morris, E. A., S. Wilcox, and B. V. Treadwell. 1992. Inhibition of interleukin-1
mediated proteoglycan degradation in bovine articular cartilage explants by
addition of sodium hyaluronate. Am. J. Vet. Res. 53:1977-1982.
Neil, K. M., J. P. Caron, and M. W. Orth. 2005. The role of glucosamine and chondroitin
sulfate in treatment for and prevention of osteoarthritis in animals. J. Am. Vet.
Med. Assoc. 226:1079-1088.
Palmer, J. L., and A. L. Bertone. 1994a. Experimentally-induced synovitis as a model for
acute synovitis in the horse. Equine Vet. J. 26:492-495.
Palmer, J. L., and A. L. Bertone. 1994b. Review article. Joint structure, biochemistry and
biochemical disequilibrium in synovitis and equine joint disease. Equine Vet. J.
26:263-277.
Palmer, J. L., and A. L. Bertone. 1996. Joint biomechanics in the pathogenesis of
traumatic arthritis. In: C. W. McIlwraith and G. W. Trotter, editors, Joint disease
in the horse. W.B. Saunders Co., Philadelphia, PA. p. 104-119.

64
Palmer, J. L., A. L. Bertone, and H. McClain. 1995. Assessment of glycosaminoglycan
concentration in equine synovial fluid as a marker of joint disease. Can. J. Vet.
Res. 59:205-212.
Platt, D. 1996. Articular cartilage homeostasis and the role of growth factors and
cytokines in regulating matrix composition. In: C. W. McIlwraith and G. W.
Trotter, editors, Joint disease in the horse. W.B. Saunders Co., Philadelphia, PA.
p. 29-40.
Poole, A. R., M. Kobayashi, T. Yasuda, S. Laverty, F. Mwale, T. Kojima, T. Sakai, C.
Wahl, S. El-Maadawy, G. Webb. E. Tchetina, and W. Wu. 2002. Type II
collagen degradation and its regulation in articular cartilage in osteoarthritis.
Ann. Rheum. Dis. 61:ii78-ii81.
Raetz, C. R. H., R. T. Ulevitch, S. D. Wright, C. H. Sibley, A. Ding, and C. F. Nathan.
1991. Gram-negative endotoxin: An extraordinary lipid with profound effects on
eukaryotic signal transduction. FASEB. 5:2652-2660.
Ray, C. S., A. R. Poole, and C.W. McIlwraith. 1996. Use of synovial fluid and serum
biomarkers in articular disease. In: C. W. McIlwraith and G. W. Trotter, editors,
Joint disease in the horse. W.B. Saunders Co., Philadelphia, PA. p. 203-216.
Schaible, H. G., A. Ebersberger, and G. S. Von Banchet. 2002. Mechanisms of pain in
arthritis. Ann. N. Y. Acad. Sci. 966:343-354.
Stockwell, R.A. 1971. The interrelationship of cell density and cartilage thickness in
mammalian articular cartilage. J. Anat. 109:411-421.

65
Todhunter, R. J. 1996. Anatomy and physiology of synovial joints. In: C. W. McIlwraith
and G. W. Trotter, editors, Joint disease in the horse. W.B. Saunders Co.,
Philadelphia, PA. p. 1-28.
Todhunter, R. J., and G. Lust. 1990. Pathophysiology of synovitis: clinical signs and
examinations in horses. Compend. Contin. Educ. Practicing Vet. 26:980–992.
Trumble, T. N., A. B. Scarbrough, and M. P. Brown. 2009. Osteochondral injury
increases type II collagen degradation products (C2C) in synovial fluid of
Thoroughbred racehorses. Osteoarthr. Cartil. 17:371-374.
van den Boom, R., M. R. van de Harst, H. Brommer, P. A. J. Brama, A. Barneveld, P. R.
van Weeren, and J. DeGroot. 2005a. Relationship between synovial fluid levels
of glycosaminoglycans, hydroxyproline and general MMP activity and the
presence and severity of articular cartilage change on the proximal articular
surface of P1. Equine Vet. J. 37:19-25.
van den Boom, R., C. H. van de Lest, S. Bull, R. A. Brama, P. R. van Weeren, and A.
Barneveld. 2005b. Influence of repeated arthrocentesis and exercise on synovial
fluid concentrations of nitric oxide, prostaglandin E2 and glycosaminoglycans in
healthy equine joints. Equine Vet. J. 37:250–256.

66
APPENDIX
ELISA KIT PROTOCOLS
PGE2 (R&D Systems, Minneapolis, MN)
Synovial fluid samples were analyzed to determine concentrations of PGE2 using
commercial ELISA kits (R&D Systems, Minneapolis, MN) previously validated for use
in horses (Bertone et al., 2001; de Grauw et al., 2006). Synovial fluid samples required a
1:1.5, 1:2, 1:3, 1:4 or 1:5 dilution, depending on time post-injection using the calibrator
diluent provided in the kit. The mean minimum detectable dose was 30.9 pg/mL. The
interassay coefficient of variation (cv) averaged 10.6% and the mean intraassay cv was
6.7%.
First, 200 μL calibrator diluent was added to the non-specific binding (NSB)
wells and 150 μL to the zero standard (B0) wells. Approximately 150 μL of standard or
sample were then added to all remaining wells. The NSB, B0, samples and standards
were all run in duplicate. Next, 50 μL of primary mouse monoclonal antibody solution
was added to all wells excluding the NSB wells. The covered ELISA plate was then
incubated at room temperature for 1 h on a horizontal orbital microplate shaker (VWR
Microplate Shaker 120 V, Henry Troemner, LLC, Thorofare, NJ) at 525 rpm.
Approximately 50 μL of PGE2 conjugated to horseradish peroxidase was added to each
well. The covered plate was then incubated for 2 h at room temperature on the shaker at
525 rpm. The plate was washed (Labsystems Wellwash 4, Thermo Fisher Sci, Waltham,
MA) 4 times and blotted after the final wash. Substrate solution (200 μL) was added to

67
each well and the plate was incubated for another 30 min at room temperature, protected
from light. Stop solution (100 μL) was added to each well, changing the color of the
solution from blue to yellow. The optical density (OD) was determined within 30 min of
the final incubation using a microplate reader (BioRad 680 Microplate Reader, BioRad
Laboratories, Hercules, CA) set to 450 nm. The OD is inversely proportional to the
amount of PGE2 that is present in the samples.
Catabolic C2C (IBEX Pharmaceuticals Inc., Quebec, Montreal, Canada)
A commercially available ELISA kit (IBEX Pharmaceuticals Inc., Quebec,
Montreal, Canada), previously validated for use in horses (Billinghurst et al., 2001;
Frisbie et al., 2008), was used to measure concentrations of synovial C2C. Standards
were diluted following kit recommendations, and samples were diluted at a 1:4 or a 1:5
dilution, depending on time post-injection. Samples and standards were diluted using an
assay buffer solution provided by the manufacturer. The minimum detectable dose for
C2C was 10 ng/mL. The interassay cv averaged 2.9% and the average intraassay cv was
4.8%.
Sample (50 μL) was then added to a polypropylene mixing plate followed by the
addition of 50 μL of C2C antibody diluted in assay buffer. The mixing plate was pre-
incubated on the plate shaker for 30 min at room temperature (20 to 25°C) at 650 rpm.
All C2C incubations were performed at room temperature at 650 rpm. Approximately
80μL of the antigen-antibody mixture was then transferred to its corresponding well on
the C2C ELISA plate. The ELISA plate was then incubated for 1 h, allowing the

68
antibody to bind. The plate was washed 3 times and blotted dry after the final wash.
Goat anti-rabbit horseradish peroxidase (GAR-HRP; 100 μL) diluted in assay buffer was
then added to the plate and incubated for another 30 min. The ELISA plate was then
washed 6 times and blotted dry after the final wash. 100 μL tetra-methylbenzidine
(TMB) buffer warmed to room temperature was added to each well. The plate was
incubated again for 30 min and color development was monitored. The reaction was
then stopped by the addition of 100 μL stop solution/well, which changed the product
color from blue to yellow. Samples were quantified within 10 min of the completion of
the final incubation using a plate reader set at an OD of 450 nm. The OD is inversely
proportional to the amount of C2C that is present in the samples.
Anabolic CPII (IBEX Pharmaceuticals Inc., Quebec, Montreal, Canada)
A commercially available ELISA kit (IBEX Pharmaceuticals Inc., Quebec,
Montreal, Canada) with a similar protocol to the C2C ELISA kit was used to measure
concentrations of synovial CPII. Samples required a 1:4, 1:5, 1:6 or 1:7 dilution,
depending on time post-injection and standards were diluted following kit
recommendations using an assay buffer solution provided with the kit. The minimum
detectable dose for CPII was 50 ng/mL. The interassay cv averaged 3.0% and the mean
intraassay cv was 4.8%.
CPII samples and antibody were added to the polypropylene mixing plate
following the same protocol as the C2C ELISA kit. The mixing plate was then pre-
incubated for 60 min at 20 to 25°C at 650 rpm. All CPII incubations were performed at

69
room temperature at 650 rpm. The CPII antigen-antibody mixture was transferred to the
CPII ELISA plate using the same methods as the C2C kit. The CPII ELISA plate was
covered and allowed to incubate for 2 h. The ELISA plate was then washed 6 times and
blotted dry following the final wash. GAR-HRP was added to each well following the
same procedure as the C2C kit. The covered plate was then incubated for 30 min. The
plate was then washed another 6 times and blotted dry. TMB was added to each well
and a final 30 min incubation was performed. Color development was monitored and
stop solution was added. Samples were quantified using the same plate reader at an OD
of 450 nm. The OD is inversely proportional to the amount of CPII that is present in the
samples.