aftershocks: the impact of clinic violence on abortion
TRANSCRIPT

Aftershocks: The Impact of Clinic Violence on Abortion Services*
Mireille Jacobson RAND Corporation and NBER
and
Heather Royer University of California, Santa Barbara and NBER
January 7, 2010
Abstract The recent murder of Dr. George Tiller, one of only a few physicians in the United States who performed third trimester abortions, has brought attention back to the role of extreme violence in the anti-abortion movement. Between 1973 and 2003, abortion providers in the United States were the targets of over 300 acts of extreme violence, including arson, bombings, murders and butyric acid attacks. After a period of decline, abortion clinic violence is on the rise again. Using unique data on these attacks and on abortions, abortion providers, and births, we examine how this anti-abortion violence has affected providers’ decisions to perform abortions and women’s decisions about whether and where to terminate a pregnancy. We find that clinic violence reduces both abortion providers and abortions in the areas where the violence occurs. Once travel is taken into account, however, the overall effect of the violence is much smaller. On net, roughly 90 percent of the fall in abortions in targeted areas is balanced by a rise in abortions in nearby areas. Thus, the main consequence of this violence is a displacement of abortions rather the elimination of abortions, a presumed goal of this terrorism. JEL codes: J13, I18, D74 Keywords: abortion, fertility, terrorism
* We thank Doug Almond, Kelly Bedard, Tom Chang, Damon Clark, David Clingingsmith, John DiNardo, Claudia Goldin, Dr. David A. Grimes, Bob Kaestner, Peter Kuhn, Phil Levine, Stephen L. Ross, Justin Sydnor, Linda Waite, Madeline Zavodny and various seminar attendees for many helpful comments. We also thank the Robert Wood Johnson Foundation for financial support through the Health Policy Scholars program during this project’s infancy. Taylor Bishop, Ezra Golberstein, Feng Pan, Sarada Pyda, Stephen Roll, and Andrew Zhang provided excellent research assistance. Many people graciously shared the data that made this project possible. Brian Heidt, from the Bureau of Alcohol, Tobacco and Firearms made available and explained much of the data on clinic violence, Sharon Lau, at the National Abortion Federation, provided details on the data available on the NAF website, Ted Joyce shared his coding of parental consent and waiting period requirements, Becky Blank shared her data on Medicaid funding bans as well as other legislative barriers, Marianne Bitler and Madeline Zavodny shared their data on the timing of abortions, and Laurence Finer and Stanley Henshaw, from the Alan Guttmacher Institute, helped us access and understand the Institute’s census of abortions and abortion providers. All mistakes are our own.

Aftershocks: The Impact of Clinic Violence on Abortion Services
The recent murder of Dr. George Tiller, the sole abortion provider in Wichita, Kansas, has
drawn increased attention to the extreme elements of the anti-abortion movement. His murder adds
to a thirty-year history of violence. Between 1973 and 2003, anti-abortion activists carried out over
300 attacks (arsons, bombings, and butyric acid attacks at abortion facilities and the murder of
abortion providers) on abortion clinics in the United States.1,2 The frequency of these attacks makes
them one of the most common form of domestic terrorism in this country.3 Anti-abortion violence
was declining in more recent years, attributed by some to the presence of a pro-life presidential
administration. But with the election of a pro-choice president, clinics report increased harassment
and anticipate a rise in violence.4 Furthermore, anti-abortion activists claim that health care reform
that includes coverage for abortions could incite even more violence.5
In this paper, we examine how anti-abortion violence has affected providers’ decisions to
perform abortions and women’s decisions about whether and where to terminate a pregnancy. We
study the impact of abortion clinic violence with two motivations in mind. First, we are interested in
the direct effect of violence on the abortion market. The rise of anti-abortion violence in the 1980s
and 1990s coincides with a sustained decline in both abortions and abortion providers (see Data
Appendix Figures 1 and 2). While some maintain that this co-movement implies that these
phenomena are related (e.g., see Henshaw and Finer (2003)), the evidence is based largely on
descriptive data. In contrast, we exploit variation in the timing of the acts of violence to identify
their effects. Second, and more broadly, we use the violence to assess the success of terrorism.
Evidence on how well terrorist attacks achieve their intended goals is relatively thin.6 Anti-abortion
violence provides a useful case because the goals of these attacks are clear – to eliminate the market
for abortions.
Anti-abortion violence has caused considerable property damage and some loss of life,
increased the need for security at abortion clinics and increased the fear and stress of workers at 1 This classification is consistent with the National Abortion Federation, the organization of abortion providers in the United States. See http://www.prochoice.org/about_abortion/violence/index.html. 2 Butyric acid is a relatively new medium for abortion clinic violence. It has a putrid smell and can cause some respiratory harm if inhaled. 3 The FBI considers anti-abortion violence domestic terrorism. See, for example, page 19 of this document; http://www.fbi.gov/publications/terror/terroris.pdf. 4 See http://www.rhrealitycheck.org/blog/2009/03/02/under-a-prochoice-president-clinics-ready-uptick-violence. 5 See http://www.pbs.org/moyers/journal/07242009/transcript3.html. 6 Jaeger and Paserman (2008), Becker and Rubinstein (2009) and Gould and Klor (2009) are among the few studies in economics that address this issue.
1

abortion facilities and of women seeking abortion services.7 For instance, in 1993, a period of
heightened anti-abortion activity, 50 percent of clinics reported being the targets of violence and
harassment (Feminist Majority 2006).8 Such violence weighs heavily on abortion providers. More
recently, in 2005, a low violence year, 23 percent of facilities reported that at least one of their staff
members had resigned in that year due to anti-abortion violence, harassment or intimidation.9 In the
1990’s, this violence prompted President Clinton to sign the Freedom of Access to Clinic Entrances
(FACE) Act in 1994, making it a federal crime to prevent access to reproductive health care.
While this evidence is highly suggestive, it is also largely anecdotal. More systematic evidence
on the effects of violence is sparse despite the size of the market for abortions and the considerable
physical and psychological damage caused by anti-abortion extremists. The few in-depth studies of
anti-abortion activities (Doan 2007; Cozzarelli and Major 1994) concentrate on the influence of
picketing and protests as opposed to the more discrete and extreme events that are our focus.
Moreover, they suffer from the usual endogeneity problems inherent to cross-sectional studies –
leaving open the question of whether and how abortion clinic violence affects the market for
abortions. Understanding the effects of violence on this market is important given its size and
breadth. According to current statistics, 1 out of every 3 women in the United States will seek an
abortion in her lifetime and 1 pregnancy is terminated for every 4 births.10 Moreover, a diverse
population utilizes this market: in 2000, the percent of pregnancies aborted was 27 percent for
women with a high school degree or less, 38 percent for women with some college and 21 percent
for women with a college degree (Jones et al. 2002).
To our knowledge, this work is the first to systematically characterize the effect of abortion-
related terrorism on provider’s decisions to offer abortions and individual women’s decisions about
whether and where to terminate their pregnancies. To quantify the effect of abortion clinic violence
on health care providers’ decisions to offer abortions and women’s decisions about whether to
terminate a pregnancy, we combine detailed violence data with pre-existing county-level abortion
and birth data. We compare within-county provider rates, abortion rates, and births before and after
an act of extreme violence.
7 According to statistics from the Bureau of Alcohol, Tobacco, Firearms and Explosives (ATF), median damages were over $10,000 and as much as $2.4 million per incident (in 2000 dollars). Damage estimates are not reported for all incidents. See Fitzpatrick and Wilson (1999) on the psychological effects of violence on abortion clinic workers. 8Severe violence here includes blockades, invasions, arsons, bombings, chemical attacks, stalking, gunfire, physical assaults, and threats of death, bomb, or arson. 9 See http://www.feminist.org/research/cvsurveys/clinic_survey2005.pdf. 10 See http://www.guttmacher.org/in-the-know/index.html.
2

This collection of data enables us to paint a clear picture of the effect of clinic violence on
the market for abortions. We find that in targeted areas, abortion violence modestly reduces the
availability of providers by 6-9 percent and leads to declines in abortion rates of 8-9 percent. Clinic-
based providers experience the bulk of the impact; non-hospital-based abortion and provider rates
drop by 10-14 percent. The response varies by type of attack – e.g., damage-related acts (typically
arson) versus murders of abortion providers. In areas where a murder has occurred, we observe
declines in abortions and providers nearly 10 times the size of the average effect, albeit imprecisely
measured due to the infrequency of murders. Because murder generates substantially less property
damage than arson and bombing, one might infer that the effects of violence we measure are not
purely mechanical (i.e., effects due to clinic closings).11 Additionally, the effect size is not correlated
with the dollar value of damage, suggesting that our estimates capture some behavioral response,
rather than an incapacitation response, to terror. The reductions in abortions and providers persist
for several years after an attack.
An analysis limited to abortion and provider rates in affected counties captures only part of the
picture. Abortion rates rise in counties near to the violence, suggesting considerable displacement of
abortions. The rate of offset is roughly two-thirds, although statistically we are unable to distinguish
this estimate from a full offset. By looking at births, we can more precisely back out the averted
abortion effect from the displacement effect. A short-run rise in births following the violence
accounts for only 10 percent of the decline in abortions in affected areas. In the long-run, births are
unaffected. Thus, the primary effect of anti-abortion activities is a change in the location of
abortions. In other words, consistent with much of the literature on local abortion policies, women
respond to abortion restrictions but not necessarily in the way intended.12 Demand for abortions is
quite inelastic. Instead of reducing abortions, barriers – both formal and informal – prompt women
to travel to less abortion-restrictive areas when possible.
The credibility of these estimates relies on the assumption that the timing of these acts of
violence is random. To maximize the impact of the violence, perpetrators may want to surprise
providers to insure that the providers are unprepared to prevent or avoid an attack. However, we
take potential threats to identification seriously and provide several pieces of evidence that bias may
11 In response to the recent killing of Dr. George Tiller, his family announced that they were permanently closing his clinic. However, none of the prior murders led to permanent clinic closures, perhaps because they were not private practices and employed several physicians. 12 A sample of these studies include Bitler and Zavodny 2001; Blank et al. 1996; Currie and Cole 1997; Joyce et al. 1997; Joyce et al. 2001; Joyce et al. 2006; Kane and Staiger 1996; Pridemore and Frielich 2007; Rogers et al. 1991.
3

be minimal.
First, our results are robust to including a range of different controls – state abortion policy
variables, economic and demographic covariates, state-by-year fixed effects, and county linear
trends. Second, the estimates are similar using different sets of control counties, including only
counties that ever experienced violence or counties matched based on the propensity to experience
violence. Third, event study graphs reveal that the timing of the changes in abortions and births is
consistent with the timing of attacks. This is particularly evident for the monthly birth data, which
show a sharp and pronounced rise following an attack. Fourth, the violence is unlikely the product
of changes in local anti-abortion sentiment or activity since we observe no systematic run-up in local
abortion-related news coverage prior to the violence. Any remaining correlation between violence
and unobserved determinants of abortion is likely to bias our estimates downwards, since the
qualitative evidence suggests that this violence is often a response to pro-abortion activities
(Ginsburg 1998). In other words, anti-abortion activists resort to violence in an effort to undo pro-
abortion activities, a phenomenon made evident by the recent increase in violence.13
Our work contributes to the burgeoning literature on the economics of terrorism, which has
focused largely on understanding the characteristics of terrorists (Berman and Laitin 2008; Krueger
2007; Krueger and Malecokova 2003) and the aggregate effects of terrorism on specific industries or
on the economy as a whole (Abadie 2006; Abadie and Gardeazabal 2003; Berrebi and Klor 2006;
Eckstein and Tsiddon, 2004; Eisinger 2004; Glaeser and Shapiro 2002; Greenbaum and Hultquist
2006). Comparatively little work assesses the impact of terrorism on individual decisions or
opinions. Moreover, because the intentions of terrorists are often vague, as in the case of September
11th, we know remarkably little about the “success” of these acts.14
Our findings imply that anti-abortion terrorists are ultimately unsuccessful in obstructing the
market for abortions services. But the terrorism does impose a cost. Where terrorists have
effectively reduced abortion services or instilled significant fear and where alternative abortion
facilities exist, many women respond by traveling elsewhere to terminate their pregnancies. This 13 Recent reports of an uptick in harassment at abortion clinics following the election of Barack Obama, a firmly pro-choice candidate, further corroborate this view. See, for example the June 10th episode of The Rachel Maddow Show: http://www.msnbc.msn.com/id/26315908/#31177077 as well as numerous local news reports such as http://www.whnt.com/news/sns-ap-al--tillershooting-alaclinic,0,4717850.story. In addition, Cox proportional hazard models indicate that the timing of a local clinic attack is predicted by greater support for abortion services in the region (based on measures from the General Social Survey). 14 An important exception is Gould and Klor (2009), which assesses the effects of Palestinian terrorist attacks on Israeli political opinions. They find that individuals in targeted areas become more supportive of making territorial concessions to Palestinians and are more likely to support Palestinian statehood. They are also more likely to identify as right-wing, although this party has become increasingly liberal over time, a finding the authors attribute to terrorist attacks.
4

finding is consistent with Becker and Rubinstein (2009), who study bus-riding behavior in Israel
following suicide-bombings. Becker and Rubinstein demonstrate that individuals with relatively
inelastic demand, as measured by the frequency of their bus-riding, do not alter their behavior in the
long-run. The terrorism does affect the mode of transportation as some users substitute taxis for
buses. Together, these results suggest that terrorist attacks on markets for an inelastically-demanded
category of goods (e.g., abortions) for which there are close substitutes (e.g., an abortion at facility X
versus an abortion at facility Y), will have only limited effects on consumption.
I. Background on Abortion Clinic Violence The Development and Dispersion of the Abortion Clinic Violence Movement
Over the last 35 years, nearly 14 percent of counties with abortion providers have
experienced some form of extreme violence defined as an arson attack, bombing, bomb threat, hoax
device, murder, attempted murder, butyric acid attack, or vandalism. We discuss the source of these
violence data in the subsequent data section. We detail the history of these acts in Table 1.
The violence began in March 1976 with an arson attack of Planned Parenthood in Eugene,
Oregon. Thirteen other attacks occurred in the late 1970s, causing several million dollars worth of
damage. Individuals acting alone largely committed these early attacks. The organization and
frequency of attacks increased considerably in the 1980s (see Figure 1, the time series pattern of
acts). Abortion clinic violence peaked in 1984, 1992, and 1998. Current data since the inauguration
of President Obama indicates that such violence may be on the rise. The National Abortion
Federation reports that anti-abortion activity is at highest level in the past decade (Reuters, 2009).
The growth in violence in the 1980s observed in Figure 1 coincides with the development of
organized anti-abortion groups. Many scholars posit that extremist anti-abortion groups developed
out of frustration over the failure to overturn Roe (Ginsburg 1998). Among the first groups
dedicated to disrupting the market for abortions was the Pro-Life Action League, which started in
Chicago in 1980. Joe Scheidler, the head of the League, advocated a range of disruptive activities,
including “sidewalk counseling,” sit-ins, jamming sewer lines, and blowing up water meters. His
1985 book, “Closed: 99 Ways to Stop Abortion,” sought to disseminate these tactics nationwide.
In 1988, Operation Rescue, another “direct-action” pro-life group, began under the
leadership of Randall Terry, a Scheidler “trainee.” Relative to Scheidler, Terry advocated a more
confrontational form of protest – including clinic blockades and invasions (Ginsburg 1998).
5

Although Operation Rescue never formally endorsed acts of violence, the group made a militant call
to action with its slogan: “If you think abortion is murder, act like it.” It organized several highly-
publicized, large-scale, multi-week clinic protests and blockades, the first of which, the “Siege of
Atlanta,” coincided with the 1988 Democratic National Convention in Atlanta. In 1991 in Wichita,
Kansas, the group initiated the “Summer of Mercy,” which blockaded 3 abortion clinics for 6 weeks.
In contrast to the Pro-Life Action League and Operation Rescue, the third main
organization responsible for many anti-abortion acts, the Army of God (AOG) explicitly advocates
violence as a means to end abortion. The AOG is an informal network of anti-abortion extremists
that first received public mention in 1982. The group produces a manual that, according to the
National Abortion Federation (NAF), is “a ‘how to’ for abortion clinic violence,” detailing methods
for butyric acid attacks, arson, bomb-making, and similar activities.15 An occasional AOG
spokesman, Neal Horsely, hosted the infamous “Nuremberg Files” website, which had a wanted-
style list of over 200 abortion providers showing their photographs and listing their addresses,
license plate numbers, and family members. This website was finally removed from the internet in
2002 as a result of lawsuits from Planned Parenthood and targeted doctors.
Appendix Figure 1 displays the spatial distribution of the violence (the red dots) overlaid on
a map of the 1981 distribution of abortion providers by county before the first national wave of
extreme violence. There is substantial geographic dispersion in clinic attacks, suggesting that anti-
abortion extremism occurs well beyond the boundaries of any organization’s headquarters.16
Figure 2 looks further at the intensity of attacks across counties. Most (of the 1043) counties
with abortion providers have never experienced an act of violence. Among the roughly 14 percent
of counties experiencing any violence, over half experienced one event and nearly another quarter
suffered two to three attacks. At the other extreme, one county – Harris County in Texas, which
contains the city of Houston – experienced 10 acts of violence. Not surprisingly, anti-abortion
activists targeted counties with multiple providers across the country.
Parallel to this rise in violence, we observe a decline in the number of abortion providers and
abortions per capita (Data Appendix Figures 1 & 2). In the early 1980’s and late 1970’s, abortion and
provider rates were highest levels and have been declining since. These decreases are large; abortion
rates earlier in this decade were down over 25 percent compared to their peak whereas provider
15 See http://www.prochoice.org/about_abortion/violence/army_god.html 16 Well-known anti-abortion extremist Rachelle "Shelley" Shannon plead guilty to setting fires at several abortion clinics in Oregon, California, Idaho and Nevada. She was also convicted of attempted murder in the shooting of Dr. George Tiller at his Wichita, KS clinic in 1993.
6

rates experienced a larger than 40 percent fall. Whether the violence caused the fall is ultimately an
empirical question.
Prior Literature on the Effects of Extreme Anti-Abortion Activity
Despite the frequency and salience of anti-abortion extremism, little is known about its
effects on the decisions of pregnant women and abortion providers. Some qualitative evidence
suggests that anti-abortion violence has met its objective. Henshaw and Finer (2003) maintain that a
primary source of the recent decline in abortion providers in the United States is clinic violence,
particularly the murder of abortion doctors but their claim is quantitatively unsubstantiated. The
surveys cited in the introduction corroborate the view that the effects of anti-abortion violence are
widespread. And, as the recent killing of Dr. George Tiller made clear, a relative lull in extreme
violence does not mean the threat to providers has disappeared.
The prior literature on violence is of limited use for understanding the impact of extreme
violence for 2 reasons. First, much of the existing literature on anti-abortion activities looks at the
effect of clinic picketing rather than more extreme events. For example, Doan (2007) studies the
cross-sectional impact of picketing and bomb threats on abortion rates and the number of
providers. She finds only weak evidence of a relationship between protests and abortion rates but
stronger evidence of protest-related and bomb-threat-related declines in providers. In a more
qualitative study, Cozzarelli and Major (1994) look at the response of women approached by pro-life
protesters at a Buffalo, New York abortion clinic. Although many of the 300 women approached by
protesters reported being upset, none appeared to have changed their decision to obtain an abortion.
Second, while these studies suggest that acts of violence may have affected the market for abortion
services, the cross-sectional nature of this work make the results difficult to interpret. As shown
later, the counties experiencing violence differ along many dimensions compared to the counties not
experiencing such violence.
II. Data and Some Descriptive Statistics
Abortion Clinic Violence Data
The bulk of our data on clinic attacks come from the Bureau of Alcohol, Tobacco, Firearms
and Explosives (ATF) records. For all attacks involving arson, bombings or firearms, the ATF is
required to investigate. We cross-validate and supplement these data with reports from several
7

independent sources, most importantly the National Abortion Federation, which provides
information on butyric acid attacks (see Data Appendix).
Our data on extreme violence exclude protests. Although protests may also affect the market
for abortions – imposing potentially large psychic costs on women contemplating abortions, we do
not explicitly study them here. Protests are more difficult to measure than extreme violence because
they tend neither to receive extensive media attention nor precipitate federal investigation or other
systematic monitoring. Protests, which often occur with great regularity, are largely anticipated by
clinics. Clinics adopt regular policies to deal with picketing – such as using volunteers to shepherd
clients safely past demonstrators – but do not typically maintain good measures of these activities.17
These protests may be important confounders however. In robustness checks, we control explicitly
for the three major protests– the 1988 “Siege of Atlanta,” the 1991 “Summer of Mercy,” and the
April 1992 “Spring of Life” – that were clear deviations from the norm and generated considerable
media attention. Our results are impervious to these controls, suggesting that these protests are
unrelated to extreme clinic violence.
Abortion Data
To estimate the effect of violence, we compare trends in abortion rates (the number of
abortions per 1,000 women aged 15-44), abortion provider rates (the number of abortion facilities
per 100,000 women aged 15-44), and monthly births before and after the acts of violence.
As direct measures of the market for abortions, we use confidential county*year data from
the Alan Guttmacher Institute (AGI) on abortions and providers by setting (hospital or non-
hospital) and volume of the provider (<30 abortions performed, 30-399 abortions, 400-999
abortions, 1000+ abortions). We include in our estimation all counties that appear at least once in
our data, roughly one-third of all U.S. counties. These data, intended to be a census of all abortion
providers in the United States, are only available for the years 1973-1982, 1984, 1985, 1987, 1988,
1991, 1992, 1995, 1996, 1999, and 2000 but are considered the most comprehensive source of
abortion data in the United States (Blank et al. 1996). Our data cover mainly surgical abortions as
medical abortions, a technological innovation that uses medications to terminate a pregnancy, did
not receive FDA approval until September 2000, the last year of our analysis. We exclude 1973 data
17 According to one former volunteer at an abortion clinic in Boston, protesters outside that clinic had such regular schedules that clinic staff knew which protesters to expect on any given day of the week.
8

from our analysis because of the poorer coverage of providers in that year.18 However, our results
are not sensitive to this exclusion.
Due to their controversial nature, abortions are almost certainly undercounted. Anti-
abortion violence may exacerbate the measurement error in abortions. For example, facilities may be
fearful to report abortions or may be more difficult to survey because they have either temporarily
closed or relocated in response to violence. In the rare cases that clinics are unable or unwilling to
respond, however, AGI uses abortion figures from the previous survey, effectively leading to a
downward bias in our estimates.19
Birth Data
We supplement these abortion data with confidential monthly natality counts by county of
residence for the years 1973-2000. These data cover all counties, irrespective of county size.20 Data
on births enable us to discern the overall effect of the violence (i.e., the effect after taking into
account travel to more hospitable areas to obtain an abortion). The frequency of these data allows us
to precisely pinpoint the potentially-affected cohorts - reducing the potential for omitted variable
bias. Taken together, these data sources provide a good basis for assessing the impact of violence on
the market for abortions.21
Birth data have several advantages over the AGI abortion data. First, most, if not all, births
result in a birth certificate and thus are less likely to be undercounted than abortions, especially
during times of violence. Second, we use monthly data, allowing us to take advantage of the precise
timing of an attack. Third, the reporting of births by county of residence rather than by county of
occurrence enables us to ascertain the total effect of violence. If a woman obtains an abortion
outside of a county where she would have otherwise gone to terminate a pregnancy, this action will
appear as a decline in abortions in that county in the AGI data. But, this woman’s pregnancy will not
appear as a birth in the natality data.
18 This information comes from personal communication with Stanley Henshaw, a senior fellow at AGI, on October 28, 2008. 19 This information also comes from personal communication with Stanley Henshaw on October 28, 2008. 20 Beginning in 1989, the public-use natality data only include county identifiers for larger counties. 21 In an earlier version of the paper, we also used data from the Centers for Disease Control. However, while yearly, these data are state-level and thus, reduce considerably the variation in attacks.
9

III. Empirical Analysis
Event Studies and Model Specification
Patterns for Abortions and Providers
To motivate our regression analysis, we begin with a graphical display of the data using an
event study analysis. Specifically, we plot estimated year-relative-to-event fixed effects along with 95
percent confidence interval bands from a regression of non-hospital abortion provider and abortion
rates. The year-relative-to-event fixed effects are the set of coefficients from the following
regression:
ctttcctct XY *0 (1)
where ctY is either the abortion provider rate ((number of providers/number of women 15-44 years
old)*10000) or the abortion rate ((number of abortions/number of women 15-44 years old)*1000) in
county c in year t, ctX are time-varying covariates such as state laws governing abortion access and
county-level time-varying characteristics, c are county fixed effects, *t t are year-relative-to-event
fixed effects (e.g., t-t*=0 at the time of the event), and ct is an error term.22 t* denotes the year of
the first violent event in the county. The county covariates included are the log per-capita income,
log employment, the share of employment in construction, the share of income paid in
unemployment income, and the share of females that are non-white. As the appropriate set of
covariates is unclear a priori, we follow the existing literature and use the same set of covariates as
Kane and Staiger (1996). See Data Appendix for more details on the state abortion laws.
The display of these event study fixed effects serves several purposes: (1) to guide our
modeling of the violence effect and (2) to verify that the time-series patterns are consistent with a
causal impact of violence on abortion services. We focus on a window of 15 years prior to and 15
years post an anti-abortion attack so that observations very distant in time from an attack are not
heavily influencing our estimates.23 The results are similar for shorter windows (e.g., 5 years prior to
and 5 years post an anti-abortion attack).
Figure 3 displays the year-relative-to-event fixed effect estimates for our non-hospital
abortion provider rate regressions. We focus on non-hospital providers since these are the type of
22 We have also used log rates as dependent variables but we prefer rates rather than log rates due to the presence of abortion and provider rates of 0. 23 This selection rule results in the dropping of observations only for violent counties. For non-violent counties, all years of data are used.
10

facilities that have been attacked. Panel A displays the pattern for the full sample and Panel B
restricts the sample to counties that have a predicted propensity for a violent attack in the range of
[0.1, 0.9] following Crump et al. (2009). The predicted propensity is based on a logit of the
probability that a county ever experienced violence during our sample period as a function of the
1974 values of the county covariates (i.e., pre-violence covariates) included in equation (1).24 This
restriction eliminates from the sample those counties that have virtually no probability of
experiencing violence and those that will almost certainly face it.
The patterns in Panel A of Figure 3 show that prior to attacks, abortion provider rates are
modestly rising. The pre-violence rise in the provider rate is an artifact of the composition of the
counterfactual sample. In comparison, the pre-attack trends are relatively flat in Panel B, which
eliminates violent and non-violent counties that that have either very low or very high probabilities
of attack. Despite the differences in pre-violence trends, the conclusions from both figures are
similar. Non-hospital provider rates fall for the first two years after an attack (time 0) and return to
trend thereafter. They do, however, appear to remain lower than what they would have been in
absence of the violence.
Figure 4 shows an analogous event-study figure for non-hospital abortion rates. As for non-
hospital provider rates, pre-attack abortion rates are rising for the full sample but are quite flat for
the restricted sample. Also similar to the provider rates, abortion rates fall precipitously after a
violent attack. Relative to the pre-violence trend, abortion rates are lower in the post-violence era –
indicating permanence of the violence effect. The abortion rates in the post-violence period are
noisy, possibly reflecting the fact that additional acts may have occurred. The lesson from these
figures is clear: counties that were the targets of violence experienced large and persistent declines in
the provision of abortion services post attack.
Specification for Abortion and Provider Analysis
Based on these event-study graphs, we model the effects of violence on abortion and
provider rates as follows:
cttcctct XttttfY )(1)( *2
*10 (2)
24 These covariates include log per-capita income, log employment, the share of employment in construction, the share of income paid in unemployment income, the share of females that are non-white, the log of the population of women ages 15 to 44 in 1974 and an indicator for whether the state had a mandatory waiting period or a TRAP law. In 1974, none of the other state policies were in effect. This selection rule effectively drops roughly 75 percent of the non-violence sample and roughly 10 percent of the violence sample.
11
where ctY is an outcome such as the abortion rate in county c at time t, )( *ttf is a quadratic
function of t-t* used to control for smooth trends in our outcomes around the time of the
violence,25 )(1 is an indicator function that equals 1 in the post-violence period and 0 otherwise.26
The other terms in this equation are identical to those in equation (1). The year fixed effects control
for nationwide changes in abortion services (e.g., the enactment of the Freedom of Access to Clinic
Entrances Act in 1994 that increased the penalty for obstructing access to abortion clinics). We
cluster all standard errors at the county-level. Our parameter of interest is 2 .
The specification laid out in equation (2) has several features worthy of discussion.
Importantly, it (a) assumes that the effects of violence are permanent in the post-attack period, (b)
implicitly ignores the effect of acts of violence occurring after the first event and (c) nets out the
national effect of violence.
Our first main assumption, the permanence of the violence effect is motivated by our plots
of the time series patterns in Figures 3 and 4. Regarding (b), our primary reasoning for excluding
subsequent events is that the timing of these further attacks may be endogenous. For example, an
anti-abortion activist who feels unsuccessful may decide to strike again. Earlier we observed that
roughly half of the attacked county experience more than one violent attack. However, the elapsed
time between events in most cases is short. Over 60 percent of second acts of violence occur in the
same year as the first event or one year later, making (b) a relatively innocuous feature of our model.
Finally, with year fixed effects in our specification, we interpret our estimates as relative effects –
effects in the targeted county relative to other counties. It is plausible that the non-targeted counties
also experienced impacts from the violence. In this case, our estimates are lower bounds of the total
effect of the violence. We will explicitly test this assumption and adjust our estimates by analyzing
geographic spillovers (discussed in detail below).
25 If we include separate polynomials for the pre- and post-attack periods, the regression results are similar. We can also estimate these trends individually by county and the results are similar too. 26 In particular, the post dummy variable equals one for years after the violence (i.e., for the violent year, post equals 0). We do this for several reasons. First, in the year of the violence, sometimes AGI denotes the number of abortions performed in that year as equal to the abortions performed in the previous year (Henshaw, 2008). Second, the violence usually does not occur at the beginning of the year – effectively meaning that only a fraction of the year’s abortions could be affected by the violence. Also, recall that since the data are not available for all years, only a fraction of counties will report data in the year of violence. In results not shown here, we find that our estimates are qualitatively unchanged if we a) set this violence variable equal to 1 for the violence year and all years after or b) make the violence variable equal to a fraction reflective of the fraction of the year following the violence and 1 for all years after (e.g., the violence variable equals 1/12 for 1993 if the violence occurred in December 1993 and 1 for all years after 1993).
12

Natality Data Analysis
Our analysis of the natality data closely resembles that for abortions. Nevertheless, there are
some important differences because of differences in the expected timing of the violence effect on
births. Specifically, any effect of violence on births should occur with some delay. Women close to
giving birth today are not candidates for abortions today because they are too far along in their
pregnancy. Instead women between 0 and 12 weeks pregnant (roughly 0 to 3 months pregnant) are
the primary group weighing the decision to have an abortion today.27 Therefore, to the extent that
births are affected, we should detect this with a roughly 7 to 10 month lag since the usual gestational
length is 40 weeks (slightly less than 10 months). In practice, we observe a rise in births 7 to 11
months post-violence, although our results are not sensitive to the exclusion of month 11 from the
treatment cohort.
In the spirit of Figures 3 and 4, Figure 5 shows our event-study analysis for log births.28,29 In
both panels, the size of the cohort born 7 to 11 months after the violence, represented by 0 on the
x-axis, is a deviation from trend. This aberration is on the order of 1 percent; the corresponding fall
in abortions seen earlier easily trumps this effect size.
Besides affecting the behavior of already pregnant women, the violence could also affect the
fertility behaviors and the abortion decisions of women at risk of becoming pregnant in the post-
violence period. Since births quickly return to their pre-violence trend after a 5-month post-violence
deviation, any decrease in conceptions would have to fully counterbalance the decrease in abortions.
In other words, those who would have otherwise sought abortions must, post-violence, decrease
conceptions. In the long-run, violence did not affect total abortions, once factoring in travel to
nearby areas, or total births much. Thus, we interpret these findings as suggesting that the violence
affects the abortion decisions of already-pregnant women and women who soon become pregnant
but has negligible effects on fertility.
Specification for the Natality Data Analysis
Given the patterns in Figure 5, a natural regression specification for detecting the effect of
violence on births:
cttcct tttttfY )~4~(1)~( 210 (3)
27 In 2004, almost 90 percent of abortions were obtained before 13 weeks of gestation (CDC, 2007). 28 Due to the inherent noise in the monthly data, we group births into 5-month intervals for the purposes of this figure but in the regressions to follow, each observation represents births in a county in a particular month. 29 We do not have population data by month to create birth rates.
13

where ctY denotes log births in county c for month t,30 (.)f is a linear function of time relative to
event, t~ is the first month in which births could be possibly affected (i.e., *t (the month of
violence) + 7 months), (.)1 is an indicator for whether the birth was 7 to 11 months after the
violence, c are county fixed effects, and t are month*year fixed effects. Note that we exclude
county x time covariates since they are not available at the monthly level. Since we are exploiting a
sharp change in time these variables would also need to vary sharply for omitted variables bias to be
problematic. To estimate equation (3), we use data close to the time of the violence – from 29
months prior to the violence to 43 months following the violence to insure a balanced window of
potentially-affected cohorts around the violence.31
Our interest is in 2 , the effect of the violence, in percent change terms, on the size of the
cohort born 7 to 11 months. This coefficient will capture the total effect of the violence on
abortions – both the change in abortions performed in targeted counties and any dislocation of
abortions to surrounding areas.
Identification
The goal of estimating equations (2) and (3) is that 2 will identify the causal effect of
abortion clinic violence. However, identification of the violence effect rests on the assumption that
the timing of the extreme clinic violence, conditional on the set of covariates, is effectively random.
Given that acts of terror rely on an element of shock, a surprise event should induce the largest
impact as providers will be unprepared. However, we take the threat to identification seriously and
try to address it in several ways.
First, we measure the intensity of the abortion discussion around the time of the violence
using newspaper articles. Analyzing this pattern helps us address the concern that violent anti-
abortion activists respond to changes in local abortion funding or are spurred on by local
demonstrations against clinics. The hope for identification purposes is that the violence is unrelated
to local events or feelings, which might be captured by newspaper article counts. In Appendix
Figure 2, we display month-relative-to-event fixed effects from a regression of the number of articles
in a month with the word “abortion” in the headline. See Data Appendix for more details on the
30 We adjust the birth data such that each month of data covers essentially the same number of days by dividing the monthly birth counts by the number of days in the month and multiplying that by 30. 31 That is, we consider 3 years of cohorts potentially unaffected by the violence and 3 years of cohorts potentially affected by the violence.
14

construction of this data source. In this Figure, there are no pre-existing trends in local abortion-
related news prior to an attack. We take this as prima facie evidence that the estimates later capture
changes in the market for abortion services rather than broader local changes in anti-abortion
sentiment leading up to the attack.
Second, we include ctX , time-varying state-related abortion policies and county-level
economic and demographic variables in the regressions. If the events are unpredictable, then the
inclusion of these variables should not impact our estimates of 2 . As we show later, our estimates
of the violence effect are relatively insensitive to the addition of these controls.32
Third, we test the sensitivity of our estimates to the inclusion of co-existing trends either
through the inclusion of state-by-year fixed effects or county time trends. The specifications with
state-by-year fixed effects rely on within-state variation in the timing of violent attacks across
counties, allowing us to control in an unrestricted way for any contemporaneous changes (e.g., in
state policies and economic factors) at the state-year level that affect the market for abortions.33 The
county time trends allow for a more flexible specification of *( )f t t . In both sets of specifications,
we find that our estimates are stable.
Fourth, for births, the frequency of the data allows us to more finely pinpoint the effect of
violence. We can compare the number of births immediately prior and immediately following the
violence. In order for omitted variables bias to be problematic, the omitted variables would also
need to be discontinuous at the time of the violence. Thus, this analysis provides a reasonably clean
approach to estimating the causal impact of abortion clinic violence.
Fifth, we perform a set of sensitivity tests to further rule out the possibility that omitted
factors drive our results. Specifically, we test the sensitivity of our estimates to two alternative
control groups: (1) a sample of counties that have a predicted propensity for violent attacks based on
1974 characteristics in the range of [0.1, 0.9] and (2) areas that ever experienced violence. As will be
discussed below, these results are also quite similar.
While together these specification checks provide some credibility to the identification,
omitted variables bias could remain. Where year fixed effects do not control adequately for violence-
inducing pro-abortion activities, we may have downward-biased estimates of the effect of the
32 We have also estimated Cox proportional hazard models of the timing of a first anti-abortion attack. With the exception of the log employment and the share of employment in construction, both lagged one year, these covariates are generally poor predictors of the timing of an anti-abortion attack. 33 If women travel to other areas in their state in response to the violence, the inclusion of state-by-year fixed effects could lead us to overestimate the effect of the violence.
15
violence on the market for abortions since some evidence suggests that anti-abortion violence
responds to pro-abortion activities (Ginsburg 1998), as evidenced today.
IV. Results
Descriptive Statistics
The targets of anti-abortion activists are not random. In Table 2, we contrast non-violent
and violent counties. We compare three groups: (1) counties with abortion providers who do not
experience violence between 1974 and 2000, (2) counties with abortion providers who do experience
violence at some point during this period and (3) counties within 50 miles of an attack.34
The mean number of abortion providers per 100,000 women ages 15-44 differs little across
non-violence and violence counties. But this aggregate figure masks an important difference in the
type of providers across areas. In non-violence counties, most of the providers are hospital-based
(4.6 out of 6.6) and perform fewer than 30 abortions per year (3.7 out of 6.6). In contrast, most
providers in violence counties (4.1 out of 6.2) are based in non-hospital settings (primarily abortion
clinics) and about three-quarters of them perform more than 30 abortions per year. Areas
surrounding the violence have slightly lower provider rates.
As might be expected, violence counties and their neighbors have significantly higher
abortion rates than the non-violence counties. The abortion rate in violence counties is nearly 4
times that in non-violence counties. In nearby counties, the abortion rate is almost 1.5 times higher
than that in non-violence counties. Violence counties also tend to be more populous, with on
average 155,000 women of child-bearing age compared to only about 27,000 in non-violence
counties. Residents of violence counties and the surrounding areas are also richer than those in non-
violence counties, with a real per capita income over $21,000 compared to less than $19,000 in the
non-violence counties.
Because counties that have and have not experienced violence are so different, one might
worry about using non-violent counties to estimate counterfactual trends. While our identification
strategy does not rest on the direct comparability of non-violent and violent counties, it does lean on
the assumption that trends in abortion services are comparable across the two groups in the absence
of violence, a point we return to when we test the sensitivity of our results to the use of alternate
samples and comparison groups. 34 Distance is based on the geographic-population centroid of each county.
16

Regression Results
AGI County-Level Analysis
Our first set of regression estimates is in Table 3. We present a series of regression estimates
of equation (2) for 6 different dependent variables: provider rates, hospital-based provider rates, and
non-hospital (i.e., clinic or physician office-based) provider rates, abortion rates, hospital-based
abortion rates, and non-hospital based abortion rates.
For each dependent variable, we present estimates from five separate regressions, each
including a varying number of control variables. In the first column, we present an estimate of the
violence’s impact (i.e., estimate of 2 ) excluding county fixed effects, a naïve regression. The
positive effect on provider rates from this regression, suggesting that violence increases provider
rates, is not surprising in light of the patterns in Table 2. This specification does not exploit
exclusively the variation in violence we argue might be exogenous (i.e., the variation in the timing of
violence within a county).
In contrast, the second estimate takes into account the inherent differences between areas
with and without violence by including county fixed effects. The sign of the estimated effect flips
and is of expected sign. The estimate implies that abortion provider rates fall by 0.56 providers per
100,000 women or about 8 percent following an attack of violence. The estimate is only significant
at the 10 percent level.
The next three columns of estimates include a successive number of covariates to assess the
degree to which the regression estimates are biased. In the third column, we add county-level
economic and demographic covariates such as log per-capita income and log employment. In the
fourth column, we include the state-level abortion-related policy described earlier. In the fifth
column, we include state-by-year fixed effects. The hope is that the estimates in the second through
fifth columns are similar, and that is indeed what we find. In regressions (not shown here) we also
find that the results are akin to those in Table 3 if we include county-specific linear time trends.
Moving to the next two sets of results in this panel of Table 3, one might a priori expect
different responses to the violence for non-hospital and hospital facilities since anti-abortion
violence almost exclusively targets clinics. We observe an abortion-violence-related decline in non-
hospital provider rates. In the period following an attack, the number of non-hospital based
providers falls by between 0.40 and 0.55 per 100,000 women of child-bearing age. With the
exception of the specification with state-by-year fixed effects, these estimates are also statistically
17

significant at the 5 percent level. Off a base rate of roughly 4, the estimates imply a 10 to 13 percent
decline in non-hospital provider rates. Given this fall, we might expect some substitution to hospital
providers, but there is no clear positive impact on hospital provider rates.
In Panel B of Table 3, we assess the impact of violence on abortion rates. Controlling for
fixed county differences, we find a statistically-significant decline of 3.2 (8 percent) in the abortion
rate within a county in the years following an act of extreme violence. This estimate is insensitive to
the inclusion of county covariates and state policy variables or state-by-year fixed effects. As was the
case for providers, the decline in abortion rates is concentrated entirely in non-hospital based
settings with a 3.4-3.7 fall in non-hospital abortion rates (a 10 to 11 percent drop). Abortion rates
appear to increase in hospital settings, although these estimates are very imprecise.
Sensitivity of Main Abortion Results
As is typical in a difference-in-difference analysis, using an appropriate control group is
crucial. Here we consider two alternative samples. As a first sample, we confine the sample to those
counties with propensities of violence between 0.1 and 0.9 as we did for the sample in Panel B of
Figures 3-5.
We display the results from the propensity-matched sample in Appendix Table 1. The basic
pattern of results is consistent with the main regression results, although they are slightly smaller
than the full sample estimates in Table 3. For example, we find a reduction in non-hospital-based
providers of roughly 0.44 per 100,000 in the matched sample compared to an average decline of
about 0.50 per 100,000 across our within-county, full-sample estimates. Similarly, non-hospital-based
abortions decline by roughly 2.99 per 1000 women in the matched sample compared to an average
decline of about 3.50 per 1000 women in the full sample. These results suggest that our main within-
county abortion estimates may be slightly high but not markedly so.
Appendix Table 2 further tests the sensitivity of our results to the choice of control group by
restricting the sample to counties that ever experienced violence. In this way, our control group in
any given year consists of counties that experience violence in a different year. The results here are
also qualitatively similar to our main results, if somewhat smaller and less precise. After an attack,
non-hospital-based providers decline by 0.3-0.4 per 100,000 women and abortions decline by
roughly 2-3 per 1000 women in the violence only sample. Thus, as was the case for the matched
sample, the results here suggest that our full-sample, within-county estimates are unlikely to vastly
overstate the true impact of violence on abortion services in targeted counties.
18

Heterogeneity and Further Validity Checks
To further test whether our estimates are plausibly attributable to extreme anti-abortion
violence, Table 4 decomposes provider and abortion rates by the volume of the facility. To reduce
the number of columns, we only report results for regressions with county fixed effects. As before,
we show results for regressions with county covariates; county covariates and state policy variables
and finally county covariates and state-by-year fixed effects. In Panel A, we present results for
provider rates for those performing fewer than 30 abortions, 30-399 abortions, 400-999 abortions
and 1000 or more abortions in a county-year. Since violence targets clinics, we would expect the
effects to be concentrated among the more sizable providers.
The largest violence effects are for large providers – those performing 400-999 abortions per
year – but are essentially zero for the very largest providers. Provider rates decline by almost 0.3 per
100,000 or about 33 percent among those performing 400 to 999 abortions. This estimate is stable
across the columns and in all cases is distinguishable from zero at the 5 percent level. This result
suggests that the medium-sized clinics (or possibly “large” clinics in less populous areas) are less able
to absorb the cost of an attack and thus more likely to shut down. In contrast, the largest clinics,
which are often part of a national chain such as Planned Parenthood, may have the resources to
repair their infrastructure and hire extra security.
In principle, since a clinic can change categories from year to year and because our data are
at the county not clinic level, this result could reflect closures in other categories along with
downsizing or upsizing in the medium clinic group. For example, this result is consistent with the
largest clinic in a county closing as a result of violence and the medium-sized clinic in that county
absorbing enough of their clients to move into the large category the next year. Regardless of the
composition, however, the net effect is the loss of a medium-size clinic. For the smaller providers,
those conducting fewer than 399 abortions in a year, it is less clear how the violence affects their
operations.
The results in Panel B, which show changes in abortion rates for the four volume categories,
are analogous to what we found for providers. In particular, the bulk of the reduction in abortion
rates is among clinics performing 400-999 abortions per year. Abortion rates performed at these
providers fall by about 2 or 32 percent following an attack.
19

Behavioral versus Mechanical Response
Both Table 3 and Table 4 indicate that non-hospital abortion and provider rates fell in
targeted communities. While the results are clear, the causes of the declines could be multi-faceted.
The fall could be demand or supply driven.35 Affected facilities could close or be temporarily shut
down, reducing abortion access. Since violent counties have on average 8 providers (median is 4),
closures of attacked clinics are unlikely to explain the total decline in abortion rates unless the
remaining clinics are already at capacity. Closures of unaffected clinics could further contribute to
the declines. On the demand side, after an attack, women could fear visiting any abortion facilities in
the same area. This feeling may not be unfounded because anti-abortion activists often target the
same area on the same day or within a few days or weeks of the first event.36
The loss of infrastructure is a supply response that has a crucial impact on the interpretation
of our results. That is, if the only impact of clinic violence is the direct reduction of clinic capacity,
then the effects of terrorism may be limited. Clinic capacity may be relatively easy to restore. And
terrorism should have larger effects when it has an impact beyond the direct damage it causes to
physical or human assets. To shed light on whether our results are purely mechanical – i.e., due to
the destruction of infrastructure – or reflect some degree of behavioral response to terror, we
categorize the attacks into 3 groups: (1) damage attacks: arson, butyric acid, bombing (134 acts), (2)
murder attacks: murder and attempted murder (3 acts), and (3) other attacks: hoax devices, major
threats, and kidnappings (3 acts). The damage acts should incur the largest incapacitation effects; at
least in the short run, the clinic would need to close. The murder attacks, in contrast, may impose
large psychic costs on potential clients who fear for their safety. We report these results in Table 5.
Since the damage attacks are the most common extreme act of violence, their effects largely
mirror the pattern and size of results in Tables 3 and 4; damage attacks lead to an 11 percent decline
in non-hospital-based provider rates and a 9 percent decline in non-hospital based abortion rates.
Murders, while rare, have much more sizeable negative effects. An abortion-related murder in a
county is associated with 3 fewer non-hospital providers per 100,000 women or over a 75 percent
35 To distinguish between relative shifts in supply versus demand, we would need some information on the price of abortion services. While such data are available, they are quite crude – with very low geographic and time series coverage. 36 For example, in Houston, TX two abortion clinics were bombed on September 7, 1984. John Salvi open fired at two clinics on December 30, 1994 in Brookline, MA and five clinics in Miami, FL faced butyric acid attacks on May 16, 1998. Similarly, in Baton Rouge, LA two clinics were set on fire within five days of each other in October 1985 and in Columbus, OH two clinics were bombed within 10 days of each other in February 1991.
20

decline in these facilities.37 Given how few murders occurred during our sample, however, we
caution against inferring too much from these results.38 For the other violence category, none of the
effects are statistically different from zero.
As an alternative approach to assessing whether the estimates are purely mechanical or
reflect some behavioral response to terror, we estimate regressions analogous to those in Table 3
with an interaction of the damage cost of an attack. Since the dollar damages capture losses due to
physical damage alone, they provide a marker for whether a facility is unusable, at least in the short-
run. We observe no heterogeneity in the impacts on provider or abortion rates by the amount of
damage, suggesting something more than the destruction of physical infrastructure may be at play.
Because the damage data are vastly underreported and quite noisy, we prefer an alternative
approach to assessing whether the estimates are purely mechanical. In places with few providers,
there is more scope for a mechanical response. If one provider closes, people must go elsewhere.
Appendix Table 3 shows results broken out by the availability of providers near the time of an
attack. Specifically, we classify attacked counties into quartiles based on their pre-violence provider
rates. Counties with a provider rate in the lowest quartile of this distribution are denoted by the [0,
25] group in this table, counties with a provider rate in the interquartile range are represented by the
(25, 75) group, and counties with a provider rate in the highest quartile are classified into the [75,
100] group. Non-attacked counties are included in all regressions. One should be careful about
interpreting these estimates since the response to violence may be heterogeneous with respect to
provider availability for other reasons besides provider density.
With this caveat in mind, Appendix Table 3 indicates that declines in provider rates are only
detectable in areas with many providers relative to the population of women of childbearing age. On
the other hand, the effects of attacks on abortion rates are felt throughout the provider rate
37 This result is not driven by murders occurring in areas with more providers. Prior to the violence, non-hospital provider rates are 4.37 per 100,000 women of childbearing age in the areas where murders occurred compared to 4.43 per 100,000 in areas that had arson attacks. However, murders did target areas with significantly higher abortion rates. Pre-violence abortion rates are roughly twice as high in counties experiencing murders than counties experiencing other forms of violence. But even after accounting for this difference, the effects of murders are relatively large in percentage terms. Interestingly, relatively small clinics account for much of the decline in provider rates; facilities performing 30-399 procedures a year experience a drop of 2.11 providers per 100,000 women or 72 percent – even though murders targeted high volume providers. This is consistent with these murders provoking fear. In contrast, the highest volume providers decline by 0.33 per 100,000 women or about 26 percent. Temporary closures to accommodate a criminal investigation, improve security, or move to a new location (e.g., in the Brookline murders) may drive some of the decrease. But the effect on smaller clinics is almost certainly behavioral. 38 In this table, we test multiple hypotheses simultaneously without making strong a priori predictions on the size and magnitudes of the effects. As such, the standard errors are likely to be too small. However, we think the results are suggestive of heterogeneity in the effects.
21

distribution. While the relative effect of attacks on abortion rates is largest in areas in the lowest
quartile of the provider rate distribution, areas in the top quartile also experience sizeable declines in
abortion rates. Total abortion rates decline by 3.85 per 1000 or about 15 percent in the bottom
quartile and by 4.65 or 8.5 percent in the top quartile. Declines also appear in the middle of the
distribution. Taken together with Table 5, these results suggest that while some of the estimated
effects in Table 3 and 4 may be mechanical – due to a loss of infrastructure – some undoubtedly
reflects a behavioral response to terror.
On net, the results in Tables 3-5 indicate that acts of extreme anti-abortion violence lead to
declines in clinic-based providers and abortions. If, in response to the violence, providers move to
nearby counties and/or women seek services elsewhere, we may overstate its true impact. On the
other hand, if violence experienced in one county also discourages providers and women in counties
“close” to the attack from participating in this market, we will understate the true impact of
violence. Said differently, if our “control” counties experience a change in providers and abortions
as a result of the violence, then our earlier estimates will be biased. Ultimately, we care about the full
effect of the violence on abortion activity in the areas near an attack. We address that next.
Testing for Spillovers
To deal with the issue of geographical spillovers, we supplement equation (2) with a
population-weighted indicator for counties within 50 miles of an attack in the years following the
attack. The weight is that county’s attack year share of the population of all neighbors within 50
miles (e.g., two neighboring counties of size 50,000 will have weights of 0.5). We adopt this
weighting scheme so as to estimate the total effect of violence on all neighbors instead of the
average effect across them. We choose 50 miles as the treatment area because this provides good
coverage of a woman’s potential market for an abortion. In 1992, for example, 76 percent of
abortions occurred within 50 miles of the mother’s place of residence (Henshaw 1995). Analogous
to the specification of our post-attack dummy, our neighboring-county attack “dummy” is equal to 1
after the earliest attack and is not affected by any additional attacks within the area.39
In Table 6, we present the results from these regressions. We report coefficients and
standard errors from the neighbor effects that are standardized to the pre-violence means of the
female population in the attacked county (i.e., multiplied by the ratio of the pre-violence mean of
39 In a few cases, neighbors were also attacked. Specifically, 30 of 364 counties within 50 miles also experienced anti-abortion violence. Results are similar if we limit neighbors to counties that never directly experienced violence.
22

females ages 15 to 44 in neighboring counties relative to attacked counties, which is 0.409). In this
way, the effects on attacked counties and their neighbors are directly comparable; adding them
provides a standardized estimate of the total effect of violence on the targeted counties and their
neighbors.
The results in Table 6 indicate that an anti-abortion attack in one county increases both the
number of hospital-based and non-hospital-based providers in counties within 50 miles. Following
an attack, hospital-based providers increase by 0.53 per 100,000 women and non-hospital-based
providers increase by 0.22 per 100,000 women. Based on the point estimates, the increase in non-
hospital based providers does not fully offset the decline in this type of provider in attacked
counties. However, the full effect of violence is not statistically distinguishable from zero for either
non-hospital or hospital-based providers. These findings suggest that some and possibly all of the
previously-reported declines in provider rates in attacked counties are offset by increases in
neighboring counties.
Turning to the abortion rate estimates, we find that following an attack neighboring counties
experience an increase in non-hospital-based abortion rates of about 2.5 per 1000 women of
childbearing age. With an average decline in attacked counties of 3.85 per 1000, the increase among
neighbors implies an offset of almost 65 percent. Given the standard errors, we also cannot reject
full offsetting through an increase in non-hospital abortion rates in neighboring counties. In sum,
the sign and magnitude of the estimated effects in Table 6 suggest that surrounding counties absorb
most, if not all, the drop in abortion services in the violence counties. The effects of violence do not
appear to spread as abortions in nearby counties do not fall. Most women travel elsewhere to
terminate a pregnancy rather than being deterred from obtaining an abortion altogether.
County-Level Natality Analysis
We next turn to the analysis of the natality data. In Table 7, we quantify the event-study
patterns from Figure 5. This table presents a series of estimates of equation (3). In panel A, we
display estimates of the violence dummy for two samples: (1) counties appearing in the AGI data
and (2) all counties, including those that have no abortion providers. The first column of estimates
excludes county fixed effects; the second column adds county fixed effects. Thus, the preferred
specification is the second column of estimates.
The estimates in Table 7 corroborate Figure 5. Once county fixed-effects are included,
regardless of the sample used, the regression estimates imply that births were 0.9-1 percent higher in
23

the 7 to 11 months following the violence. The stability of these estimates gives us some confidence
that omitted variables bias is not a huge concern.
In sum, with 140 counties experiencing at least one act of violence, the violence leads to an
additional 5,694 births that would have been aborted in absence of the violence.40 In contrast, the
implied drop in abortions in the attacked county for the year immediately following the violence is
roughly 69,760.41 Thus, only about 8 percent of the women deterred from receiving an abortion in a
violence county end up giving birth in the short run. It should be noted that an alternative
interpretation of the size of the short-run abortion effect relative to that for births is that abortions
at the time of violence are severely misreported.42 In the long run, however, our results imply a true
behavioral response to violence. Abortion rates decline precipitously in targeted counties. In
principle, this decline could reflect a decrease in conceptions post-violence. However, the abortion
results for counties within 50 miles of an attack imply a different type of response: most women
wanting to terminate their pregnancies but fearful because of the violence respond by traveling
elsewhere to do so. Thus, the net effect of violence on abortions (and thereby births) is small and
temporary. In contrast, the displacement of abortions to nearby counties is quite considerable.
Sensitivity of Main Natality Results
As with our abortion estimates, we worry that our natality estimates may be sensitive to the
choice of control group. In Appendix Table 4, we perform the same type of propensity score
analysis for births as discussed above for AGI abortions. The estimates are quite similar to those in
Table 7 – 0.009 in Appendix Table 4 versus 0.009-0.010 in Table 7. Limiting the sample to counties
that ever experienced violence (Appendix Table 5) yields similar results – point estimates of 0.008.43
In light of these findings, we are not worried about the choice of comparison group driving our 40 This calculation comes from multiplying 0.010 (the point estimate), 852 (the average number of monthly births for affected counties prior to the violence), 140 (the number of affected counties during the time span of the analyzed data) and 5 (because the point estimate is based on a five-month dummy but births are in months). Note we report that there are 150 counties that had at least one attack of violence between 1976 and 2005, but recall that our analysis ends in 2000. 41 The calculation is the product of -3.22 (the point estimate from Table 3), 154.75 (the number of thousands of females ages 15 to 44 violent counties from Table 2), and 140 (the number of affected counties during the time span of our analyzed data). 42 As noted earlier, Stanley Henshaw, a senior official at AGI, argues that attacked facilities are not less likely to report to AGI after they are attacked. 43 There are 4 counties that had attacks of violence but do not appear in the AGI abortion data. These counties (Crow Wing County Minnesota, Marion County Missouri, Shelby County Ohio, and Eastland County Texas) are small with an average population size of 40,000. As such, it is likely that they only had or have one abortion facility. Finer and Henshaw (2003) mention that the AGI data exclude a small fraction of suspected abortion facilities (because of non-response). However, the exclusion of these small counties has no impact on our birth estimates, so we do not worry about the lack of data for these counties.
24

main conclusions.
Spillovers and Heterogeneity in the Natality Results
We next test for any spillover effects of the violence on births. The nature of the spillover in
the context of births should be quite different than for abortions. Since births are reported by place
of residence, the idea of displacement is not relevant. However, like women in targeted counties,
women in neighboring counties who want to terminate their pregnancies may be discouraged from
seeking abortions in the short run. To measure whether this is the case, we supplement our main
regression specification with an indicator that equals 1 for births that occur 7 to 11 months after an
attack for counties within 50 miles of the violence and 0 otherwise.
The results in Table 8 indicate that the effects of the violence on births are felt solely in
targeted counties. That is, while births to women in attacked counties increase by about 1 percent in
the short-run, births to women who reside in neighboring counties do not increase, even in the short-
run, after an attack. Although these women may increasingly avoid seeking abortions in attacked
counties, women from neighboring counties adjust to the violence right away by availing themselves
of abortion services in either their own county of residence or in other counties that were not
attacked.
To explore heterogeneity in the impact of the violence on births, we estimate regressions
that parallel those in Table 5, in which we categorize acts according to their type (results not shown).
In light of the results in Table 5, many of the findings come as no surprise. The effect of the damage
acts on births is roughly equivalent to the overall effect in Table 7. There is some indication of a
very strong response of births to the murder of an abortion clinic worker. Because these events are
quite rare, however, we hesitate to draw strong conclusions from these results. In addition, as we
have in principle, individual-level birth data, we studied whether the violence affected different
subpopulations differently. In results not presented, we find that the effects are nearly constant
across subgroups – the exception being across maternal age with older mothers being the most
responsive.
As a final approach to exploring heterogeneity, we estimate regressions that, like Appendix
Table 3, split the sample by the pre-attack provider rate distribution. These results, which are shown
in Appendix Table 6, indicate that in counties in the top quartile of the distribution of pre-attack
provider rates, births to women do not increase. Since abortions in these counties decrease,
according to Appendix Table 3, these women must fully adjust to attacks by traveling elsewhere to
25

terminate their pregnancies. In contrast, women living in counties in the bottom quartile and in the
middle of the pre-attack provider distribution have 1.3 to 1.4 percent more births in the 7 to 11
months after an extreme act of anti-abortion violence. These results may reflect the relatively low
provider rates of counties within 50 miles of attacked counties below the top quartile of the pre-
attack provider-rate distribution.44 Women in these counties simply have fewer nearby alternative
options, creating a barrier in the short run. In the long run, however, births return to trend.
Overall our results indicate that clinic violence had only modest short-term effects on the
market for abortions. One important caveat to this conclusion, however, is that our analysis
considers changes in provider, abortion and birth rates net of any national trends. We do this in
order to control for common factors affecting the market for abortions that could confound our
estimates of the effects of violence. The cost of this approach, however, is that our estimates do not
capture any effect that local terrorist attacks have across all abortion markets. Although beyond the
scope of the current paper, the effect of local clinic violence across all abortion markets is an
important area for future research.
V. Conclusions
Past work on the consequences of terrorism focuses mainly on its effects on financial
markets (Berrebi and Klor, 2005), the broader economy (Eckstein and Tsiddon, 2004), or both
(Abadie and Gardeazabal, 2003). In this study, we try to isolate the effects of terror on the very
market it is trying to disrupt – the market for abortions. This is a large and important market, with 1
in 3 women in the United States having an abortion in her lifetime and women from vastly differing
demographic groups, whether measured by education, race or age, utilizing this market. These
women and the providers who perform abortions have been the targets of repeated acts of terrorism
in the United States.
In the 1980s and 1990s, radical anti-abortion activists unleashed a storm of violent attacks
against abortion clinics and providers. Clinic arsons, bombings and even staff murders became
widely-publicized tools in the anti-abortion effort to limit access to abortion services. Although
these acts are less common today, the uncertainty and fear they instilled in the past may have had
long-term impacts on the market for abortions. Moreover, survey evidence indicates that abortion
44 The median provider rates for counties within 50 miles of attacked counties in the bottom quartile and middle of the pre-attack provider distribution are, respectively, about 1.7 and 3.4 per 100,000. The median for counties neighboring attacked counties in the top quartile is about 6 per 100,000.
26
facility workers are still fearful of the violence today. The recent murder of Dr. George Tiller could
have only compounded this fear. Additionally, extreme anti-abortion activists have warned that
today’s political climate may be the impetus for violence in the future.
To our knowledge, this study is the first to systematically assess the impact of anti-abortion
violence on the market for abortion services. Our results suggest that extreme acts of clinic violence
cause a small but significant decline in the number of clinic-based providers per 100,000 women of
childbearing age in targeted areas. These acts also reduce the rate of abortions in these areas,
specifically those performed in non-hospital settings and in relatively high-volume facilities.
Considering only abortion and provider rates in affected counties captures only part of the picture.
Abortion rates rise in counties neighboring the violence. The decline in abortions in attacked
counties is almost completely offset by increases in counties within 50 miles of the attack.
Our findings indicate that violence affects the market for abortions in much the same way as
legislative abortion restrictions – both in terms of the size of the effect and the response of women
who might be seeking an abortion. For example, parental involvement laws appear to cause sizeable
declines in abortion rates, typically on the order of 15 to 25 percent, when measured by state of
occurrence (Ellerston, 1997; Haas-Wilson, 1996; Rogers et al., 1991). But birth rates increase only
modestly, if at all, in response to these laws, implying that the decline in abortions in impacted states
is counterbalanced with a rise in abortions in neighboring states (Cartoff and Klerman, 1986;
Ellertson, 1997; Haas-Wilson, 1996).
Based on this literature on legislative barriers as well as our own findings on anti-abortion
violence, we conclude that the demand for abortions is extremely inelastic. Locational choice
elasticities are much higher. When the “costs” of abortions rise and there are substitute facilities in
nearby areas, many women seeking to terminate their pregnancies simply travel to less restrictive or
safer, more hospitable environments to do so.
Although violence led to declines in abortion rates in targeted counties that persist for many
years, these attacks did not have the intended effect of grinding the market for abortions to a halt.
Once travel is taken into account, the net effect of violence on abortion rates is not long-lived. This
finding is made clearest when considering births. In response to anti-abortion violence, birth rates
increase only modestly, on the order of 1 percent, in the short run with a return to normal in the
long run.
Interestingly, we also show that the effects of the terrorism are not widespread. The violence
does not impact the decisions of women in counties near the targeted counties. If we interpret this
27

as a behavioral rather than a mechanical response, this means that a person’s fear is based on local
experiences. This finding is consistent with evidence of the effects of September 11th on
psychological stress: individuals living farther from New York City were less likely to report
symptoms of post-traumatic stress (Krueger 2007). More generally, our results suggest that where
consumers are mobile and their demand inelastic, terrorist attacks will have only limited effects on
the markets they are trying to disrupt.
We conclude that anti-abortion terrorists were ultimately unsuccessful in obstructing the
market for abortions services. The net effect of anti-abortion violence is a geographic expansion in
the market for abortion services not a reduction in abortions themselves. Whether it is appropriate
to characterize these effects as small or large in magnitude is up for debate. According to Krueger
(2007), an appropriate evaluation of this question depends on the existence of substitutes. In the
case of abortion violence, in areas less dense with providers where the availability of substitute
facilities may be limited, we observe the largest effects of violence on short-run births. But, over
time, the market adapts as in the case of office space in New York after 9/11 (Krueger 2007).
Ultimately, while the impact of terrorism on net abortions is slight, such violence imposes high costs
on the women receiving and the providers performing these abortions, factors we should take into
account.
28

References
Abadie, Alberto, 2006. “Poverty, Political Freedom, and the Roots of Terrorism.” The American
Economic Review 96(2): 50-56.
Abadie, Alberto and Javier Gardeazabal, 2003. “The Economic Costs of Conflict: A Case Study of
the Basque Country,” The American Economic Review, Vol. 93(1) 113-132.
Becker, Gary, and Yona Rubinstein, 2009. “Fear and the Response to Terrorism: An Economic
Analysis,” University of Chicago mimeo.
Berman, Eli and David D. Laitin, 2008. “Religion, Terrorism and Public Goods: Testing the Club
Model,” Journal of Public Economics, 92(10-11): 1942-1967.
Berrebi, Claude, and Esteban F. Klor, 2006. “On Terrorism and Electoral Outcomes: Theory and
Evidence from the Israeli-Palestinian Conflict,” Journal of Conflict Resolution, 50(6): 899-925.
Bitler, Marianne and Madeleine Zavodny 2001. “The Effect of Abortion Restrictions on the Timing
of Abortions,” Journal of Health Economics, 20(6):1011-1032
Blank, Rebecca, Christine C. George and Rebecca A. London, 1996. “State Abortion Rates: The
Impact of Policies, Providers, Politics, Demographics, and Economic Environment,” Journal
of Health Economics, 15: 513-53.
Borgmann, Caitlin E. and Bonnie Scott Jones, 2000. “Legal Issues in the Provision of Medical
Abortion,” American Journal of Obstetrics and Gynecology, 183(2): S84-S94.
Carr, Thomas P., 1988. “Abortion: Legislative Control,” Congressional Research Service Issue
Brief,” March 1988. Available at digital.library.unt.edu/govdocs/crs/permalink/meta-crs-
8888:1
Centers for Disease Control, 2007. “Abortion Surveillance --- United States, 2004” Available at
http://www.cdc.gov/mmwr/preview/mmwrhtml/ss5609a1.htm
Cozzarelli, Catherine and Brenda Major, 1994. “The Effects of Anti-Abortion Protesters and Pro-
Choice Escorts on Women’s Psychological Responses to Abortion,” Journal of Social and
Clinical Psychology, 13: 404-427.
Crump, R., V. J. Hotz, V. J., G. Imbens, and O. Mitnik, 2009. “Dealing with Limited Overlap in
Estimation of Average Treatment Effects,” Biometrika, forthcoming.
Currie, Janet, Lucia Nixon and Nancy Cole, 1997. “Restrictions on Medicaid Funding of Abortions:
Effects on Birthweight and Pregnancy Resolutions,” The Journal of Human Resources, 31(11):
159-188.
Davila, A. and MT Mora, 2005. “Changes in the Earnings of Arab Men in the US Between 2000 and
29

2002,” Journal of Population Economics, 18(4):587-601.
Doan, Alesha E, 2007. Opposition and Intimidation The Abortion Wars and Strategies of Political Harassment,
Ann Arbor, MI: University of Michigan Press.
Ellertson, Charlotte, 1997. “Mandatory parental involvement in minors’ abortions: Effects of the
laws in Minnesota, Missouri, and Indiana,” American Journal of Public Health, 87(8), 1367–1374.
Eckstein, Zvi and Daniel Tsiddon, 2004. “Macroeconomic Consequences of Terror: Theory and the
Case of Israel,” Journal of Monetary Economics, 51(5): 971-1002.
Eisinger, Peter, 2004. “The American City in the Age of Terror - A Preliminary Assessment of the
Effects of September 11,” Urban Affairs Review, 40: 115-130.
Federal Bureau of Investigation, 2008. Terrorism 2002-2005. Accessed at
http://www.fbi.gov/publications/terror/terrorism2002_2005.htm.
Federal Bureau of Investigation, 2001. Terrorism Statistics 1980-1998. Accessed at
http://www.terrorisminfo.mipt.org/pdf/TerrorismInUS1980-1998Stats.pdf
Federal Bureau of Investigation, 1996. Terrorism in the United States: 1996. Accessed at
http://www.fbi.gov/publications/terror/terroris.pdf
Federal Bureau of Investigation, 1994. Terrorism in the United States: 1994. Accessed at
http://www.terrorisminfo.mipt.org/pdf/TerrorismInUS1994Stats.pdf
Feminist Majority, Background Briefing: John Roberts and Bray v. Alexandria, August 19, 2005. Accessed
at http://feminist.org/pdfs/RobertsandBrayCase.pdf
Feminist Majority, 2005 National Clinic Violence Survey, May 2006, Accessed at
http://feminist.org/research/cvsurveys/clinic_survey2005.pdf.
Finer, LB and SK Henshaw, 2003. “Abortion Incidence and Services in the United States in 2000,”
Perspectives on Sexual and Reproductive Health, 35(1): 6–15.
Fitzpatrick, Kevin M. and Michele Wilson, 1999. “Exposure to Violence and Posttraumatic Stress
Symptomatology among Abortion Clinic Workers.” Journal of Traumatic Stress, 12(2): 227-242.
Fletcher, Holly, 2008. “Militant Extremists in the United States,” Council on Foreign Relations
Backgrounder.” Accessed at http://www.cfr.org/publication/9236/#3.
Forrest, JD and SK Henshaw, 1987. “The Harassment of Abortion Providers,” Family Planning
Perspectives, 19(1): 9-13.
Frosch, Dan, 2007. “Albuquerque Has Renewal of Attacks on Abortion,” The New York Times,
December 28, 2007.
Ginsburg, Faye, 1998. “Rescuing the Nation: Operation Rescue and the Rise of Anti-Abortion
30

Militance,” in Abortion Wars: A Half Century of Struggle, Rickie Solinger (Ed), Berkeley and Los
Angeles: University of California Press.
Glaeser, Edward L., and Jesse Shapiro, 2002. “Cities and Warfare: The Impact of Terrorism on
Urban Form,” Journal of Urban Economics, 51, 205-24.
Gould, Eric D. and Esteban F. Klor, 2009. “Does Terrorism Work,” Unpublished manuscript, The
Hebrew University of Jerusalem.
Greenbaum, Robert T. and Andy Hultquist, 2006. “The Economic Impact of Terrorist Incidents on
the Italian Hospitality Sector,” Urban Affairs Review, 42(1): 113-130.
Grimes, David A. and Mitchell D. Creinin, 2004. “Induced Abortion: An Overview for Internists,”
Annals of Internal Medicine, 140: 620-626.
Grimes, DA and KF Schulz, 2003. “The Public Health Impact of Legal Abortion: A Comment,”
Perspectives on Sexual and Reproductive Health, 35(1): 25-28.
Henshaw SK and Finer LB, 2003. “The Accessibility of Abortion Services in the United States,
2001,” Perspectives on Sexual and Reproductive Health, 35(1): 16-24.
Henshaw SK, 1995. “Factors Hindering Access to Abortion Services,” Family Planning Perspectives,
27(2): 54-59.
Henshaw, SK, JD Forrest and E Blaine, 1984. “Abortion Services in the United States, 1981 and
1982,” Family Planning Perspectives, 16(3): 119-127.
Horne, Terry, 2003. “Man Questioned in Museum Fire,” The Indianapolis Star, November 26, 2003.
Jenkins, Phillip, 2008. “Failure to Launch: Why do Some Social Issues Fail to Detonate Moral
Panics,” British Journal of Criminology (Advanced Electronic Access), Forthcoming.
Jones Rachel K. et al., 2008. “Abortion in the United States: Incidence and Access to Services,
2005,” Perspectives on Sexual and Reproductive Health 40(1):6-16.
Jones, Rachel K., Jacqueline E. Darroch and Stanley K. Henshaw, 2002. “Patterns in the
Socioeconomic Characteristics of Women Obtaining Abortions in 2000-2001,” Perspectives on
Sexual and Reproductive Health 34(5): 226-235.
Joyce, T., Kaestner, R. and S. Colman, 2006. “Changes in Abortions and Births Following Texas’s
Parental Notification Law,” New England Journal of Medicine 354(10): 1031-1038.
Joyce, T. and R. Kaestner, 2001. “The Impact of Mandatory Waiting Periods and Parental Consent
Laws on the Timing of Abortion and State of Occurrence among Adolescents in Mississippi
and South Carolina,” Journal of Policy Analysis and Management 20:263-282.
Joyce, T., Henshaw, S.K., J. DeClerque Skatrud, 1997. "The Impact of Mississippi’s Mandatory
31

Delay Law on Abortions and Births," Journal of the American Medical Association. 278(8): 653-
658.
Kane, TJ and D Staiger, 1996. “Teen Motherhood and Abortion Access,” Quarterly Journal of
Economics, 111(2): 467-506.
Kaushal, N., R. Kaestner, and C. Reimers, 2007. “Labor Market Effects of September 11th on Arab
and Muslim Residents of the United States,” Journal of Human Resources, 42(2): 275-308.
Kenney, Dennis Jay, Dina Rose, Tara O’Connor Shelley et al., 1999. A Conflict of Rights: Public Safety
and Abortion Clinic Violence, Police Executive Research Forum.
Krueger, Alan B., 2007. What Makes a Terrorist, Princeton, NJ: Princeton University Press.
Krueger, Alan B. and Jitka Maleckova, 2003. “Education, Poverty, and Terrorism: Is There a Causal
Connection?” The Journal of Economic Perspectives, 17(4): 119-144.
Lin, V. 2001. “Anthrax Threats, Continued Violence Prompt Renewed Attention to Clinic, Client
Protection,” The Guttmacher Report on Public Policy, 4(6): December.
National Abortion Federation 2008.
http://www.prochoice.org/about_abortion/violence/history_extreme.asp.
Jaeger, David A. and M. Daniele Paserman, 2008. “The Cycle of Violence? An Empirical Analysis of
Fatalities in the Palestinian-Israeli Conflict.” The American Economic Review, 98(4): 1591-1604.
Pridemore, WA and JD Frielich, 2007. “The Impact of State Laws Protecting Abortion Clinics and
Reproductive Rights on Crimes Against Abortion Providers: Deterrence, Backlash, or
Neither?,” Law and Human Behavior, 31(6): 611-627.
Reuters, 2009. “Threats, Violence Seen Eroding US Abortion Rights.” Accessed at
http://www.reuters.com/article/latestCrisis/idUSN1499007 on July 16, 2009.
Rogers, J.L., Boruch, R., Stoms, G., & DeMoya, D., 1991. “The Impact of the Minnesota Parental
Notification Law on Abortion and Birth,” American Journal of Public Health, 81(3): 294–298.
Shifrel, Scott, 1992. “Fumes Close Port St. Lucie Health Center: Worker Overcome at Clinic,” The
Palm Beach Post, 1B.
Silver, Roxanne et al., 2002. “Nationwide Longitudinal Study of Psychological Responses to
September 11.” Journal of the American Medical Association,” 288(10):1235-1244.
Tribe, Laurence H, 1992. Abortion: The Clash of Absolutes, New York: W.W. Norton & Company.
Wilson, Michele and John Lynxwiler, 1988. “Abortion Clinic Violence as Terrorism,” Terrorism,
11(4): 263-273.
32

-3-2
-10
1N
on-H
ospi
tal A
bort
ion
Pro
vide
r R
ate
-15 -10 -5 0 5 10 15Year Relative to Event
Estimated Effect Lower Bound 95% CIUpper Bound 95% CI
Figure 1 – Number of Abortion Clinic Violence Incidents by Year (1976-2005)
010
2030
40N
umbe
r of
Eve
nts
1976 1981 1986 1991 1996 2001 2006Year
Figure 2 – Distribution of Number of Incidents among Places with Abortions (1976-2005)
020
4060
80N
umbe
r of
Cou
ntie
s
1 2 3 4 5 6 7 8 9 10Number of Events
342 Total Events 150 Counties with an Event
Note: Incidents occurring in the same county on the same day are considered one event in this figure. Including these incidents separately, there would be a total of 384 total events.
Figure 3 – Event Study of the Effect of Violence on Non-Hospital Abortion Provider Rates Panel A: Full Sample Panel B: Counties with a Propensity of Violence
Between 0.1 and 0.9
-3-2
-10
1N
on-H
ospi
tal A
bort
ion
Pro
vide
r R
ate
-15 -10 -5 0 5 10 15Year Relative to Event
Estimated Effect Lower Bound 95% CIUpper Bound 95% CI
Notes: The figures above depict coefficient estimates of year-relative-to-event fixed effects from a regression of provider rates on county fixed effects, county-level covariates (see main text for a full description of these covariates), and state-level abortion policy variables. The excluded dummy is the year-relative-to-event-equal-to-0 dummy. The dashed lines represent the upper and lower bounds of the 95-percent confidence intervals of the year-relative-to-event fixed effects. The standard errors of these fixed effects are adjusted for within-county correlation. The sample includes data from 15 years prior to the violence and up to 15 years after the violence.
33

Figure 4 – Event Study of the Effect of Violence on Non-Hospital Abortion Rates Panel A: Full Sample Panel B: Counties with a Propensity of Violence
Between 0.1 and 0.9
-20
-10
010
20N
on-H
ospi
tal A
bort
ion
Rat
e
-15 -10 -5 0 5 10 15Year Relative to Event
Estimated Effect Lower Bound 95% CIUpper Bound 95% CI
-20
-10
010
20N
on-H
ospi
tal A
bort
ion
Rat
e
-15 -10 -5 0 5 10 15Year Relative to Event
Estimated Effect Lower Bound 95% CIUpper Bound 95% CI
Notes: The figures above depict coefficient estimates of year-relative-to-event fixed effects from a regression of abortion rates on county fixed effects, county-level covariates (see main text for a full description of these covariates), and state-level abortion policy variables. The excluded dummy is the year-relative-to-event-equal-to-0 dummy. The dashed lines represent the upper and lower bounds of the 95-percent confidence intervals of the year-relative-to-event fixed effects. The standard errors of these fixed effects are adjusted for within-county correlation. The sample includes data from 15 years prior to the violence and up to 15 years after the violence. Figure 5 – Event Study of the Effect of Violence on Log Births Panel A: Full Sample Panel B: Counties with a Propensity of Violence
Between 0.1 and 0.9
-.06
-.04
-.02
0.0
2Lo
g bi
rths
-30--26 -15--11 0-4 15-19 30-34Month Relative to Event
Estimated Effect Lower Bound 95% CIUpper Bound 95% CI
Month Relative to Event=Month of Violence+7
-.06
-.04
-.02
0.0
2Lo
g bi
rths
-30--26 -15--11 0-4 15-19 30-34Month Relative to Event
Estimated Effect Lower Bound 95% CIUpper Bound 95% CI
Month Relative to Event=Month of Violence+7
Notes: The figures above depict coefficient estimates of month-relative-to-event fixed effects (in 5-month groupings) from a regression of log births on county fixed effects and month x year fixed effects. The excluded dummy is the month-relative-to-event-equal-to-0 dummy. The dashed lines represent the upper and lower bounds of the 95-percent confidence intervals of the month-relative-to-event fixed effects. The standard errors of these fixed effects are adjusted for within-county correlation. The sample includes data from 3 years prior to the violence and up to 3 years after the violence. The regression includes only counties in the Alan Guttmacher Institute abortion data. The monthly data are adjusted for the length of the month.
34

Table 1 - Extreme Acts of Abortion Clinic Violence: 1976-2004Year Arson Bomb Murder Acid Notes and Damages (in 2000$)1976 1
1977 41978 3 41979 1 11980 11981 11982 4 1
1983 21984 6 231985 17 111986 9 8
1987 7 7
1988 7 11989 9 61990 9 71991 7 41992 16 4 31
1993 10 7 7
1994 9 4 6
1995 15 61996 6 21997 13 7 Attacks in 13 states and DC cause over $1.7 million in damages.
1998 6 4 1 19
1999 8 3 Incidents decline but damages are over $173,000.2000 4 3 Incidents continue to decline. Damages are $32,000.2001 3 2 Incidents continue to decline. Damages are $250,000.2002 2 Incidents remain rare. Damages are below $1,000.2003 3 2 Damages total about $21,000.2004 3 Damages total about $92,000.
Attacks in IL, FL (2) and VA result in over $1.1 million in damage. Those convicted in FL and VA attacks also responsible for the 1982 kidnapping of an IL physician and his wife. Attacks in VA and WA cause over $500,000 in damage.Attacks spread over 9 states and DC. Damages total about $4.3 million.
1st recorded attack on abortion provider. Planned Parenthood in OR sustains about $60,000 in damage.Attacks on clinics in MN, VT, NE, OH cause over $1.1 million in damage.All but 2 of the attacks are in OH. Damages are about $800,000.Arson in NY causes approximately $250,000 in damage.One attack on a TX clinic causes $320,000 in damage.Michigan clinic attack causes $57,000 in damage.
Arson and bombings spread over 7 states causes about $215,000 in damage.
Attacks pick up. 15 incidents cause $464,000 in damage across 11 states. 16 attacks occur across 9 states causing about $140,000 in damage.11 attacks occur in 7 states, causing approximately $1.3 million in damage.
Attacks spread over 10 states and DC. Damages total about $3.8 million.Total attacks decline but they are spread over 9 states and cause over $2.2 million in damage.Attacks continue to decline but still touch 8 states. Dollar loss falls to under $100,000.8 attacks spread over 5 states. Damages are over $245,000.
Notes: Data are from the Bureau of Alcohol, Tobacco, Firearms and Explosives, the National Abortion Federation, refuseandresist.org and LexisNexis searches. Bomb threats, hoaxes and acts of vandalism are not counted in the table, although they are in our data and in our counts of total acts of terrorism against abortion providers. The murder tally indicates the number of people killed in anti-abortion violence in any given year. An attack that involves multiple homicides is counted as one incident in the analysis.
1 (attempt)
Butyric acid, a noxious chemical with a vomit-like odor, is first used in 13 states. Providers in 8 other states face different threats. The first attempt on a provider's life is reported. Damages reach almost $1.8 million.
Butyric acid attacks occur across clinics in FL, LA and TX between May and July. We have no good estimates of damage from these attacks. Damage from other attacks is just under $100,000.
1 and 1 (attempt)4 and 1
(attempt)
1 (attempt)
Dr. David Gunn is shot outside of his office. Butyric acid attacks decline. But damages from all attacks reach almost $4.6 million.Employees at 2 clinics are killed. Damages from arson, bombings, and acid attacks total $1.4 million.Attacks decline in number and estimated damages fall to $285,000.
35

Table 2 - Comparison of Counties Experiencing Act of Violence and Counties Not Experiencing Act of Violence
Non-Violence Counties Violence Counties
Number of Providers 1.40 8.66 3.27[3.16] [15.34] [9.12]
Providers per 100,000 Women Ages 15-44 Overall 6.56 6.15 5.42
[12.00] [5.95] [7.80]
Non-Hospital-Based 1.98 4.05 1.79[5.74] [5.28] [3.80]
Provider volume <30 abortions per year 3.74 1.47 2.74[10.42] [2.34] [6.57]
Abortions per 1,000 Women Ages 15-44 Overall 9.35 38.65 13.90
[31.60] [31.12] [26.75]
Non-Hospital-Based 7.51 34.01 11.18[30.48] [27.20] [23.55]
Provider volume: 400-999 abortions per year 1.71 5.77 2.03[9.39] [8.42] [6.36]
Birth rate 66.33 65.36 63.74[14.55] [9.57] [11.46]
Females Aged 15-44 27129 154746 63460[45000] [230377] [138480]
Real per capita income (2000$) 18883 23645 21048[4985] [6694] [6118]
Ratio of unemployment benefits to income 0.007 0.005 0.007[0.006] [0.004] [0.006]
Number of counties x year observations 15993 2194 7440
Counties Within 50 Miles of Violence
Notes: The numbers in this table without square brackets represent means for the listed variables. The numbers in square brackets represent the corresponding standard deviations. The per capita income is deflated by the personal consumption expenditures deflator from the Bureau of Economic Analysis. Violence county and neighboring county observations are limited to the 15 years before and after a violent attack. Neighboring counties can include counties that were ever attacked and only include those with providers.
36

Table 3 - The Effect of Violence on Provider and Abortion Rates Overall and by Setting
Panel A: Provider Results
Dependent Variable: Provider Rate Dependent Variable: Hospital Provider Rate Dependent Variable: Non-Hospital Provider RatePost-Event Dummy 0.90 -0.56 -0.57 -0.60 -0.40 -1.81 -0.03 -0.02 -0.09 -0.01 2.72 -0.53 -0.55 -0.51 -0.40
(0.72) (0.31) (0.31) (0.33) (0.50) (0.30) (0.12) (0.13) (0.15) (0.30) (0.61) (0.25) (0.25) (0.25) (0.37)
ControlsCounty Fixed Effects NO YES YES YES YES NO YES YES YES YES NO YES YES YES YESCounty-Level Covariates NO NO YES YES YES NO NO YES YES YES NO NO YES YES YESPolicy Variables NO NO NO YES NO NO NO NO YES NO NO NO NO YES NOState x Year Fixed Effects NO NO NO NO YES NO NO NO NO YES NO NO NO NO YESNumber of Observations 18187 18187 18187 18187 18187 18187 18187 18187 18187 18187 18187 18187 18187 18187 18187Mean of Dependent Variable 6.68 6.68 6.68 6.68 6.68 2.49 2.49 2.49 2.49 2.49 4.19 4.19 4.19 4.19 4.19
Panel B: Abortion Results
Post-Event Dummy 39.37 -3.21 -3.39 -3.22 -3.14 3.91 0.32 0.30 0.28 0.29 35.46 -3.52 -3.69 -3.50 -3.43(3.26) (1.44) (1.46) (1.45) (1.49) (1.29) (0.33) (0.33) (0.32) (0.32) (2.77) (1.45) (1.47) (1.46) (1.51)
ControlsCounty Fixed Effects NO YES YES YES YES NO YES YES YES YES NO YES YES YES YESCounty-Level Covariates NO NO YES YES YES NO NO YES YES YES NO NO YES YES YESPolicy Variables NO NO NO YES NO NO NO NO YES NO NO NO NO YES NOState x Year Fixed Effects NO NO NO NO YES NO NO NO NO YES NO NO NO NO YESNumber of Observations 18187 18187 18187 18187 18187 18187 18187 18187 18187 18187 18187 18187 18187 18187 18187Mean of Dependent Variable 38.18 38.18 38.18 38.18 38.18 5.47 5.47 5.47 5.47 5.47 32.70 32.70 32.70 32.70 32.70Notes: Each column represents a separate regression. The post-event dummy estimates are estimates of 2 from equation (2). For all regressions, robust standard errors clustered at the county-level are presented in parentheses. The sample includes all counties reporting some abortion activity during the 1973-2000 period. The county-level covariates include log per-capita income, log employment, share of employment in construction, share of income paid in unemployment income, and the share of females that are non-white. The policy variables are separate indicators equal to 1 if (1) a Medicaid-eligible woman in that state has no access to public funding for an abortion, (2) a teenager seeking an abortion must either notify her parents or have explicit parental consent, (3) a woman must receive counseling prior to obtaining an abortion, (4) a woman must wait a period of time (usually 24 hours) between her initial visit and the abortion procedure, (5) the state has "targeted regulations" for abortion providers, (6) the state prohibits individuals from obstructing access to an abortion clinic, (7) the state imposes civil or criminal penalties for using force or threatening force to prevent access to an abortion clinic, (8) the state imposes civil or criminal penalties for damaging clinic property. The presented mean represents the mean for all counties experiencing violence in the years prior to violence. Provider rates are per 100,000 women aged 15 to 44; abortion rates are per 1,000 women aged 15 to 44.
Dependent Variable: Abortion Rate Dependent Variable: Hospital Abortion Rate Dependent Variable: Non-Hospital Abortion Rate
37

Table 4 - The Effect of Violence on Provider and Abortion Rates by Provider Volume
Panel A: Provider Results
Post-Event Dummy 0.02 0.05 -0.01 0.20 -0.23 -0.27 -0.25 -0.27 -0.29 -0.29 -0.28 -0.30 -0.05 -0.05 -0.05 -0.03(0.18) (0.18) (0.19) (0.42) (0.22) (0.22) (0.23) (0.24) (0.12) (0.12) (0.12) (0.11) (0.09) (0.09) (0.09) (0.08)
ControlsCounty Fixed Effects YES YES YES YES YES YES YES YES YES YES YES YES YES YES YES YESCounty-Level Covariates NO YES YES YES NO YES YES YES NO YES YES YES NO YES YES YESPolicy Variables NO NO YES NO NO NO YES NO NO NO YES NO NO NO YES NOState x Year Fixed Effects NO NO NO YES NO NO NO YES NO NO NO YES NO NO NO YESNumber of Observations 18187 18187 18187 18187 18187 18187 18187 18187 18187 18187 18187 18187 18187 18187 18187 18187Mean of Dependent Variable 1.59 1.59 1.59 1.59 2.92 2.92 2.92 2.92 0.91 0.91 0.91 0.91 1.27 1.27 1.27 1.27
Panel B: Abortion Results
Post-Event Dummy -0.01 -0.01 -0.01 0.004 0.10 0.07 0.10 0.16 -1.94 -1.93 -1.85 -1.92 -1.36 -1.51 -1.45 -1.38(0.03) (0.03) (0.03) (0.050) (0.29) (0.30) (0.30) (0.31) (0.84) (0.84) (0.84) (0.80) (1.50) (1.51) (1.51) (1.53)
ControlsCounty Fixed Effects YES YES YES YES YES YES YES YES YES YES YES YES YES YES YES YESCounty-Level Covariates NO YES YES YES NO YES YES YES NO YES YES YES NO YES YES YESPolicy Variables NO NO YES NO NO NO YES NO NO NO YES NO NO NO YES NOCounty Linear Trends NO NO NO YES NO NO NO YES NO NO NO YES NO NO NO YESNumber of Observations 18187 18187 18187 18187 18187 18187 18187 18187 18187 18187 18187 18187 18187 18187 18187 18187Mean of Dependent Variable 0.20 0.20 0.20 0.20 4.04 4.04 4.04 4.04 5.93 5.93 5.93 5.93 28.01 28.01 28.01 28.01Notes: Each column in this table represents a separate regression for different-sized categories of providers (<30 abortions provider, 30-399 abortions provider, 400-999 abortions provider, and 1000+ abortions provider). The post-event dummy estimates are estimates of 2 from equation (2). For all regressions robust standard errors clustered at the county-level are presented in parentheses. The sample includes all counties reporting some abortion activity during the 1973-2000 period. The county-level covariates include log per-capita income, log employment, share of employment in construction, share of income paid in unemployment income, and the share of females that are non-white. See Table 3 for a description of the policy variables. The presented mean represents the mean for all counties experiencing violence in the years prior to violence. Provider rates are per 100,000 women aged 15 to 44; abortion rates are per 1,000 women aged 15 to 44.
Dependent Variable: Provider Rate 1000+ Abortions
Dependent Variable: Abortion Rate 1000+ Abortions
Dependent Variable: Provider Rate <30 Abortions
Dependent Variable: Provider Rate 30-399 Abortions
Dependent Variable: Provider Rate 400-999 Abortions
Dependent Variable: Abortion Rate 400-999 Abortions
Dependent Variable: Abortion Rate 30-399 Abortions
Dependent Variable: Abortion Rate <30 Abortions
38

Table 5 - The Effect of Violence by Type of Violence
Hospital Non-hospital <30 30-399 400-999 1000+ Hospital Non-hospital <30 30-399 400-999 1000+Post-Damage Attack Dummy -0.08 -0.45 0.0002 -0.22 -0.27 -0.04 0.25 -2.92 -0.00002 0.09 -1.79 -0.96
(0.15) (0.25) (0.1953) (0.23) (0.12) (0.09) (0.32) (1.45) (0.03498) (0.31) (0.85) (1.50)
Post-Murder Dummy 0.31 -3.41 -0.10 -2.11 -0.50 -0.33 1.14 -26.58 -0.16 -1.74 -3.08 -20.46(0.87) (0.87) (1.78) (0.87) (0.30) (0.16) (1.65) (14.60) (0.15) (1.27) (2.18) (14.62)
Post-Other Violence Dummy -1.55 -0.34 -0.86 -0.18 -0.52 -0.25 1.15 -8.87 -0.12 2.80 -3.94 -6.46(0.97) (0.90) (0.77) (0.82) (0.40) (0.37) (0.71) (7.55) (0.13) (2.92) (2.89) (8.40)
Observations 18187 18187 18187 18187 18187 18187 18187 18187 18187 18187 18187 18187Mean Abortion/Provider Rate 2.49 4.19 1.59 2.92 0.91 1.27 5.47 32.70 0.20 4.04 5.93 28.01
Table 6 - The Effect of Violence on Targeted Counties and Counties Within 50 Miles
Hospital Non-hospital Hospital Non-hospitalPost-Event Dummy -0.17 -0.54 0.37 -3.85
(0.16) (0.26) (0.33) (1.51)
0.53 0.22 -0.57 2.47(0.27) (0.13) (0.32) (1.22)
Observations 18187 18187 18187 18187Mean of Dependent Var 2.49 4.19 5.47 32.70Standardized Mean for Neighbors 0.70 0.71 0.62 5.22Notes: Each column in this table represents a separate regression. All regressions control for county fixed effects in addition to the full set of policy variables and the county-level covariates in Tables 3-4. We supplement our standard regression with a dummy that equals 1 for counties within 50 miles of an attack in the years following an attack, weighted by the attack-year population share of each neighbor within this area. The coefficient and standard error from the neighbor effects are standardized to the pre-violence means of the female population in the attacked county (i.e., multiplied by the ratio of the pre-violence mean of females ages 15 to 44 in neighboring counties to attacked counties (0.409)). In this way, the effects on attacked counties and their neighbors can be directly compared. Robust standard errors clustered at the county-level are presented in parentheses. The sample includes all counties reporting some abortion activity during the 1973-2000 period. Provider rates are per 100,000 women aged 15 to 44; abortion rates are per 1,000 women aged 15 to 44. The mean of abortions and provider rates represents the mean in the years prior to the violence for violence counties or their neighbors, as indicated. The mean for neighbors has also been population-standardized.
Notes: Each column in this table represents a separate regression. The post-event dummies are similar to that in equation (2) but broken out by type of incident. Damage includes arson, butyric acid, and bombing. Murder includes murder and attempted murder. "Other violence" include hoax devices, major threats, kidnappings, and protests. All regressions control for county fixed effects in addition to the full set of policy variables and the county-level covariates in Tables 3-4. Robust standard errors clustered at the county-level are presented in parentheses. The sample includes all counties reporting some abortion activity during the 1973-2000 period. Provider rates are per 100,000 women aged 15 to 44; abortion rates are per 1,000 women aged 15 to 44. The mean of abortions and provider rates by type or volume represents the mean for all counties experiencing violence in the years prior to violence.
Provider Rates Abortion Rates
Provider Rates Abortion Rates
Post-Event Dummy * Neighbor Population Share
39

Table 7 - The Effect of Violence on Log Births in Targeted Counties
Sample: All Counties in Abortion Data Sample: All CountiesPost-Event Dummy 1.849 0.009 2.842 0.010
(0.094) (0.004) (0.094) (0.004)
ControlsCounty Fixed Effects NO YES NO YESObservations 293165 293165 958773 958773Mean Number of Births/Month 852 852 829 829
Table 8 - The Effect of Violence on Log Births in Targeted Counties and Counties within 50 Miles
Sample: All Counties in Abortion Data Sample: All CountiesPost-Event Dummy 1.961 0.009 3.026 0.010
(0.091) (0.004) (0.088) (0.004)
Post-Event Dummy for Neighbor 0.581 -0.001 0.863 0.001(0.067) (0.003) (0.045) (0.003)
ControlsCounty Fixed Effects NO YES NO YESObservations 206029 206029 745614 745614Mean Number of Births/Month 357 357 184 184
Notes: Each column in this table represents a separate regression. The post-event dummy estimates are estimates of 2 from equation (3). The post-event dummy is defined to be equal to 1 for births occurring 7 to 11 months after the violence and 0 otherwise. Robust standard errors clustered at the county-level are presented in parentheses. The presented means represent the means for all counties experiencing violence in the months prior to violence.
Notes: Each column in this table represents a separate regression. The estimates are based on our standard regression supplemented with a separate post-event dummy for counties within 50 miles of an attack. Both post-event dummies are defined to be equal to 1 for births occurring 7 to 11 months after the violence and 0 otherwise. Robust standard errors clustered at the county-level are presented in parentheses. The presented means represent the means for all counties experiencing violence in the months prior to violence.
40

Data Appendix County-Level Abortion and Abortion Provider Data from Alan Guttmacher Institute (AGI) The Alan Guttmacher Institute (AGI) is a non-profit organization interested in sexual and reproductive health. On a semi-regular basis, AGI attempts to collect data on abortions performed by all abortion providers in the United States. AGI attempts to contact each suspected abortion provider many times. Although incomplete, these data represent nearly a census of all known providers, where providers are facilities that perform some abortions. For example, AGI obtained data for nearly 85 percent of the providers surveyed in 2000 (Finer and Henshaw, 2003). AGI conducted surveys in the years 1973-1982, 1984, 1985, 1987, 1988, 1991, 1992, 1995, 1996, 1999, and 2000. Finer and Henshaw (2003) provide a detailed description of the survey methodology, including the great lengths taken by surveyors to contact all providers. We acquired confidential county-level AGI data on the number of abortion facilities, referred to as providers by AGI, and the number of abortions performed in each survey year. We have data on the number of abortion providers or facilities broken down by setting – hospital or non-hospital – and the corresponding number of abortions performed in each setting. We also have the number of providers by volume of the facility (<30 abortions performed, 30-399 abortions, 400-999 abortions, 1000+ abortions) and the total number of abortions performed by each group.
Data Appendix Figures 1 & 2 show the time series patterns in abortion and provider rates. Coinciding with the rise in violence in the mid-1980s and early 1990s is a decline in abortion activity in the United States. The ratio of providers to abortions has risen monotonically over time, meaning the decline in providers has overshadowed the fall in abortions. Some of this increase may reflect improvements in the technology of abortions. In particular, over time the abortion procedure has become faster with fewer complications.1 Medical abortion became available in 2000, the last year of our analysis.
1 These improvements include a switch away from abortion by “sharp curettage” to “suction curettage,” which takes about half as long to perform (5 versus 10 minutes) and has fewer complications (Grimes and Creinin 2004), a shift from general to local anesthesia, which has fewer complications, the introduction of “manual vacuum aspiration,” which requires less training, and improvements in early pregnancy detection, which increases the possibility of early, less complicated abortions (Jones et al. 2008). These innovations will only affect our provider results if the timing of adoption differs systematically across areas that experienced violence versus those that did not. For example, if areas that experience violence systematically adopt innovations around the time of their first attack we risk overstating the impact of anti-abortion violence on the reduction in providers. The substantial variation in the timing and geographic distribution of first attacks and the fact that these technical improvements are largely invisible to the public (thus seem unlikely to provoke violence) makes this scenario seem implausible. Moreover, the low fixed costs of these innovations, their promise of significant cost-savings and their promotion by national advocacy groups such as Planned Parenthood and the National Abortion Federation further lowers the likelihood of this possibility. To the extent that the timing of adoption does vary systematically, our analyses of a matched sample of counties or only counties that ever experienced violence provide important robustness checks.
1
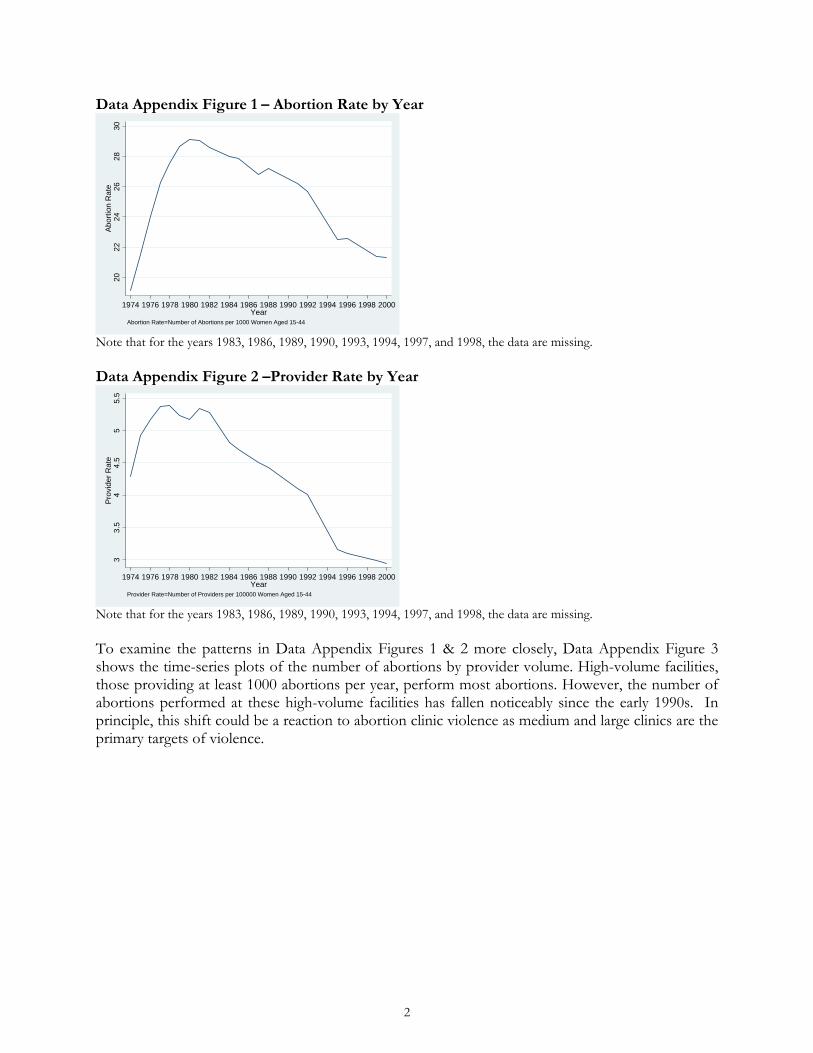
Data Appendix Figure 1 – Abortion Rate by Year 20
2224
2628
30A
bort
ion
Rat
e
1974 1976 1978 1980 1982 1984 1986 1988 1990 1992 1994 1996 1998 2000Year
Abortion Rate=Number of Abortions per 1000 Women Aged 15-44
Note that for the years 1983, 1986, 1989, 1990, 1993, 1994, 1997, and 1998, the data are missing. Data Appendix Figure 2 –Provider Rate by Year
33.
54
4.5
55.
5P
rovi
der
Rat
e
1974 1976 1978 1980 1982 1984 1986 1988 1990 1992 1994 1996 1998 2000Year
Provider Rate=Number of Providers per 100000 Women Aged 15-44
Note that for the years 1983, 1986, 1989, 1990, 1993, 1994, 1997, and 1998, the data are missing. To examine the patterns in Data Appendix Figures 1 & 2 more closely, Data Appendix Figure 3 shows the time-series plots of the number of abortions by provider volume. High-volume facilities, those providing at least 1000 abortions per year, perform most abortions. However, the number of abortions performed at these high-volume facilities has fallen noticeably since the early 1990s. In principle, this shift could be a reaction to abortion clinic violence as medium and large clinics are the primary targets of violence.
2

Data Appendix Figure 3 – Number of Abortions by Size of Provider 0
500
1000
1500
Num
ber
of A
bort
ions
(in
Tho
usan
ds)
1974 1976 1978 1980 1982 1984 1986 1988 1990 1992 1994 1996 1998 2000Year
<30 abortions 30-399 abortions400-999 abortions 1000+ abortions
Note that for the years 1983, 1986, 1989, 1990, 1993, 1994, 1997, and 1998, the data are missing.
County-Level Natality Data from the National Center for Health Statistics (NCHS) From the National Center for Health Statistics’ Detailed Natality Files, we also have county-level monthly data on births from 1973 to 2002. For this period, we have counts of births for every county regardless of population size. Public-use natality data from 1989 onward exclude county identifiers for counties with fewer than 100,000 persons. Because our birth counts are from non-public-use data, this sample selection criterion does not apply. Abortion Clinic Violence The main source of abortion violence data is derived from the Bureau of Alcohol, Tobacco, and Firearms (ATF). All anti-abortion incidents involving explosives fall under the jurisdiction of the ATF. The types of incidents reported to the ATF include arson, bombing, bomb threats, and hoax devices. For the years 1976-2005, there were 287 abortion clinic incidents reported to the ATF. Independently, the National Abortion Federation (NAF), the Feminist Majority Foundation’s “National Clinic Access Project” and refuseandresist.org also report incidents of extreme violence, with the NAF maintaining the most comprehensive list.2 Lexis-Nexis searches of news articles and television broadcasts helped to validate and augment these data sources.3 Combining all five sources, there were 342 acts of extreme violence for the 1976 to 2005 period.
State-Level Policy Variables We code up several abortion-related policy variables. Specifically, we include separate indicators equal to 1 if (1) a Medicaid-eligible woman in that state has no access to public funding for an abortion, (2) a teenager seeking an abortion must either notify her parents or have explicit parental consent, (3) a woman must receive counseling prior to obtaining an abortion, (4) a woman must wait a period of time (usually 24 hours) between her initial visit and the abortion procedure, (5) the state has "targeted regulations" for abortion providers, (6) the state prohibits individuals from obstructing access to an abortion clinic, (7) the state imposes civil or criminal penalties for using force or
2 The Feminist Majority Foundation has published regular “Anti-Abortion Violence Alerts” since June 1997. See http://www.feminist.org/rrights/antialert.html 3 Thirteen arson and bombing attempts or attacks were reported to the NAF by member organizations between 1977 and 1982 but were not investigated by the ATF or publicized in any independent source. Including those cases in our analysis does not change the basic pattern of results or the general magnitude of the implied effects.
3

threatening force to prevent access to an abortion clinic, and (8) the state imposes civil or criminal penalties for damaging clinic property. Our coding of Medicaid funding bans is based on an updating of Blank et al. (1996). Coding of the other laws is based primarily on an extensive database maintained by NARAL as part of its project, “Who Decides? The Status of Women’s Reproductive Rights in the United States.”4 Although this database describes changes over time, we also check dates against other sources in the literature (e.g., Joyce et al. 2001) to make sure we are not missing laws that have been previously repealed. County-Level Covariates To scale the abortion and abortion provider measures, we use the number of females ages 15 to 44 from US Census Bureau Population Estimates Program. We also use data from the Bureau of Economic Analysis’s Regional Economic Information System (REIS) to control for a host of county level covariates – the log per-capita income, log employment, the share of employment in construction, the share of income paid in unemployment income, and the share of females that are non-white. Lexis-Nexis Newspaper Article Counts To develop a measure of underlying local abortion discussion, we conducted a systematic search of newspaper articles using the Lexis-Nexis database. Specifically, for each area experiencing an act of violence, we identified a newspaper in the area. For each newspaper outlet, we searched for all articles containing the word “abortion” in the headline. The coverage rates of newspapers in Lexis-Nexis are quite variable. For some newspapers, many years of articles are available whereas for other newspapers, they are not. Of the 150 counties experiencing at least one event between 1976 and 2005, we were able to extract articles for 59 of them. Recall that in our main sample we have 140 counties because we consider the years 1976-2000 for that sample. For 10 of the 59 counties appearing in the Lexis-Nexis database, Lexis-Nexis had newspaper coverage 12 months prior to the event up until 12 months following the event. The covered areas are as follows: Birmingham, Alabama on 1/29/1998 (Birmingham News); San Francisco, California on 2/28/1995 (San Francisco Chronicle); Modesto, California on 3/19/2003 (Modesto Bee); Denver, Colorado on 8/26/2003 (Denver Post); Washington DC on 7/4/1984 (Washington Post); Miami, Florida on 5/16/1998 (Miami Herald); Buffalo, New York on 4/18/1992 (Buffalo News); New York City, New York on 12/10/1985 (New York Times); Syracuse, New York on 5/23/1990 (Post Standard); and Greensboro, North Carolina on 3/17/1991 (News & Record). While this list is certainly not comprehensive, estimates based on this sample should be informative about the political and social discussion concerning abortion near the time of the abortion violence.
4 See http://www.naral.org/choice-action-center/in_your_state/who-decides/state-profiles/california.html
4
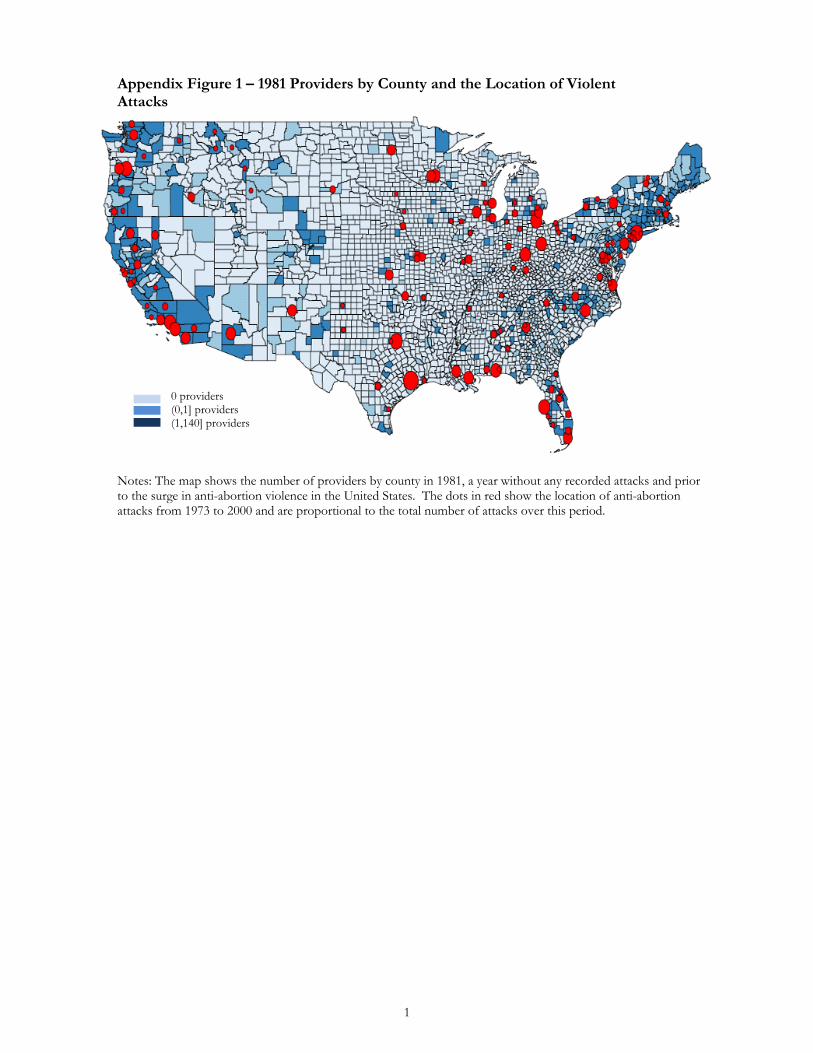
Appendix Figure 1 – 1981 Providers by County and the Location of Violent Attacks
Notes: The map shows the number of providers by county in 1981, a year without any recorded attacks and prior to the surge in anti-abortion violence in the United States. The dots in red show the location of anti-abortion attacks from 1973 to 2000 and are proportional to the total number of attacks over this period.
0 providers (0,1] providers (1,140] providers
1

Appendix Figure 2 – Abortion Newspaper Articles Over Time
-40
-20
020
40A
rtic
les
-12 -8 -4 0 4 8 12Month Relative to Event
Estimated Effect Lower Bound 95% CIUpper Bound 95% CI
Notes: The figure above depicts coefficient estimates of month-relative-to-event fixed effects from a regression of the number of newspaper articles on month-relative-to-event fixed effects, month x year fixed effects, and county fixed effects. The excluded dummy is the month-relative-to-event-equal-to-0 dummy. The dashed lines represent the upper and lower bounds of the 95 percent confidence intervals of the month-relative-to-event fixed effects. The standard errors of these fixed effects are adjusted for within-county correlation. The counts of the number of newspaper articles come from a Lexis-Nexis search of articles with “abortion” in the headline.
2

Appendix Table 1 - The Effect of Violence on Provider and Abortion Rate - Propensity-Score Matched Counties
Panel A: Provider Results
Dependent Variable: Provider Rate Dependent Variable: Hospital Provider Rate Dependent Variable: Non-Hospital Provider RatePost-Event Dummy 0.75 -0.48 -0.51 -0.52 -0.40 -0.31 -0.03 -0.06 -0.08 -0.07 1.06 -0.45 -0.45 -0.44 -0.33
(0.54) (0.21) (0.21) (0.22) (0.22) (0.23) (0.09) (0.09) (0.10) (0.11) (0.44) (0.17) (0.17) (0.17) (0.17)
ControlsCounty Fixed Effects NO YES YES YES YES NO YES YES YES YES NO YES YES YES YESCounty-Level Covariates NO NO YES YES YES NO NO YES YES YES NO NO YES YES YESPolicy Variables NO NO NO YES NO NO NO NO YES NO NO NO NO YES NOState x Year Fixed Effects NO NO NO NO YES NO NO NO NO YES NO NO NO NO YESNumber of Observations 5703 5703 5703 5703 5703 5703 5703 5703 5703 5703 5703 5703 5703 5703 5703Mean of Dependent Variable 6.29 6.29 6.29 6.29 6.29 2.42 2.42 2.42 2.42 2.42 3.87 3.87 3.87 3.87 3.87
Panel B: Abortion Results
Dependent Variable: Abortion Rate Dependent Variable: Hospital Abortion Rate Dependent Variable: Non-Hospital Abortion RatePost-Event Dummy 21.64 -2.76 -2.71 -2.77 -2.75 2.77 0.33 0.30 0.22 0.11 18.87 -3.09 -3.01 -2.99 -2.86
(3.71) (1.33) (1.32) (1.33) (1.44) (1.45) (0.35) (0.34) (0.33) (0.31) (3.18) (1.36) (1.34) (1.35) (1.50)
ControlsCounty Fixed Effects NO YES YES YES YES NO YES YES YES YES NO YES YES YES YESCounty-Level Covariates NO NO YES YES YES NO NO YES YES YES NO NO YES YES YESPolicy Variables NO NO NO YES NO NO NO NO YES NO NO NO NO YES NOState x Year Fixed Effects NO NO NO NO YES NO NO NO NO YES NO NO NO NO YESNumber of Observations 5703 5703 5703 5703 5703 5703 5703 5703 5703 5703 5703 5703 5703 5703 5703Mean of Dependent Variable 39.85 39.85 39.85 39.85 39.85 5.69 5.69 5.69 5.69 5.69 34.17 34.17 34.17 34.17 34.17Notes: Each column in this table represents a separate regression. The post-event dummy estimates are estimates of 2 from equation (2). For all regressions, robust standard errors clustered at the county-level are presented in parentheses. For all counties reporting some abortion activity during the 1973-2000 period, we predicted their propensity for violence using 1973 values for their log per-capita income, log employment, share of employment in construction, share of income paid in unemployment income, and share of females that are non-white. The estimation sample includes all counties with propensity for violence between 0.1 and 0.9. The county-level covariates include log per-capita income, log employment, share of employment in construction, the share of income paid in unemployment income, and the share of females that are non-white. See Table 3 for a description of the policy variables. The presented mean represents the mean for the counties experiencing violence in the estimation sample in the years prior to violence. Provider rates are per 100,000 women aged 15 to 44; abortion rates are per 1,000 women aged 15 to 44.
3

Appendix Table 2 - The Effect of Violence on Provider and Abortion Rate, Sample: Counties that Ever Experienced Violence
Panel A: Provider Results
Dependent Variable: Provider Rate Dependent Variable: Hospital Provider Rate Dependent Variable: Non-Hospital Provider RatePost-Event Dummy -0.11 -0.37 -0.44 -0.41 -0.29 0.01 0.08 0.03 0.03 0.02 -0.12 -0.46 -0.47 -0.44 -0.30
(0.29) (0.28) (0.29) (0.29) (0.26) (0.12) (0.10) (0.11) (0.11) (0.16) (0.25) (0.24) (0.24) (0.24) (0.19)
ControlsCounty Fixed Effects NO YES YES YES YES NO YES YES YES YES NO YES YES YES YESCounty-Level Covariates NO NO YES YES YES NO NO YES YES YES NO NO YES YES YESPolicy Variables NO NO NO YES NO NO NO NO YES NO NO NO NO YES NOState x Year Fixed Effects NO NO NO NO YES NO NO NO NO YES NO NO NO NO YESNumber of Observations 2194 2194 2194 2194 2194 2194 2194 2194 2194 2194 2194 2194 2194 2194 2194Mean of Dependent Variable 6.68 6.68 6.68 6.68 6.68 2.49 2.49 2.49 2.49 2.49 4.19 4.19 4.19 4.19 4.19
Panel B: Abortion Results
Dependent Variable: Abortion Rate Dependent Variable: Hospital Abortion Rate Dependent Variable: Non-Hospital Abortion RatePost-Event Dummy -2.79 -2.09 -2.00 -2.20 -3.17 0.01 0.16 0.11 -0.02 -0.40 -2.80 -2.25 -2.10 -2.18 -2.77
(1.97) (1.40) (1.36) (1.36) (1.68) (0.81) (0.30) (0.30) (0.31) (0.28) (1.79) (1.40) (1.37) (1.35) (1.70)
ControlsCounty Fixed Effects NO YES YES YES YES NO YES YES YES YES NO YES YES YES YESCounty-Level Covariates NO NO YES YES YES NO NO YES YES YES NO NO YES YES YESPolicy Variables NO NO NO YES NO NO NO NO YES NO NO NO NO YES NOState x Year Fixed Effects NO NO NO NO YES NO NO NO NO YES NO NO NO NO YESNumber of Observations 2194 2194 2194 2194 2194 2194 2194 2194 2194 2194 2194 2194 2194 2194 2194Mean of Dependent Variable 38.18 38.18 38.18 38.18 38.18 5.47 5.47 5.47 5.47 5.47 32.70 32.70 32.70 32.70 32.70Notes: Each column in this table represents a separate regression. The post-event dummy estimates are estimates of 2 from equation (2). For all regressions, robust standard errors clustered at the county-level are presented in parentheses. The estimation sample includes only counties experiencing violence during the 1973-2000 period. The county-level covariates include log per-capita income, log employment, share of employment in construction, share of income paid in unemployment income, and the share of females that are non-white. See Table 3 for a description of the policy variables. The presented mean represents the mean for all counties experiencing violence in the years prior to violence. Provider rates are per 100,000 women aged 15 to 44; abortion rates are per 1,000 women aged 15 to 44.
4

Appendix Table 3 - The Effect of Violence on Provider and Abortion Rates - Differential Effects by Pre-Attack Provider Rate
Panel A: Provider Results
Dependent Var: Provider Rate Dependent Var: Hospital Provider Rate Dependent Var: Non-Hospital Provider RateProvider Rate Pre-Attack Distribution [0, 25] (25, 75) [75,100] [0, 25] (25, 75) [75,100] [0, 25] (25, 75) [75,100]
Post-Event Dummy -0.01 -0.12 -2.27 -0.02 0.13 -0.70 0.01 -0.25 -1.57(0.36) (0.26) (1.10) (0.24) (0.17) (0.43) (0.21) (0.17) (0.88)
ControlsCounty Fixed Effects YES YES YES YES YES YES YES YES YESCounty-Level Covariates YES YES YES YES YES YES YES YES YESPolicy Variables YES YES YES YES YES YES YES YES YESState x Year Fixed Effects NO NO NO NO NO NO NO NO NONumber of Observations 16513 17124 16536 16513 17124 16536 16513 17124 16536Mean Provider Rate 3.02 5.78 12.36 1.42 2.35 3.91 1.60 3.43 8.45
Panel B: Abortion Results
Provider Rate Pre-Attack Distribution [0, 25] (25, 75) [75,100] [0, 25] (25, 75) [75,100] [0, 25] (25, 75) [75,100]
Post-Event Dummy -3.85 -2.91 -4.65 0.35 -0.24 1.35 -4.20 -2.67 -6.00(2.94) (2.01) (3.36) (0.42) (0.26) (1.16) (2.85) (2.00) (3.42)
ControlsCounty Fixed Effects YES YES YES YES YES YES YES YES YESCounty-Level Covariates YES YES YES YES YES YES YES YES YESPolicy Variables YES YES YES YES YES YES YES YES YESState x Year Fixed Effects NO NO NO NO NO NO NO NO NONumber of Observations 16513 17124 16536 16513 17124 16536 16513 17124 16536Mean Abortion Rate 25.33 36.54 54.89 1.09 4.15 12.76 24.24 32.39 42.13
Dependent Var: Abortion Rate Dependent Var: Hospital Abortion Rate Dependent Var: Non-Hospital Abortion Rate
Notes: Each column in this table represents a separate regression. The post-event dummy estimates are estimates of 2 from equation (2). We classify attacked counties into quartiles based on their pre-violence provider rates; we use data from all non-attacked counties in all regressions. Counties with a provider rate in the lowest quartile of this distribution are denoted by the [0, 25] group in this table, counties with a provider rate in the interquartile range are represented by the (25, 75) group, and counties with a provider rate in the highest quarter are classified into the [75, 100] group. For all regressions, robust standard errors clustered at the county-level are presented in parentheses. The sample includes all counties reporting some abortion activity during the 1973-2000 period. The county-level covariates include log per-capita income, log employment, share of employment in construction, share of income paid in unemployment income, and the share of females that are non-white. The density of women of childbearing age is the population of women ages 15 to 44 (in 1000s) per square mile of land in the county; it is measured in the year of a county was attacked. See Table 3 for a description of the policy variables. The presented mean represents the mean for all counties experiencing violence in the years prior to violence. Provider rates are per 100,000 women aged 15 to 44; abortion rates are per 1,000 women aged 15 to 44.
5
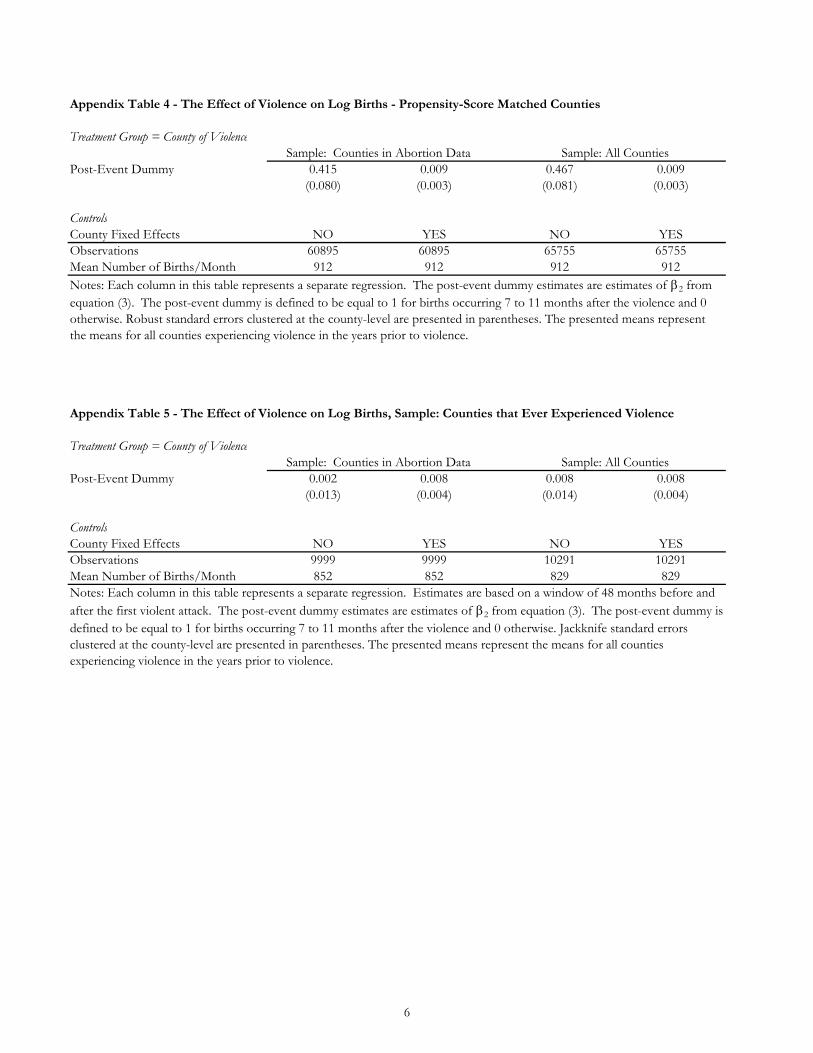
Appendix Table 4 - The Effect of Violence on Log Births - Propensity-Score Matched Counties
Treatment Group = County of ViolenceSample: Counties in Abortion Data Sample: All Counties
Post-Event Dummy 0.415 0.009 0.467 0.009(0.080) (0.003) (0.081) (0.003)
ControlsCounty Fixed Effects NO YES NO YESObservations 60895 60895 65755 65755Mean Number of Births/Month 912 912 912 912
Appendix Table 5 - The Effect of Violence on Log Births, Sample: Counties that Ever Experienced Violence
Treatment Group = County of ViolenceSample: Counties in Abortion Data Sample: All Counties
Post-Event Dummy 0.002 0.008 0.008 0.008(0.013) (0.004) (0.014) (0.004)
ControlsCounty Fixed Effects NO YES NO YESObservations 9999 9999 10291 10291Mean Number of Births/Month 852 852 829 829
Notes: Each column in this table represents a separate regression. The post-event dummy estimates are estimates of 2 from equation (3). The post-event dummy is defined to be equal to 1 for births occurring 7 to 11 months after the violence and 0 otherwise. Robust standard errors clustered at the county-level are presented in parentheses. The presented means represent the means for all counties experiencing violence in the years prior to violence.
Notes: Each column in this table represents a separate regression. Estimates are based on a window of 48 months before and after the first violent attack. The post-event dummy estimates are estimates of 2 from equation (3). The post-event dummy is defined to be equal to 1 for births occurring 7 to 11 months after the violence and 0 otherwise. Jackknife standard errors clustered at the county-level are presented in parentheses. The presented means represent the means for all counties experiencing violence in the years prior to violence.
6

Appendix Table 6 - The Effect of Violence on Log Birth Rate
Sample: All Counties in Abortion Data Sample: All CountiesProvider Rate Pre-Attack Distribution, Attacked Counties [0, 25] (25, 75) [75,100] [0, 25] (25, 75) [75,100]
Post-Event Dummy 0.014 0.013 -0.003 0.013 0.014 -0.002(0.007) (0.006) (0.007) (0.006) (0.006) (0.008)
ControlsCounty Fixed Effects YES YES YES YES YES YESNumber of Observations 285657 288143 285697 950973 953459 951013Mean Number of Births/Month 869.09 966.58 603.74 869.09 966.58 603.74Notes: Each column in this table represents a separate regression. The post-event dummy estimates are estimates of 2 from equation (3). For all regressions, robust standard errors clustered at the county-level are presented in parentheses. The counties experiencing violence are divided into three groups based on the provider rate in the county at the time of the violence - bottom quartile denoted [0, 25] in the table, the interquartile range denoted (25,75) in the table, and the top quartile denoted [75,100] in the table. Each regression includes the full set of control counties. The presented means represent the means for counties experiencing violence in the years prior to violence.
7