after sales services and customer relationship marketing635620/fulltext01.pdf · after-sales...
TRANSCRIPT
AFTER-SALES SERVICES AND CUSTOMER
RELATIONSHIP MARKETING:
- A MULTIPLE CASE STUDY WITHIN THE SWEDISH HEAVY
EQUIPMENT MACHINERY INDUSTRY
Authors: Erika Egonsson
Marketing Program
Khulan Bayarsaikhan Subject: Relationship and service marketing
Marketing Program
Ting Ting Ly
Marketing Program
Tutor: Mosad Zineldin
Examiner: Rana Mostaghel
Subject: Relationship and service marketing
Level and Semester: Bachelor Thesis
Spring 2013


ABSTRACT
Due to growing complexities in business-to-business products, the relationship between a
seller and a buyer usually never ends after the purchase transaction. Customers buy
augmented products, expecting bundle of values that come with the product which will satisfy
the buyer. Thus, integrating services into the core offerings in manufacturing industries has
taken crucial importance. Especially, after-sales service is considered a tool for enhancing a
valuable advantage for the customer as well as it is a business opportunity for the company.
After-sales services have proven to be of importance, and a strategic after-sales framework is
necessary. Three major activities that play a crucial role within the after-sales services in the
manufacturing industry are field technical assistance, spare parts distribution and customer
care. However, intensive studies regarding after-sales in a specific industry are lacking. This
thesis focuses on the Swedish heavy equipment machinery industry organizations of different
sizes and thus, the purpose of this study is to investigate the major activities of after-sales
service focusing on customer relationship among three classified sizes of after-sales service
providers.
A multiple case study has been carried out in the form of semi-structured interviews with
three organizations; one small, one medium and one large size after-sales service providers.
The study reveals that customer care is the most focused activity of after-sales services in the
heavy equipment machinery industry in Sweden. Simultaneously, it shows the most
significant differences of offers depending on the size of the company, in relation to the
remaining activities. Field technical assistance appears to be the part of after-sales that
produces least profit in the industry. Thus, it might be the reason that small organizations
would rather tend to outsource it, in order to avoid high costs. Spare parts distribution can be
considered as the most profitable activity of after-sales. The warehouses and repair centers of
companies naturally varied according to firm sizes. Although the organizations do not state
formal goals for providing after-sales service to its customers, they are aware of its
importance and aim for satisfying customer demands. All organizations are convinced that if
after-sales services are not handled properly, they face the risk of losing the customer. Finally,
this research indicates that organizations in the heavy equipment machinery industry have a
lot of room for improvements to its after-sales activities with respect to their relationship with
customers, which can be accomplished in strategic and systematic ways.
Keywords: After-sales service, Field technical assistance, Spare parts distribution, Customer
care, Customer relationship marketing, Firm size


ACKNOWLEDGEMENT
This study was conducted as our bachelor thesis during our last semester at the International
Marketing Program in spring 2013. Within our bachelor thesis we have had the chance to,
within a time frame, show our independency in applying our knowledge obtained during our
years in the program to the independent degree project. It has surely been an improving and
valuable experience. Furthermore, a deeper knowledge in after-sales and its area have been
achieved, and the qualitative research approach has given us the opportunity to approach and
gain an insight into organizations in real life. This project was manageable due to a number of
people that we would like to thank.
Firstly, we would like to show our gratitude by specifically thanking our tutor Dr. Mosad
Zineldin and examiner Dr. Rana Mostaghel for surpassing our expectations about the time and
qualitative feedback devoted to us. We would also like to thank Dr. Magnus Hultman for his
valuable feedback and comments. Lastly, we would like to thank the time and support of the
three organizations which participated in this research.
Linnaeus University
May 2013
Erika Egonsson, Khulan Bayarsaikhan and Ting Ting Ly


TABLE OF CONTENTS
1. Introduction ............................................................................................................................ 1
1.1 Background ...................................................................................................................... 1
1.2 Problem discussion ........................................................................................................... 2
1.3 Delimitations .................................................................................................................... 3
1.4 Outline of the thesis .......................................................................................................... 4
2. Literature review .................................................................................................................... 5
2.1 Relationship after the sale ................................................................................................ 5
2.2 Relationship and customer services ................................................................................. 5
2.3 Relationship strategies ...................................................................................................... 6
2.3.1 Good relationship ...................................................................................................... 7
2.3.2 Bad relationship ......................................................................................................... 8
2.4 After-sales in business-to-business environment ............................................................. 8
2.5 Activities in After-sales service ....................................................................................... 9
2.5.1 Customer Care ........................................................................................................... 9
2.5.2 Field Technical Assistance ...................................................................................... 10
2.5.3 Spare parts distribution............................................................................................ 11
2.6 Manufacturing industry and firm size ............................................................................ 12
2.7 Need for further investigation ........................................................................................ 13
3. Research model and research questions ............................................................................... 16
3.1 Proposed research model ................................................................................................ 16
3.2 Research questions ......................................................................................................... 17
4. Methodology ........................................................................................................................ 18
4.1 Research approach .......................................................................................................... 18
4.1.1 Inductive vs. deductive research ............................................................................. 18
4.1.2 Qualitative vs. quantitative research ....................................................................... 19
4.2 Research design .............................................................................................................. 19
4.3 Data sources ................................................................................................................... 20
4.4 Research strategy ............................................................................................................ 21

4.5 Data collection method ................................................................................................... 23
4.6 Data collection instrument ............................................................................................. 25
4.6.1 Operationalization and measurement of variables .................................................. 25
4.6.2 Interview guide ........................................................................................................ 29
4.6.3 Pretesting ................................................................................................................. 30
4.7 Sampling ......................................................................................................................... 30
4.7.1 Sampling frame ....................................................................................................... 31
4.7.2 Sample selection ...................................................................................................... 32
4.7.3 The sample .............................................................................................................. 33
4.8 Data analysis method ..................................................................................................... 33
4.9 Quality criteria ................................................................................................................ 35
4.9.1 Content validity ....................................................................................................... 35
4.9.2 Construct validity .................................................................................................... 35
4.9.3 External validity ...................................................................................................... 36
4.9.4 Reliability ................................................................................................................ 37
5. Empirical data ...................................................................................................................... 38
5.1 Case A – Small size organization ................................................................................... 39
5.1.1 Customer care .......................................................................................................... 39
5.1.2 Field technical assistance ........................................................................................ 40
5.1.3 Spare parts distribution............................................................................................ 41
5.1.4 Customer relationship marketing ............................................................................ 41
5.2 Case B – Medium size organization ............................................................................... 42
5.2.1 Customer care .......................................................................................................... 42
5.2.2 Field technical assistance ........................................................................................ 43
5.2.3 Spare parts distribution............................................................................................ 44
5.2.4 Customer relationship marketing ............................................................................ 45
5.3 Case C – Large size organization ................................................................................... 45
5.3.1 Customer care .......................................................................................................... 46
5.3.2 Field technical assistance ........................................................................................ 47
5.3.3 Spare parts distribution............................................................................................ 48
5.3.4 Customer relationship marketing ............................................................................ 49
6. Data analysis ........................................................................................................................ 51

6.1 Customer care ................................................................................................................. 51
6.1.1 Information provision .............................................................................................. 51
6.1.2 Complaint management ........................................................................................... 53
6.1.3 Warranty extension ................................................................................................. 54
6.2 Field technical assistance ............................................................................................... 55
6.2.1 Check-ups ................................................................................................................ 56
6.2.2 During and after warranty assistance ...................................................................... 57
6.2.3 Product disposal ...................................................................................................... 58
6.3 Spare parts distribution ................................................................................................... 58
6.3.1 Inventory management ............................................................................................ 59
6.3.2 Delivery of spare parts ............................................................................................ 60
6.4 Customer relationship marketing ................................................................................... 60
6.4.1 Service quality ......................................................................................................... 61
6.4.2 Customer relationship profitability ......................................................................... 62
7. Conclusions and implications ............................................................................................... 66
7.1 Discussions ..................................................................................................................... 66
7.1.1 Customer care .......................................................................................................... 66
7.1.2 Field technical assistance ........................................................................................ 67
7.1.3 Spare parts distribution............................................................................................ 68
7.1.4 Customer relationship marketing ............................................................................ 68
7.2 Theoretical and managerial implications ....................................................................... 69
7.3 Limitations ..................................................................................................................... 71
7.4 Suggestions for future research ...................................................................................... 72
Reference list ............................................................................................................................ 73
Appendix A – Interview guide ................................................................................................. 85

LIST OF TABLES
Table 1: Literature review overview ........................................................................................ 15
Table 2: Research strategies ..................................................................................................... 22
Table 3: Operationalization of After-sales ............................................................................... 27
Table 4: Operationalization of Customer relationship marketing ............................................ 28
Table 5: Business categorization in Sweden ............................................................................ 32
Table 6: Research methodology summary ............................................................................... 37
Table 7: General information about the cases .......................................................................... 38
Table 8: Information provision ................................................................................................ 52
Table 9: Complaint management ............................................................................................. 54
Table 10: Warranty extension .................................................................................................. 55
Table 11: Check-ups ................................................................................................................. 56
Table 12: During and after warranty assistance ....................................................................... 57
Table 13: Product disposal ....................................................................................................... 58
Table 14: Inventory management ............................................................................................. 59
Table 15: Delivery of spare parts ............................................................................................. 60
Table 16: Service quality .......................................................................................................... 62
Table 17: Customer relationship profitability .......................................................................... 64
LIST OF FIGURES
Figure 1: Service revenue in manufacturing companies .......................................................... 12
Figure 2: Proposed research model .......................................................................................... 16


1
1. INTRODUCTION
This chapter presents an introductory discussion of relationship marketing, after-sales
services and the Swedish heavy equipment machinery industry, along with identification of
the research gap which lead to the purpose of this thesis. Finally, delimitations, and overview
of the thesis outline are elaborated.
1.1 BACKGROUND
A relationship between a company and a customer has previously been based on a product-
centric view; however, today relationship between the two parties has taken a shift and
customers are the main focus in maintaining relationships (Gaiardelli et al., 2007). Creating a
good relationship is to generate value for both ends: seller and buyer (Cannon & Perreault,
1999; Palmatier et al., 2006). A crucial element in differentiating a company’s offer and
excelling in meeting customers’ needs is by providing services (Anderson & Narus, 1995).
Services can influence the costs and profits for both buyer and seller, and can positively affect
how customers do business with their suppliers (ibid). Moreover, after-sales service is
considered as a tool for enhancing a valuable advantage for the customer as well as it is a
business opportunity for the company (Saccani et al., 2007).
After-sales service is commonly acknowledged as a potential source of revenue, profit and
competitive advantage in most manufacturing industries (Bundschuh & Dezvane, 2003;
Gaiardelli et al., 2007). Research has shown that after-sales in automotive industries
contribute to more than three times bigger turnover than the original purchase of a product
(Wise & Baumgartner, 1999). Within the automotive industry, there are significant heavy
equipment machinery manufacturing companies in Sweden which are considerable
contributors to the Swedish export as well as national sales (Statistics Sweden1, 2013).
Three major activities, critical to after-sales’ success in the manufacturing industry, have been
identified according to Saccani et al. (2007); these are: field technical assistance, spare parts
distribution and customer care. It is necessary to align all three main activities with the aim of
having a successful and comprehensive after-sales offer (Saccani et al., 2007).

2
1.2 PROBLEM DISCUSSION
Various business researches have highlighted the importance of integrating services into the
core offerings in manufacturing industries, especially in the automotive industry (Gadiesh &
Gilbert, 1998; Oliva & Kallenberg, 2003). Although, after-sales strategy is sometimes a
necessary evil – a time and cost consuming strategy, it is yet a way of staying competitive and
a prospect to expand business (Lele, 1997). Ehinlanwo and Zairi (1996) indicated that
organizations are dedicating more and more recourses to after-sales and large number of firms
have after-sales department with employees focusing only on providing after-sales services
and developing after-sales offers. Furthermore, Levitt (1983) described the link of after-sales
services to customer relationship marketing.
Relationship marketing is an old idea but yet a relevant and developing concept (Berry, 1995).
A later focus of this concept is shifting towards a service marketing practice and academic
research with the emphasis on quality (ibid). Furthermore, Berry (1995) states that marketing
initially was to focus on how to acquire customers, and little attention was paid on how to
market to existing customers to secure the relationship. Perspectives of relationship marketing
can be described as targeting profitable customers using strongest possible strategies for
customer bonding, and building trust as a marketing tool (Berry, 1995). There are various
activities which are dedicated towards enhancing relationship with customers (Pendapudi &
Berry, 1997) and after-sales service lengthens interactions with customers and provides basis
for influencing and developing the relationship (Brax, 2005). In addition, the size of a
company can be considered as a useful and manageable approximation of a company’s
operation and resources (Bonaccorsi, 1992). However, it is still debatable to what extent and
to which functions it could impact (Orlitzky, 2001; Pagano & Schivardi, 2003; Garcia-
Quevedo et al., 2013).
Studies about after-sales services have proven the importance of having a strategic after-sales
framework (Lele, 1997; Gaiardelli et al., 2007; Zackariasson & Wilson, 2004); however, there
exists the research gap on intensive after-sales study within a specific industry (Gaiardelli et
al., 2007). Although, the automotive industry has been researched before, not all of its areas
were investigated (ibid). Moreover, limited studies refer to the after-sales services of
automotive products. Presently there is no study made for the Swedish heavy equipment
machinery industry, although it belongs to one of the three main exporting areas of Sweden
(Statistics Sweden2, 2013). Thus, it would be theoretically as well as empirically interesting to
investigate whether and how after-sales service activities differ depending on the size of the

3
company and further on affect the relationship with customers. Such investigation could
deepen knowledge regarding academic researches linking after-sales services with customer
relationship marketing as well as the after-sales activities in different automotive industries.
Practically, after-sales service providers could be aware of the balance among the main after-
sales activities and employ the services with regards to customer relationship.
To gain deeper understanding of the elaborated problem, the purpose of this thesis is to:
Investigate the major activities of after-sales service focusing on customer relationship among
three classified sizes of after-sales service providers.
1.3 DELIMITATIONS
Three activities of after-sales services claimed by Saccani et al. (2007) are focused in this
study, as they have presented a solid basis for after-sales features. It was also considered to be
more structured and understandable to focus on specific activities of after-sales when
investigating the subject; hence, the above mentioned activities by Saccani et al. (2007) were
chosen.
Although Saccani et al. (2007) refer to the three main activities as drivers; the authors of this
study has deliberately chosen to use the term activities. Observing the established meaning of
the term provided by multiple researches, “after-sales services for manufactured goods
encompass the set of activities taking place after the purchase of the product, devoted to
supporting customers in the usage and disposal of goods” (Saccani et al., 2007, p.54). The
authors deduce that the three drivers; namely field technical assistance, spare parts
distribution and customer care, are sets of activities devoted to support customers after the
purchase.
The research is done in a single industry namely, heavy equipment machinery industry, in
order to make consistent comparison. The industry was chosen due to its importance to the
Swedish national sales and exports, the automotive industry together with the wood and metal
industry, contributes to the main export products for Sweden (Statistics Sweden2, 2013). The
industry was also chosen as a consequence of the scarce research done in the industry from
service perspective. Thus, the authors aimed to contribute with the result of this research. The
investigated companies are Sweden-headquartered, with facilities in Sweden and have the
Swedish market as one of its operating markets; thus, it is a study of a Swedish industry.

4
When researching relationship, only the seller was investigated on its opinion about after-
sales and its impact on customer relationship. The buyers’ side was not researched in this
thesis due to time and resource limit. Furthermore, since the research takes a company side
perspective, the term customer relationship marketing is commonly used to separate the actual
customer relationship and the desired customer relationship in result of providing after-sales
services.
1.4 OUTLINE OF THE THESIS
The chapters of this thesis are structured as described below:
Chapter 1. The first chapter discusses the importance of after-sales services and the three
main activities within after-sales services. It describes a research gap that has led to
the purpose of this thesis followed by delimitations.
Chapter 2. The second chapter further discusses the three main activities in detail and
gives a more detailed and broad overview over after-sales services as well as its link
with customer relationship. This chapter ends with discussion of the detailed
theoretical research gap.
Chapter 3. This chapter presents the proposed research model framing this study and
research questions answered as a result of the empirical investigation.
Chapter 4. The research purpose, approach and method are presented and explained along
with analysis method and quality criteria.
Chapter 5. The empirical data gathered from research are presented in this chapter.
Chapter 6. This chapter presents the analysis of the gathered data in relation to previous
academic researches.
Chapter 7. The last chapter concludes the research and discusses contributions on
theoretical and managerial levels as well as the limitations of the study. Suggestions
for future research conclude the thesis.

5
2. LITERATURE REVIEW
This chapter presents existing academic literature on the chosen subject. It provides
definition and elaboration on the main concepts of customer relationship, services and
relationship, after-sales services, after-sales activities and size of firm in business-to-business
environment. Finally, the identified research gap is explained in detail.
2.1 RELATIONSHIP AFTER THE SALE
Relationships between buyers and sellers can be seen as the one between husbands and wives
(Levitt, 1983; Dwyer et al., 1987; Morgan & Hunt, 1994; Wilson, 1995; Zineldin, 2002;
Celuch et al., 2006; Kandampully, 2010). The relationship linking a buyer and a seller seldom
ends after a purchase transaction; the outline of the relationship affects the decision of the
buyer on the next round of purchase (Levitt, 1983). This can typically be connected with the
dynamics of services and products dealt in a transaction between the buyer and the seller
(ibid). Due to the growing complexity of products, companies must offer greater assurances
(Ettorre, 1994). With greater assurance the buyer decides to not only buy an item (to have a
casual affair), but is intending to buy an augmented product where the product represents a
bundle of values that satisfies the buyer, and the buyer intend to enter a bonded relationship
(to get married) (Levitt, 1983). The success of returning customers is inevitably dependent on
creating relationships (Gutek et al., 2002); thus, the selling company needs to understand and
plan a strategy to manage the ‘partner’ prior to the “wedding” (Levitt, 1983).
2.2 RELATIONSHIP AND CUST OMER SERVICES
An essential strategy for success and survival in competitive business environment are quality
assurance and extended service programs; these attempts are driving the customer’s
perception of a company’s products in the right direction (Takeuchi & Quelch, 1983;
Reichheld & Sasser 1990; Zeithaml et al., 1990). For a company to offer customer service is,
according to Asugman et al. (1997), a means for tailoring a company’s offerings to the needs
and desires of its customers. By offering good service, it shows the customers that the
company stands behind and supports the quality of the offered products (Asugman et al.,
1997).

6
To ensure the advertising claims, companies must build quality into their products (Takeuchi
& Quelch, 1983). This means that the company should be aware that product performance and
customer service are closely linked (ibid). Additionally, customer service can act as an early
warning system to detect product quality problems (Gaiardelli et al., 2007). The quality of the
customer service cannot make significant difference if the product itself has disappointing
quality; whereas, poor customer service can quickly contradict the advantages associated with
a product offer of superior quality. Responsibility for quality cannot rest entirely with the
production division; marketers must also be an active part of contributing to perception of
quality. Successful businesses use marketing techniques to plan, design, and implement
quality strategies that stretch beyond the factory floor (ibid). Good customer service is crucial
when aiming to guarantee the assurance of quality in the offered products (Cohen & Lee,
1990). Service quality has relevance in both transactional and relational nature (Crosby et al.,
1990); it can be regarded as necessary condition for relationship quality, although not entirely
sufficient (Crosby, 1989).
Rust and Zahorik (1993) have, among others, identified a chain of impacts regarding services.
Service quality impacts on satisfaction, satisfaction on customer retention (customer loyalty),
and customer retention has impact on profitability (Rust & Zahorik, 1993). Storbacka et al.
(1994) have investigated this chain of impacts from the firm’s point of view in relation to the
economical outcome of a customer relationship through service quality improvements. With
the focus on profit, the research concludes that service management and its concept of
perceived service quality are tied together with relationship marketing. Successful relationship
marketing depends on a large degree on the competency of firms to add value by various
types of services on top of the core solutions offered to customers and clients. It is essential to
have thorough understanding of service management before a relationship marketing strategy
can successfully be implemented (Storbacka et al., 1994).
2.3 RELATIONSHIP STRATEGIES
Previous studies have identified changes in the competitive environment as the basis for the
adoption of relationship marketing (Beverland & Lindgreen, 2004). Customer retention is
estimated to be five times less costly than gaining new customers (Rosenberg & Czepiel,
1984; Kandampully & Duddy, 1999). Hence, relationship marketers encourage firms to create
long-term relationships as well as mutually beneficial, interactive, and interdependent
relationships with key stakeholders (Christopher et al., 2002). Relationship strategy is a

7
means of improving performance metrics comprising of customer satisfaction, retention and
loyalty (Christopher et al., 2000).
Quality relationship with customers should be maintained to achieve superior value for the
customers (Grönroos, 2000). Managing a relationship with quality is essential to reach
corporate success (Zinkhan, 2002). Yang & Peterson (2004) claims that maintaining customer
relationship through a long-term perspective results in satisfied and loyal customers, which
thus, develops a firm’s financial and competitive position in its markets.
Through relationship marketing, customers are offered with individualized services,
customized goods and other benefits (Berry, 1999, 2000; Gwinner et al., 1998). One study
shows that the foundations of relationship marketing lie in the combination of trust
(satisfaction) and commitment (loyalty) (Alvarez et al., 2011). These concepts can be
identified in factors such as dependence between the parties, satisfaction, complaint
management, communication, or investment in specific assets (Brashear et al., 2003).
Moreover, reliability of the service providers is crucial for the customers to feel confident and
build trust (Parasuraman et al., 1985). It enhances the customers’ loyalty, and firms build a
secure customer portfolio that decreases the risk of ending ongoing relationships (ibid).
Within marketing customer satisfaction has always been one of the most interesting areas
(Rust & Zahorik, 1993). Studies have shown a direct relationship concerning customer
satisfaction and loyalty to a provider (ibid).
Colgate and Danaher (2000) conducted a research with the aim of examining the result of
implementing relationship strategies and identify the effect it would have on the customer
satisfaction and loyalty. The research showed that a relationship strategy implementation
affects the factors positively and negatively. If the relationship strategy program is successful
it increases the satisfaction and loyalty, however, an unsuccessful relationship strategy
program causes the satisfaction and loyalty to become even lower than those who do not use
these kinds of strategy programs. Furthermore, a firm’s resources should be considered before
implementing such program that can either harm or improve satisfaction and loyalty of the
customers (ibid).
2.3.1 GOO D R ELATION SHI P
The importance of having relationship with customers is a topic that is relatively
unquestioned (Sweeney & Webb, 2002). Having good relationships is not just a dominant
trend but it results in significant benefits for both parties in the business-to-business

8
environment (Gummesson, 1998, 2002; Walter et al., 2001). According to Kelly and Scott
(2012) the benefits generated by relationship marketing to business-to-business companies are
cost benefits such as improved systems and procedures, service benefits such as enhanced
service delivery, image benefits such as superior brand name and reputation and flexibility
benefits such as enhanced responsiveness to customers and competitors (Kelly & Scott,
2012). Building relationship is a critical process in which firms aim to take advantage of the
potential benefits (ibid). However, their efforts can also impact negatively and result in bad or
no relationship (Colgate & Danaher, 2000).
2.3.2 BAD R ELATIO NS HIP
There exist bonds which tie customers to a company in negative sense (Bendapudi & Berry,
1997; Liljander & Strandvik, 1995). This does not immediately stop the interactions between
the seller and buyer in case of buyers with low affective commitment ‘locked in’ by factors
such as warranty insurance (Liljander & Roos, 2002; Bendapudi & Berry, 1997; Sheaves &
Bernes, 1996; Liljander & Strandvik, 1995). However, negative experiences cause negative
word-of-mouth and damage customers’ commitment to the buyer and further on, the
relationship between the parties (Liljander & Roos, 2002). Negative incidents such as badly
handled complaints, inadequate communication with customers may lead to lack of trust
which again impacts the relationship (Bejou & Palmer, 1998).
2.4 AFTER-SALES IN BUSINESS-TO-BUSINESS ENVIRONMENT
Saccani et al. (2007, p. 54) define after-sales services in business-to-business manufacturing
industries as a “set of activities taking place after the purchase of the product devoted to
supporting customers in the usage and disposal of goods”. This definition is built on a number
of previous definitions formulated by Cohen and Lee (1990), Ehinlanwo and Zairi (1996),
Loomba (1996), Asugman et al. (1997), Boyt and Harvey (1997), Patelli et al. (2004),
Cavalieri et al. (2007) and Johansson and Olhager (2004). After-sales service is often referred
to as an intangible product component (Asugman et al., 1997). It is distinct as those activities
in which a firm engages after the transaction of its product that minimize potential problems
related to product use, and maximizes the value of the consumption experience (ibid).
Companies aim to provide product offers comprising after-sales as it adds up and enhances
the product value (Levitt, 1983).
Industrial after-sales service is the combination of goods and services since it includes both
tangibles such as spare parts as well as consumables related with customer care and assistance

9
(Johansson, 2006). In business-to-business manufacturing industry, it is difficult to draw the
line between manufacturing and service (Schmenner, 1995). It is even claimed that
manufacturing industries have turned into service focused industries (Bryson & Daniels,
2007). This can be related to the advantages provided by added services to the manufacturers
as well as the industrial customers’ demand for service and customer-specific packages
(Davies, 2003). Thus, bundling the often tangible core offering with services has become a
crucial interest of manufacturers, along with the benefits of facilitating sales of goods,
creating growth opportunities, balancing cash-flows, differentiation of competitors and
lengthening customer relationships (Brax, 2005).
2.5 ACTIVITIES IN AFTER-SALES SERVICE
According to Levitt (1983), the sale of a product is only the beginning of a seller-buyer
relationship where the long-term bond between the two parties is the key for long-term
profitability enhancing the fact that after-sales services are crucial in a company to stay
competitive and to collect profits. There are several classifications of activities within after-
sales services; to mention few: customer support, product support, technical support and
service (Goffin & New, 2001). After-sales has many times been classified as a business
network process, due to the fact that it has a direct impact on the overall business performance
and the competitive advantage (Earl & Kahn, 1994). The activities within a business can be
provided through alternative channels and actors, or through multiple channels and actors
concurrent. The services could be complementary, like field assistance and customer care, or
they could be competing services, such as field assistance provided through repair centers or
by authorized assistance networks. Internet has also provided at after-sales service channel
which has made it possible for companies to have more touch points with its customer,
therefore made it easier to perform the activity of customer care (ibid). According to Saccani,
et al. (2007), after-sales could be seen as a business, consisting of multiple activities. Further
on, there are three major activities critical to after-sales’ success, these are: field technical
assistance, spare parts distribution and customer care (Saccani et al., 2007).
2.5.1 CUS TO MER CARE
Customer care is usually described as an activity which provides technical and commercial
information and services; typically, warranty extension and complaint management to
customers (Saccani et al., 2007). There are different types of customer care and it is
distributed on different levels; it can be distributed through a national centralized call center,

10
through the manufacturer’s website and through the local repair centers that provide technical
information to customers. There are also differences in the variety of personalization when
offering the service (ibid). The customer care activity has shifted from being primarily
providing simple tasks, such as providing information and handling orders, to now, being
more complex and handling tasks such as giving advice in financial affairs or strengthening
and managing the relationship with key accounts (Kantsperger & Kunz, 2005). This has led to
understanding the importance in customer care as an operative tool towards a strategic role in
terms of customer relationship (ibid).
Most of the organizations are aware that it is the customers’ opinion that matters and that the
high competition among organizations have enhanced the focus on customer (Kahn, 1995).
Products are today developed in a high speed and their product life cycle has shortened. This
has led to that companies have to improve themselves continuously to survive aggressive
markets. Especially, automotive and kitchen appliances industries are industries known for
their high technical quality. These industries cannot compete with their technical quality only
since all products in those industries are relatively equally advanced and technological.
Instead the companies have to compete with their functional service quality, which comprises
their service provision characteristics such as friendliness, availability and trustworthiness
(ibid).
2.5.2 F IELD TECHNI CAL ASSI ST AN CE
Field technical assistance is the assistance provided from seller to buyer where the buyer can
receive encompassing installation, warranty work as well as out-of-warranty repairs, product
disposal and check-ups (Saccani, et al., 2007). Bryce and Useem (1998) have identified a
rapid growth in outsourcing and the main reason for it was to be able to stay profitable and
survive in the market; companies had to outsource to stay competitive. From 1990’s and
onwards, outsourcing has been popular, and especially regarding the activity of field technical
assistance (Russell, 2008). The reason behind this is due to the fact that continuously carrying
out this activity is very costly and time consuming (ibid). Armistead and Clark (1991) also
suggest that outsourcing is mostly favored by firms which need to serve large and
geographically dispersed service volumes.
Business-to-business customers expect a high level of availability from the sellers’ side due to
possible technical issues that can cause serious difficulties for the customers (Russell, 2008).

11
This is partly provided by warranties offered to the customers from the manufacturers’ side
(Chien, 2007). The main purpose of warranty is to provide an after sale remedy for customer
when a product fails to meet its intended achievement during the warranty period (ibid).
Warranty has also been defined as a contractual obligation made by a manufacturer, in
connection with the sale of a product, where the manufacturer is obligated to ensure orderly
functioning of the product (Blischke & Murthy, 1992). Warranties are known for being very
costly for manufacturers; the warranty programs must be estimated precisely in order to
provide warranty for the customer in the long run (Chien, 2007). Hence, to be able to provide
warranty work manufacturers must calculate if they can afford it for those years they are
required to provide their customers with warranty work (ibid).
2.5.3 SPAR E P ART S DI S TRI BUT IO N
Spare parts distribution is responsible for inventory management, customer order management
and delivery of spare parts (Saccani et al., 2007). Important to know is that spare parts are not
intermediate or final products to be sold to a customer (Kennedy et al., 2002). Spare parts
distribution provides crucial functions for the customers throughout consumption of the
product (Gopalakrishnan & Banerji, 2004). The provider usually aims to reach a particular
turnover ratio and at the same time meet the demand of many customers with different and
large number of spare parts. The management has to decide on what kind of level they want to
distribute their spare parts, central warehouse, stockiest, regional warehouses, field
warehouses, retail outlets and dealers. It is said that pricing spare parts is one of the most
complex problems when it comes to industrial goods. The main purpose with spare parts
distribution is to ensure the right availability of spare parts at the right time for the buyer’s
needs, meanwhile with lowest possible investments from the sellers’ side. The purpose is also
the reach maximum level of satisfaction; this can be accomplished by stable and steady spare
parts distribution (ibid).
An additional purpose for holding spare parts inventory is to provide timely repairs to
customers’ equipment (Hopp et al., 1999). Furthermore, spare parts inventory are held as
protection against extended equipment down-time (Kennedy et al., 2002). Obsolescence can
be a problem as the machines for which the spare parts were designed for become obsolete or
replaced. It is difficult to determine how many units of a spare part for an obsolescent
machine to stock, and it may be difficult to replace a part that is not in stock any longer. There
are also consequences of unplanned repairs, these consequences are production loss with
significant costs, it is suggested that a kind of safety stock policy is crucial (ibid). The

12
automobile manufacturer is an industry where delivering spare parts quickly is a key aspect of
their after-sales services (Cohen & Lee, 1990).
2.6 MANUFACTURING INDUSTRY AND FIRM SIZE
Modern markets have become increasingly complex, dynamic and hostile, and are constantly
changing (Neu & Brown, 2005). The manufacturing industry is described through its intense
global competition, rapid technology changes and product variety proliferation (Pun, 2004).
Machinery and equipment manufacturing companies are facing increasingly intense and
aggressive market competition confronting them with new and demanding challenges (Belz et
al., 1997). Thus, manufacturers in those industries commonly aim to extend service business
in order to generate additional revenue and profit (Gebauer et al., 2005). However, firms
employ different approaches towards offering additional services to customers and some fail
to meet the intended objectives (Gebauer et al., 2005). As shown on Figure 1, based on the
empirical study of Gebauer et al. (2005) 11.1% of the investigated manufacturing companies
have earned more than 40% of their total revenue through services. While, 38.7% of
manufacturing companies have generated less than 10%; indicating the differences in service
offers of manufacturers (ibid).
FIGURE 1: SERVICE REVENUE IN MANUFACTURING COMPANIES
(GEBAUER ET AL., 2005)
In business-to-business environment, having lead in resources can yield a considerable
advantage in the marketplace (Day & Wensley 1988; Hunt & Morgan 1995, 1996). However,
this advantage does not necessarily result in competitive advantage; the resources must be
combined with other resources to create core capabilities and superior relative value (Prahalad

13
& Hamel, 1990). Since services are the co-created value by both the company and the
customer (Matthyssens et al., 2006; Vargo & Lusch, 2008), it results in resources that are
unique and hard to imitate (Wernerfelt, 1984). Thus, services can be considered as a
sustainable source of competitive advantage (Heskett et al., 1997).
The internal functions of a company and its response to the marketplace are immensely
impacted by the size of the company (Kimberly, 1976). The nature of small to large
manufacturers can vary in relation to their investments into new technologies and equipment,
providing world-class skills, training of workforce and innovation (Laforet & Tann, 2006;
Laforet, 2009). Although, large firms benefit from more easily absorbed risks, corporate
resources and systems (White et al., 1988; Crawford, 1993), smaller firms have the possibility
to gain from more spontaneous and individualistic company environment i.e. behavioral
advantage (White et al., 1988; Nooteboom, 1993). Small sized companies often suffer from
the disadvantage in respect to costs in scale, scope, experience and learning (Nooteboom,
1993). Different size manufacturers also respond differently to challenges regarding
developing and marketing services (de Brentani, 1995).
2.7 NEED FOR FURTHER INVESTIGATION
First of all, after-sales service is an important feature in business-to-business industries
offering potential benefits such as facilitating sales of goods, creating growth opportunities,
balancing cash flows, differentiation, and meeting customer demand (Brax, 2005; Davies,
2003). The literature review on after-sales stated that there is a research gap identified in the
area of investigating the three major activities in after-sales which are customer care, spare
parts distribution and field technical assistance (Saccani et al., 2007). Sacanni et al. (2007)
suggested in its research that more empirical investigation should be conducted with these
three activities in mind.
Due to the complexity of industrial products the interaction between buyer and seller is
seldom ended at the sale transaction (Levitt, 1983). After-sales service provides the chance for
a relationship between buyer and seller to last longer after the sale is over (ibid). Further
research should relate after-sales and customer relationship marketing more in detail. As the
literature review indicated, very few researches have intensively researched this topic. Even
though, there are numerous investigations within the area of relationship, little focused on the
impact after-sales services have on relationships; thus, pinpointing the need for filling this
knowledge gap.

14
Another factor that is crucial to further investigate is the differentiation that comes along with
company sizes. Since researches confirm that different sizes of companies operate
distinctively (Laforet, 2009; Kimberly, 1976; de Brentani, 1995), they may provide different
after-sales services. However, there have been limited researches focusing on the effect size
of firm might have upon after-sales service offers (ibid).
Scarce empirical investigation was found within the area of business-to-business industry of
heavy equipment machinery when conducting this literature review, although the industry is a
significant industry contributing to the overall economy in Sweden (Statistics Sweden1,
2013). Seemingly, no extensive research has been performed within this area with regards to
after-sales yet. Therefore, it indicates the meaning to investigate this industry.
Throughout this literature review chapter, a deeper and more extensive understanding about
after-sales, after-sales activities and customer relationship is provided. From the literature
review, it can be derived that there is a research gap prevailed in the area of the three major
activities in after-sales and further on its effect on relationship marketing of manufacturers.
Moreover, the industry studied, namely Swedish heavy equipment machinery industry, adds a
fresh aspect to the concept along with comparison among different firm sizes.
The research gap is visual on table 1 which presents major previous studies that have
investigated the main concepts of this thesis.

15
TABLE 1: LITERATURE REVIEW OVERVIEW
Articles Factors
Cu
stom
er
care
Fie
ld
tech
nic
al
assi
stan
ce
Sp
are
par
ts
dis
trib
uti
on
Aft
er-s
ales
serv
ice
Ser
vic
es
Cu
stom
er
rela
tio
nsh
ip
mar
ket
ing
Fir
m s
izes
Saccani et al. (2007)
Levitt (1983)
Takeuchi and Quelch
(1983)
Asugman et al. (1997)
Grönroos (2000)
Gummesson (1998)
Johansson (2006)
de Brentani (1995)
White et al. (1988)
Liljander and Roos
(2002)
Kimberly (1976)
Kantsperger and Kunz
(2005)
Armistead and Clark
(1991)
Bryce and Useem (1998)
Gopalakrishnan and
Banerji (2004)
Storbacka et al. (1994)

16
3. RESEARCH MODEL AND RESEARCH QUESTIONS
As the previous chapter showed the need for further investigation; this chapter presents the
proposed research model and research questions as a basis to fill the research gap and fulfill
the purpose of this thesis.
3.1 PROPOSED RESEARCH MODEL
The purpose of this thesis is to gain deeper understanding of the major activities of after-sales
service focusing on customer relationship among after-sales providers with different sizes.
The major activities as well as the focus of customer relationship were reviewed in the
previous chapter.
A research model is developed for this thesis which can be found on Figure 2. The research
model shows the major activities of after-sales according to the literature which are customer
care providing technical and commercial information and services such as complaint
management and warranty extension; field technical assistance responsible for installation,
check-ups, warranty work, out-of-warranty repairs and product disposal; spare parts
distribution comprising inventory management and delivery of spare parts. Furthermore,
while the major activities contribute to successful and comprehensive after-sales, after-sales
services are affecting the customer relationship of the organization.
FIGURE 2: PROPOSED RESEARCH MODEL

17
3.2 RESEARCH QUESTIONS
Derived from the purpose of this thesis and literature review of previous academic studies, the
proposed research model combines the concept of major after-sales activities and customer
relationship. Research question for each activity of the model has been formulated with the
objective of organizations’ size and industry in consideration.
The first three research questions are derived from the need to further investigate the after-
sales services activities in the Swedish heavy equipment machinery industry. The three after-
sales service activities: customer care, field technical assistance and spare parts distribution
are the main building blocks of after-sales service. An investigation will be executed by
taking these three activities where they will be put in the context of Swedish heavy equipment
machinery industry. The activities will be compared and analyzed among different sizes of
organizations to get a better understanding of how this industry executes its after-sales
services.
The fourth research question is derived from the need to investigate how after-sales services
contribute to customer relationship marketing. Today, limited studies have been conducted
with after-sales service and customer relationship in mind; this makes it even more significant
to study. Furthermore, if there are differences in how the different sized organizations
executes their after-sales service activities it might be a difference in how their after-sales
service contribute to the overall customer relationship marketing.
RQ1. How is customer care executed in the Swedish heavy equipment machinery
industry among organizations of different sizes?
RQ2. How is field technical assistance executed in the Swedish heavy equipment
machinery industry among organizations of different sizes?
RQ3. How is spare parts distribution executed in the Swedish heavy equipment
machinery industry among organizations of different sizes?
RQ4. How do after-sales services contribute to customer relationship marketing in the
Swedish heavy equipment machinery industry among organizations of different sizes?

18
4. METHODOLOGY
In this chapter, introduction of available methodological approaches as well as justification
and choices for this study are presented. Discussion regarding inductive and deductive
research as well as the reason for selecting a qualitative approach is given; followed by
research design, research strategy, data collection and analysis method. The chapter
concludes with discussion of the quality criteria of the study.
4.1 RESEARCH APPROACH
4.1.1 INDUCTIV E V S . DEDUCTIV E R ES EAR CH
Research is made in order to answer a particular research question or hypothesis based on
theoretical considerations (Bryman & Bell, 2007). This is how it is commonly viewed, but
another alternative is to look at theory as something that derives after the data is collected.
This connection between theory and data collection is referred as being either deductive or
inductive. The deductive approach is the most common view of showing the relationship
between theory and data collection. The researcher collects data based on theoretical
considerations and deduces a hypothesis based on these considerations. The steps are easy to
follow where the first step is the theory, second step hypothesis, third step data collection,
fourth step findings, fifth step hypothesis confirmed or rejected and the sixth and final step is
the revision of theory (ibid). The inductive approach has an opposite direction compared to
the deductive, where the idea behind this approach is to form theories based on the data
collected (Dhawan, 2010).
This research takes a deductive approach, simply because the paper is based on previous
theories and has followed the above deductive approach steps. The research questions for this
research are derived from theories and previous research as presented in the literature review
chapter. Also, to be able to fill the existing research gap a deductive approach is in this case
the most suitable. Previous research has pointed out that more research has to be done within
the chosen area and especially within diverse industries (Saccani et al., 2007). The intention is
not to establish new theories; it is rather to explore the existing theories in new contexts.

19
4.1.2 QUALI TATIV E V S . QUAN TIT ATIV E R ESEAR CH
In order to carry out a research, an approach and a strategy has to be defined and decided.
Researches can choose from two different approaches; a qualitative approach or quantitative
approach (Bryman & Bell, 2007). These approaches are taken from two distinctive clusters of
research strategies, with other words a general orientation on how to conduct a business
research strategy. Quantitative research is a method used for doing measurements, mostly in
numbers. The most common approach is to use surveys and questionnaires or other statistical
methods. Qualitative research strategy focuses on words rather than the quantification in the
collection and analysis of data (ibid). The data collection is more in-depth and detailed,
leading to a more accurate and deeper understanding of behavior rather than an external
representation of intentions (Granot et al., 2012). The purpose of these two strategies is to
collect data suitable for the chosen case; however the strategies differ when it comes to how
to collect the data (Eriksson & Wiedersheim-Paul, 2011). A quantitative approach works with
numbers and statistics while qualitative studies works with terms. The purpose for a
quantitative research is to get defined characteristics whilst the purpose for qualitative is to
get a meaning. How the collected data is presented is different as well, quantitative will
present numerical data. The qualitative is more detailed, where citations and stories will be
featured in the research (ibid).
This research takes a qualitative approach, considering the aspects provided in the above
section. Due to the limited timeframe and the restricted accessibility to a vast range of
organizations within the heavy equipment machinery industry in Sweden, the choice of a
qualitative study was more suitable. The interest and outline of this study lays in achieving a
deeper knowledge based on the three main activities of after-sales, and how they would differ
depending of the size of the company. Using a quantitative approach would not yield the same
results. Furthermore, the study seeks to go in depth rather than to go in breadth in the topic.
Thus, in-depth interviews are used and the results are presented as a story rather than in
numerical forms. The idea is not to draw any general conclusion which makes the result of
eliminating quantitative approach even more significant.
4.2 RESEARCH DESIGN
Research design can be described as a plan for executing the research and answering the
research aim and objectives. It provides the structure to resolve the identified problem and
avoid situations where the evidence does not address the initial research problems (Yin,

20
2009). Ultimately, the research design should guide the researchers to collect, analyze and
interpret observations (Frankfort-Nachmias & Nachmias, 1992) with cohesion (Rowley,
2002). There are three forms of research design which are descriptive, exploratory and
explanatory research designs (Robson, 2002).
Exploratory research design is a fact finding research design where the major emphasis is on
clarifying the research problem and research direction. It is mostly carried out in the early
stages of major projects (Yin, 2009). In order for this design to be feasible, the research idea
should be flexible making it possible to observe all the aspects taking place (Phopalia, 2010).
Descriptive research design focuses on finding facts about a certain subject, answering who,
what, when, where and how questions. It is a popular design which is extensively employed in
modern researches (Yin, 2009). Descriptive research design is practical for collecting and
assessing opinions, behaviors and features of a population or for studying the state of affairs.
When applying this design, it is crucial to specifically define what is being measured and
what population is investigated (Dhawan, 2010).
Causal research design aims to discover causal relationships between various pre-determined
variables (Gray, 2009). Researchers need to study if and how one variable is dependent on, or
determinant of another variable (Eliasson, 2010)
This investigation involves a study of organizations after-sales offers and its contribution to
customer relationship. Thus, it mainly focuses on observing and analyzing the organizational
activities, behavior and intentions. It cannot be seen as exploratory since the subject has been
studied before and there is a clear defined problem, as described in the previous chapters.
Causal research design has to be excluded as well due to the reasoning that neither after-sales
nor customer relationship is dependent on each other. There might be a connection but they
are not interdependent variables. Hence, descriptive research design is the most appropriate
form of study for this research.
4.3 DATA SOURCES
The sources used in a research can be obtained out of primary or secondary method. Primary
sources are the data and information that are collected for the purpose of solving a problem; it
is generated by tailor made questions seeking answers for specific information collection.
Primary data collects specific and up-to-date information; however, it is costly and often
inaccessible (Cowton, 1998). On the contrary, secondary sources are the existing data and

21
information that has been collected for another purpose than solving the problem at hand
(Stewart, 1984; Frankfort-Nachmias & Nachmias, 1992). Secondary data contributes to
increased credibility of research finding that take a primary data source method (Frankfort-
Nachmias & Nachmias, 1992), give alternatives for primary research methods and could
possibly solve research problems (Bryman & Bell, 2007). It is also cost efficient as well as
has high availability (Cowton, 1998). Cowton (1998) suggests that secondary and primary
data are not substitutes for one another. The two research data source methods function as
complements to cover inadequacies of the provided data, either in primary or secondary
sources (Stewart, 1984).
Because of the qualitative approach the aim is to gain a deep understanding of the subject, the
deficiency of earlier studies addressing after-sales as having a relation or effect on customer
relationship, primary data is the most applicable method used for collecting and analyzing the
research problem. As secondary sources are already collected for another purpose than
solving the specific problem at hand, the ability to gain a deep understanding to the subject is
restricted and therefore another indication that primary data method is the reasonable way to
approach the result.
4.4 RESEARCH STRATEGY
Research strategies represent the different ways of collecting and analyzing empirical data.
Deciding on the most advantageous and appropriate method is a critical part of doing research
(Yin, 2009). According to Yin (2009), the available methods for researchers are experiment,
survey, archival analysis, history and case study. Depending on three conditions, the proper
method can be evaluated and chosen correctly regarding a certain research (Yin, 2009). Table
2 illustrates the research strategies and the three conditions namely, 1) Form of research
question 2) Require control of behavioral events 3) Focus on contemporary events (ibid).

22
TABLE 2: RESEARCH STRATEGIES
(YIN, 2009)
METHOD Form of research question Control of behavioral
events?
Contemporary
events?
Experiment How, why? Yes Yes
Survey Who, what, where, how
many, how much? No Yes
Archival analysis Who, what, where, how
many, how much? No Yes/no
History How, why? No No
Case study How, why? No Yes
This study’s research questions are formulated as ‘how’ questions; thus, limiting it to
experiment, history and case study. The researchers do not have control over the behavioral
events which further excludes experiment research method. The focus of the research is on
contemporary events occurring at manufacturing organizations in terms of after-sales and
customer relationship. This factor eliminates history; hence, the most appropriate research
method for this thesis is case study.
Case study is defined as “research based on the study of a limited number of naturally
occurring settings” (Silverman, 2010, p. 432). It simply involves choosing one or more cases
and developing as full an understanding of that case as possible (Punch, 1998). Depending on
the research area and subject, a ‘case’ can be various occasions (Silverman, 2010). In business
studies, certain phenomena are highly complex, hard to quantify and, in many situations,
impossible to observe from the outside. Thus, case studies are considered the most suitable
method in various situations (Ghauri & Grønhaug, 2005), including the circumstances of this
research.

23
Case studies can be either a single case study or a multiple case study. A single case study is
akin to a single investigation and a multiple case study intensively focuses on a number of
cases (Yin, 2009). In case of single case study, the chosen case should be exceptional in
relation to established theory, or for any reason extremely unique and can reveal some special
notions. A multiple case study is preferred based on the aim of resulting in robust research
outcomes (Rowney, 2002; Silverman, 2010). Thus, the authors aim for conducting a multiple
case study. The cases should be selected with the prospect that they produce similar results
(literal replication) or produce contrasting results on predictable reasons (theoretical
replication) (ibid). This study can result in both literal replication in terms of the after-sales
service activities and theoretical replication regarding the manufacturer size.
4.5 DATA COLLECTION METHOD
There are several methods applicable to collect primary data sources, among these; the most
common ones are focus groups, in-depth interviews and surveys (Bryman & Bell, 2007).
There are distinctions of the various methods in suitability depending on the research
approach (Davies, 2007). Focus groups and in-depth interviews are suitable when working
towards a qualitative approach and surveys are more applicable for structured and quantitative
data collection approach (ibid). Since the approach of this thesis is a qualitative approach,
survey is out ruled and focus groups and in-depth interviews are further discussed.
According to Silverman (2010), a focus group is an interview method which is conducted
in the form of a group, basing on stimuli provided by the researcher(s). The participants
are being observed and recorded when they have been asked a set of questions within a
specific topic and the participants discuss the matter of concentration (Bryman & Bell,
2007). The selection of participants for a focus group can vary. One way is to select
people that are unknown to each other for the sake of avoiding contaminating the session
by pre-existing styles of interaction or status differences. Another way is to select a
natural grouping where the group of participants comes from the same organization, such
as co-workers and students (ibid).
Interviews are very likely to be the most commonly employed method in qualitative
research (Bryman & Bell, 2007), as well as the most important source of case study
information (Yin, 2009). The flexibility of an interview is what makes it so attractive
(Bryman & Bell, 2007). With such characteristics the respondent can show the direction to
take according to the interviewee’s responses and could possibly adjust the emphases in

24
the research which could give a result with significant issues that emerge in the course of
the interview (Davies, 2007).
As in any research situation, the problem is the prescription of selection to which
methodology to adopt (Granot et al., 2012). Due to the purpose, problem, and structure of the
current thesis, a qualitative approach is necessary where a deep understanding of the subject is
sought. Qualitative data generates more value in identifying underlying causes as well as it
provides better understanding of processes (Granot et al., 2012), which is the aim pursued in
this study. Furthermore, in-depth interviews are referred to as a methodology which gives
pathways to provoke information related to the needs and motivations of the interviewee.
Hence, performing in-depth interviews will give extensive information on a company’s
motivations, underlying causes and their current processes (Granot et al., 2012). Due to low
accessibility to companies and managers, as their time is strictly limited and valuable, the
research will be conducted using in-depth interviews with consideration to a time frame.
According to Schuman (1982), the length of an interview should be determined before the
interview begins. A recommended time is 90 since the interviewee need to put experiences
and their motivations in context, anything more or less can be considered inconvenient for the
interviewee, but depending on the interest and insights from the interviewee, the time can be
extended (ibid). Controlling the interview session is appreciated to limit the time when
interviewers need to move on to the next interview or when the immense amount of material
has to be analyzed (Granot et al., 2012).
Due to the structure of the research problem at hand, an investigation of three companies in
three sizes from the same industry, selling the same kind of products on the same markets,
were needed to meet the objective of this study. Furthermore, the study investigates
companies that operate in the same area in terms of product and markets; thus, they could be
considered as competitors. A focus group, where managers from competing companies join
together to discuss detailed company issues, is may not be the best method to get the
managers to share information about the processes and practical aspect of the company.
Managers might not be willing to share information with competitors in order to protect the
company from the other players in the market. In-depth interviews are more suitable as the
companies, i.e. representatives or managers of the company can be kept anonymous,
compared to focus groups. In addition, the flexibility of in-depth interviews is of advantage
since interviewees can repeat or further explain their answers, in case technical concepts that
are not fully known to the authors are brought up. This kind of interference is less appropriate
25
during a focus group where intense discussion is going on between two highly knowledgeable
managers. Therefore, the most suitable data collection method chosen is in-depth interviews.
4.6 DATA COLLECTION INSTRUMENT
4.6.1 OPER ATION ALI ZATION AN D MEAS UREMENT O F V AR I ABLES
Operationalization is a critical part of research in economics and other social sciences
(Machlup, 1978; May, 2011). It can be defined as the process of translating a theoretical
construct into measurable and observable variables by identifying empirical indicators for the
concept (Hox, 1997; Bell, 2010; Dyson & Brown, 2005; Saunders et al., 2009). In other
words, operationalization links a mental notion to quantifiable measures in real world
(Melcher, 2012). Thus, operationalization involves assembling a list of characteristics
representing the studied concept (Mouton & Marais, 1990; Adler & Clark, 2010). The list of
characteristics can vary for each research, even though they may operationalize the same
concept. This is related with the different natures of researches and complexity and multi-
facets of scientific concepts (Mouton & Marais, 1990).
Operationalization requires the researchers to exactly specify what concepts mean and how
they will be measured, in order to conduct a rigorous study (Johnson & Buberley, 2003).
Babbie (2009) highlights that, the measurements in the survey or interview guide should be
formulated as accurate and precise as possible. However, these two qualities do not come
hand in hand; a measurement can be very precise but not accurate (Babbie, 2009). Thus, it
leads to another significant issue to consider namely, relevance. Relevance relates to ensuring
that the developed questions measure what it is intended to measure (Eliasson, 2010). At the
same time, the questions should be comprehensive enough to cover the research questions
entirely (ibid). These requirements were considered and followed throughout the
operationalization process of this research.
Based on the literature review elaborated in chapter 2, the proposed research model was
developed comprising the most critical theoretical concepts in this study (see Figure 2). The
research questions of this study covered each activity of the model. Therefore, the proposed
research model served as the basis for the operationalization scheme, making certain that the
interview questions were relevant and comprehensive to the study’s focus.
To ensure accurate and precise operationalization measures, the concepts were theoretically
and operationally defined and the operational measures were derived from previous academic

26
researches. The measures or questions were worded in simple and understandable form;
simultaneously, not underestimating the knowledge of the respondents. The detailed
operationalization schemes for each theoretical focus of this research are illustrated in tables 3
and 4. The tables include the interview question numbers, according to Appendix A,
reflecting each operationalized measure.

27
TABLE 3: OPERATIONALIZATION OF AFTER-SALES
Concept Conceptual
definition
Operational
definition Measures
Question
number
AFTER-
SALES
Set of activities
taking place after
the purchase of
the product
devoted to
supporting
customers in the
usage and
disposal of goods
(Saccani et al.,
2007, p. 54)
Set of activities
after product
purchase which
might enhance
customer
relationship
regarding
industrial
products.
Customer care
(Saccani et al.,
2007)
Information
provision
Contact methods and persons (Saccani et al., 2007)
Availability (Saccani et al., 2007)
Speed of reply (Saccani et al., 2007)
1.1, 1.2, 1.3, 1.4,
1.5
Complaint
management
Form of handling complaint (Saccani et al., 2007)
Speed of handling complaint (Saccani et al., 2007)
1.6, 1.7
Warranty
extension
Form of handling warranty extensions (Saccani et al.,
2007)
Speed of handling warranty extensions (Saccani et al.,
2007)
1.8, 1.9
Field technical
assistance
(Saccani et al.,
2007)
Check-ups Form of check-ups (Saccani et al., 2007)
Frequency (Saccani et al., 2007) 2.1, 2.2
During/after
warranty
assistance
During warranty assistance (Saccani et al., 2007)
After warranty assistance (Saccani et al., 2007)
2.3, 2.3.1, 2.3.2
Product
disposal
Product lifetime (Saccani et al., 2007)
Price for disposal (Saccani et al., 2007)
Speed of disposal (Saccani et al., 2007)
2.4, 2.5, 2.6, 2.7
Spare parts
distribution
(Saccani et al.,
2007)
Inventory
management
Stock management (Saccani et al., 2007)
Locations and number of warehouses (Saccani et al.,
2007)
Locations and number of repair centers (Saccani et al.,
2007)
3.1, 3.1.1, 3.1.2,
3.2, 3.2.1
Delivery of
spare parts
Average speed of delivery (Saccani et al., 2007)
Price for delivery (Saccani et al., 2007) 3.3, 3.4

28
TABLE 4: OPERATIONALIZATION OF CUSTOMER RELATIONSHIP MARKETING
Concept Conceptual definition Operational definition Measures Question
number
CUSTOMER
RELATIONSHIP
MARKETING
Marketing is to
establish, maintain,
and enhance
relationships with
customer and other
partners, at a profit, so
that the objectives of
the parties involved
are met. This is
achieved by mutual
exchange and
fulfillment of
promises (Storbacka et
al., 1994, p. 22)
Process of maintaining
and possibly building
positive customer
relationships through
successful/profitable
and comprehensive
after-sales activities.
Service quality
(Storbacka et
al., 1994).
Timeliness (time between placing and receiving order should
be short and consistent) (Bienstock et al., 1997)
Availability (orders should be consistently available in
inventory when ordered and preferably near buyer location)
(Bienstock et al., 1997)
Condition items (undamaged, accurate delivery of products)
(Bienstock et al., 1997)
4.3, 4.4,
4.4.1
Customer
relationship
profitability
(Storbacka et
al., 1994)
Customer satisfaction drives customer relationship profitability
( Rust & Zahorik, 1993; Fornell, 1992, Grönroos, 1990;
Heskett et al., 1994; Reichheld & Sasser, 1990; Storbacka et
al., 1994)
o Order handling by manufacturer (Ruekert &
Churchill, 1984)
o Level of backorders of manufacturer’s products
(Ruekert & Churchill, 1984)
o Speed of delivery by manufacturer (Ruekert &
Churchill, 1984)
4.5, 4.5.1,
4.6, 4.6.1

29
4.6.2 INT ERVI EW GUIDE
Performing an interview means to have a conversation where the researcher asks questions
with the objective of seeking information that is directly related to the research (Bailey,
2007). An interview guide is a brief list of memory stimuli of areas that should be covered
(Bryman & Bell, 2007). An interview could be similar to a casual conversation; however, an
interview with a purpose requires practice and ability to adapt to changing setting and
situations (ibid). The design features of a data collection instrument can have various
structures, and the most common types are: unstructured and structured interview, semi-
structured (Bailey, 2007).
Unstructured interviews are also referred to as informal interviews, involve little
standardization and guidelines (Bailey, 2007). Unstructured interviews tend to evolve, and
therefore researchers can ask its interviewees one question or many questions as well as ask
the questions in different orders. Little planning is involved in an unstructured interview
(ibid).
Structured interviews involve significantly more guidelines (Bailey, 2007). In a structured
interview the researcher asks specific questions in a specific order on all the interviews
conducted. It is strictly controlled and planned, even probe questions are designed beforehand.
The interviewer control the interview by deciding the order of the questions and setting the
pace, the interviewer’s job is to keep the respondent on track as a structured interview usually
has a scheduled time (ibid). Typically for a structure interview the intention is to verify
certain facts that might have been established and not to investigate the topic on a broader
perspective (Yin, 2009).
Semi-structured interviews are composed in such structure that it has a set of questions on a
topic that needs to be covered during an interview (Bryman & Bell, 2007; Bailey, 2007).
However, the respondent has a great deal of freedom to how to answer the questions and the
interviewer can get ideas from the answers as well as ask probe questions that were
unexpected (Bryman & Bell, 2007). Semi-structured interviews are regarded as flexible and
structured simultaneously (Bailey, 2007).
In this study, semi-structured interview guide were designed and conducted since the study is
probing to make a comparison of companies of various sizes. In undertaking this, same sets of
questions were asked to all three companies. The need for a plan and structure of the data
collection was preferable as to achieve some consistency in compiling the empirical data,

30
furthermore, to be able to straightforwardly analyze the data as well as to be able to make a
conclusion of the study. The well-defined concepts of this study along with the measure
components are carefully developed indicate that a structured interview could be conducted.
However, the lack of experience the author’s possess in performing interviews and the fact
that students (the authors) meet managers (the respondents) designate that semi-structured
interview is more appropriate. It is applicable since if the respondents can speak freely and
he/she can potentially inform the authors of things that were unexpected which deserves
probing for developed answers. Therefore, semi-structured interviews are the most suitable
type for this specific study.
4.6.3 PR ET ESTIN G
Prior proceeding to data collection, a pre-testing, or also called expert-review period, is
crucial (Bailey, 2007). The pre-testing process is one of the mechanisms for monitoring
consistency between a study’s methodology and its content (ibid). With the help from experts,
the researchers can discover if the interview guide is too difficult to understand, if it is vague
and if it is too sensitive (Yin, 2009). After this process, the interview guide is intended to have
a more polished content (ibid).
During the pre-test process four experts in the field and researchers were asked. The first
researcher is a professor specialized in the area of relationship and service marketing with
vast research experience. The second researcher is a senior lecturer in Marketing with one of
its specializations’ being service marketing and the third researcher is a professor in
Marketing who intensively supported us during the methodology part of our research. The
final expert is a manager with knowledge of the industry as well as experience with after-sales
services. The experts tested if the interview guide is well-formulated and coherent, and if the
content of the interview guide is able to answer the research questions. The manager answered
the interview guide questions and verified its understandability, along with advice and
feedback. The aim of the pre-testing was to get a redefined and meliorated interview guide
and the experts chosen helped targeting that goal.
4.7 SAMPLING
Once the appropriate methods have been chosen, together with the decisions made regarding
the research questions and the overall strategy or approach, it forms in place the main building
blocks for the data collection (Robinson, 2007). There are many details to uncover before
moving forward, these details include the ’who’, ‘what’, ‘where’ and ‘when’ questions. The

31
‘why’ has been addressed when identifying the purpose of the project. The ‘who’ covers
which participants to involve in the research and how many are going to be selected. The
‘what’ and ‘where’ is the next step; in which ‘what’ discloses the overall setting for collecting
data, while the ‘where’ focuses on the geographical setting. The geographical setting can vary
depending on the researchers’ choice of investigating multiple cities as an instance (ibid).
Before choosing what kind of sample to explore, the researchers have to decide on what kind
of sample strategy they want to use, either; probability sampling or non-probability sampling
(Bryman & Bell, 2007). The non-probability sampling is used in small-scale research where
participants are hard to get hold of (Robinson, 2007). Flexible design research projects,
generally when following a theory approach, commonly use a purposive sample. The sample
includes people likely to be knowledgeable, influential or has an overall understanding within
the area (ibid). Gray (2009) explains that a qualitative research within multiple cases usually
involves purposive non-probability samples since it seeks to obtain insights into particular
details within a specific geographical area, context and time. The purposive sampling is
identified as a sample strategy which aims for getting an information-rich and in depth
research that helps understanding the research problem (Gray, 2009; Creswell, 2003).
This study, with the information provided above, uses a non-probability purposive sample
strategy. Since this study is a multiple case research and the aim is to get a deeper
understanding within the area of after-sales services there is no basis to choose a probability
sampling. Also, the target sample will be people with great knowledge within the studied
area.
4.7.1 SAMP LIN G FR AME
When conducting a research, a clear sample frame is of great importance. This sample frame
works as a guide to make sure that all aspects are cohesive with the problems investigated in
the research (Gray, 2009). Miles and Huberman (1994) advise that the best strategy is to
target those aspects that are most likely to extract the most comprehensive data. Having the
purpose and research questions in mind, it is recommended to choose a sample frame that can
answer the questions (Miles & Huberman, 1994). The sample frame is where the drawing of
potential respondents is conducted (Frey & Oishi, 1995).
Considering this study’s purpose and research questions, the frame becomes evident. What
the four research questions have in common is the after-sales services executed among the
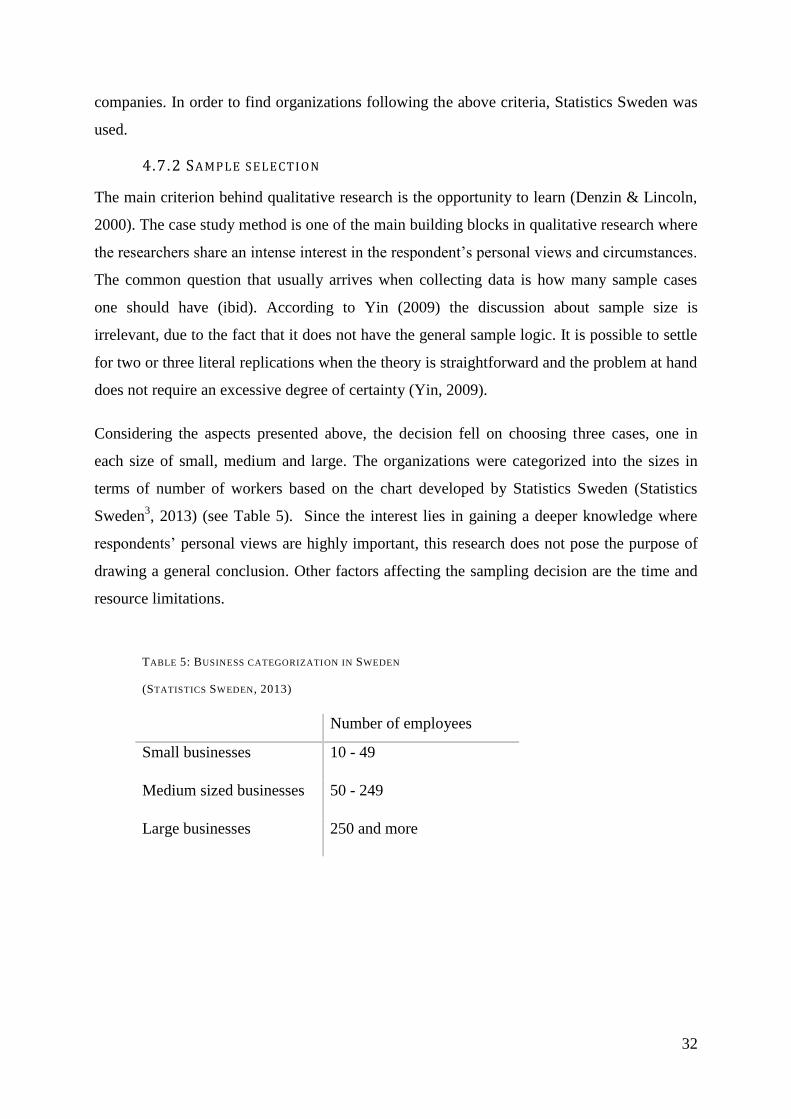
32
companies. In order to find organizations following the above criteria, Statistics Sweden was
used.
4.7.2 SAMP LE S ELECTI ON
The main criterion behind qualitative research is the opportunity to learn (Denzin & Lincoln,
2000). The case study method is one of the main building blocks in qualitative research where
the researchers share an intense interest in the respondent’s personal views and circumstances.
The common question that usually arrives when collecting data is how many sample cases
one should have (ibid). According to Yin (2009) the discussion about sample size is
irrelevant, due to the fact that it does not have the general sample logic. It is possible to settle
for two or three literal replications when the theory is straightforward and the problem at hand
does not require an excessive degree of certainty (Yin, 2009).
Considering the aspects presented above, the decision fell on choosing three cases, one in
each size of small, medium and large. The organizations were categorized into the sizes in
terms of number of workers based on the chart developed by Statistics Sweden (Statistics
Sweden3, 2013) (see Table 5). Since the interest lies in gaining a deeper knowledge where
respondents’ personal views are highly important, this research does not pose the purpose of
drawing a general conclusion. Other factors affecting the sampling decision are the time and
resource limitations.
TABLE 5: BUSINESS CATEGORIZATION IN SWEDEN
(STATISTICS SWEDEN, 2013)
Number of employees
Small businesses 10 - 49
Medium sized businesses 50 - 249
Large businesses 250 and more
33
4.7.3 THE S AMP LE
The cases used in this research are three different sized heavy equipment machinery after-
sales service providing organizations. They are located in Sweden and, taking the researchers’
time and resources into consideration, the organizations are mostly closely located to
Linnaeus University, Växjö. The large sized enterprise is located in Växjö city. Two
interviews were conducted with one specialist working with after-sales on a daily basis and a
manager of the relevant field. The medium sized enterprise is located in a city near Växjö.
The small sized enterprise is located in the northern part of Sweden; thus, a telephone
interview was conducted.
4.8 DATA ANALYSIS METHOD
Analysis is synonymous with interpretation of information (Strauss, 1994). Qualitative data
analysis involves interpreting and communicating enormous mass of data collected and
presenting its most important features (Hancock et al., 2009). While the qualitative data is
usually acquired chronologically as the researchers progressively emerge into the subject, the
analysis is topic-oriented; thus, challenging the researchers to effectively move
chronologically and topically back and forth (Fischer, 1994).
Observations and interpretation of data should be consistent throughout the analysis process
in order to ensure reliability in later parts (Boyatzis, 1998). Furthermore, it affects potential
replication, extension and generalizability of the research. When there are multiple
researchers on a relatively equal level of knowledge and experience, it is useful to measure
their agreement throughout the analysis procedure to ensure more reliable analysis (ibid).
Thus, the analysis in this research was conducted individually by each researcher part by part
then discussions were held to decide upon a common view. Stake (2006) also highlights that
when conducting a multiple case study, the researchers must concentrate on each individual
case as if it was the only one; thus, working vigorously to extract vital information and
understand each case in depth.
Qualitative analysis comprises three concurrent flows of activities as defined by Miles and
Huberman (1994) namely, data reduction, data display and conclusion drawing and
verification.
Data reduction: Data reduction, also called data condensation (Tesch, 1990), includes
activities related with selecting, focusing, simplifying, abstracting and transforming

34
the gathered data (Miles & Huberman, 1994). In order to conduct this procedure the
data has to be transcribed in written form in advance. It is an ongoing process which
takes place from fieldwork until the final report occurring through various ways such
as selection, summary, paraphrase, subsume and so forth (ibid).
Data Display: The gathered data needs to be assembled into an organized and
compressed form to overcome the disadvantage of immense mass of information,
resulting from qualitative investigations (Miles & Huberman, 1994). Extended texts
tend to overload the reader, thus, it is crucial to display information in an immediately
accessible and compact form such as matrices, graphs, charts and networks (ibid).
Conclusion Drawing and Verification: This procedure involves noting regularities,
patterns, explanations, causal flows, propositions and possible configurations (Miles &
Huberman, 1994). It is usual that the researchers have the conclusions in mind from
the start of data collection. However, competent researchers are open and critical to
new aspects and proposals during the analysis process. Certain conclusions are more
and more verified as the analysis proceeds thus ending up with “final” valid
conclusions (ibid).
In this research, the recordings of in-depth interviews have been transcribed verbatim making
the data more transparent and accessible according to Clayman and Gill (2004). A transcript is
not a replacement for recording, it is rather a tool to be used together with the recording;
hence, unfolding both vocal and non-vocal activities. Moreover, transcripts allow experts and
others to assess analytic claims from the data independently (Clayman & Gill, 2004). Ritchie
and Lewis (2003) suggest tagging the transcript according to certain form of index with the
aim of linking it to theoretical constructs. Thus, the transcribed interviews were studied and
tagged according to the operationalization scheme which bridged the collected data and
relevant theories.
Further on, the transcribed and tagged information was filtered and comprised, and the most
relevant empirical data for this study is provided in text format in the following chapter. As
Miles and Huberman (1994) recommended, the data is also displayed in other forms than text
such as tables, presenting the main concepts in structured and illustrative way.
As final analysis procedure, the reduced and displayed data was studied for patterns, themes
and clusters in accordance to the proposed research model, and similarities and differences
among cases were explored in order to answer the research questions of this study and draw

35
reasonable conclusions. The theoretical propositions explored in previous chapters have also
been used as guidance in data analysis as recommended by Yin (2009).
4.9 QUALITY CRITERIA
When conducting a research it is essential to confirm the rigorousness of the design method
disposed, a research never gets better than the level of quality employed in conducting it.
Rigorousness can be measured by the concepts of validity and reliability (Bryman & Bell,
2011). Validity represents the extent to which the study accurately investigates what it intends
to investigate. Reliability refers to the degree of consistency of the measurement instrument
(Hammersley, 1990). Particularly in qualitative research, methodologists have over the years
trying to set some guidance for researchers for improving or judging the quality of such
research (Seale, 1999). “Because a research design is supposed to represent a logical set of
statements, you also can judge the quality of any given design according to certain logical
tests” (Yin, 2009 p.40). Furthermore, there are a few commonly used tests/tactics which
assess the quality, mainly within social science methods, of the research design (Yin, 2009;
Rowley, 2002). Among these are content validity, construct validity, external validity, and
reliability (ibid).
4.9.1 CON T ENT V ALI DI TY
Content validity, also known as face validity, concerns how well a measured concept’s
components actually represent the concept (Ghauri & Grønhaug 2005). By letting experts,
authorities and knowledgeable managers in the specific field review the interview guide; it
would increase the content validity (ibid).
To ensure the rigor aspect of content validity for the research problem at hand,
operationalization structure and interview guide were sent to supervisor as well as examiner to
obtain useful feedback so that the interview questions could be further revised and improved
before the actual conduction of the data collection took place. This decreases the risk of being
questioned about the face validity.
4.9.2 CON ST RUCT V ALI DITY
Construct validity regards the sufficiency in the operational set of measures (Yin, 2009).
Construct validity can measure and reduce subjectivity and it sets accurate operational
measures for the research model and concepts being studied, hence connecting data collection
questions and measures to research questions and propositions (Rowley, 2002). The degree
36
which an operationalization specifically measures the concepts it is supposed to measure can
be assessed by various tactics such as using multiple sources of evidence, establish chain of
evidence, have key informants review draft case study report (Yin, 2009).
Sources of evidence (i.e., previous credible researches) have been used to back up the
operational measures. Furthermore, to ensure that the operationalization step of the thesis has
been properly assessed, that the construct validity of the study is exploited, the interview
guide and operationalization work were reviewed by the authors’ supervisor and examiner to
get feedback and professional opinions on the procedures of developing the interview guide.
The interview guideline were sent out to the interviewees before the actual interviews were
conducted, this due to the complexity of the topic questions, meaning that the interviewee
might need some time to prepare the answers before the interview, decreasing the potential
errors to occur during the interview session. In addition, the interviews were recorded
throughout the sessions to give the possibility to recall the interview after the session is over.
These tactics are elimination of errors that can affect the result of the study.
4.9.3 EXT ERN AL V ALIDITY
External validity concerns if the study and outcome can be generalized and confirmed through
another context or another group within the population (Yin, 2009; Rowley, 2002). The external
validity criteria have its main focus to establish a field to which a study’s findings can be
generalized (ibid). The external validity problem has been a leading problem in conducting case
studies (Yin, 2009). One case study does not provide sufficiency to induce a generalization over
the population studied, it is therefore recommended to replicate logic in multiple case studies so
that a pattern can be identified and a broader overview can plausibly be established. External
validity attempting is performed by using theory in single case studies, use replication logic in
multiple case studies (ibid).
Depending on the research problem and the outline of meeting the problem in this study, multiple
cases of cross-sectional analysis will be carried out. However, the research problem is to compare
company sizes and their after-sales offers, how these offers differ and how these impacts on
customer relationship. Due to the low accessibility to companies to investigate, only three
companies, one of three different sizes were investigated and hence the external validity is
considered low, and a generalization cannot be drawn, only assumptions will be made. For future
investigations, the careful reported and described case study protocols and database enable for
further research in a broader sense and can possibly make a generalization by replicating the
study.

37
4.9.4 RELIABI LIT Y
The reliability criteria refer to demonstration that the operation of a study can be repeated
with the ability to obtain the same results (Yin, 2009; Rowley, 2002). Another researcher
should be able to repeat the actual study and yet show the similar results. However, reliability
criteria are not the same as replicating the study for testing the external validity; it is with the
purpose of eliminating incorrect answers (Yin, 2009). Tactics to test the reliability are using
case study protocol and develop case study database (ibid).
Every step and decision that has been taken throughout the study has been discussed and
justified; the available operationalization and interview guide as well as the thorough reported
empirical data makes it possible for replication of the study. The report of case study protocols
and database empower the reliability of the study as it can be replicated by someone else to ensure
the consistency of the study.
In conclusion of this chapter, the choices regarding the methodology of this research are
summarized in table 6.
TABLE 6: RESEARCH METHODOLOGY SUMMARY
Research Methodology
Research Approach Deductive
Qualitative
Research Design Descriptive
Data Sources Primary
Research Strategy Multiple case study
Data Collection Method Interviews
Data Collection Instrument Semi-structured interviews
Sampling Three cases: one large, one medium and one small after-sales service
providers in Swedish heavy equipment machinery industry
Data Analysis Method Data reduction, Data display, Pattern matching and conclusion drawing
Quality Criteria Validity and Reliability

38
5. EMPIRICAL DATA
In this chapter, empirical data collected from the three cases are presented. It discusses each
case starting from the small size organization to medium size organization and proceeds to
the large size organization. Each company is briefly introduced and the gathered data is
presented in accordance with the study’s theoretical concepts; namely, customer care, field
technical assistance, spare parts distribution and customer relationship marketing.
General information, regarding the companies investigated in this multiple case study, is
presented in table 7. The collected empirical data is elaborated in case by case in the
following sections. While case A and B are both Swedish manufacturers of heavy equipment
machinery; case C is rather special. Case C is an organization carrying out after-sales
activities for one very large manufacturer. Due to the complexity and huge size of the
manufacturer, they have transferred its after-sales activities to company C. Since Company C
is only responsible for providing after-sales services, all its employees were considered to
work with after-sales services.
TABLE 7: GENERAL INFORMATION ABOUT THE CASES
Case A Case B Case C
Number of interviews 1 1 2
Position of the respondents After-sales
manager Stock manager
Customer care
respondent
Spare parts
manager
Years of employment at the
organization 20 years 23 years 5.5 years 11 years
Years of experience in the
industry 25 years 23 years 8 years 16 years
Number of people working at
the company 17 110 448
Number of people working
with after-sales service 2 8 448
Year of establishment of the
organization 1940 1983 1999

39
5.1 CASE A – SMALL SIZE ORGANIZATION
The small size organization, or Company A, develops, manufactures and markets certain
heavy equipment machineries, primarily focusing on the Scandinavian market through their
distributors. The interview was conducted with an after-sales manager who has been working
for 20 years in Company A with a total of 25 years of experience in the industry. Company A
has two people working within the focus on after-sales; the distributor network is mostly
responsible for handling the after-sales services.
5.1.1 CUS TO MER CAR E
Information provision:
Technical as well as commercial information are provided both in electronic and paper form.
The customer can choose which form according to their own preferences. In case of direct
contact, customers have the options of contacting Company A through telephone, e-mail and
fax. However, the most common contact method to reach the company is through telephone
and e-mail. Company A does not charge extra for telephone calls, thus, the rate is the same as
a normal telephone call. Regarding the speed of reply, telephone calls are answered
immediately during the opening hours 07.00-16.00; e-mails can take longer time depending
on the content, in some cases they may need to contact their suppliers to get answers before
replying the customer. Company A does not have specific policies regarding speed of reply.
However, they aim to answer as soon as they can. Besides, they do not have responsible
personnel for specific customers.
Complaint management:
The complaint handling process strongly depends on the particular issue. For instance, in case
there is a defect in a product, there is a specific procedure to follow; the customer needs to
send the product back with a detailed description of the deficiency. Concerning some
complaints, they are able to solve the complaint directly, while in other cases it is not possible
to take any actions before receiving information from the suppliers. In general, the process
takes a lot of time, with the average speed of complaint management being 1.5 month. There
are no official policies regarding complaint handling; the internal goal is to solve issues in a
period of one month. However, they are not able to reach this objective yet.

40
Warranty extension:
There is a single type of warranty for all products. It is not possible to extend the warranty of
all components. The components that are possible to extend are usually the expensive ones
such as driveline. The speed and process of warranty extension takes just few minutes since
Company A is a small size enterprise so they are able to put it on the contract flexibly.
5.1.2 F IELD T ECHNI CAL ASSI S T AN CE
Check-ups:
Company A does not provide the check-ups themselves. This task is carried out by their
distributors. There are also no visits made to the distributors. The company usually calls their
distributors to discuss what is going on. The customers have access to a website where it is
visible if they need any check-ups and program updates. Company A does not visit customers
but it has happened before in very seldom occasions.
During and after warranty assistance:
Customers can always call the company for field technical assistance during and after
warranty time. As mentioned earlier, there is only one type of warranty for purchase of a new
machine. It usually is based on a time limit. It is also possible to purchase a spare parts
warranty. The greatest advantage, that Company A desires to provide customers, is to ensure a
high degree of capacity utilization of the machine. The customer should be able to use the
machine constantly without the machine impeding. During the warranty time all costs are
covered by company A.
Product disposal:
The average product lifetime of the vehicles is around 10-15 years. There is also the
subcategory of machines which are not used on a daily basis. Regarding those products, the
average lifetime can be around 25 years. There are even machines from 1970s which are
operating and their spare parts are still available. When it is not possible to obtain spare parts
anymore, that is the definitive reach of the product lifetime. Company A does not offer
product disposal service. Other waste management around Sweden takes care of the product
and spare parts disposal quickly by directly picking it up from the customers. But, they are not
related to company A.

41
5.1.3 SPAR E P ART S DI S TRI BUT IO N
Inventory management:
Company A has 15 warehouses located in 15 different cities in Sweden and there are 2 repair
centers in Gothenburg and Stockholm.
Delivery of spare parts:
Average speed of delivery of products and spare parts takes approximately one day, but it
varies in relation to the delivery destination. In some regions, it may even take one hour
depending on the distributor and location. The customers are provided with two options of
delivery: normal or express which they have to pay for the entire delivery costs. However,
there are few customers who are not required to pay the delivery fee. It does not necessarily
depend on the specific customer rather it depends on the existing contract with suppliers and
distributors.
5.1.4 CUS TO MER R ELATIONS HIP MARK ETI NG
Service quality:
Company A does not have any formal goal for providing after-sales. However, the company
sees after-sales as an opportunity for new sales. They consider that if they do a good job
providing after-sales services, they have prepared half the effort for selling a new machine. If
the after-sales service is done correctly, they will be able to sell new machines in the future
when it is time for a new purchase. The profit created from after-sales service has not been
calculated in a formal way. However, the interviewee estimates it as very high if handled
properly.
The company has not measured the occurrences of delivery delays. The interviewee expresses
that it does happen, but in most cases it is not under their control, usually the delivery
companies cause the delays. Company A does not have an exact number of the defective
products delivered to customers, but estimation would be around 20 times per year. The most
common defects are broken glass windows and other fragile features. Inaccurate deliveries of
products happen due to misinterpretations or mistaken description by customers or customers
ordered the wrong parts.

42
Customer relationship profitability:
The orders are made through telephone, personal meetings and online. The most common way
of placing an order is online. Company A has a special network dedicated for customers to
place orders. In general, the company is able to cover 85% of the requests or orders. Then,
there are 6-7% requests which cannot be satisfied due to facts such as the machine being too
old and the parts not being produced anymore. For new machines, they might have 15%
requests that they do not have in stock. There is no average number of days of backorders, the
company aims for providing the missing product as soon as possible.
The interviewee considers after-sales services to be extremely important. If the customers get
their after-sales services they need and they are assured that their machine will not stop
operating, they will return to the company and seek their help. Otherwise, the customers will
go to a competitor. Thus, it is very important to have a good relationship.
5.2 CASE B – MEDIUM SIZE ORGANIZATION
The medium size company, also referred to as company B, provided the research with a
respondent who is the stock manager with 23 years employment in the company. The
respondent has been working at Company B throughout his career thus achieved a total of 23
years of experience within the industry. In company B, there are eight people working with
after-sales services.
5.2.1 CUS TO MER CAR E
Information provision:
Company B provides their customers with technical and commercial information using
brochures and their website; moreover, the customer can also get the information digitally. In
terms of contact methods, the available methods are telephone, e-mail and fax and the most
common method for Company B is today e-mail. No additional cost applies for customers to
call the company; customers are being charged the normal call rate. Every weekday from
08.00-16.00, except for lunch hours 12.00-13.00, the company is ready to answer calls and e-
mails. Telephone calls are answered directly while answering e-mails differs. Depending on
each individual case, Company B prioritizes the e-mails. The company’s procedure is to
prioritize cases where the customer reports a machine that is standing still, and less urgent
cases are postponed to be answered after sorting out the crucial cases. The aim for Company
B is to answer the customer, regardless the contact method, as soon as possible, though they

43
do not have a written policy on speed of reply. As mentioned, Company B has eight people
working within after-sales and they all have the same responsibility to handle customers in the
same way. These eight people work towards meeting the customers’ needs as fast as possible.
Complaint management:
Company B has different procedures for handling complaints. Major customers should fill
out a form and e-mail it to them. Smaller customers can call and express their complaints
directly on the phone. Again, Company B judges the individual cases of complaints and makes a
prioritization of the seriousness of the complaint. In handling complaints, Company B gives an
answer to their customers within 24 hours. In more serious cases, they handle it even faster. Moreover,
some of the company’s contractual customers have required a response time of 3-8 hours. Otherwise,
there are no written policies for the speed of handling complaints, but company B’s goal is to meet the
customers’ demands as soon as possible. They see the importance of listening to the
customers and act accordingly, this concerns big as well as small customers.
Warranty extension:
In terms of warranties, there is only one sort of warranty offered to company B’s customers. It
is a standard warranty formulated by the machine entrepreneurs of Sweden. Rules, regulations
and the contract with machine entrepreneurs make it hard to formulate their own warranties.
Moreover, it is possible to expand the warranty; this is handled during the purchase of the
product. That is the only occasion where their customers can expand the warranty; it is too
late to request an extension on the warranty after the point of purchase. The request to extend
warranty takes a few seconds to arrange. They just need to include it into the contract.
5.2.2 F IELD T ECHNI CAL ASSI S T AN CE
Check-ups:
Company B provides their customers with check-ups; they prefer to do it themselves rather
than relying entirely on the distributors. Depending on what was formulated in the warranty,
the company will provide check-ups provisional on how many hours the machines have been
operated. The first check-up is after 500 hours, then after that, 1000 hours. After the second
check-up they will not be as frequent anymore, it is the first 1000 hours that are crucial.

44
During and after warranty assistance:
It says on the warranty contract. During the warranty validation period, the customers do not
have to pay for anything; the cost is covered by company B. The warranty is set to vary
depending on the use of the machine. Some customers may use the machine for few hours per
week while others may use every day. Consequently, the warranty may differ. The
interviewee considers the warranties to be same as the competitors since they are part of the
machine entrepreneurs of Sweden.
Product disposal:
Company B’s vehicles that were built in 1980s are still functional and therefore the product
lifetime of their products is indefinite, but the Company B expresses that the machines built
today should be functional for at least 15 years. When machines have become old, Company
B buy the customers’ machine back and try to fix whatever is possible, could also be spare
parts that are fixable to be sold again. Company B tries not to waste what is repairable and
functional. The speed of taking the machine out of the customer’s hands is as soon as possible
after their request. The machine is then taken to the repair shop to be fixed.
5.2.3 SPAR E P ART S DI S TRI BUT IO N
Inventory management:
Company B has one major warehouse located in Ljungby, this warehouse contains more than
32 000 articles of spare parts. Some of the parts are distributed to their distributors, but the
main warehouse is located in Ljungby. There are 18-22 locations for warehouses and repair
centers spread around entire Sweden. Since the company aims to provide the repairs
themselves, the main repair center is in Ljungby.
Delivery of spare parts:
Company B delivers the ordered products and spare parts the same day if the order is made
before 14.00. Otherwise, the order will be delivered the next day. These estimations apply in
case the ordered part is available, but, it is very unusual to run out of stock due to excellent
ERP system. Regarding the delivery fee, Company A covers the costs until carrier and from
carrier to the customer’s location the customer has to pay. However, it can be stated otherwise
in the initial contract between the company and the customer.

45
5.2.4 CUS TO MER R ELATIONS HIP MARK ETI NG
Service quality:
The interview states that selling a product is not a difficult mission; the real mission starts
when the customer has bought a product. The profit generated by after-sales services has not
been calculated but the interviewee estimates it to be a huge part of the overall profit.
Delivery delays occur sometimes and are mostly caused by the delivery company. In regular
intervals, defective products delivered to customers occur. Usually, the defects are in the parts
that Company B does not produce. Inaccurate deliveries of products occur since there are
many kinds of machines consisting of different parts and features; it is human that mistakes
occur.
Customer relationship profitability:
The most common way of placing an order is through e-mail. Telephone ordering is also used
and customers in the area visit the factory and make an order on the spot. Currently, it is not
possible to order on the web which they are planning to adopt in the future. The plan is to
apply a system for online ordering within the next two years. Backorders occur seldom, but it
depends on the kind of component the customer is requesting. Company B has a system that
automatically places an order for components which are running out, either they are produced
by Company B or ordered from a distributor. In case of backorders, it may take up to 1-2
weeks if the company produces the order. For distributors, the backorder days vary depending
on the ordered product.
The interviewee considers that after-sales services definitely influence the relationship
customers. The customer will change the brand if after-sales service is not handled in the right
way. Since the competition is intense, the customers have to be nurtured after the purchase in
order for the customer to buy new products in future cases.
5.3 CASE C – LARGE SIZE ORGANIZATION
The large size company, or Company C in this case, is a distributor to a major manufacturer
of heavy equipment machinery in Sweden. Two respondents were interviewed and the
conducted interviews were with a customer care respondent with 5 and a half years
employment at the company and 8 years of experience in the industry, and a spare parts
manager with 11 years of employment in the company and 16 years of experience in the

46
industry. Company C works only with after-sales services, thus it has around 400 employees
in total.
5.3.1 CUS TO MER CAR E
Information provision:
Company C provides technical and commercial information through their website where
customers can visit to find information. For further technical information, the customer can
make an order from the company and they will receive books and brochures containing the
information they seek. Moreover, this kind of information can be found online together with
spare parts, which they then can order. To access the spare parts online it is required that the
customers have an online account of the company. Company C also has its own magazine
where they try to spread information to customers.
Even though Company C provides telephone, e-mail and fax as contact methods, the most
common method for the customer to get in contact with the company is via telephone. 95% of
company C’s customers call and only a 0.1% of the customers send e-mails. There is also the
availability for the customers to come directly into the office for any kind matter it concerns
or even send text messages to order spare parts. Furthermore, no additional costs account for
the customers when they call. Apart from the normal telephone rate, the company does not
charge any extra fees.
The regular opening hours are 07.00-16.00, and the spare parts distribution department is
open 30 minutes extra. The extra 30 minutes is due to company C’s consideration to their
customers. According to company C, the customers finish their work around the time of
closing time, and they might need some spare parts in order to prepare for the next day of
work, therefore Company C remains open another 30 minutes for them to get a chance to
come and get the parts. This is an additional service for the customers’ convenience.
Additionally, the spare parts manager highly aims for being available to customers and thus,
is ready to receive phone calls anytime.
The average speed of reply is very short when calling; there are people answering phone calls
in many departments. Especially, at the repair shop department there is no waiting time. There
is no written policy for speed of reply since Company C answers customers with very low
waiting time. However, solving their request can take many days depending on the case.
There is not assigned contact persons for specific customers. However, employees have

47
different responsibilities and most customers have certain workers they like to call and contact
them directly.
Complaint management:
There are market researches which contact customers after a certain time following the
purchase and technician visit, in order to investigate their opinion about the service and so
forth. If the researches discover certain dissatisfactions, the responsible department tries to
take care of it. In case the issue involves several departments, a meeting is organized to solve
the problem as soon as possible. It is not practical to call the customers several times a month;
it is rather preferred to call them few times during a year, not to irritate them. The complaint
handling usually focuses on listening to the customers. The responsible person who could
solve the complaint is contacted and tries to satisfy the customer. Company C greatly focuses
on making customers happy and satisfied, and in their experience, they have handled
complaints well so far. There is no specific procedure or policies when it comes to complaint
management. Although, there are no measures currently, Company C is working on a solution
for it.
Warranty extension:
There is a primary one year warranty included for all spare parts. For new machines, there is
also one year warranty; additionally, a maintenance agreement, excluding travel costs, for two
years can be purchased as well as a three year warranty which can be expanded up to 10 000
hours. However, the last option is very expensive since it covers 5 years and customers rarely
purchase it. Additionally, there is driveline warranty, component warranty and repair
agreement which covers labor costs. The buyer has to decide on the warranty upon purchase
or there is half a year time to decide on an agreement. For spare parts, it is not possible to
obtain an extended warranty.
5.3.2 F IELD T ECHNI CAL ASSI S T AN CE
Check-ups:
Company C provides check-ups in case a customer seeks specific assistance or large
reparation is made. They also aim for a proactive approach to discover potential problems
before it occurs. Thus, there are technicians working at the organization who have huge
responsibilities. The maintenance and services occur at the location of the customer since
transporting huge machines is costly and it is the most convenient way for both customer and

48
them. The check-ups are considered as a daily work at Company C and there are some
technicians, who work alone and are constantly travelling and meeting customers. Due to the
proactive approach, the check-ups are quite frequent.
During and after warranty assistance:
There is no specific during and after warranty field technical assistance. Company C only
provides demonstration of using the machine following the initial purchase by sending a
person to the customer. Additional components can be included to the general warranty. All
warranties cover travel costs for field technical assistance. In case of damaged spare parts,
they have to be sent back and are replaced with new ones.
Product disposal:
The lifetime of the product depends on the machine; the average is around 10 years. The
newer machines have shorter lifetime compared to the older models, due to a lot of electronic
gadgets within the machine which do not last long. It is also influenced by the developing
environmental requirements where the machine is not up to date anymore and does not meet
the new requirements. The newer machines are much more environmentally friendly and
some old machines are not even allowed to operate anymore. But, there are still machines
from 1960s that are functional although there are no spare parts available in the market
anymore. There is not a formal product disposal service offered to the customers. Company C
buys back the old machines which are still functioning; after fixing them they are resold.
However, machines that are out of function are not bought back. The used machines have a
certain second hand value and waste management companies are willing to take care of the
product disposal for the customers.
5.3.3 SPAR E P ART S DI S TRI BUT IO N
Inventory management:
There are 42 warehouses and repair centers from north to south part of Sweden. The
warehouses and repair centers are together.
Delivery of spare parts:
The average speed of delivery of products and spare parts are 2-3 days. The customer can also
directly come to the center and receive the desired spare parts since there is large number of
products at the warehouses. There is large number of spare parts in the warehouses, thus, most
49
of the demands can be met without contacting producer. The customer pays for the delivery
costs. Different delivery fees are credited depending on the weight of the package. There is
still the option to pick the order up at the office without paying for any delivery.
5.3.4 CUS TO MER R ELATIONS HIP MARK ETI NG
Service quality:
The goal for providing after-sales services is expressed by one of the interviewees as to get
satisfied customers and on the company website it states that it is to live up to the demands of
the customer and always make improvements. In addition, an internal goal of Company C is
to have every other machine purchased in Sweden to be the product of the organization. The
better the service they provide the higher the chance is to fulfill this goal. The spare parts
distribution is the largest part of all after-sales activities conducted by Company C and it
results in the most profit while the repair shop department produces the least profit.
Product delays are considered to occur every week. The main objective is to not to promise
something that is not kept. Thus, as long as the customer is informed beforehand about a
change in delivery time, they do not consider it as a delay. Most delays are due to suppliers in
the supply chain and other factors that are not under company C’s control. Delivery of
defective products occurs once in a while and in the Växjö office, it happens with an
approximate interval of once a week. The inaccurate deliveries of products also occur around
once a week. The reason behind it can vary; it can be due to human factors, or wrong
information on the computer, or sometimes it can also be due to wrong deliveries from the
supplier.
Customer relationship profitability:
The most common method of placing an order is through telephone. There is also an e-
commerce platform, where customers can make orders online that is getting increasingly
popular. Moreover, orders can go through the manufacturer. Backorders happen every day at
the warehouses; it is also closely related with the strategy the supplier is applying. In some
cases, the supplier might reduce products in warehouses in order to save money which as a
result affects the operation of company C. The backorder days varies from 2-3 days to few
months depending on each case. The usual number of backorder days is one; but, sometimes
the order might not be in product selection anymore thus it can take months.

50
After-sales services definitely influence the relationship with customers. The customers
choose Company C based on their many locations in Sweden and their fast provision of spare
parts and large number of technicians. Since the customer has purchased the machine for high
investments, it is crucial for it to be reliable. Thus, service is critical. The customer will not
buy another machine if the after-sales service was not taken care before. The customer will go
to a competitor, which further on influences the reputation of company C. If they do not
deliver good service they will quickly lose customer.
51
6. DATA ANALYSIS
The data analysis chapter presents a cross-case analysis of the collected data, elaborated in
the previous chapter. The cross-case analysis follows the theoretical framework of this study;
the main concepts being customer care, field technical assistance, spare parts distribution
and customer relationship marketing. This chapter is also dedicated towards setting the basis
for answering the research questions.
6.1 CUSTOMER CARE
Customer care can be distributed to different levels such as through centralized call center,
manufacturer’s website and local repair centers which support customers with commercial
and technical information, complaint management and warranty extensions (Saccani et al.,
2007). Each of those individual services is discussed across the different cases in the
proceeding sections. There is an increasing awareness of the importance of customer care as
an operative tool towards a strategic role in terms of customer relationship (Kantsperger &
Kunz, 2005) which was also evident in the studied industry, heavy equipment machinery.
6.1.1 INFO R MATION P ROVISIO N
Table 8 presents a comparison among the cases of the major activities of information
provision. When it comes to information provision, the customers are offered with different
options and clearly the options are more advanced with bigger sizes of companies. The small
sized firm provided information in paper and electronic form while the medium sized firm
added the options with their informative website and finally, the large sized company had
created an online account system for customers and they made it also possible to receive
relevant information as books. The large sized company successfully utilized the advantages
of internet which makes it possible to have more touch points with customers and it also
makes it easier to perform the activities of customer care as stated by Earl and Kahn (1994).
The small and medium companies will most probably utilize internet as part of their customer
care in the near future.
None of the cases had centralized call centers. However, the contact methods were the same
and contacting through telephone as well as e-mails were common. In addition, no further
price was charged for telephone calls, normal telephone rate applied for all cases. Company C
highlighted its availability through telephone and this may be a more personalized way of

52
offering service (Saccani et al., 2007). The medium sized organization did not achieve the
fast speed of reply on the level of company C; however, they do have a prioritization
procedure unlike the small size organization which does not have any set procedure.
Kantsperger and Kunz (2005) claim that customer care involves providing advice in financial
affairs and managing relationships with key accounts; however, none of the cases gave
financial advice and they did not have key account since there was no assigned contact person
for specific customers. Providing financial advice and key account management may be
applicable to certain industries, but in these cases, it did not apply in the industry of heavy
equipment machinery.
TABLE 8: INFORMATION PROVISION
Information provision
Case A Case B Case C
Technical and commercial
information provision
Paper and electronic
form
Brochures, website
and digitally
Brochures, books,
magazine, online
account, website
Possible contact methods Telephone, e-mail and
fax
Telephone, e-mail and
fax
Telephone, e-mail and
fax
Most common contact
method Telephone and e-mail E-mail 95% telephone
Cost of direct calls No extra fee – normal
call rate
No extra fee – normal
call rate
No extra fee – normal
call rate
Availability 07.00-16.00 08.00-12.00 13.00-
16.00
07.00-16.00 plus 30
minutes for spare
parts
Replying to customers
No prioritization. May
take long time when
answers from
suppliers are needed
Prioritization of e-
mails based on
importance of the case
Immediate reply for
telephone calls
Contact persons for certain
customers
No specific contact
persons
No specific contact
persons
No assigned contact
persons
None of the cases had any sort of policy on speed of reply; this could indicate that it is not
necessary for this particular industry. On the other hand, it may be an attribute that the

53
companies can develop in the future. The availability of the after-sales providers was
relatively similar. However, case C or the large size organization provided 30 minutes
additional service in order to serve customers after their working hours. Kahn (1995) argued
that organizations operating in the automotive industry have fairly similar offers and their
major competitive factors lies with their service quality including friendliness, availability and
trustworthiness. It can be suggested by company C’s features and attitudes that they highly
aim to be available to its customers through their fast replies and extra opening hours. As the
authors have personally contacted all the investigated organizations numerous times, it was
observable that Company C met their promise. When making a telephone call to company C,
during the opening hours, it is certain to receive an answer immediately without long waiting
lines which can be a significant asset to their customers in need.
6.1.2 CO MP LAINT MAN AGEMENT
Poorly handled complaints can lead to lack of trust between the customer and the provider,
which further on impacts the relationship between the two parties, highlighting the importance
of complaint management (Bejou & Palmer, 1998). In case A or the small size manufacturer,
there is no specific procedure to handle complaints which is understandable since there are
only two people working with after-sales service full-time. The two employees can flexibly
discuss complaints as it occurs based on their experience and knowledge without setting
regulations beforehand. Case B or the medium size company prioritizes the complaints
depending on the seriousness of the case and the size of the customer. In comparison to
company A, their approach is far more regulated. Finally, case C has taken a proactive
approach where customers are contacted before they have expressed their dissatisfactions. In
order to effectively utilize this approach, Company C has turned to market professionals
specialized in the task. The different ways of dealing with customer dissatisfaction strongly
shows the differences that come along with firm sizes. Yet again, there are no stated policies
regarding the speed of complaint management, which could designate that this is a point to be
developed. A summary of complaint management process is shown on table 9.

54
TABLE 9: COMPLAINT MANAGEMENT
Complaint management
Case A Case B Case C
Complaint handling
procedure
The procedure
depends on individual
case.
- Some complaints
can be solved directly
- Actions upon
receiving information
from suppliers
- Send product back
with description of
defect
It varies depending on
the customer and the
case. Cases are
prioritized based on
seriousness.
- Major customers fill
out and e-mail a
standardized form.
- Small customers
express complaints
directly by phone.
General market
research of
satisfaction after
purchase by
professionals.
Customers are
contacted several
times a year or in case
of significant change.
6.1.3 WAR RANTY EXT ENSION
In the three case studies, each warranty offer differs as shown on table 10. Case A offers one
warranty that apply for all its products which may relate to the relatively low number of
products they are trading. Case B offers a standard warranty formulated by the machine
entrepreneurs of Sweden that according to them limits their flexibility in warranties. Case C
offers warranty of various kinds; the offers are significantly more than in case A and case B.
The two interviewees from company C, namely the spare parts manager and customer care
respondent had different levels of knowledge regarding the warranties. The spare parts
manager was not aware of all the types of warranties while the customer care respondent
could fully explain each of the warranties and agreements that are available at company C,
indicating their knowledge on different levels.
The speed and process of warranty extension is among the cases fairly similar; it is not
possible to extend warranty on all products, and the extension has to be done at the purchase
of the product or after some restricted time, such as six months for case C. However,
Company A expressed that they can be flexible and can in some cases extend their warranty
features, when the customer highly desires it. As mentioned, there are only two people
working with after-sales in company A; thus, they seem to be able to be far more flexible and
personalized compared to the medium and large enterprises.

55
TABLE 10: WARRANTY EXTENSION
Warranty extension
Case A Case B Case C
Warranty types
Single type of
warranty for all
products
Warranty formulated
according to machine
entrepreneurs of
Sweden.
Standard warranty of
one year. Optional 2,
3, or 5 years warranty,
driveline warranty,
component warranty,
maintenance
agreement and repair
agreement.
Warranty extension
possibility
Not possible to extend
all components. Some
expensive ones are
available for
extension.
It is possible to extend
the warranty at the
point of purchase and
not afterwards.
Warranty decision
upon purchase and
half year time to
decide on any
agreements.
Speed of warranty
extension Few minutes Few minutes Few minutes
6.2 FIELD TECHNICAL ASSIS TANCE
Saccani et al. (2007) have described field technical assistance as the assistance provided from
seller to buyer where the buyer can receive encompassing installation, warranty work as well
as out-of-warranty repairs, product disposal and check-ups. The field technical assistance
activities differed for each of the investigated cases. As Russell (2008) states in his article,
outsourcing of field technical assistance occurs as a consequence of the activity being highly
time and cost consuming; this is the case of Company C since it handles all after-sales
activities for a huge manufacturer. Company C is the only after-sales provider of the
mentioned manufacturers’ products in Sweden. Thus, the reputation of the manufacturer and
Company C is closely related. Armistead and Clark (1991) mentions that outsourcing is
favored by companies that needs to serve a large and geographical scattered service volume.
Company C, which serves one of the largest manufacturers in their market fits in this
description since the huge manufacturer is well known and has established a global brand and
therefore, needs to serve a large and geographical scattered service volume.

56
6.2.1 CHECK-UP S
Company B executes the field technical assistance activities themselves, Company C
conducts it as an outsourced organization itself, whereas Company A allows their contracted
distributors to take care of the check-up activities (see table 11). Company B and C are a
good example of what Russell (2008) describes as what a customer expects from a business-
to-business seller. It has a high level of availability; since the companies are selling highly
technical machines the buyer might encounter issues that need to be fixed fast. Company B
takes care of all its field technical assistance as well as check-ups, it is stated in the interview
that the company prefers taking care of check-ups and field technical assistance themselves in
order to take full responsibility of their products and build a close relationship with its
customers.
TABLE 11: CHECK-UPS
Check-ups
Case A Case B Case C
Provision of check-ups
Distributors are
responsible for check-
ups. Company A
discusses with
distributors through
telephone for updates.
Provides check-ups
themselves
Reactive as well as
proactive check-ups
Frequency of check-ups -
First check-up after
500 hours of operating
the machine. Second
check-up at 1000
hours and less
frequent after that.
Customers are
contacted via phone in
case of specific
assistance or large
reparation is made.
Frequent visits by
technicians
The companies also differ on how frequent they provide check-ups, since Company A, or the
small size enterprise, does not provide the check-ups themselves, they have telephone contact
with its distributors to get an idea of the situation. Company B, the medium size enterprise,
has a more established way of supplying check-ups, the customer will receive check-ups after
the machine has been used 500 hours and then after 1000 hours. Company C or the large size
enterprise has no established way of providing check-ups; however the company has

57
technicians continuously working at site and is able to provide check-ups if the customer
requests it. Additionally, Company C has a routine of calling the customer after large
reparations are made. This again indicates the proactive approach of the large size
organization.
6.2.2 DURIN G AN D AFT ER W ARR ANT Y ASSI ST ANCE
As Chien (2007) stated the main purpose of warranty is to provide an after sale remedy for the
customer when a product fails to meet its intended achievement during a certain period.
During the stated period, the manufacturer is obligated to ensure orderly functioning of the
product (Bischke & Murthy, 1992). In the heavy equipment machinery industry, the average
warranty period is around one year where all costs are covered according to the studied cases.
Table 12 presents a summary of during and after warranty assistance of the studied cases.
Since the large organization had extensive choice of warranties, the warranty period could be
arranged up to 5 years which is half of the entire product lifecycle of their machines.
However, contracting the 5 year warranty is very unusual since it is expensive to purchase
from the customer’s side.
TABLE 12: DURING AND AFTER WARRANTY ASSISTANCE
During and after warranty assistance
Case A Case B Case C
Warranty features
- All costs are covered
by company A.
- There is a single
type of warranty
which is based on
time limit.
- The company aims
to provide assurance
that the purchased
machine will not stop
working.
- All costs are covered
by company B.
- The warranty can
differ depending
hours of usage of the
machine per week.
- Very extensive
warranties
- Field technical
assistance provided is
product demonstration
at customers’ location
after purchase.
Providing warranties is very costly for manufacturers (Chien, 2007). Thus, the resources of
the organizations may have a significant role when providing warranties and other field
technical assistance. This can be derived from the fact that the small organization outsourced
its field technical assistance to their distributors and that the large organization had drastically
more warranties and agreements compared to the smaller ones. The organizations have to

58
calculate if they can realistically afford providing the services throughout the warranty time
(Chien, 2007). Hence, smaller organizations might realize in their calculations that they are
financially in disadvantage to provide extensive warranties.
6.2.3 PRO DUCT DI SPO S AL
All companies still have machines running from the start of establishment; this goes back to
the sixties for some companies. However, most of those machines do not have available spare
parts anymore; since it is difficult to determine the production of spare parts for old and
possibly obsolete machines which is also argued by Kennedy et al. (2002). The machines
traded currently are estimated to have a product lifetime of 10 to 15 years for all
organizations.
Company A offers no product disposal service; instead they forward their customers to
different waste management organizations. Company B and C offer product disposals; they
would fix the machines and sell them again or reuse the parts that are still functioning.
Nevertheless, product disposal seem to be not a crucial activity in heavy equipment
machinery industry since all cases were convinced that the used machines have high second
hand value which the customers can easily take advantage of. Table 13 presents a summary of
each case regarding product disposal.
TABLE 13: PRODUCT DISPOSAL
Product disposal
Case A Case B Case C
Average product lifetime
10-15 years. But there
is subcategory of
machines which are
not used daily where
the average lifetime is
25 years.
15 years. But,
machines from 1980s
are still working.
10 years. Changing
environmental policy
affects considerably.
Product disposal service No product disposal
service offered
The old products are
bought back and fixed
for reselling.
The old products, that
are working, are
bought back and fixed
for reselling.
6.3 SPARE PARTS DISTRIBUT ION

59
Spare parts distribution includes activities related with inventory management, customer order
management and delivery of spare parts (Saccani et al., 2007). It is crucial function for
customers, throughout the consumption of a product (Gopalakrishnan & Banerji, 2004). The
provider has to decide on what kind of level they want to distribute their spare parts, central
warehouse, stockiest, regional warehouses, field warehouses, retail outlets and dealers (ibid);
these decisions varied case by case as elaborated in the following sections.
6.3.1 INV ENTO RY MAN AGEMENT
From table 14, it is visible that the number of warehouses as well as repair centers increases
relative to the size of the company which is not to a surprise. For all cases, it was their
distributor network which determined the number of warehouses and repair centers. However,
the medium sized organization has a central warehouse with large number of spare parts,
along with smaller warehouses that their distributors have in different locations in Sweden.
The company is aware of the importance of holding spare parts inventory as explained by
Kennedy et al. (2002); thus they have introduced a thorough enterprise resource system for
their central spare parts warehouse.
TABLE 14: INVENTORY MANAGEMENT
Inventory management
Case A Case B Case C
Number of warehouses 15 18-22 42
Location of warehouses In 15 different cities
around Sweden.
All around Sweden,
the main one in
Ljungby
All around Sweden
Number of repair centers 2 18-22 42
Location of repair centers Gothenburg and
Stockholm
All around Sweden,
the main one in
Ljungby
All around Sweden
The main purpose with spare parts distribution is considered as ensuring the right availability
of spare parts at the right time for the customers’ needs (Gopalakrishnan & Banerji, 2004).
While, warehouses and repair centers can represent the ease of access or ‘availability’, well-

60
organized delivery can indicate the ‘right time’ perspective which is discussed in the next
section.
6.3.2 DELIV ER Y OF SP AR E P AR TS
Cohen and Lee (1990) highlighted that the automobile manufactory is an industry where
delivering spare parts quickly is a key aspect of their after-sales services. In the investigated
cases in heavy equipment machinery industry, the average speed of delivery is similar
between small and medium sized firms whereas the large firm’s delivery takes around one
day more. This may relate to the high number of customers they have to serve every day as
well as the complexity of their supply chain since they might need to contact the producer
which lengthens the transactions. The two interviewees from Company C had different ideas
of the delivery fee. While the customer care respondent was convinced that the company itself
pays all delivery costs, the spare-parts manager informed us that the customers pay for it. The
manager’s answer was regarded valid in the analysis, as shown on table 15, since a spare-parts
manager should possess more knowledge and overview over the spare parts delivery process.
TABLE 15: DELIVERY OF SPARE PARTS
Delivery of spare parts
Case A Case B Case C
Average speed of delivery 1-24 hours
If ordered before
14.00 – delivery on
the same day
If ordered after 14.00
– delivery on the next
day
Average of 2 days
Delivery fee
The customers pay the
delivery costs unless it
is stated otherwise in
the contract.
Company B usually
pays the delivery until
the carrier and the
customers pay for the
costs from carrier to
their location, unless
it is stated otherwise
in the contract.
The customers pay for
the delivery costs.
Customers can also
directly pick up at the
office.
6.4 CUSTOMER RELATIONSHIP MARKETING

61
6.4.1 SERVI CE QUALIT Y
For survival in a competitive business environment, quality guarantee and extended service
programs are essential strategies for success, driving the customer’s perception of a
company’s product in the right direction (Takeuchi & Quelch, 1983; Reichheld & Sasser
1990; Zeithaml et al., 1990). For a company that offers customer service, it has the means for
tailoring a company’s offerings to the needs and desires of its customers (Asugman et al.,
1997). In all three of the cases, the goal of providing after-sales service seemed fairly evident
for the respondents, it is to satisfy customers’ needs and demands. Case A and B particularly
considered after-sales to be the main mission of their work, with the goals of satisfying the
customer requirements after purchase and to maintain the customer until the next purchase of
a new machine.
Poor customer service can quickly contradict the advantages associated with a product offer
of superior quality (Gaiardelli et al., 2007); therefore, the companies need to apply superior
service quality to stay competitive. Measuring the service quality comprised questions related
to delayed deliveries, defective product deliveries, and inaccurate deliveries which are
presented in table 16. It can be observed that, in all the three cases, there was lack of accurate
measurement on the frequency of delayed, defective or inaccurate delivery occurrences.
Delayed deliveries were expressed to be out of the companies’ hands, the faultiness occurs
with the suppliers or the carriage companies. However, the defective product delivery was
expressed more clearly by the three case studies, further concrete answers were given. Maybe
that is because defective products need to be investigated and taken records of, whereas
inaccurate deliveries and delayed deliveries already have a known reason. Negative incidents
such as poorly handled complaints and inadequate communication with customers, may lead
to lack of trust which impacts on the relationship (Bejou & Palmer, 1998). This argument is
being considered by all the three companies, since their aim is to solve any sort of problem as
fast as they can; nevertheless, no policy on speed or procedure exist in when and how to solve
the complaints.

62
TABLE 16: SERVICE QUALITY
Service Quality
Case A Case B Case C
Goal with after-sales
Doing a good job in
providing after-sales
means doing half the
effort in selling a new
machine.
Selling the product is
not a difficult task, the
real mission starts
when the product has
been sold.
To get satisfied
customers, and to live
up to the customers’
demands.
Frequency of delayed
deliveries
Not measured,
however, it occurs,
but usually not under
the company’s
control.
Not measured,
however, it occurs,
but usually not under
the company’s
control.
Not measured,
however, delays occur
due to the suppliers.
Frequency of defective
product delivery
Not measured, but
estimation is 20 times
per year.
Occurs in regular
intervals, however,
usually caused by
products from their
suppliers and not the
products that
Company B
produces.
Approximately once
per week.
Frequency of inaccurate
deliveries
Not measured, but it
occurs and usually
due to
misinterpretations or
customers have
ordered the wrong
parts.
Not measured, but it
occurs due to the
many types of
machines, consisting
of different parts and
features.
Approximately once
per week. Reasons
vary, it could be due
to the human factor,
computer defaults or
supplier’s inaccurate
deliveries to company
C.
6.4.2 CUS TO MER R ELATIONS HIP P RO FIT ABI LI TY
From a firm’s point of view, the financial outcome of a customer relationship through service
quality improvements is resulting in that service management and perceived service quality
are tied together with relationship marketing (Storbacka et al., 1994). As shown on table 17,
the estimated profit from after-sales proved to be a rather difficult question for the

63
respondents to answer. There was no concrete answer regarding the estimation on profit made
on after-sales activities; however, case B and C were aware, even though no actual calculation
is made, that the after-sales activities comprise a huge part of the overall profit.
Since Storbacka et al. (1994) claim that service management and perceived service quality
affects the financial outcome on customer relationship, the successfulness of the service
quality should be able to be measured based on profitability. However, the lack of record and
calculation on the profitability on after-sales services may point to that after-sales service
activities influence the customer profitability in a satisfactory way while the perceived service
quality might be questionable. Customer relationship profitability may be in focus; however,
the service quality improvements may not be in such focus since there are no signs of
structured ways of keeping track of negative incidents that impacts perceived service quality.
Rust and Zahorik (1993)’s chain of impacts regarding service quality’s impact on satisfaction,
satisfaction’s impact on customer retention and customer retention impacts on profitability
has been measured in terms of methods of placing order and backordered availability. The
methods available for placing an order varies slightly, in case A and B the methods are similar
and the most common method is also the same, namely e-mail and online. In case C, the
largest company of all cases, have an established e-commerce service providing the
possibility for customers to order their products/spare parts according to their own schedule
and preference.
The frequency of backordered items was answered differently by the three companies. It
seems as if Company A and B mostly manage their orders instantly, the frequency is seldom,
while Company C view the frequency of backordered items as something unpredictable, it
could happen every day depending on the case. To get the order available is yet again hard to
predict; it all depends on what is ordered by the customer. It can take some time if the ordered
items are no longer in production or the supplier has reduced items in the warehouses and so
forth. Company C answered with 1 day – months, while Company A could not give a tangible
answer than as soon as possible.

64
TABLE 17: CUSTOMER RELATIONSHIP PROFITABILITY
Customer Relationship Profitability
Case A Case B Case C
Method of placing orders Telephone, personal
meetings, and online
Telephone, personal
contact at the factory
location and E-mail
Telephone and e-
commerce
Common method of
placing orders Online E-mail
Telephone and e-
commerce
Frequency of items
backordered
Company A is able to
cover 85% of the
requested orders
directly
Items backordered
happen seldom Can happen everyday
Average backorders days
No average
backordered days, the
company’s aim is to
provide missing parts
as soon as possible
-
Depends on the case.
Usually it is 1 day, but
could take up to 1
month if the parts are
not in product
selection anymore.
Estimated profit from after-
sales services
Not calculated and no
estimation could be
given.
Not calculated but it is
considered to be a
huge part of the
overall profit.
Spare parts
distribution generates
the largest part of the
after-sales activities.
The repair shop
department makes the
least profit.
After-sales influence on
customer relationship
Extremely important.
If the company can
assure the customer
that they get what
they need in order to
avoid the machine to
stand still, the
customers will come
again.
Certainly after-sales
influence the
relationship, to the
extent that the
customers will change
brand if not handled
correctly. In such
intense industry,
customers need to be
nurtured.
After-sales influence
the relationship to the
extent that customers
will switch to
competitors and
furthermore, influence
the reputation of the
company.

65
All three companies expressed its view point on the impact after-sales services have upon the
relationship with its customer. The vision point is considered severe. When customers have
bought a machine it is also expected to be running so that they can continue their business, if
Company A cannot make sure of it, they will potentially lose their customer. Company B,
explicitly mentioned that their customers can potentially change the brand of the next machine
if the relationship is not nurtured soundly. Company C believes that the customer will go over
to the competitors and create a bad reputation of Company C if not handled correctly. Thus,
the awareness of the importance of providing high quality service indicates that the companies
consciously try to structure their after-sales services in a way that will satisfy their customers.

66
7. CONCLUSIONS AND IMPLICATIONS
The final chapter presents the findings and conclusions of this qualitative case study. The four
research questions are answered in the discussions section where each research question is
discussed individually. The chapter moves on with managerial implications and theoretical
contributions as well as limitations. Finally, this thesis ends with suggestions for future
research.
7.1 DISCUSSIONS
This thesis has focused on studying after-sales services and customer relationship marketing
in the Swedish heavy equipment machinery industry. The purpose of the study was to
investigate the major activities of after-sales service focusing on customer relationship among
different sizes of after-sales service providers. The research questions formulated in order to
meet this purpose are answered in the preceding sections.
7.1.1 CUS TO MER CAR E
RQ1. How is customer care executed in the Swedish heavy equipment machinery industry
among organizations of different sizes?
This study suggests that customer care is the most focused activity of after-sales services in
the heavy equipment machinery industry in Sweden. Simultaneously, it shows the most
significant differences of offers, depending on the size of the company, in relation to the
remaining two activities.
Technical and commercial information provision is progressively more complex when the
size of the organization increases, especially regarding the utilization of internet as an
additional customer touch point. Moreover, when the size of the company is bigger, they
focus on availability and have more structured and effective way of responding to customers.
Complaint management is settled in a proactive way in large size organization while there is a
reactive approach applied by medium and small size organizations. Large organizations have
a variety of options regarding warranties in comparison to small and medium sized firms.
However, in this particular industry, the warranty extension possibilities are restricted for

67
medium and large firms while the small firm is more flexible, thus can extend some
components of their warranty in case a customer highly desires.
It can be concluded that customer care is executed on relatively similar levels for small size
and medium size companies while large organizations have more structured and advanced
procedures. Regardless of firm size, the after-sales employees had equal responsibilities to
provide customer care in case it is needed, since there seem to be no assigned contact persons
for certain customers in the industry. Availability is a crucial aspect of customer care which
all size organizations focused on; but, the large size organization seem to take it one step
further.
7.1.2 F IELD T ECHNI CAL ASSI S T AN CE
RQ2. How is field technical assistance executed in the Swedish heavy equipment machinery
industry among organizations of different sizes?
Field technical assistance appears to be the part of after-sales that produced least profit in
heavy equipment machinery industry. Thus, it might be the reason that small organizations
would rather tend to outsource it, in order to avoid high costs.
Medium and large organizations provided check-ups for their customers themselves. The
medium sized organization has a pre-planned procedure for providing field technical
assistance. However, the large organization’s approach is one step ahead due to its proactive
nature; problems are discovered before they occur. The warranty features become more
extended and complex relative to the firm size; this could suggest that the high costs of
providing warranties make it problematic for smaller organizations to offer advanced
warranties to their customers. Product disposal is not a crucial service for the customers in the
industry, since the used machines and spare parts still have high second hand value.
Nevertheless, the medium and large sized organizations offer to buy the machines back from
the customers for repairing and reselling. The product lifetime of currently produced heavy
equipment machines are estimated to be 10-15 years. However, there are machines that are
still functional for 30-50 years. Since the machines are long-term investments for customers,
field technical assistance is important to support and assist the customers throughout the
usage of the product.

68
7.1.3 SPAR E P ART S DI S TRI BUT IO N
RQ3. How is spare parts distribution executed in the Swedish heavy equipment machinery
industry among organizations of different sizes?
Spare parts distribution can be considered as the most profitable activity of after-sales. The
warehouses and repair centers of companies naturally varied according to firm sizes. In order
to meet customer demand, the warehouses and repair centers are located all around Sweden,
especially in the bigger cities. The location of the warehouses as well as internal
communication systems can influence the delivery time of spare parts to customers. The
delivery time for all sizes of companies is around 1-2 days if they have the product in stock.
The circumstance for the large size company is rather complex since they have to order the
product from the producer and the producer might need to contact their suppliers; thus,
complication the material and information flow. Costs related with the delivery are usually
covered by the customers in this industry; however, the medium size company investigated in
this study might be an exception since they paid around half of the delivery fee. The
organizations all have introduced additional options, such as express delivery, direct pick-up
or including delivery fee agreement in the initial product purchase contract. A considerable
advantage that the large organization offers is to have additional half an hour open time for
their spare parts distribution department until 16.30. It is a beneficial option for customers
who finish their work at 16.00 where they can get their spare parts after work to be set for
work the next day. This may be a point that the smaller organizations might catch up on.
7.1.4 CUS TO MER R ELATIONS HIP MARK ETI NG
RQ4. How do after-sales services contribute to customer relationship marketing in the
Swedish heavy equipment machinery industry among organizations of different sizes?
Although the organizations do not have formal goals for providing after-sales to its customers,
they understand its importance and aim for meeting customer demands.
The organizations do not have accurate measurements for delayed, inaccurate or defective
product deliveries. However, they are aware of the incidents, especially when it comes to
defective product deliveries; they are able to identify the cause of the problem. In the industry
of heavy equipment machinery, it is not usual to calculate the exact income created by after-
sales services, even though, it is a common statement among industry professionals that it is a
significant part of the profit.

69
Since perceived service quality and customer profitability are directly related with customer
relationship marketing, this study shows that the customer profitability is satisfactory while
the perceived service quality might be questionable. The organizations do not apply any
structured way of keeping track of negative incidents that impacts perceived service quality.
All organizations are convinced that if after-sales services are not handled properly, they face
the risk of losing the customer. Thus, the awareness of the importance to provide high quality
after-sales services, the services are consciously structured by the companies, consequently
after-sales services contribution to customer relationship marketing in different sizes are equal
no matter the size of the company. Moreover, this research indicates that organizations in this
industry have a lot of room for improvements which can be accomplished in strategic and
systematic ways.
7.2 THEORETICAL AND MANAGERIAL IMPLICATIONS
This study comprised the theoretical framework of customer care, field technical assistance,
spare parts distribution and customer relationship marketing. The purpose was to gain deeper
understanding of each concept and their relations in terms of firm size. This thesis makes
theoretical contributions based on testing the previous studies in a different context and
perspective. Some theoretical contributions were acknowledged and some were not
recognized in the studied context.
The basic principles set by Levitt (1983) coincide with the study results. After-sales service is
a way of creating relationship with returning customers. Armistead and Clark (1991)
suggested that large organizations tend to outsource due to their geographical dispersed
service volumes. It was correct in the case of large sized company that was studied, but, the
small organization also outsourced the field technical assistance to their distributors. It is
probably related to the high costs of executing field technical assistance as suggested by
Bryce and Useem (1998). Regarding spare parts distribution, Gopalakrishnan and Banerji
(2004) have brought up conclusions that correlate with the outcome of this study such as large
turnover ratio, many customers’ demands, large number of spare parts, right availability of
spare parts, stability and steadiness of spare parts distribution. This further on relates to
customer relationship marketing since many of those qualities relate to customer satisfaction.
Certain previous research results were not applicable in the context investigated. In the
studied industry, customer care has not advanced to managing relationship with key accounts
and providing financial advice as Kantsperger and Kunz (2005) suggested. There are still in

70
the level of providing information and handling orders; they need time to develop and shift to
the higher level of customer care. Crawford (1993) claimed that large organizations benefit
from advanced systems in comparison to smaller organizations. However, in the studied
context, all large, medium and small organizations had relatively similar computing systems.
Several managerial implications can be suggested based on the findings of this research.
After-sales services do influence customer relationship to a significant level and it can be
enhanced through effectively managing the after-sales service operations. The following
suggestions might bring after-sales service providers a step closer to achieving better
understanding and utilizing after-sales to its full extent.
As this research showed, the three activities of after-sales service were not equally
focused. Customer care had the most focal point of all the activities followed by spare
parts distribution and field technical assistance. Organizations are recommended to
keep balance between the activities since their importance is equal and each one has
its significant role in customer relationship.
In case the organization has decided to carry over certain after-sales activities to their
distributors, more awareness of their work is needed. Even when the distributors are
conducting certain activities, they are representing the manufacturer. Thus, managers
should have in any case general overview of the service provided to their users.
As the study showed, there are no defined key accounts in this industry. It could be a
useful step for organizations to identify their key accounts in order to offer the very
best service to their most valuable customers. Key account management would also
contribute to a more structured way of handling orders, requests, complaints and so
forth.
Managers could align workers so that they are aware of the organizational goals and
have the attitudes towards the services. In one of the cases, two respondents from one
company were interviewed according to the same interview guide and they have
answered differently. The suggestion is to align the workers so that they all have the
same ideas and perceptions of what is happening in the organization. When customers
contact the organization, they should be able to get the same answer regardless who
they ask, this will in return create communion among the employees.
The distributors might have difficulties to work efficiently due to the complex
relationship with manufacturers as in case C studied in this research. More efficient

71
supply chain management should be applied in order to create steadiness and stability
with the orders. Additionally, a more effective approach should be considered
regarding deliveries to overcome the more complex supply chain with distributors.
In the heavy equipment machinery industry, there are little formal policies and
regulations when it comes to after-sales activities. Organizations could introduce
policies in order to get a step closer to a structured and effective way of providing
after-sales services. For all employees especially newly hired, they need guidelines to
follow. No objectives are formalized but there are certain internal goals, having it on
paper might enhance the structure and clearness of the organizational targets.
7.3 LIMITATIONS
Overall, the limitations that were experienced throughout the study were those connected to
the qualitative approach the study had. Because a qualitative approach was chosen, no
generalization could be made for the industry from the research results. Due to the low
number of case studies made, there were difficulties to find suitable respondents for the study;
the limited time made it even more important to find respondents that could participate
immediately. Even though a generalization of the study cannot be made, the aim for this study
was to gain knowledge and depth within the area of after-sales services among heavy
equipment machinery organizations in Sweden and this was achieved by carrying out in-depth
interviews among organizations within the chosen industry with different sizes.
Another difficulty encountered was that there were limited previous studies related to the
three main activities within after-sales services (Saccani et al., 2007). This made the study
restricted to only a few sources, sources which could not be generalized either.
Relevant measures of key concepts were also limited, in return making it difficult to conduct
an operationalization of the study, but it motivated to further investigate the concepts.
The interviews were rather short, although precautions such as pretesting by experts and
managers were taken. The interview guide was sent to the respondents in advance in order for
them to give coherent and elaborate answers. The short interviews could be caused by the
respondent’s lack of the overall view of the organization. The interview involved questions
that touched upon different areas of expertise of the after-sales service departments within an
organization, in one case, the customer care respondent experienced a challenging stage
answering questions involving spare parts distribution, since he/she was not involved in their
work nor had knowledge about the area.

72
7.4 SUGGESTIONS FOR FUTURE RESEARCH
Several suggestions for future research are presented below, for researchers who are interested
in investigating the three main activities of after-sales services and its relation to customer
relationship marketing.
A similar research can be conducted taking the customers’ perspective into
consideration, in order to describe the impact of after-sales on customer relationship
more accurately and comprehensively. With a sufficient level of resources, this kind of
investigation would study both sides of the buyer and seller relationship.
With the limitations of this research in mind, a suggestion is to decide on a
quantitative research method on this topic since it can cover larger sample of
organizations where more general conclusions can be drawn.
Future researchers can study and develop the theory of three activities of after-sales
services by investigating other industries and discovering different aspect to it. Since
this study as well as previous academic researches has pointed out the significance of
after-sales services in manufacturing industries.
Finally, we suggest that the future researchers take the investigated research model
and implement it in a new context. As a suggestion, in a different demographic
location or culture, in order to subsequently make a comparison among the different
locations and cultures that has been studied previously.


73
REFERENCE LIST
Adler E. S. and Clark R. (2010) “An Invitation to Social Research: How It’s Done” 4th
ed.,
Cengage Learning, Belmont, CA.
Alvarez L. S., Casielles R. V. and Martin, A. M. D. (2011) “Analysis of the role of complaint
management in the context of relationship marketing” Journal of Marketing Management, 27
(1-2), pp. 143-164.
Anderson J. C. and Narus J. A. (1995) “Capturing the value of supplementary services”
Harvard Business Review, 73 (1), pp. 75-83.
Armistead C. and Clark G. (1991) “A framework for formulating after-sales support strategy”
International Journal of Operations and Production Management, 11 (3), pp. 111-124
Asugman G., Johnson J. L. and McCullough J. (1997) “The role of after-sales service in
international marketing” Journal of International Marketing, 5 (4), pp. 11-28.
Babbie E. (2009) “The Practice of Social Research” 12th
ed., Cengage Learning, Belmont,
CA.
Bailey C. A. (2007) “A guide to Qualitative Field Research” 2nd
ed., Pine Forge Press,
Thousand Oaks.
Bejou D. and Palmer A. (1998) “Service failure and loyalty: an exploratory empirical study of
airline consumers” Journal of Services Marketing, 12 (1), pp. 7-22.
Bell J. (2010) “Doing your Research Project” 5th
ed., McGraw-Hill Professional Publishing,
Berkshire.
Belz C., Schuh G. Groos S. A. and Reinecke S. (1997) “Industrie als Dienstleister”, Thexis,
St. Gallen.
Bendapudi N. and Berry L. L. (1997) “Customers’ motivations for maintaining relationships
with service providers” Journal of Retailing, 73 (1), pp. 15-37.
Berry L. L. (1995) “Relationship marketing of services – growing interest, emerging
perspectives” Journal of the Academy of Marketing Science, 23 (4), pp. 236-245.
Berry L. L. (1999) “Discovering the Soul of Service” The Free Press, New York, NY.

74
Berry L. L. (2000) “Relationship marketing of services – growing interest, emerging
perspectives” in Sheth, J. N. and Parvatiyar A. (Eds), Handbook of Relationship Marketing,
Sage Publications, London.
Beverland M. and Lindgreen, A. (2004) “Relationship use and market dynamism: A model of
relationship evolution” Journal of marketing management, 20 (7-8), pp. 825-858.
Bienstock C. C., Mentzer J. T. and Bird M. M. (1997) “Measuring physical distribution
service quality” Journal of the Academy of Marketing Science, 25 (1), pp. 31–44.
Blischke W. R. and Murthy D. N. P. (1992) ‘‘Product warranty management: a taxonomy for
warranty policies’’ European Journal of Operational Research, 62 (2), pp. 127-148.
Bonaccorsi A. (1992) “On the relationship between firm size and export intensity” Journal of
International Business Studies, 23 (4), pp. 605-635.
Boyatzis R. E. (1998) “Transforming Qualitative Information” Sage Publications, London.
Boyt T. and Harvey M. (1997) “Classification of industrial services: A model with strategic
implications” Industrial Marketing Management, 26 (4), pp. 291-300.
Brashear T. G., Boles J. S., Bellenger D. N. and Brooks C. M. (2003) “An empirical test of
trust-building processes and outcomes in sales manager-salesperson relationships” Journal of
the Academy of Marketing Science, 31 (2), pp. 189-200.
Brax S. (2005) “A manufacturer becoming service provider – challenges and a paradox”
Managing Service Quality, 15 (2), pp. 142-155.
Bryce D. and Useem M. (1998) “The impact of corporate outsourcing on company value”,
European Management Journal, 16 (6), pp. 635-643.
Bryman A. and Bell E., (2007) “Business Research Methods” Oxford University Press, New
York, NY.
Bryson J. R. and Daniels P. W. (2007) “Handbook of Service Industries”, Edward Elgar
Publishing Limited, Cheltenham.
Bundschuh R. G. and Dezvane T. M. (2003) “How to make after sale services pay off” The
McKinsey Quarterly, 4 (2), pp. 116-127.

75
Cannon J. P. and Perreault Jr. W. D. (1999) “Buyer-seller relationships in business markets”
Journal of Marketing Research, 36 (4), pp. 439-460.
Cavalieri S., Gaiardelli P. and Ierace S. (2007) “Aligning strategic profiles with operational
metrics in after-sales service” International Journal of Productivity and Performance
Management, 56 (5), pp. 436-455.
Celuch K. G., Bantham J. H. and Kasouf C. J. (2006) “An extension of the marriage
methaphor in buyer-seller relationships: An exploration of individual level process dynamics”
Journal of Business Research, 59 (5), pp. 573-581.
Chien Y. H. (2007) “Determining optimal warranty periods from the sellers perspective and
optimal out-of-warranty replacement age from the buyer’s perspective” International Journal
of Systems Science, 36 (10), pp. 631-637.
Christopher M. Payne A. and Ballantyne D. (2002) “Relationship marketing: creating
stakeholder value” Butterworth-Heinemann, London.
Clayman S. E. and Gill V. T. (2004) “Conversation Analysis” in Hardy M. and Bryman A.
(Eds), Handbook of Data Analysis, Sage Publications, London.
Cohen M. A. and Lee H. L. (1990) “Out of touch with customer needs? Spare parts and after
sales service” Sloan Management Review, 31 (2), pp. 55-66.
Colgate M.R. and Danaher P.J. (2000) “Implementing a customer relationship strategy: The
asymmetric impact of poor versus excellent execution” Journal of the Academy of Marketing
Science, 28 (3), pp. 375-387.
Cowton C. J. (1998) “The use of secondary data in business ethics research” Journal of
Business Ethics, 17 (4) pp. 423-434.
Crawford M. C. (1993) “New Products Management” 4th
edition, Irwin Publishing, Boston.
Creswell J. W. (2003) “Research Design: Quantitative, Qualitative and Mixed Methods
Approaches” 2nd ed., Sage Publications, Thousand Oaks, CA.
Crosby L. A. (1989) “Building and Maintaining Quality in Service Relationship” in Quality in
Services, Brown S. W. and Gummesson E. (eds), Lexington Books.
Crosby L. A., Evans K. R. and Cowles D. (1990) “Relationship quality in services selling: an
interpersonal influence perspective” Journal of Marketing, 54 (3), pp. 68-81.

76
Davies M. B. (2007) “Doing a Successful Research Project: Using Qualitative or Quantitative
Methods” Palgrave Macmillan, New York, NY.
Davies, A. (2003) “Are firms moving ‘downstream’ into high-value services?”, in Tidd, J. and
Hull, F. M. (Eds), Service Innovation, Series on Technology Management, Imperial College
Press, London.
Day G. S. and Wensley R. (1988) “Assessing advantage: a framework for diagnosing
superiority” Journal of Marketing, 52 (2), pp. 1-20.
de Brentani U. (1995) “Firm size: implications for achieving success in new iundustrial
services” Journal of Marketing Management, 11 (1-3), pp. 207-225.
Dhawan S. (2010) “Research Methodology for Business and Management Studies” Global
Media, Dheli.
Dwyer R. F., Schurr P. H. and Oh S. (1987) “Developing buyer-supplier relationships”
Journal of Marketing, 51 (2), pp. 11-27.
Dyson S. and Brown B. (2005) “Social Theory and Applied Health Research” McGraw-Hill
Professional Publishing, Berkshire.
Earl M. and Kahn B. (1994) “How new is business process redesign?” European
Management Journal, 12 (1), pp. 20–30.
Ehinlanwo O. O. and Zairi M. (1996) “Best practice in the car after-sales service: An
empirical study of Ford, Toyota, Nissan and Fiat in Germany - Part 1", Business Process Re-
engineering and Management Journal, 2 (2), pp. 39-56.
Eliasson A. (2010) “Kvantitativ Metod från Början”, Studentlitteratur AB, Lund.
Eriksson L. and Wiedersheim-Paul F. (2011) ”Att utreda Forska och Rapportera” Liber,
Malmö.
Ettorre B. (1994) “Phenomenal promises that mean business” Management review, 83 (3), pp.
18-23.
Fischer M. D. (1994) “Applications in Computing for Social Anthropologists” Routledge,
London.

77
Fornell C. (1992), “A national customer satisfaction barometer: the Swedish experience”,
Journal of Marketing, 56 (1), pp.6-21.
Frankfort-Nachmias C. and Nachmias D. (1992) “Research Methods in the Social Sciences”,
Edward Arnold, London.
Frey J. H. and Oishi S. M. (1995) “How to conduct interviews by telephone and in person”
Sage Publications, Thousand Oaks.
Gadiesh O. and Gilbert J. L. (1998) “Profit pools: a fresh look at strategy” Harvard Business
Review, 76 (3), pp. 139-147.
Gaiardelli P., Saccani N. and Songini L. (2007) “Performance measurement of the after-sales
service network- Evidence from the automotive industry” Computers in Industry, 58 (7), pp.
698-708.
Garcia-Quevedo J., Mas-Verdu F. and Montolio D. (2013) “What types of firms acquire
knowledge intensive services and from which suppliers” Technology Analysis and Strategic
Management, 25 (4), pp. 473-486.
Gebauer H., Fleisch E. and Friedli T. (2005) “Overcoming the service paradox in
manufacturing companies” European Management Journal, 23 (1), pp. 14-26.
Ghauri P. and Grønhaug K. (2005) “Research Methods in Business Studies: A Practical
Guide” 3rd
ed., Pearson Education Limited, Harlow.
Goffin K. and New C. (2001) “Customer support and new product development”
International Journal of Operations and Production Management, 21 (3), pp. 275–301.
Gopalakrishnan P. and Banerji A. K. (2004) “Maintenance and spare part management”
Prentice Hall of India, New Delhi.
Granot E., Brashear T. G. and Motta P. C. (2012) "A structural guide to in-depth interviewing
in business and industrial marketing research" Journal of Business & Industrial Marketing, 27
(7), pp. 547 – 553.
Gray D.E. (2009) “Doing Research in the Real World”, 2nd ed, Sage Publications, London

78
Grönroos C. (2000) “Service management and marketing a customer relationship
management approach” 2nd
edition, John Wiley, Chichester.
Gummesson E. (1998) “Implementation requires a relationship marketing paradigm” Journal
of the Academy of Marketing Science, 26 (3), pp. 242-249.
Gummesson E. (2002) “Relationship marketing in the new economy” Journal of Relationship
Marketing, 1 (1), pp. 37-57.
Gutek B. A., Groth M. and Cherry B. (2002) “Achieving service success through relationships
and enhanced encounters” The Academy of Management Executive, 16 (4), pp. 132-144.
Gwinner K. P., Gremler D. D. and Bitner M. J. (1998) “Relational benefits in service
industries: the consumer’s perspective” Journal of the Academy of Marketing Science, 26 (2),
pp. 101-114.
Hammersley M. (1990) “Reading Ethnographic Research: A Critical Guide” Longmans,
London.
Hancock B., Ockleford E. and Windridge K. (2009) “An introduction to qualitative research”,
Available at: http://www.rds-sc.nihr.ac.uk/wp-content/uploads/2011/07/5_Introduction-to-
qualitative-research-20091.pdf
Heskett J. L., Jones T. O., Loveman G. W., Sasser Jr. W. E. and Schlesinger L. A. (1994)
“Putting the service profit chain to work”, Harvard Business Review, 72 (2) pp. 105-111.
Heskett J. L., Sasser Jr. W. E. Schlesinger L. A. (1997) “The Service Profit Chain” Free
Press, New York, NY.
Hopp W. J., Zhang R. Q. and Spearman M. L. (1999) “An easily implementable hierarchical
heuristic for a two-echelon spare parts” IIE Transactions, 31 (10), pp. 977-987
Hox J. J. (1997) “From Theoretical Concept to Survey Question” in Lyberg et al. (Eds),
Survey Measurement and Process Quality, Wiley, New York, NY.
Hunt S. D. and Morgan R. M. (1995) “The comparative advantage theory of competition”
Journal of Marketing, 59 (2), pp. 1-15.
Hunt S. D. and Morgan R. M. (1996) “The resource-advantage theory of competition:
dynamics, path dependencies and evolutionary dimensions”, Journal of Marketing, 60 (4), pp.
107-114.

79
Johansson P. (2006) “Adapting manufacturing strategy to industrial after-sales service
operations”, Doctoral Thesis, Institution of production economics, Linkoping University.
Johansson P. and Olhager J. (2004) “Industrial service profiling: Matching service offerings
and processes” International Journal of Production Economics, 89 (3), pp. 309-320.
Johnson P. and Buberley J. (2003) “Understanding Management Research: An Introduction to
Epistemology” Sage Publications, London.
Kahn A. (1995) “Kundvård” Liber-Hermods, Malmö.
Kandampully J. (2010) “Service quality to service loyalty: A relationship which goes beyond
customer services” Total Quality Management, 9 (6), pp. 431-443.
Kandampully J. and Duddy R. (1999) “Relationship marketing: a concept beyond primary
relationship” Marketing Intelligence and Planning, 17 (7), pp. 315-323.
Kantsperger R. and Kunz L. (2005) “Managing overall service quality in customer care
centers: Empirical findings of a multi-perspective approach” International Journal of Service
Industry Management, 16 (2), pp. 135-151.
Kelly S. and Scott D. (2012) “Relationship benefits: Conceptualization and measurement in a
business-to-business environment” International Small Business Journal, 30 (3), pp. 310-339.
Kennedy W. J., Pettersson W. J., and Fredendall L. D. (2002) “An overview of recent
literature on spare parts inventories” International Journal of Production Economics, 76 (2),
pp. 201-215.
Kimberly J. A. (1976) “Organizational Size and the Structuralist Perspective: A Review,
Critique and Proposal” Administrative Science Quarterly, 21 (4), pp. 571-597.
Laforet S. (2009) “Effects of size, market and strategic orientation on innovation in non-high-
tech manufacturing SMEs” European Journal of Marketing, 43 (1-2), pp. 188-212.
Laforet S. and Tann J. (2006) “Innovative characteristics of small manufacturing firms”
Journal of Small Business and Enterprise Development, 13 (3), pp. 363-380.
Lele M. M. (1997) “After-sales service: necessary evil or strategic opportunity?” Managing
Service Quality, 7 (3), pp. 141-145.

80
Levitt T. (1983) “After the sale is over” Harvard Business Review, 61 (5), pp. 87-93.
Liljander V. and Roos I. (2002) “Customer-relationship levels – from spurious to true
relationships” Journal of Services marketing, 16 (7), pp. 593-614.
Liljander V. and Strandvik T. (1995) “The nature of customer relationships in services” in
Swartz T. A., Bowen D. E. and Brown S. W. (Eds), Advances in Services marketing and
Management: Research and Practice, JAI Press Inc., London.
Loomba A. (1996) “Linkages between product distribution and service support functions”
International Journal of Physical Distribution and Logistics Management, 28 (2), pp. 143-
161.
Machlup F. (1978) “Methodology of economics and other social sciences” Academic Press,
London.
Matthyssens P., Vandenbempt L. and Berghman L. (2006) “Value innovation in business
markets: breaking the industry recipe” Industrial Marketing Management, 35 (6), pp. 751-
761.
May T. (2011) “Social research: Issues, methods and process” 4th
ed., McGraw-Hill
Professional Publishing, Berkshire.
Melcher J. (2012) “Process measurement in business process management: Theoretical
framework and analysis of several aspects”, KIT Scientific Publishing, Karlsruhe.
Miles M. B. and Huberman A. M. (1994) “Qualitative Data Analysis: An Expanded
Sourcebook” 2nd
ed, Sage Publications, London.
Morgan R. M. and Hunt S. D. (1994) “The commitment-trust theory of relationship
marketing” Journal of Marketing, 58 (3), pp. 20-38.
Mouton J. and Marais H. C. (1990) “Basic Concepts in the Methodology of the Social
Sciences” HSRC Publishers, Pretoria.
Neu W. A. and Brown S. W. (2005) “Forming successful business-to-business services in
goods-dominant firms” Journal of Service Research, 8 (1), pp. 3-17.
Oliva R. and Kallenberg R. (2003) “Managing the transition from products to services”
International Journal of Service Industry Management, 14 (2), pp. 160-172.

81
Orlitzky M. (2001) “Does firm size confound the relationship between corporate social
performance and firm financial performance?” Journal of Business Ethics, 33 (2), pp. 167-
180.
Pagano P. and Schivardi F. (2003) “Firm size distribution and growth” The Scandinavian
Journal of Economics, 105 (2), pp. 255-274.
Palmatier R. W., Dant R. P., Grewal D. and Evans K. R. (2006) “Factors influencing the
effectiveness of relationship marketing: A meta-analysis” Journal of Marketing, 70 (4), pp.
136-153.
Parasuraman A., Zeithaml V. A. and Berry L. L. (1985) “A conceptual model of service
quality and its implications for future research” Journal of Marketing, 49 (4), pp. 41-51.
Patelli L., Pelizzari M., Pistoni A. and Saccani N. (2004), “The after-sales service for durable
consumer goods: methods for process analysis and empirical application to industrial cases”,
13th
International Working Seminar on Production Economics, Innsbruck, Austria.
Pendapudi N. and Berry L. L. (1997) “Customers’ motivations for maintaining relationships
with service providers” Journal of Retailing, 73 (1), pp. 15-37.
Phopalia A. K (2010) “Modern Research Methodology: New Trends and Techniques”, Japiur,
India.
Prahalad C. K. and Hamel G. (1990) “The core competence of the corporation”, Harvard
Business Review, 68 (3), pp. 79-91.
Pun K. F. (2004) “A conceptual synergy model of strategy formulation for manufacturing”
International Journal of Operations and Production Management, 24 (9), pp. 903-928.
Punch K. (1998) “Introduction to Social Research: Quantitative and Qualitative Approaches”
Sage Publications, London.
Reichheld F. F. and Sasser Jr. E. W. (1990) “Zero defections: quality comes to services”
Harvard Business Review, 68 (5), pp. 105-111.
Ritchie J. and Lewis J. (2003) “Qualitative Research Practice: A Guide for Social Science
Students and Researchers” Sage Publications, London.
Robinson C. (2007) “How to do a Research Project- a Guide for Undergraduate Students”
Blackwell Publishing, Singapore.

82
Robson C. (2002) “Real World Research”, 2nd
ed., Oxford, Blackwell.
Rosenberg L. J. and Czepiel J. A. (1984) “A marketing approach to customer retention.”
Journal of Consumer Marketing, 1 (2), pp. 45-51.
Rowley J. (2002) “Using case studies in research” Management Research News, 25 (1), pp.
16-27.
Ruekert R. W. and Churchill G. A. (1984) “Reliability and validity of alternative measures of
channel member satisfaction” Journal of Marketing Research, 21 (2), pp. 226-233.
Russell B. (2008) “Call centers: A decade of research”, International Journal of Management
Reviews, 16 (6), pp. 635-643.
Rust R. T. and Zahorik A. (1993) “Customer satisfaction, customer retention and market
share” Journal of Retailing, 69 (2), pp. 145-156.
Saccani N., Johansson P. and Perona M. (2007) “Configuring the after-sales service supply
chain: A multiple case study” International Journal of Production Economics, 110 (1-2), pp.
52-69.
Saunders M., Lewis P. and Thornhill A. (2009) “Research Methods for Business Students” 5th
ed., Prentice Hall, Harlow.
Schmenner R. W. (1995) “Service Operations Management” Prentice Hall Inc., Englewood
Cliffs, NY.
Schuman D. (1982) “Policy analysis, Education, and Everyday life”, Heath, Lexington, MA.
Seale C. (1999) “Quality in qualitative research” Qualitative Inquiry, 5 (4), pp. 465-478.
Sheaves D. E. and Barnes J. G. (1996) “The fundamentals of relationships: an exploration of
the concept to guide marketing implementation” in Swartz T. A., Bowen D. E., Brown S. W.
(eds), Advances in Services Marketing and Management. Research and Practice, JAI Press
Inc., London.
Silverman D. (2010) “Doing qualitative research” 3rd
ed., Sage Publications, London.
Stake R. E. (2006) “Multiple case study analysis” The Guilford Press, New York, NY.

83
Statistics Sweden1 (2013)
http://www.scb.se/Grupp/Teman/Sveriges_Ekonomi/_Dokument/Econreportq408.pdf,
accessed on February 4, 2013.
Statistics Sweden2
(2013)
http://www.scb.se/Grupp/Teman/Sveriges_Ekonomi/_Dokument/Sverigesekonomikv312.pdf
, accessed on May 22, 2013.
Statistics Sweden3 (2013) http://www.scb.se/Pages/List____19851.aspx, accessed on
February 11, 2013.
Stewart D.W. (1984) “Secondary Research: Information Sources and methods”, Sage,
Beverly Hills.
Storbacka K., Strandvik T. and Grönroos C. (1994) “Managing customer relationships for
Profit: the dynamics of Relationship Quality” International Journal of Service Industry
Management, 5 (5), pp. 21-38.
Strauss A. L. (1994) “Qualitative Analysis for Social Scientists” Cambridge University Press,
New York, NY.
Sweeney J. C. and Webb D. (2002) “Relationship benefits: an exploration of buyer-supplier
dyads” Journal of Relationship Marketing, 1 (2), pp. 77-91.
Takeuchi H. and Quelch J. A. (1983) “Quality is more than making a good product” Harvard
Business Review, 61 (4), pp. 139-145.
Tesch R. (1990) “Qualitative Research: Analysis types and Software tools” Falmer Press,
London.
Vargo S. L. and Lusch R. F. (2008) “Service-dominant logic: continuing the evolution”
Journal of the Academy of Marketing Science, 36 (1), pp. 1-10.
Walter A., Ritter T. and Gemunden H. G. (2001) “Value creation in buyer-seller
relationships” Industrial Marketing Management, 30 (4), pp. 365-377.
Wernerfelt B. (1984) “The resource-based view of the firm” Strategic Management Journal, 5
(2), pp. 171-180.
White M., Braczyk J., Ghobadian A. and Niebuhr J. (1988) “Small Firms’ Innovation: Why
Regions Differ” Policy Institute Studies, London.

84
Wilson D. T. (1995) “An integrated model of buyer-supplier relationships” Journal of the
Academy of Marketing Science, 23 (4), pp. 335-345.
Wise R. and Baumgartner P. (1999) “Go downstream – The new profit imperative in
manufacturing” Harvard Business Review, 77 (5), pp. 133–141.
Yang Z. and Peterson R. T. (2004) “Customer perceived value, satisfaction, and loyalty: the
role of switching costs” Psychology and Marketing, 21 (10), pp. 799-822.
Yin R. K. (2009) “Case Study Research: Design and Methods”, Sage Publications, London.
Zackariasson P. and Wilson T. L. (2004) “Internetworked after-sales service” Industrial
Marketing Management, 33 (2), pp. 75-86.
Zeithaml V. A., Parasuraman A. and Berry L. L. (1990) “Delivering Quality Service:
Balancing Customer Perceptions and Expectations” The Free Press, New York, NY.
Zineldin M. (2002) “Developing and managing a romantic business relationship: life cycle
and strategies”, Managerial Auditing Journal, 17 (9), pp. 546-558.
Zinkhan G. M. (2002) “Relationship marketing: Theory and implementation” Journal of
Market-Focused Management, 5 (2), pp. 83-89.


85
APPENDIX A – INTERVIEW GUIDE
General information
Position of the respondent:
Number of years of employment:
Number of years in the industry:
Part 1: Customer care
1.0 How many employees work with dealing with after-sales services?
1.1 How do you provide your customers with technical and commercial information?
1.2 What are the contact methods for customers to reach your after-sales department?
1.3 What are the available times depending on the contact methods?
1.4 What is the average speed of reply depending on the contact methods?
1.5 Are there any contact persons for specific customers?
1.6 How do you handle complaints? Fill-out-forms vs. direct contact?
1.7 What is the average speed of handling complaints?
1.8 What do you offer in your warranty? Is it possible to expand it?
1.9 What is the average speed of warranty extension process?
Part 2: Field technical assistance
2.1 Do you provide check-ups for customers?
2.2 How often do you provide check-ups for customers?
2.3 What are the field technical assistance you provide to customers during warranty time and
after warranty time?
2.3.1 What type of warranties do you provide?
2.3.2 What are the major advantages of your warranties?
2.4 What is the average product lifetime of your vehicles?
2.5 Do you provide disposals of used products?
2.6 Do you charge the customer for disposals?

86
2.7 What is the average speed of product disposal?
Part 3: Spare parts distribution
3.1 Do you have any warehouses?
3.1.1 If yes, how many warehouses do you have located in Sweden?
3.1.2 In which cities are they located?
3.2 How many repair centers are operating in Sweden?
3.2.1 In which cities are they located?
3.3 What is the estimated average speed of delivery of products and spare parts?
3.4 How do you settle the delivery fee with your customers?
Part 4: Customer relationship marketing
4.1 What is the goal for providing after-sales services for your company?
4.2 How would you estimate the profit from your after-sales services?
4.3 How often do delays occur with your deliveries?
4.4 How often do defective products get delivered to customers?
4.4.1 How often do inaccurate deliveries of products occur?
4.5 What are the methods of placing an order? Online? Through telephone? Personal meeting?
Etc.
4.5.1 What is the most common method of placing an order?
4.6 If an order is not in stock, what is the frequency of items backordered?
4.6.1 What is the average number of backorder days?
4.7 Do you consider that the after-sales services influence the relationship with your customers?
4.8 If yes, to what extend would consider?

Linnaeus University – a firm focus on quality and competence On 1 January 2010 Växjö University and the University of Kalmar merged to form Linnaeus University. This
new university is the product of a will to improve the quality, enhance the appeal and boost the development
potential of teaching and research, at the same time as it plays a prominent role in working closely together with
local society. Linnaeus University offers an attractive knowledge environment characterised by high quality and
a competitive portfolio of skills.
Linnaeus University is a modern, international university with the emphasis on the desire for knowledge, creative
thinking and practical innovations. For us, the focus is on proximity to our students, but also on the world around
us and the future ahead.
Linnæus University
SE-391 82 Kalmar/SE-351 95 Växjö
Telephone +46 772-28 80 00