after janus - illinoisepi.files.wordpress.com · 25.02.2018 · the project for middle lass...
TRANSCRIPT

After Janus The Impending Effects on Public Sector
Workers from a Decision Against Fair Share
Frank Manzo IV, MPP Policy Director, Illinois Economic Policy Institute
Robert Bruno, PhD
Director, Project for Middle Class Renewal Director, Labor Education Program
School of Labor and Employment Relations University of Illinois at Urbana-Champaign
AFTER JANUS: THE IMPENDING EFFECTS ON PUBLIC SECTOR WORKERS FROM A DECISION AGAINST FAIR SHARE
i
ABOUT THE PROJECT FOR MIDDLE CLASS RENEWAL The Project for Middle Class Renewal’s mission is to investigate the working conditions of workers in today’s economy and elevate public discourse on issues affecting workers with research, analysis and education in order to develop and propose public policies that will reduce poverty, provide forms of representation to all workers, prevent gender, race, and LGBTQ+ discrimination, create more stable forms of employment, and promote middle-class paying jobs. Each year, the Project will be dedicated to a number of critical research studies and education forums on contemporary public policies and practices impacting labor and workplace issues. The report that follows, along with all other PMCR reports, may be found by clicking on “Project for Middle Class Renewal” at illinoislabored.org. If you would like to partner with the Labor Education Program in supporting the work of the Project or have questions about the Project please contact Bob Bruno, Director of the Labor Education Program at (312) 996-2491.
ABOUT THE ILLINOIS ECONOMIC POLICY INSTITUTE The Illinois Economic Policy Institute (ILEPI) is a nonprofit organization which uses advanced statistics, reliable surveying techniques and the latest forecasting models to develop timely and dynamic analyses on policy issues affecting the economies of Illinois and the Midwest. ILEPI is committed to: providing rigorous, objective, and methodologically sound analyses; policies which invest in the future of Illinois, the region, and the nation; research which advances high quality jobs and a strong economy; helping foster accountable and effective governments; and positively contributing to the policy dialogue. ILEPI has released over 180 reports since its founding in 2013.
AFTER JANUS: THE IMPENDING EFFECTS ON PUBLIC SECTOR WORKERS FROM A DECISION AGAINST FAIR SHARE
ii
Executive Summary The U.S. labor movement is bracing for a decision by the Supreme Court that could dramatically weaken public sector unions. The case, Janus v. American Federation of State, County, and Municipal Employees, Council 31, et al., is expected to be decided in a vote against “fair share” fees in the public sector. The ruling would strike down a 41-year precedent (Abood v. Detroit Board of Education, 1977) that requires public sector workers represented by a labor union to pay for the collective bargaining work that the union performs on their behalf. If the Court strikes down Abood, workers would be able to “free ride” and receive services, benefits, and representation from unions without paying for them in the form of fair share fees or membership dues. This would impact at least 5 million state and local government employees represented by collective bargaining agreements in 23 collective bargaining states and the District of Columbia. This report examines the economic impact of effectively instituting so-called “right-to-work” conditions in the public sector across America. Overturning Abood would shrink the economy and reduce public sector worker wages.
• Annual economic activity in the United States would drop by between $11.7 billion and $33.4 billion.
• The wages of state and local government employees would decrease by 3.6 percent on average, resulting in a $1,810 loss in wage and salary income per worker.
• The salaries of public school teachers would drop by 5.4 percent on average.
• The pay penalty for working in state and local government would be exacerbated. By encouraging free riding, the Janus decision could impose lasting changes on the labor movement. National “right-to-work” in the public sector would:
• Reduce the union membership rate of state and local government employees by 8.2 percentage points, which could translate into a loss of 726,000 union members over time.
• Decrease public sector unionization by an estimated 189,000 members in California, 136,000 members in New York, and 49,000 members in Illinois over time.
• Reduce the union membership rate of pre-K through 12 and special education teachers by 4.8 percentage points– a loss of 88,000 members of teachers’ unions over time.
• Disproportionately impact African American workers, who are more likely to work in state and local government and are more likely to be union members.
A Janus decision against fair share fees would be the largest change to collective bargaining rights in the United States in decades. The decision would reduce unionization, lower public sector worker earnings, and have negative impacts on the U.S. economy. The response to Janus will be critical to the long-run survival of the U.S. labor movement and the American middle class.
AFTER JANUS: THE IMPENDING EFFECTS ON PUBLIC SECTOR WORKERS FROM A DECISION AGAINST FAIR SHARE
iii
Table of Contents Executive Summary ii
Table of Contents iii
About the Authors iii
Introduction 1
Forecasting the Effects of Janus on Public Sector Workers 3 Impacts on Union Membership 3 Impacts on Worker Wages 5 State-by-State Impacts 7
Conclusion 12
Sources 13
Photo Credits 15
Appendix Data, Methodology, and Limitations
16 16
About the Authors1 Frank Manzo IV, MPP is the Policy Director of the Illinois Economic Policy Institute (ILEPI). He earned a Master of Public Policy from the University of Chicago Harris School of Public Policy, a Bachelor of Arts in Economics and Political Science from the University of Illinois at Urbana-Champaign, and an Advanced Certificate of Labor Studies from the University of Illinois. He specializes in labor market analysis, prevailing wage laws, economic development, infrastructure investment, the low-wage labor force, and public finance. He can be contacted at [email protected]. Robert Bruno, PhD is a Professor at the University of Illinois at Urbana-Champaign School of Labor and Employment Relations and the Director of the School’s Labor Education Program. He also directs the Project for Middle Class Renewal at the University of Illinois at Urbana-Champaign. His research focuses broadly on working-class and union studies issues. He earned his Doctor of Philosophy in Political Theory from New York University and his Master of Arts in Political Science from Bowling Green State University. He can be contacted at [email protected].
1 The authors wish to thank Robert Habans, PhD, Postdoctoral Research Associate at the Project for Middle Class Renewal at the University of Illinois at Urbana-Champaign for his thoughtful review and helpful edits.
AFTER JANUS: THE IMPENDING EFFECTS ON PUBLIC SECTOR WORKERS FROM A DECISION AGAINST FAIR SHARE
1
Introduction The labor movement is bracing for an Illinois-originated Supreme Court decision that threatens to erode its capacity to protect workers against abusive employer practices. In Janus v. American Federation of State, County, and Municipal Employees, Council 31, et al., the high court is considering whether workers in unionized public sector workplaces have a constitutional free speech right to refuse to pay anything for the benefits and services that they receive from a union contract. Under the Illinois Public Labor Relations Act, public sector employees who belong to a bargaining unit can choose not to be actual members of the labor union that represents them. These employees must, by law, receive the same representation and benefits as other employees in the bargaining unit who choose to be full dues-paying members of the labor union. The law permits that collective bargaining agreements can contain a provision allowing unions to charge employees who forgo union membership a lesser fee to cover only the costs of expenses “germane to representation.” These fees are often called “fair share” fees or agency fees. Since the 1977 Abood v. Detroit Board of Education Supreme Court decision, the Court has prohibited public sector unions from using fair share fees for political causes like lobbying and campaign donations. In the years following Abood, many other challengers sought to expand the ruling to cover all payments of any kind, even fees used exclusively to cover unions’ statutorily-mandated duty to bargain for all the employees in the bargaining unit. However, not until Janus has the Court seemed so poised to upend decades of labor peace. The essence of the petitioner’s argument in Janus2, backed by the anti-union National Right to Work Committee, is that everything unions bargain for on behalf of public sector workers is inherently political. Therefore, according to Janus’ argument, it is a First Amendment free speech violation to compel a nonunion worker to pay any fee whatsoever for the services provided by public sector unions. In effect, Janus would have the Court hold that the right of a worker to take a bathroom break is indistinguishable from compelling her or him to speak out in favor of abortion– a dubious equivalence. The Abood decision’s focus on union representational activities meant to produce economic gains for workers originated in the arguments made for passing the 1935 National Labor Relations Act (NLRA). While the NLRA applies to only private sector workers, its genesis is informative to understand what representational benefits mean in the public sector. In 1935, members of Congress spoke passionately about allowing workers to create a countervailing power in the workplace that would prevent the extreme income inequality and abuses that were causing massive strikes and labor unrest. “When employees are denied the freedom to act in concert,” stated the law’s author, Senator Robert Wagner, “they cannot participate in our national endeavor to coordinate production and purchasing power. The consequences are already visible in the widening gap between wages and profits. If these consequences are allowed to produce their full harvest, the whole country will suffer from a new economic decline.” Additionally, in the states where public sector collective bargaining is permitted, public sector unions owe a duty of fair representation to members of a bargaining unit where the union has been democratically elected by the workers to represent them. By law, workers in this situation are entitled to union representation, benefits, and services regardless of whether they are actually full dues-paying members 2 Mark Janus is a non-union state employee in Illinois who opposes paying fair share fees (or agency fees).
AFTER JANUS: THE IMPENDING EFFECTS ON PUBLIC SECTOR WORKERS FROM A DECISION AGAINST FAIR SHARE
2
of the union. As a result, workers do not have to join a union that represents their bargaining unit or finance union political activities and lobbying, but they do have to pay fair share fees for that representation and for the services provided by the union.3 As unsettling as the likelihood of a national “right-to-work” (RTW) scheme in the public sector is for organized labor, to a large degree it is not qualitatively different from what unions have experienced in the last four decades. Janus did not fall fully formed from the sky. There have been preceding Supreme Court decisions (i.e., Harris v Quinn, 2014; Knox v SEIU Local 1000, 2012; Lehnert v Ferris Faculty Association, 1991) that have chipped away at the “fair share” concept. Janus emerged from the political transformations strategically developed at the state level by groups like the corporate-backed American Legislative Exchange Council and organizations affiliated with the far-right State Policy Network. A brief review of the proposed and passed state bills over the past few years aimed at limiting worker standards and associational rights reveals the contours of the current anti-labor legislative landscape. Between 2010 and 2015, 19 states introduced RTW bills, with measures passing in Michigan, Indiana, and Wisconsin. Since 2015, West Virginia and Kentucky have added their names to the list of RTW states. Between just 2010 and 2012, more than 550 bills were proposed in state legislatures to curtail collective bargaining rights in the public sector and over the past five years 15 states passed restrictions (Lafer, 2013; NCSL, 2017). The legislative environment for labor has been overwhelmingly hostile since 2010. Undoubtedly, the prominence of public sector labor struggles can be traced to public employees’ increasingly large role in the U.S. labor movement. Currently nearly half of the nation’s union members are public employees, and union density in the public sector (34.4 percent) is more than five times what it is in the private sector (6.5 percent). Today, state employees, teachers, nurses, and firefighters play an important role in policy debates because they often represent the country’s best protection against a radical decomposition of public institutions. Since a Janus decision against fair share fees would effectively institute RTW conditions in the public sector across America, it would allow individuals to free ride on the contributions of others. Nonmembers will be able to receive all the services and benefits associated with collective bargaining– such as better wages and benefits and grievance representation– for free. When a significant number of employees decide to free ride, the financial resources of labor organizations become depleted. Without sufficient resources, many public sector unions are likely to underperform or disband altogether. This report, conducted by researchers at the Illinois Economic Policy Institute and the University of Illinois at Urbana-Champaign, forecasts the effects of a Janus decision against fair share fees– specifically on state and local government workers, including teachers, in the United States. The analysis utilizes 2017 data on the relationship between “right-to-work” laws on all state and local government workers as well as on pre-K through 12 and special education teachers more specifically. The report assesses the likely impacts of Janus on public sector union membership and on the wage and salary incomes of state and local government employees, including teachers. State-by-state impacts are also presented. A concluding section recaps key findings.
3 Labor unions are also required to provide “Hudson notices” to nonmembers, which document the costs of collective bargaining, contract administration, and representation. This is an additional level of transparency in allowing fee payers to opt out of political spending.
AFTER JANUS: THE IMPENDING EFFECTS ON PUBLIC SECTOR WORKERS FROM A DECISION AGAINST FAIR SHARE
3
Forecasting the Effects of Janus on Public Sector Workers This study assesses the statistical differences in the annual hourly wages and union membership of public sector workers in states with “right-to-work” (RTW) laws and states without RTW laws, often called collective bargaining states or “fair share” states. Results are extrapolated to forecast the impact of a Janus decision against fair share fees. As of March 2018, 27 U.S. states had RTW laws (NRTWC, 2018). Conversely, 23 U.S. states have fair-share collective bargaining laws. The District of Columbia also operates under fair-share collective bargaining. In addition, Missouri was considered a fair-share collective bargaining state in 2017. However, the Missouri legislature passed a RTW bill that was set to take effect in late August 2017, but enactment was suspended after organizers collected enough signatures to delay it. In November 2018, Missouri voters will get a chance to vote for or against the “right-to-work” law (Mannies, 2018). At least 5.0 million public sector workers were either union members or represented by union contracts in the 23 collective bargaining states and the District of Columbia in 2017. The Janus Supreme Court case would impose lasting changes on both the labor movement and the U.S. economy. While a majority opinion against fair share fees would become effective immediately, it would likely take multiple years for the full effect of the decision to be realized. Initially, some public sector workers may decide to opt out of paying union dues or fees while others may become more active. Labor organizations may increase member engagement to remind workers of the financial, solidary, and purposive incentives of union membership. These individual and organizational dynamics would play out over multiple years– and potentially over multiple collective bargaining agreements. Nevertheless, over time, Janus is expected to reduce public sector unionization, decrease the earnings of state and local government employees, and reduce economic activity across the United States. Impacts on Union Membership A Janus decision against fair share fees in the public sector would allow individuals to free ride on the efforts and contributions of others. By law, labor unions must fairly represent all covered employees in a workplace. However, under this new regulatory framework, the payment of dues or fair share fees will become optional for all members of a public sector bargaining unit. This means that workers can choose not to financially contribute to a labor union in their workplace while receiving all the services and benefits associated with collective bargaining– such as a higher wage, better health and retirement benefits, grievance representation, and legal representation. Under RTW, unions legally must provide services to these workers for free.4 When a considerable number of individuals decide to free ride, the resources of the labor organization become depleted relative to the costs of representation, causing it to underperform. As a result, previous research has found that RTW increases free riding by 8 percentage points while reducing overall union membership by between 5 and 10 percentage points (Davis & Huston, 1993; Manzo & Bruno, 2014; Hogler et al., 2004; Moore, 1980). Many factors influence the unionization rate and an individual worker’s likelihood of being a union member, including educational attainment and demographic characteristics. Figure 1 accounts for these and other observable variables to assess the impact of RTW laws on all state and local government
4 Across the United States, there is no analogous mandate. Homeowners’ associations, for example, can deny services to members who have not paid their association fees, and state Chambers of Commerce are not forced to represent local businesses who do not pay membership dues.
AFTER JANUS: THE IMPENDING EFFECTS ON PUBLIC SECTOR WORKERS FROM A DECISION AGAINST FAIR SHARE
4
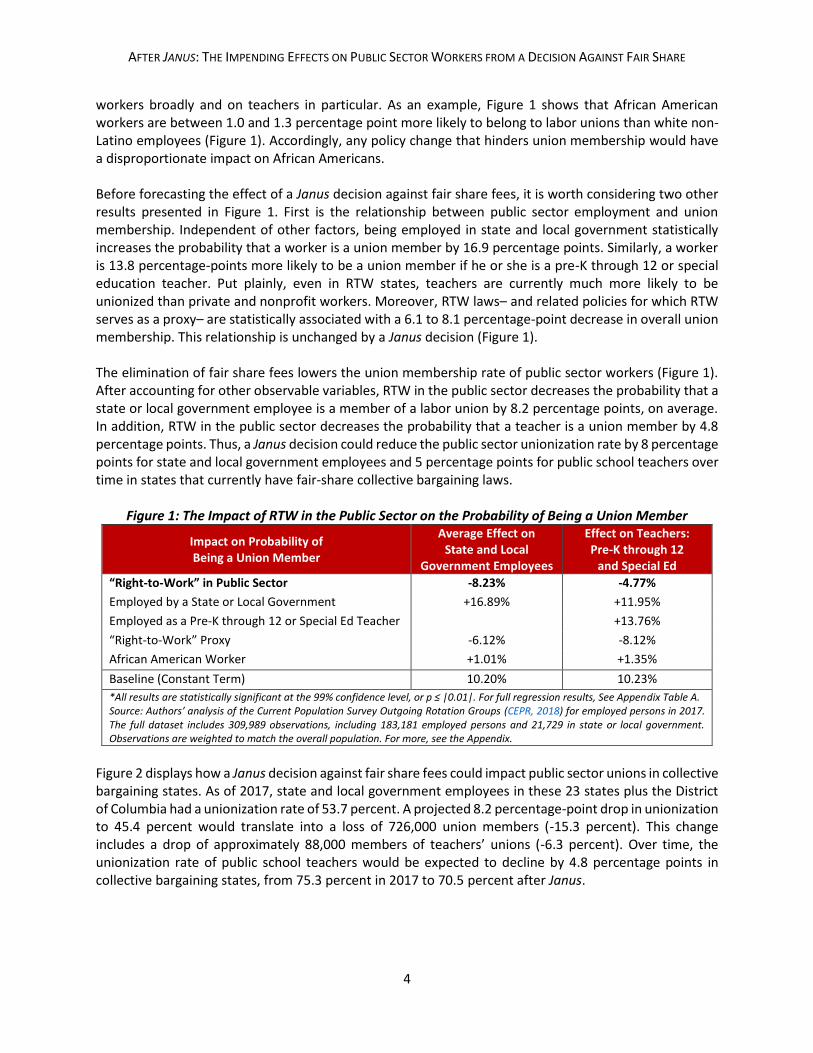
workers broadly and on teachers in particular. As an example, Figure 1 shows that African American workers are between 1.0 and 1.3 percentage point more likely to belong to labor unions than white non-Latino employees (Figure 1). Accordingly, any policy change that hinders union membership would have a disproportionate impact on African Americans. Before forecasting the effect of a Janus decision against fair share fees, it is worth considering two other results presented in Figure 1. First is the relationship between public sector employment and union membership. Independent of other factors, being employed in state and local government statistically increases the probability that a worker is a union member by 16.9 percentage points. Similarly, a worker is 13.8 percentage-points more likely to be a union member if he or she is a pre-K through 12 or special education teacher. Put plainly, even in RTW states, teachers are currently much more likely to be unionized than private and nonprofit workers. Moreover, RTW laws– and related policies for which RTW serves as a proxy– are statistically associated with a 6.1 to 8.1 percentage-point decrease in overall union membership. This relationship is unchanged by a Janus decision (Figure 1). The elimination of fair share fees lowers the union membership rate of public sector workers (Figure 1). After accounting for other observable variables, RTW in the public sector decreases the probability that a state or local government employee is a member of a labor union by 8.2 percentage points, on average. In addition, RTW in the public sector decreases the probability that a teacher is a union member by 4.8 percentage points. Thus, a Janus decision could reduce the public sector unionization rate by 8 percentage points for state and local government employees and 5 percentage points for public school teachers over time in states that currently have fair-share collective bargaining laws.
Figure 1: The Impact of RTW in the Public Sector on the Probability of Being a Union Member
Impact on Probability of Being a Union Member
Average Effect on State and Local
Government Employees
Effect on Teachers: Pre-K through 12
and Special Ed
“Right-to-Work” in Public Sector -8.23% -4.77%
Employed by a State or Local Government +16.89% +11.95%
Employed as a Pre-K through 12 or Special Ed Teacher +13.76%
“Right-to-Work” Proxy -6.12% -8.12%
African American Worker +1.01% +1.35%
Baseline (Constant Term) 10.20% 10.23%
*All results are statistically significant at the 99% confidence level, or p ≤ |0.01|. For full regression results, See Appendix Table A. Source: Authors’ analysis of the Current Population Survey Outgoing Rotation Groups (CEPR, 2018) for employed persons in 2017. The full dataset includes 309,989 observations, including 183,181 employed persons and 21,729 in state or local government. Observations are weighted to match the overall population. For more, see the Appendix.
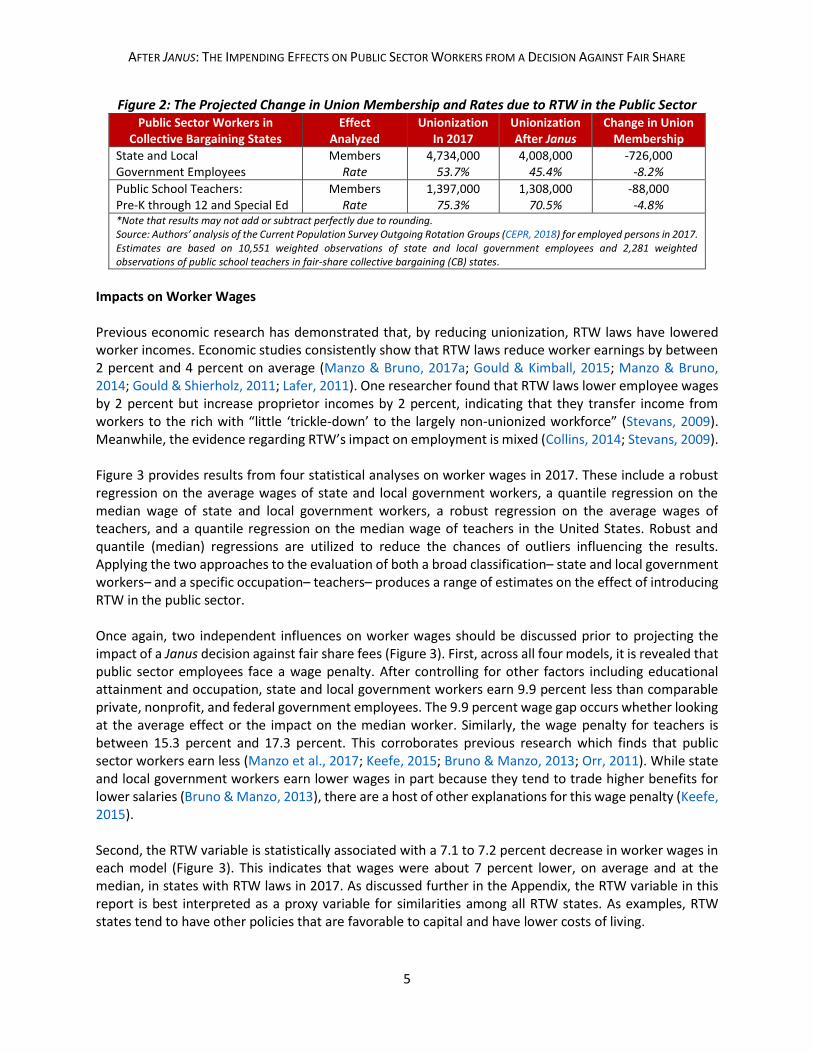
Figure 2 displays how a Janus decision against fair share fees could impact public sector unions in collective bargaining states. As of 2017, state and local government employees in these 23 states plus the District of Columbia had a unionization rate of 53.7 percent. A projected 8.2 percentage-point drop in unionization to 45.4 percent would translate into a loss of 726,000 union members (-15.3 percent). This change includes a drop of approximately 88,000 members of teachers’ unions (-6.3 percent). Over time, the unionization rate of public school teachers would be expected to decline by 4.8 percentage points in collective bargaining states, from 75.3 percent in 2017 to 70.5 percent after Janus.
AFTER JANUS: THE IMPENDING EFFECTS ON PUBLIC SECTOR WORKERS FROM A DECISION AGAINST FAIR SHARE
5
Figure 2: The Projected Change in Union Membership and Rates due to RTW in the Public Sector Public Sector Workers in
Collective Bargaining States Effect
Analyzed Unionization
In 2017 Unionization After Janus
Change in Union Membership
State and Local Government Employees
Members Rate
4,734,000 53.7%
4,008,000 45.4%
-726,000 -8.2%
Public School Teachers: Pre-K through 12 and Special Ed
Members Rate
1,397,000 75.3%
1,308,000 70.5%
-88,000 -4.8%
*Note that results may not add or subtract perfectly due to rounding. Source: Authors’ analysis of the Current Population Survey Outgoing Rotation Groups (CEPR, 2018) for employed persons in 2017. Estimates are based on 10,551 weighted observations of state and local government employees and 2,281 weighted observations of public school teachers in fair-share collective bargaining (CB) states.
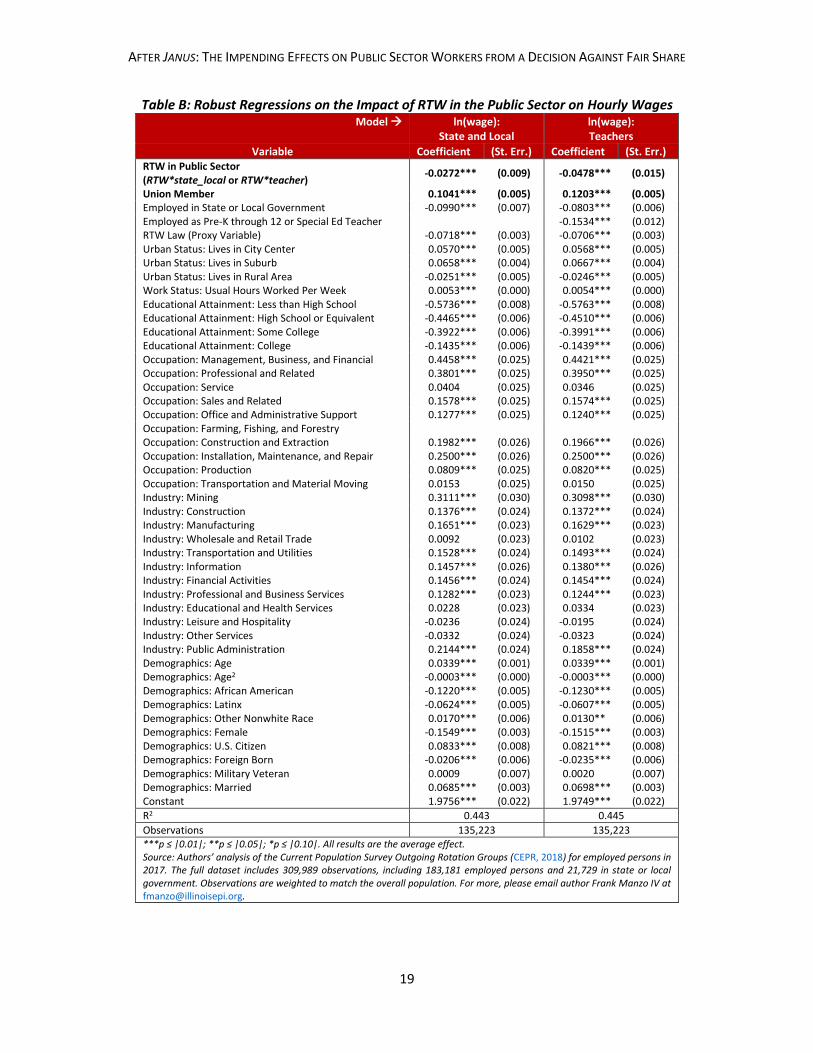
Impacts on Worker Wages Previous economic research has demonstrated that, by reducing unionization, RTW laws have lowered worker incomes. Economic studies consistently show that RTW laws reduce worker earnings by between 2 percent and 4 percent on average (Manzo & Bruno, 2017a; Gould & Kimball, 2015; Manzo & Bruno, 2014; Gould & Shierholz, 2011; Lafer, 2011). One researcher found that RTW laws lower employee wages by 2 percent but increase proprietor incomes by 2 percent, indicating that they transfer income from workers to the rich with “little ‘trickle-down’ to the largely non-unionized workforce” (Stevans, 2009). Meanwhile, the evidence regarding RTW’s impact on employment is mixed (Collins, 2014; Stevans, 2009). Figure 3 provides results from four statistical analyses on worker wages in 2017. These include a robust regression on the average wages of state and local government workers, a quantile regression on the median wage of state and local government workers, a robust regression on the average wages of teachers, and a quantile regression on the median wage of teachers in the United States. Robust and quantile (median) regressions are utilized to reduce the chances of outliers influencing the results. Applying the two approaches to the evaluation of both a broad classification– state and local government workers– and a specific occupation– teachers– produces a range of estimates on the effect of introducing RTW in the public sector. Once again, two independent influences on worker wages should be discussed prior to projecting the impact of a Janus decision against fair share fees (Figure 3). First, across all four models, it is revealed that public sector employees face a wage penalty. After controlling for other factors including educational attainment and occupation, state and local government workers earn 9.9 percent less than comparable private, nonprofit, and federal government employees. The 9.9 percent wage gap occurs whether looking at the average effect or the impact on the median worker. Similarly, the wage penalty for teachers is between 15.3 percent and 17.3 percent. This corroborates previous research which finds that public sector workers earn less (Manzo et al., 2017; Keefe, 2015; Bruno & Manzo, 2013; Orr, 2011). While state and local government workers earn lower wages in part because they tend to trade higher benefits for lower salaries (Bruno & Manzo, 2013), there are a host of other explanations for this wage penalty (Keefe, 2015). Second, the RTW variable is statistically associated with a 7.1 to 7.2 percent decrease in worker wages in each model (Figure 3). This indicates that wages were about 7 percent lower, on average and at the median, in states with RTW laws in 2017. As discussed further in the Appendix, the RTW variable in this report is best interpreted as a proxy variable for similarities among all RTW states. As examples, RTW states tend to have other policies that are favorable to capital and have lower costs of living.

AFTER JANUS: THE IMPENDING EFFECTS ON PUBLIC SECTOR WORKERS FROM A DECISION AGAINST FAIR SHARE
6
However, because statistical results reported in Figure 1 reveal that a Janus decision for the plaintiff (i.e., Janus) could reduce union membership by 8.2 percentage points for state and local government workers and by 4.8 percentage points for teachers, it is necessary to also consider the independent impact that union membership has on worker wages. Across all four statistical analyses, union membership is found to raise worker pay by between 10.4 percent and 12.8 percent. This range aligns with estimates from numerous other studies which have assessed the union wage effect (Manzo & Bruno, 2017a; Manzo et al., 2017b; Mishel, 2012; Schmitt, 2008; Hirsch & Macpherson, 2006).
Figure 3: The Impact of RTW in the Public Sector on Hourly Wages, Average and Median Effects
Impact on Hourly Wage
Average Effect on State and Local
Government Employees
Effect on Teachers: Pre-K through 12
and Special Ed
Average† Median‡ Average† Median‡
“Right-to-Work” in Public Sector -2.72% -3.78% -4.78% -6.35%
Union Membership +10.41% +10.69% +12.03% +12.82%
Employed by a State or Local Government -9.90% -9.91% -8.03% -7.60%
Employed as a Pre-K through 12 or Special Ed Teacher -15.34% -17.34%
“Right-to-Work” Proxy -7.18% -7.18% -7.06% -7.12%
* All results are statistically significant at the 99% confidence level, or p ≤ |0.01|. †The average analyses are ordinary least squares (OLS) regressions with robust standard errors. ‡The median analyses are quantile regressions at the 50th percentile. For full regression results, See Appendix Tables B and C. Source: Authors’ analysis of the Current Population Survey Outgoing Rotation Groups (CEPR, 2018) for employed persons in 2017. The full dataset includes 309,989 observations, including 183,181 employed persons and 21,729 in state or local government. Observations are weighted to match the overall population. For more, see the Appendix.
After accounting for these and other observable factors, RTW is found to lower the hourly wages of public sector workers (Figure 3). RTW in the public sector reduces the wages of state and local government employees by 2.7 percent on average. For the median earner employed in state and local government, the absence of fair share fees lowers wages by 3.8 percent. Furthermore, RTW in the public sector reduces the salaries of teachers by 4.8 percent on average and 6.3 percent at the median.
Figure 4: The Total Impact of RTW in the Public Sector on Hourly Wages, Including Weakened Unions Average Effects on Group of Workers
Analyzed: Hourly Wage
RTW in Public Sector Effect
on Wages +
Union Membership
Effect on Wages x
RTW in Public Sector Effect on
Unionization =
Total Wage
Impact
State and Local Government Employees
-2.72% +10.41% -8.23% -3.57%
Public School Teachers: Pre-K thru 12 and Special Ed
-4.78% +12.03% -4.77% -5.35%
*All results are statistically significant at the 99% confidence level, or p ≤ |0.01|. Source: Authors’ analysis of the Current Population Survey Outgoing Rotation Groups (CEPR, 2018) for employed persons in 2017. The cumulative effect on average worker wages is based on the findings in Figure 1 and Figure 3.
An accurate forecast of a Janus decision against fair share fees on worker wages requires that both impacts be included (Figure 4). For all state and local government workers, the independent (first-order) effect of RTW in the public sector is a 2.7 decrease in wages on average. But the 8.2 percentage-point drop in unionization impacts union members and those state and local government employees who are most likely to join labor unions. This drop in the unionization rate (8.2 percentage points) is multiplied by the average union wage premium (10.4 percent)– what these workers would have earned, on average, with a collective bargaining agreement– and added to the effect on all state and local government
AFTER JANUS: THE IMPENDING EFFECTS ON PUBLIC SECTOR WORKERS FROM A DECISION AGAINST FAIR SHARE
7
workers. Mathematically, these impacts result in a 3.6 percent total loss in the average wages of state and local government workers that could be expected due to RTW in the public sector. Likewise, the impacts on teachers disclose that RTW in the public sector could reduce their average wages by 5.4 percent. After Janus, public sector workers would earn even lower wages relative to private and nonprofit workers. As state and local governments increase their leverage against public sector unions with weakened bargaining power, teachers, firefighters, police officers, park rangers, public transit workers, and other public sector workers can expect erosions to their middle-class salaries as well as employer pressure to accept pay freezes. The end result would likely be a significant drop in wages for public sector workers. State-by-State Impacts
The effects of a Janus decision against fair share fees would predominately be experienced in collective bargaining states without “right-to-work” laws. Public sector employees in the 27 states with RTW laws already work in free-rider environments. As a result, the consequences of a Janus decision against fair share fees will only directly occur in the 23 collective bargaining states plus the District of Columbia, which tend to have high rates of public sector unionization. More than half of all state and local government union members live in just six collective bargaining states (Figure 5). As of 2017, California had 1.24 million union members employed at state and local agencies, accounting for 19.8 percent of the 6.24 million state and local government union members nationwide. New York had 885,000 state and local government union members (14.2 percent), New Jersey had 326,000 members (5.2 percent), Illinois had 317,000 members (5.1 percent), Ohio had 258,000 members (4.1 percent) and Pennsylvania had 248,000 members (4.0 percent). In total, these six states account for 52.4 percent of all state and local government union members across America. Figure 5 presents anticipated changes in public sector union membership across the United States after Janus. The analysis incorporates the average estimates from Figures 1 and 2 and adjusts them based on each state’s share of the total number of state and local government union members in collective bargaining states. The largest percentage-point drops in public sector unionization rates would be projected to occur in states that had the highest union densities, such as New York (-10.7 percentage points), Rhode Island (-10.6 percentage points), and Connecticut (-10.5 percentage points). On the other hand, the fair-share collective bargaining states that had relatively lower state and local government worker unionization would see the smallest percentage-point declines in membership rates because they do not have as far to fall. These include Missouri (-2.2 percentage points), New Mexico (-2.7 percentage points), and Colorado (-3.0 percentage points). In terms of the total number of public sector union members, the most significant losses would likely occur in the six states that account for over half of all state and local government workers (Figure 5). The data suggests that state and local government union membership could decline by an estimated 189,000 members in California, 136,000 members in New York, 50,000 members in New Jersey, 49,000 members in Illinois, 40,000 members in Ohio, and 38,000 members in Pennsylvania. A Janus decision against fair share fees would also reduce the wages and salaries of public sector workers over time (Figure 6). To provide conservative estimates, Figure 6 applies the estimated wage effects associated with RTW in the public sector from the average effect (robust regression) on state and local government workers in Figures 3 and 4. The results indicate that Janus would reduce the average incomes of state and local government employees by about a dollar per hour ($0.94), a 3.6 percent drop. The

AFTER JANUS: THE IMPENDING EFFECTS ON PUBLIC SECTOR WORKERS FROM A DECISION AGAINST FAIR SHARE
8
average decrease in wages would range from 3.0 percent in Missouri to 3.8 percent in New York. Annualized, state and local government workers would lose between $1,253 (Missouri) and $2,238 (the District of Columbia) in wage and salary income– with an average erosion in pay of $1,810 in current dollars.
Figure 5: Projected Changes in State and Local Government Worker Unionization After Janus Collective
Bargaining State Unionization
in 2017 Unionization After Janus
Change in Unionization
2017 Union Members
Members After Janus
Change in Members
California 58.3% 49.3% -8.9% 1,235,000 1,046,000 -189,000
New York 69.8% 59.1% -10.7% 885,000 750,000 -136,000
New Jersey 64.1% 54.3% -9.8% 326,000 276,000 -50,000
Illinois 52.1% 44.1% -8.0% 317,000 268,000 -49,000
Ohio 44.5% 37.7% -6.8% 258,000 219,000 -40,000
Pennsylvania 52.5% 44.4% -8.0% 248,000 210,000 -38,000
Washington 55.9% 47.3% -8.6% 230,000 194,000 -35,000
Massachusetts 57.2% 48.4% -8.8% 210,000 178,000 -32,000
Minnesota 54.3% 46.0% -8.3% 183,000 155,000 -28,000
Connecticut 68.3% 57.9% -10.5% 159,000 134,000 -24,000
Maryland 41.9% 35.5% -6.4% 145,000 123,000 -22,000
Oregon 54.4% 46.1% -8.3% 127,000 108,000 -20,000
Colorado 19.6% 16.6% -3.0% 69,000 58,000 -11,000
Hawaii 61.3% 51.9% -9.4% 48,000 41,000 -7,000
Missouri 14.6% 12.3% -2.2% 47,000 40,000 -7,000
New Hampshire 50.3% 42.6% -7.7% 41,000 35,000 -6,000
Maine 51.0% 43.2% -7.8% 38,000 32,000 -6,000
Rhode Island 69.1% 58.5% -10.6% 38,000 32,000 -6,000
Alaska 50.9% 43.1% -7.8% 29,000 25,000 -4,000
Montana 36.4% 30.8% -5.6% 26,000 22,000 -4,000
New Mexico 17.9% 15.2% -2.7% 24,000 20,000 -4,000
Delaware 43.2% 36.6% -6.6% 20,000 17,000 -3,000
Vermont 48.2% 40.8% -7.4% 19,000 16,000 -3,000
District of Columbia 40.1% 34.0% -6.2% 11,000 10,000 -2,000
All CB States 53.7% 45.4% -8.2% 4,734,000 4,008,000 -726,000
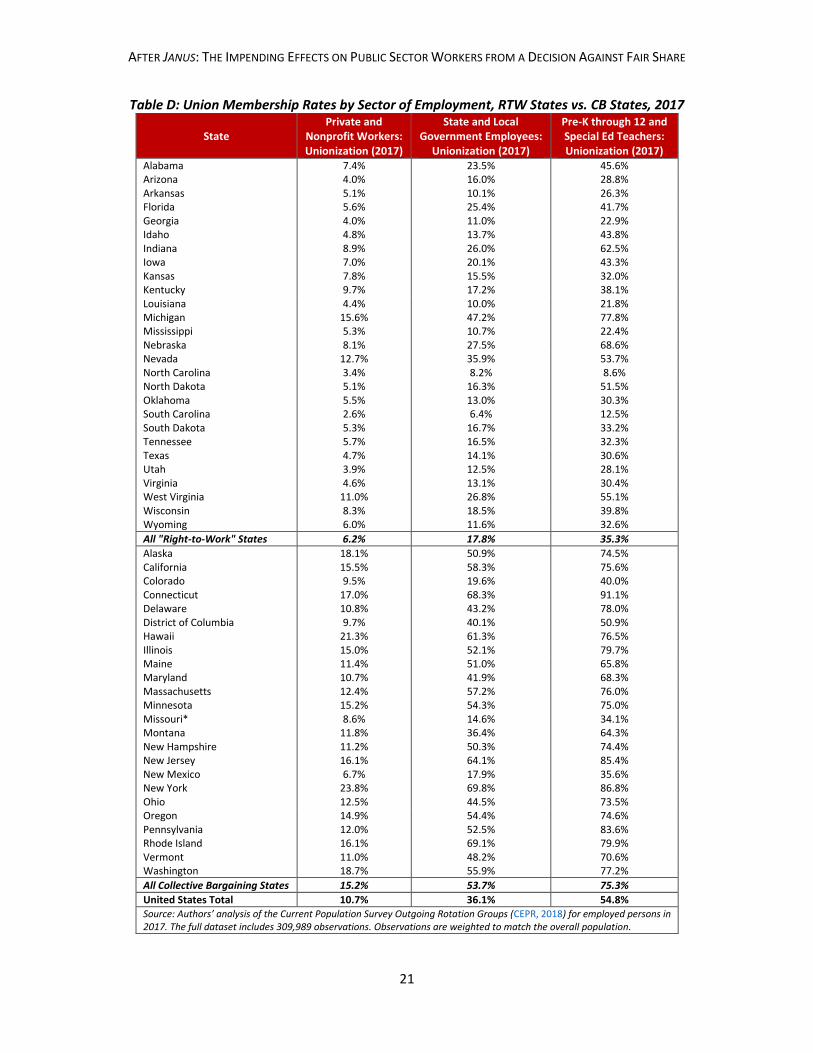
States with little to no estimated impact: Alabama, Arizona, Arkansas, Florida, Georgia, Idaho, Indiana, Iowa, Kansas, Kentucky, Louisiana, Michigan, Mississippi, Nebraska, Nevada, North Carolina, North Dakota, Oklahoma, South Carolina, South Dakota, Tennessee, Texas, Utah, Virginia, West Virginia, Wisconsin, and Wyoming. For a comparison of state and local government employee unionization rates in these states, please see Appendix Table D. *Note that union member data are rounded to the nearest thousand. Results may not add or subtract perfectly due to rounding. Source: Authors’ analysis of the Current Population Survey Outgoing Rotation Groups (CEPR, 2018) for employed persons in 2017. The full dataset includes 309,989 observations, including 183,181 employed persons and 21,729 in state or local government. Observations are weighted to match the overall population.
Three points are worth noting about the estimates in Figure 6. First, they are conservative estimates that utilize only the smallest expected impacts from Figures 3 and 4. The decrease in wages after Janus may be higher for some public sector workers, including teachers– who are more likely to suffer the 5.4 percent drop in wages, on average, reported in Figure 4. Second, this analysis only investigates wage and salary income and does not consider the change in fringe benefits, such as health coverage or pension plans, that are likely to follow from the Janus decision. Including changes to benefits could reduce total

AFTER JANUS: THE IMPENDING EFFECTS ON PUBLIC SECTOR WORKERS FROM A DECISION AGAINST FAIR SHARE
9
compensation for state and local government employees even more. And third, these effects would exacerbate the pay penalty that already exists for those who work in the public interest (Keefe, 2015; Bruno & Manzo, 2013; Orr, 2011).
Figure 6: Projected Changes in State and Local Government Worker Wages and Salaries After Janus
Collective Bargaining State
Change in Unionization
Average Wage Per
Hour in 2017
Usual Hours Worked
Per Week†
Average Janus
Wage Effect
Change in Hourly Wage
Annual Change in Income
Per Worker‡
California -8.9% $30.50 37.4 -3.6% -$1.11 -$2,079
New York -10.7% $28.79 38.0 -3.8% -$1.10 -$2,097
New Jersey -9.8% $31.05 38.5 -3.7% -$1.16 -$2,234
Illinois -8.0% $26.27 37.9 -3.5% -$0.93 -$1,767
Ohio -6.8% $23.65 37.8 -3.4% -$0.81 -$1,532
Pennsylvania -8.0% $26.68 38.5 -3.6% -$0.95 -$1,826
Washington -8.6% $28.23 38.8 -3.6% -$1.02 -$1,978
Massachusetts -8.8% $29.56 38.0 -3.6% -$1.07 -$2,042
Minnesota -8.3% $26.94 38.6 -3.6% -$0.97 -$1,865
Connecticut -10.5% $29.91 37.7 -3.8% -$1.14 -$2,149
Maryland -6.4% $27.93 38.2 -3.4% -$0.95 -$1,808
Oregon -8.3% $25.38 36.9 -3.6% -$0.91 -$1,679
Colorado -3.0% $27.95 38.8 -3.0% -$0.85 -$1,645
Hawaii -9.4% $25.45 38.4 -3.7% -$0.94 -$1,806
Missouri -2.2% $21.97 38.7 -3.0% -$0.65 -$1,253
New Hampshire -7.7% $25.24 38.1 -3.5% -$0.89 -$1,694
Maine -7.8% $24.01 38.7 -3.5% -$0.85 -$1,640
Rhode Island -10.6% $27.10 37.6 -3.8% -$1.04 -$1,948
Alaska -7.8% $30.49 39.9 -3.5% -$1.08 -$2,148
Montana -5.6% $23.56 36.9 -3.3% -$0.78 -$1,436
New Mexico -2.7% $22.66 38.8 -3.0% -$0.68 -$1,320
Delaware -6.6% $25.05 39.2 -3.4% -$0.85 -$1,673
Vermont -7.4% $26.40 38.1 -3.5% -$0.92 -$1,753
District of Columbia -6.2% $32.64 40.8 -3.4% -$1.10 -$2,238
All CB States -8.2% $25.81 38.5 -3.6% -$0.94 -$1,810 States with little to no estimated impact: Alabama, Arizona, Arkansas, Florida, Georgia, Idaho, Indiana, Iowa, Kansas, Kentucky, Louisiana, Michigan, Mississippi, Nebraska, Nevada, North Carolina, North Dakota, Oklahoma, South Carolina, South Dakota, Tennessee, Texas, Utah, Virginia, West Virginia, Wisconsin, and Wyoming. *Results may not add or subtract perfectly due to rounding. †Note that both full-time workers and part-time workers are included in the analysis. ‡The annual change in income per worker is calculated by multiplying the estimated change in hourly wage by the usual hours worked per week and then multiplying that weekly earnings number by a conservative 50 weeks worked over the year (52 weeks). Source: Authors’ analysis of the Current Population Survey Outgoing Rotation Groups (CEPR, 2018) for employed persons in 2017. The full dataset includes 309,989 observations, including 183,181 employed persons and 21,729 in state or local government. Observations are weighted to match the overall population.
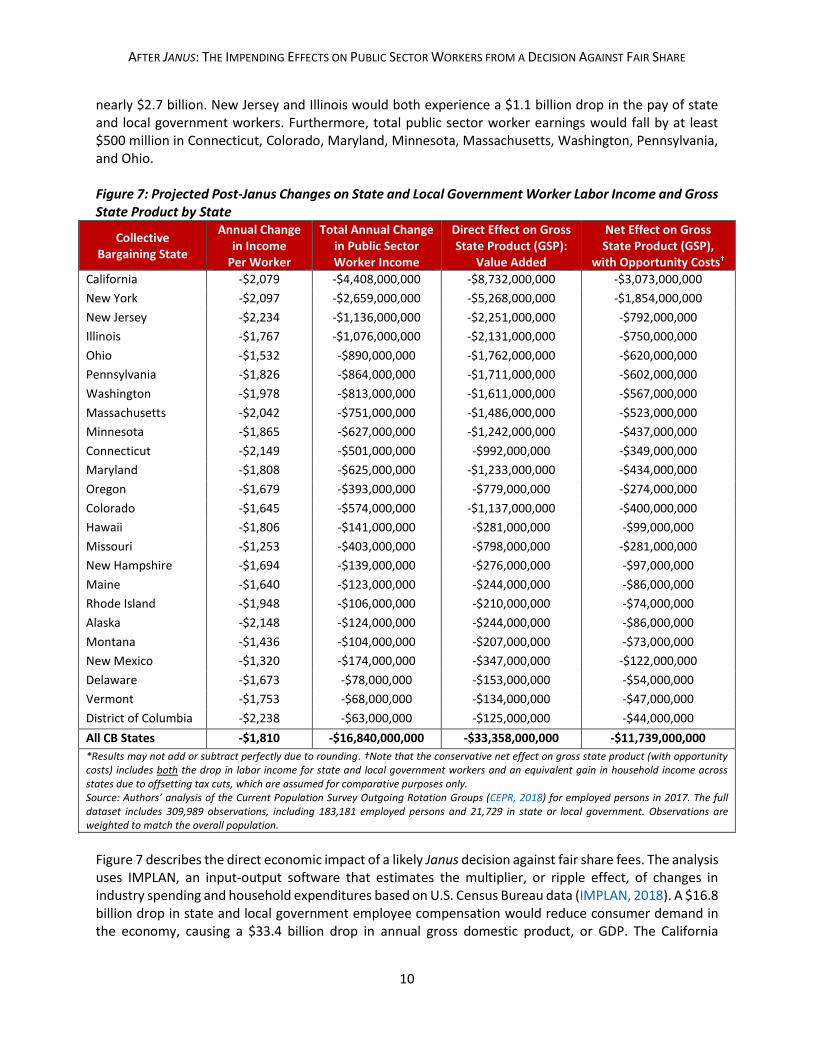
In total, a Janus decision against fair share fees would be expected to reduce the annual labor income of state and local government employees by $16.8 billion over time across the United States (Figure 7). Figure 7 multiplies the annualized drop in income per worker by the total number of state and local government employees in each state in 2017. In California, state and local government workers would lose $4.4 billion in total wage and salary income. In New York, the loss in worker wages would amount to
AFTER JANUS: THE IMPENDING EFFECTS ON PUBLIC SECTOR WORKERS FROM A DECISION AGAINST FAIR SHARE
10
nearly $2.7 billion. New Jersey and Illinois would both experience a $1.1 billion drop in the pay of state and local government workers. Furthermore, total public sector worker earnings would fall by at least $500 million in Connecticut, Colorado, Maryland, Minnesota, Massachusetts, Washington, Pennsylvania, and Ohio. Figure 7: Projected Post-Janus Changes on State and Local Government Worker Labor Income and Gross State Product by State
Collective Bargaining State
Annual Change in Income
Per Worker
Total Annual Change in Public Sector Worker Income
Direct Effect on Gross State Product (GSP):
Value Added
Net Effect on Gross State Product (GSP),
with Opportunity Costs†
California -$2,079 -$4,408,000,000 -$8,732,000,000 -$3,073,000,000
New York -$2,097 -$2,659,000,000 -$5,268,000,000 -$1,854,000,000
New Jersey -$2,234 -$1,136,000,000 -$2,251,000,000 -$792,000,000
Illinois -$1,767 -$1,076,000,000 -$2,131,000,000 -$750,000,000
Ohio -$1,532 -$890,000,000 -$1,762,000,000 -$620,000,000
Pennsylvania -$1,826 -$864,000,000 -$1,711,000,000 -$602,000,000
Washington -$1,978 -$813,000,000 -$1,611,000,000 -$567,000,000
Massachusetts -$2,042 -$751,000,000 -$1,486,000,000 -$523,000,000
Minnesota -$1,865 -$627,000,000 -$1,242,000,000 -$437,000,000
Connecticut -$2,149 -$501,000,000 -$992,000,000 -$349,000,000
Maryland -$1,808 -$625,000,000 -$1,233,000,000 -$434,000,000
Oregon -$1,679 -$393,000,000 -$779,000,000 -$274,000,000
Colorado -$1,645 -$574,000,000 -$1,137,000,000 -$400,000,000
Hawaii -$1,806 -$141,000,000 -$281,000,000 -$99,000,000
Missouri -$1,253 -$403,000,000 -$798,000,000 -$281,000,000
New Hampshire -$1,694 -$139,000,000 -$276,000,000 -$97,000,000
Maine -$1,640 -$123,000,000 -$244,000,000 -$86,000,000
Rhode Island -$1,948 -$106,000,000 -$210,000,000 -$74,000,000
Alaska -$2,148 -$124,000,000 -$244,000,000 -$86,000,000
Montana -$1,436 -$104,000,000 -$207,000,000 -$73,000,000
New Mexico -$1,320 -$174,000,000 -$347,000,000 -$122,000,000
Delaware -$1,673 -$78,000,000 -$153,000,000 -$54,000,000
Vermont -$1,753 -$68,000,000 -$134,000,000 -$47,000,000
District of Columbia -$2,238 -$63,000,000 -$125,000,000 -$44,000,000
All CB States -$1,810 -$16,840,000,000 -$33,358,000,000 -$11,739,000,000
*Results may not add or subtract perfectly due to rounding. †Note that the conservative net effect on gross state product (with opportunity costs) includes both the drop in labor income for state and local government workers and an equivalent gain in household income across states due to offsetting tax cuts, which are assumed for comparative purposes only. Source: Authors’ analysis of the Current Population Survey Outgoing Rotation Groups (CEPR, 2018) for employed persons in 2017. The full dataset includes 309,989 observations, including 183,181 employed persons and 21,729 in state or local government. Observations are weighted to match the overall population.
Figure 7 describes the direct economic impact of a likely Janus decision against fair share fees. The analysis uses IMPLAN, an input-output software that estimates the multiplier, or ripple effect, of changes in industry spending and household expenditures based on U.S. Census Bureau data (IMPLAN, 2018). A $16.8 billion drop in state and local government employee compensation would reduce consumer demand in the economy, causing a $33.4 billion drop in annual gross domestic product, or GDP. The California

AFTER JANUS: THE IMPENDING EFFECTS ON PUBLIC SECTOR WORKERS FROM A DECISION AGAINST FAIR SHARE
11
economy would shrink by $8.7 billion annually, accounting for 26.2 percent of the total impact of Janus. New York would account for another 15.8 percent of the total drop in output, experiencing a $5.3 billion annual decline in gross state product, or GSP. Each year, the economies of New Jersey and Illinois would lose $2.3 billion and $2.1 billion, respectively (Figure 7). However, some politicians and commentators may celebrate these drops in worker incomes, arguing that state and local governments would now be able to cut taxes. In economics jargon, there are “opportunity costs” to paying public sector workers middle-class salaries; if their wages decline, governments may be able to reduce overall tax burdens. For this reason, a conservative net effect is also presented in Figure 7 which incorporates both the $16.8 billion drop in state and local government employee compensation and a dollar-for-dollar tax cut resulting in more after-tax household income.5 Even if all states were to offset their lower public sector labor costs with tax cuts, the impact of Janus would be an $11.7 billion drop in annual economic activity, including a $3.1 billion drop in California’s annual economic activity (Figure 7). There are two primary reasons why a post-Janus drop in public sector wages and salaries will have consequences for state economies. State and local government bodies typically provide middle-class salaries for occupations such as teachers, child care workers, counselors, social workers, corrections officers, police officers, firefighters, bus drivers, and office clerks and receptionists. Pay cuts for middle-class workers tend to have detrimental effects on local consumer demand (Dynan et al., 2004). This analysis finds that the impacts would be so large that offsets through lower taxes– which trickle up to the Top 1 Percent6– still result in a net $11.7 billion drop in cumulative GDP. In addition, the drop in annual incomes would make public sector careers less attractive for talented jobseekers. The lower lifetime earnings associated with public sector employment opportunities would reduce the likelihood of college-educated and highly-skilled individuals deciding to become teachers, protective services professionals, and counselors. Over time, this “brain drain” could reduce the quality of public services and public infrastructure, hurting the economy. Ultimately, the Janus decision could reduce annual economic activity in America by between $11.7 billion and $33.4 billion.
5 While it is unlikely each state would respond to lower state and local government labor costs with offsetting tax cuts, this assumption is used for comparative purposes. 6 According to the Current Population Survey Outgoing Rotation Groups (CPS ORG) data, state and local government accounted for 11.3 percent of total U.S. employment in 2017. The Top 5 Percent of all wage earners took home $61.27 or more per hour. Of the Top 5 Percent, just 3.2 percent were employed in state and local government. Similarly, the Top 1 Percent made $99.31 or more per hour. Of the Top 1 Percent, just 0.5 percent were employed by a state or local government agency. Offsetting middle-class wage cuts in the public sector with lower taxes disproportionately benefits rich households who see the largest tax cuts and are the least likely to be employed by the public sector. Because the rich spend less money as a share of their total incomes, the tax-cut offset is not enough to stimulate the broader economy (Dynan et al., 2004).

AFTER JANUS: THE IMPENDING EFFECTS ON PUBLIC SECTOR WORKERS FROM A DECISION AGAINST FAIR SHARE
12
Conclusion
The U.S. labor movement is bracing for a decision by the Supreme Court that could dramatically weaken public sector unions. The case, Janus v. American Federation of State, County, and Municipal Employees, Council 31, et al., is expected to be decided in a vote against fair share fees in the public sector. After Janus, workers would be able to “free ride” and receive services, benefits, and representation from unions without paying union dues or fair share fees for them. A Janus decision that prohibits fair share fees in the public sector would impose lasting changes on the labor movement and U.S. economy. “Right-to-work” conditions in the public sector could reduce the public sector unionization rate by 8 percentage points, translating into a loss of 726,000 union members over time. The decision is expected to decrease the wages of public sector workers by about 4 percent, exacerbating the pay penalty that already exists for serving the public. The effects of Janus would mainly be experienced in the 23 collective bargaining states and the District of Columbia because they do not have so-called “right-to-work” laws. After Janus, states with high public sector union densities may gradually converge to union densities comparable to those in RTW states, resulting in a drop in economic activity of up to $33 billion. All else equal, this implies that California is expected to lose 189,000 union members and as much as $9 billion in annual economic activity, New York would lose 136,000 union members and up to $5 billion in annual economic activity, and Illinois would lose 49,000 union members and as much as $2 billion in annual economic activity. These economic effects occur because middle-class workers would experience erosions in pay, reducing overall consumer demand, and because public sector careers would become less attractive employment opportunities for talented, college-educated jobseekers. Based on comparisons between collective bargaining states and “right-to-work” states, a Janus decision against fair share fees would reduce unionization, lower public sector worker earnings, and have negative impacts on the U.S. economy. The organizational, legal, and political response to Janus will be critical to the long-run survival of the U.S. labor movement and the American middle class.
AFTER JANUS: THE IMPENDING EFFECTS ON PUBLIC SECTOR WORKERS FROM A DECISION AGAINST FAIR SHARE
13
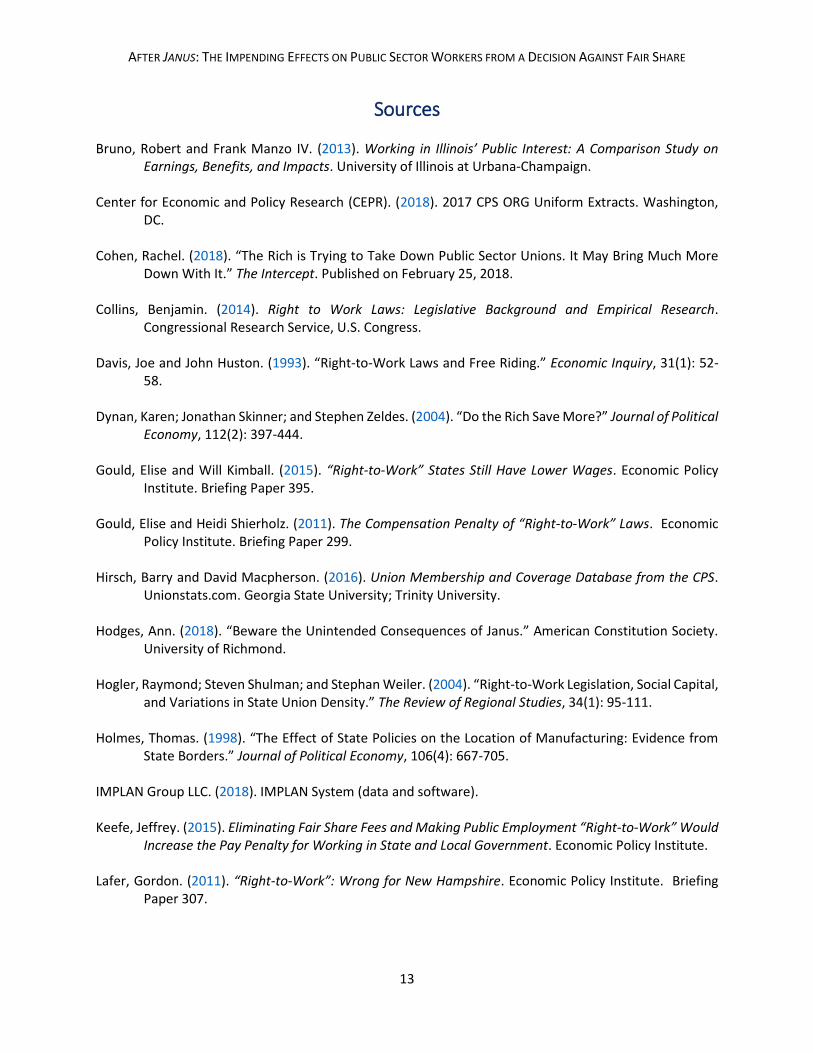
Sources
Bruno, Robert and Frank Manzo IV. (2013). Working in Illinois’ Public Interest: A Comparison Study on
Earnings, Benefits, and Impacts. University of Illinois at Urbana-Champaign.
Center for Economic and Policy Research (CEPR). (2018). 2017 CPS ORG Uniform Extracts. Washington, DC.
Cohen, Rachel. (2018). “The Rich is Trying to Take Down Public Sector Unions. It May Bring Much More
Down With It.” The Intercept. Published on February 25, 2018. Collins, Benjamin. (2014). Right to Work Laws: Legislative Background and Empirical Research.
Congressional Research Service, U.S. Congress. Davis, Joe and John Huston. (1993). “Right-to-Work Laws and Free Riding.” Economic Inquiry, 31(1): 52-
58. Dynan, Karen; Jonathan Skinner; and Stephen Zeldes. (2004). “Do the Rich Save More?” Journal of Political
Economy, 112(2): 397-444. Gould, Elise and Will Kimball. (2015). “Right-to-Work” States Still Have Lower Wages. Economic Policy
Institute. Briefing Paper 395. Gould, Elise and Heidi Shierholz. (2011). The Compensation Penalty of “Right-to-Work” Laws. Economic
Policy Institute. Briefing Paper 299. Hirsch, Barry and David Macpherson. (2016). Union Membership and Coverage Database from the CPS.
Unionstats.com. Georgia State University; Trinity University. Hodges, Ann. (2018). “Beware the Unintended Consequences of Janus.” American Constitution Society.
University of Richmond. Hogler, Raymond; Steven Shulman; and Stephan Weiler. (2004). “Right-to-Work Legislation, Social Capital,
and Variations in State Union Density.” The Review of Regional Studies, 34(1): 95-111. Holmes, Thomas. (1998). “The Effect of State Policies on the Location of Manufacturing: Evidence from
State Borders.” Journal of Political Economy, 106(4): 667-705. IMPLAN Group LLC. (2018). IMPLAN System (data and software). Keefe, Jeffrey. (2015). Eliminating Fair Share Fees and Making Public Employment “Right-to-Work” Would
Increase the Pay Penalty for Working in State and Local Government. Economic Policy Institute. Lafer, Gordon. (2011). “Right-to-Work”: Wrong for New Hampshire. Economic Policy Institute. Briefing
Paper 307.

AFTER JANUS: THE IMPENDING EFFECTS ON PUBLIC SECTOR WORKERS FROM A DECISION AGAINST FAIR SHARE
14
Lafer, Gordon. (2013). The Legislative Attack On American Wages and Labor Standards, 2011–2012. Economic Policy Institute. Briefing Paper 364.
Mannies, Jo. (2018). “Right to Work Affects Unions Most, but All Missouri Voters Will Have a Say in 2018.”
St. Louis Public Radio. Published August 22, 2017. Manzo IV, Frank and Robert Bruno. (2017). (a). The Impact of “Right-to-Work” Laws on Labor Market
Outcomes in Three Midwest States: Evidence from Indiana, Michigan, and Wisconsin (2010-2016). Illinois Economic Policy Institute; University of Illinois at Urbana-Champaign.
Manzo IV, Frank and Robert Bruno. (2017). (b). Union Decline and Economic Redistribution: A Report on Twelve Midwest States. Illinois Economic Policy Institute; University of Illinois at Urbana-Champaign.
Manzo IV, Frank and Robert Bruno. (2014). Free-Rider States: How Low-Wage Employment in “Right-to-Work” States Is Subsidized by the Economic Benefits of Collective Bargaining. Illinois Economic Policy Institute; University of Illinois at Urbana-Champaign.
Manzo IV, Frank; Robert Bruno; and Virginia Parks. (2017). The State of the Unions 2017: A Profile of Unionization in Chicago, in Illinois, and in America. Illinois Economic Policy Institute; University of Illinois at Urbana-Champaign; Occidental College.
Manzo, Jill; Robert Bruno, and Frank Manzo IV. (2017). A Highly Educated Classroom: Illinois Teachers Are
Not Overpaid. Illinois Economic Policy Institute; University of Illinois at Urbana-Champaign Mishel, Lawrence. (2012). Unions, Inequality, and Faltering Middle-Class Wages. Economic Policy
Institute. Issue Brief 342. Moore, William. (1980). “Membership and Wage Impact of Right-to-Work Laws.” Journal of Labor
Research, 1(2): 349-368. National Conference of State Legislatures (NCSL). (2017). Collective Bargaining and Labor Union
Legislation Database, 2010-2016. National Right to Work Committee (NRTWC). (2018). “State Right to Work Timeline.” Orr, Andrea. (2011). “Public-sector Workers Earn Less.” Economic Policy Institute. Schmitt, John. (2008). The Union Wage Advantage for Low-Wage Workers. Center for Economic and Policy
Research. Sherk, James. (2015). How Unions and Right-to-Work Laws Affect the Economy. The Heritage Foundation. Stevans, Lonnie. (2009). “The Effect of Endogenous Right-to-Work Laws on Business and Economic
Conditions in the United States: A Multivariate Approach.” Review of Law and Economics, 5(1): 595-614.

AFTER JANUS: THE IMPENDING EFFECTS ON PUBLIC SECTOR WORKERS FROM A DECISION AGAINST FAIR SHARE
15
Photo Credits
AFSCME Council 31. (2018). “Email Signup Page.” Bishop, Greg. (2017). “U.S. Supreme Court Asked to Take Illinois’ Janus v. AFSCME Case Challenging Forced
Union Dues.” Shutterstock Photo.

AFTER JANUS: THE IMPENDING EFFECTS ON PUBLIC SECTOR WORKERS FROM A DECISION AGAINST FAIR SHARE
16
Appendix Data, Methodology, and Limitations This analysis uses 2017 data from the Current Population Survey Outgoing Rotation Groups (CPS ORG), which is collected, analyzed, and released by the Bureau of Labor Statistics at the U.S. Department of Labor. The Current Population Survey is the survey of households that provides the data for the Department of Labor to release monthly reports on the unemployment rate. In 2017, the CPS ORG included information on 309,989 individuals aged 16 to 85 years old in the United States, including 183,181 persons employed in at least one job and 21,729 employed by a state government or local government. Analytic weights are provided by the Department of Labor to adjust the sample to the actual population 16 years of age or older in the United States. The data was made publicly available by the Center for Economic and Policy Research (CEPR, 2018). In this analysis, RTW is assumed to have no effect on either public sector worker wages or public sector union membership unless statistical analyses provide enough evidence that RTW states and fair-share states are statistically different with a high degree of confidence. This study makes that determination through the use of advanced statistical analyses called regressions. Robust regressions are used to parse out the actual and unique impact that certain variables– such as a RTW law or being a union member– have on wages and labor market outcomes. The technique describes how much the variable is responsible for increasing or decreasing worker wages, after accounting for all other observable factors. Probabilistic regressions– using average marginal effects– are also utilized to determine the average effect of RTW on the probability that any given worker is a union member. Interaction terms are included to more precisely assess the relationships.7 For instance, there are a number of factors that influence the hourly wage of an individual worker, such as demographic and educational factors. A regression can account for these variables when evaluating the impact of RTW laws. However, RTW laws may impact public sector workers differently than private and nonprofit workers, and a Janus decision against fair share fees would effectively introduce RTW into the public sector of collective bargaining states (or non-RTW states). Thus, the important finding is to understand how RTW affects public sector workers after separating out the broader effect of a state having either a RTW regulatory framework or a fair-share collective bargaining law for private and nonprofit workers. The interaction terms allow researchers to conduct these assessments. There are limitations to this analysis. First, data from the Current Population Survey report a worker’s state of residence rather than state of employment, so the results may be biased by public sector workers who live in RTW states but work in collective bargaining states (e.g., living in Indiana but working in Illinois) and vice-versa. The data is also based on household survey responses rather than on administrative payroll reports, so there may be more potential for human error. In addition, there may be problems of simultaneity. Are people less likely to be unionized because of a RTW law or are RTW laws more likely because workers in a given state are less unionized? Historically, low-union states were targeted for RTW lobbying and these historical factors play a role in differences observed in the 2017 analysis. This analysis assumes that, in the present day, workers are less likely to be union members due to RTW laws. Other concerns include those associated with all regression models, such as lurking and unobservable variables. A final issue that could be raised is that RTW laws often exist alongside other “pro-capital” policies such as relatively lower corporate tax rates, subsidized training programs for employers, and other financial
7 In Appendix Tables A, B, and C, this interaction term is RTW*state local or RTW*teacher.

AFTER JANUS: THE IMPENDING EFFECTS ON PUBLIC SECTOR WORKERS FROM A DECISION AGAINST FAIR SHARE
17
incentives (Collins, 2014; Holmes, 1998).8 Similarly, RTW states often have lower costs of living (Sherk, 2015; Gould & Kimball, 2015). These other policies and the cost-of-living consideration could cast doubt on the statistical effect associated with “right-to-work.” However, these concerns are mitigated in this particular analysis on public sector workers due to the interaction terms discussed previously. The isolated RTW variable effectively serves as a proxy for all the “pro-capital” policies and relatively lower cost-of-living associated with “right-to-work” laws.9 The RTW variable should thus be interpreted weakly as an effect that may capture other multicollinear factors that are linked to “right-to-work” laws. This analysis employs a separate interaction term to understand the effects exclusively on public sector workers.
8 Holmes (1998) uses the term “pro-business” to describe RTW states, but a more appropriate terminology would be “pro-capital.” Collective bargaining tends to lead to higher worker wages. Theoretically, this could have consequences for businesses employing union workers (although the businesses have many channels of adjustment in response to the higher wages) but could also support other local businesses due to the higher spending power of the unionized workers. It is therefore not correct to say that either unions or “right-to-work” laws, which limit their power, are “pro-business.” Collective bargaining and “right-to-work” have much more to do with the share of economic productivity that is captured by capital– such as proprietor income, capital gains, stocks, dividends, machinery, and automation– and the share of economic productivity that is earned by labor– such as employee wages and benefits (Manzo & Bruno, 2017b). Thus, RTW laws are better described as being “pro-capital” than “pro-business.” 9 In addition, the regressions also control for urban status– i.e., whether the worker lives in a city center, a suburb, or in rural America– which is also highly correlated with the cost-of-living.
AFTER JANUS: THE IMPENDING EFFECTS ON PUBLIC SECTOR WORKERS FROM A DECISION AGAINST FAIR SHARE
18
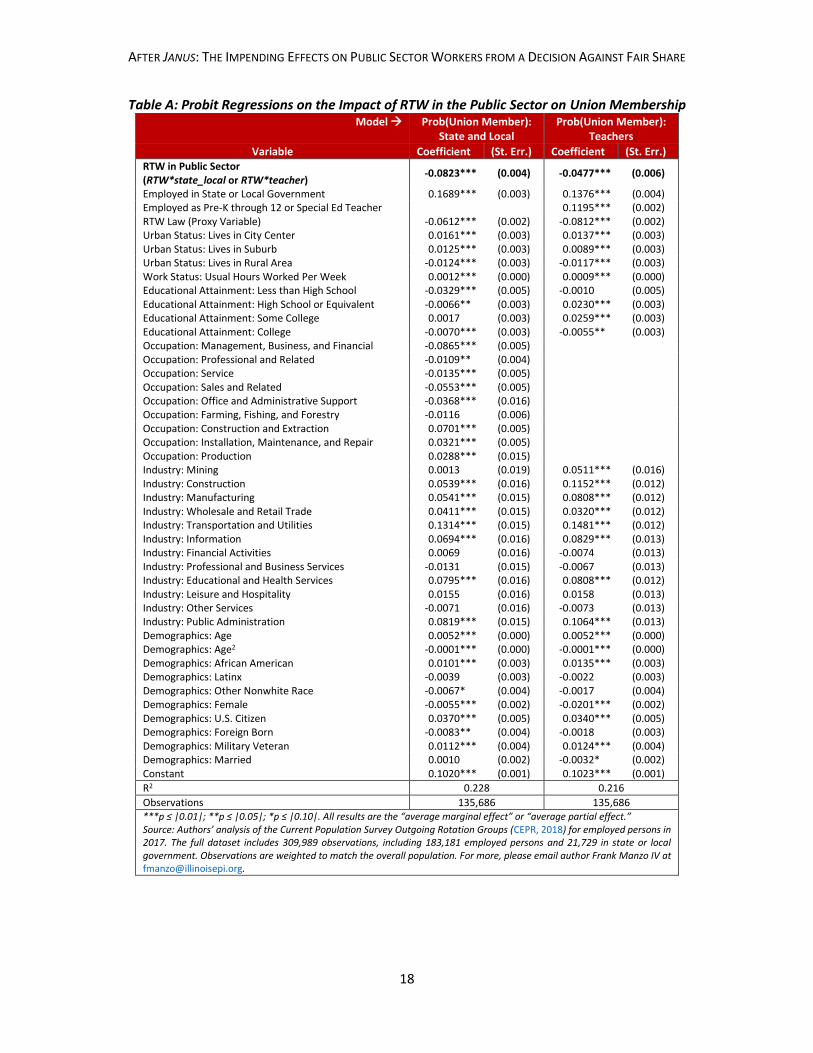
Table A: Probit Regressions on the Impact of RTW in the Public Sector on Union Membership Model Prob(Union Member):
State and Local Prob(Union Member):
Teachers
Variable Coefficient (St. Err.) Coefficient (St. Err.) RTW in Public Sector (RTW*state_local or RTW*teacher)
-0.0823*** (0.004) -0.0477*** (0.006)
Employed in State or Local Government 0.1689*** (0.003) 0.1376*** (0.004) Employed as Pre-K through 12 or Special Ed Teacher 0.1195*** (0.002) RTW Law (Proxy Variable) -0.0612*** (0.002) -0.0812*** (0.002) Urban Status: Lives in City Center 0.0161*** (0.003) 0.0137*** (0.003) Urban Status: Lives in Suburb 0.0125*** (0.003) 0.0089*** (0.003) Urban Status: Lives in Rural Area -0.0124*** (0.003) -0.0117*** (0.003) Work Status: Usual Hours Worked Per Week 0.0012*** (0.000) 0.0009*** (0.000) Educational Attainment: Less than High School -0.0329*** (0.005) -0.0010*** (0.005) Educational Attainment: High School or Equivalent -0.0066*** (0.003) 0.0230*** (0.003) Educational Attainment: Some College 0.0017*** (0.003) 0.0259*** (0.003) Educational Attainment: College -0.0070*** (0.003) -0.0055*** (0.003) Occupation: Management, Business, and Financial -0.0865*** (0.005) Occupation: Professional and Related -0.0109*** (0.004) Occupation: Service -0.0135*** (0.005) Occupation: Sales and Related -0.0553*** (0.005) Occupation: Office and Administrative Support -0.0368*** (0.016) Occupation: Farming, Fishing, and Forestry -0.0116*** (0.006) Occupation: Construction and Extraction 0.0701*** (0.005) Occupation: Installation, Maintenance, and Repair 0.0321*** (0.005) Occupation: Production 0.0288*** (0.015) Industry: Mining 0.0013*** (0.019) 0.0511*** (0.016) Industry: Construction 0.0539*** (0.016) 0.1152*** (0.012) Industry: Manufacturing 0.0541*** (0.015) 0.0808*** (0.012) Industry: Wholesale and Retail Trade 0.0411*** (0.015) 0.0320*** (0.012) Industry: Transportation and Utilities 0.1314*** (0.015) 0.1481*** (0.012) Industry: Information 0.0694*** (0.016) 0.0829*** (0.013) Industry: Financial Activities 0.0069*** (0.016) -0.0074*** (0.013) Industry: Professional and Business Services -0.0131*** (0.015) -0.0067*** (0.013) Industry: Educational and Health Services 0.0795*** (0.016) 0.0808*** (0.012) Industry: Leisure and Hospitality 0.0155*** (0.016) 0.0158*** (0.013) Industry: Other Services -0.0071*** (0.016) -0.0073*** (0.013) Industry: Public Administration 0.0819*** (0.015) 0.1064*** (0.013) Demographics: Age 0.0052*** (0.000) 0.0052*** (0.000) Demographics: Age2 -0.0001*** (0.000) -0.0001*** (0.000) Demographics: African American 0.0101*** (0.003) 0.0135*** (0.003) Demographics: Latinx -0.0039*** (0.003) -0.0022*** (0.003) Demographics: Other Nonwhite Race -0.0067*** (0.004) -0.0017*** (0.004) Demographics: Female -0.0055*** (0.002) -0.0201*** (0.002) Demographics: U.S. Citizen 0.0370*** (0.005) 0.0340*** (0.005) Demographics: Foreign Born -0.0083*** (0.004) -0.0018*** (0.003) Demographics: Military Veteran 0.0112*** (0.004) 0.0124*** (0.004) Demographics: Married 0.0010*** (0.002) -0.0032*** (0.002) Constant 0.1020*** (0.001) 0.1023*** (0.001)
R2 0.228 0.216
Observations 135,686 135,686 ***p ≤ |0.01|; **p ≤ |0.05|; *p ≤ |0.10|. All results are the “average marginal effect” or “average partial effect.” Source: Authors’ analysis of the Current Population Survey Outgoing Rotation Groups (CEPR, 2018) for employed persons in 2017. The full dataset includes 309,989 observations, including 183,181 employed persons and 21,729 in state or local government. Observations are weighted to match the overall population. For more, please email author Frank Manzo IV at [email protected].
AFTER JANUS: THE IMPENDING EFFECTS ON PUBLIC SECTOR WORKERS FROM A DECISION AGAINST FAIR SHARE
19
Table B: Robust Regressions on the Impact of RTW in the Public Sector on Hourly Wages Model ln(wage):
State and Local ln(wage): Teachers
Variable Coefficient (St. Err.) Coefficient (St. Err.) RTW in Public Sector (RTW*state_local or RTW*teacher)
-0.0272*** (0.009) -0.0478*** (0.015)
Union Member 0.1041*** (0.005) 0.1203*** (0.005) Employed in State or Local Government -0.0990*** (0.007) -0.0803*** (0.006) Employed as Pre-K through 12 or Special Ed Teacher -0.1534*** (0.012) RTW Law (Proxy Variable) -0.0718*** (0.003) -0.0706*** (0.003) Urban Status: Lives in City Center 0.0570*** (0.005) 0.0568*** (0.005) Urban Status: Lives in Suburb 0.0658*** (0.004) 0.0667*** (0.004) Urban Status: Lives in Rural Area -0.0251*** (0.005) -0.0246*** (0.005) Work Status: Usual Hours Worked Per Week 0.0053*** (0.000) 0.0054*** (0.000) Educational Attainment: Less than High School -0.5736*** (0.008) -0.5763*** (0.008) Educational Attainment: High School or Equivalent -0.4465*** (0.006) -0.4510*** (0.006) Educational Attainment: Some College -0.3922*** (0.006) -0.3991*** (0.006) Educational Attainment: College -0.1435*** (0.006) -0.1439*** (0.006) Occupation: Management, Business, and Financial 0.4458*** (0.025) 0.4421*** (0.025) Occupation: Professional and Related 0.3801*** (0.025) 0.3950*** (0.025) Occupation: Service 0.0404*** (0.025) 0.0346*** (0.025) Occupation: Sales and Related 0.1578*** (0.025) 0.1574*** (0.025) Occupation: Office and Administrative Support 0.1277*** (0.025) 0.1240*** (0.025) Occupation: Farming, Fishing, and Forestry Occupation: Construction and Extraction 0.1982*** (0.026) 0.1966*** (0.026) Occupation: Installation, Maintenance, and Repair 0.2500*** (0.026) 0.2500*** (0.026) Occupation: Production 0.0809*** (0.025) 0.0820*** (0.025) Occupation: Transportation and Material Moving 0.0153*** (0.025) 0.0150*** (0.025) Industry: Mining 0.3111*** (0.030) 0.3098*** (0.030) Industry: Construction 0.1376*** (0.024) 0.1372*** (0.024) Industry: Manufacturing 0.1651*** (0.023) 0.1629*** (0.023) Industry: Wholesale and Retail Trade 0.0092*** (0.023) 0.0102*** (0.023) Industry: Transportation and Utilities 0.1528*** (0.024) 0.1493*** (0.024) Industry: Information 0.1457*** (0.026) 0.1380*** (0.026) Industry: Financial Activities 0.1456*** (0.024) 0.1454*** (0.024) Industry: Professional and Business Services 0.1282*** (0.023) 0.1244*** (0.023) Industry: Educational and Health Services 0.0228*** (0.023) 0.0334*** (0.023) Industry: Leisure and Hospitality -0.0236*** (0.024) -0.0195*** (0.024) Industry: Other Services -0.0332*** (0.024) -0.0323*** (0.024) Industry: Public Administration 0.2144*** (0.024) 0.1858*** (0.024) Demographics: Age 0.0339*** (0.001) 0.0339*** (0.001) Demographics: Age2 -0.0003*** (0.000) -0.0003*** (0.000) Demographics: African American -0.1220*** (0.005) -0.1230*** (0.005) Demographics: Latinx -0.0624*** (0.005) -0.0607*** (0.005) Demographics: Other Nonwhite Race 0.0170*** (0.006) 0.0130*** (0.006) Demographics: Female -0.1549*** (0.003) -0.1515*** (0.003) Demographics: U.S. Citizen 0.0833*** (0.008) 0.0821*** (0.008) Demographics: Foreign Born -0.0206*** (0.006) -0.0235*** (0.006) Demographics: Military Veteran 0.0009*** (0.007) 0.0020*** (0.007) Demographics: Married 0.0685*** (0.003) 0.0698*** (0.003) Constant 1.9756*** (0.022) 1.9749*** (0.022)
R2 0.443 0.445
Observations 135,223 135,223 ***p ≤ |0.01|; **p ≤ |0.05|; *p ≤ |0.10|. All results are the average effect. Source: Authors’ analysis of the Current Population Survey Outgoing Rotation Groups (CEPR, 2018) for employed persons in 2017. The full dataset includes 309,989 observations, including 183,181 employed persons and 21,729 in state or local government. Observations are weighted to match the overall population. For more, please email author Frank Manzo IV at [email protected].

AFTER JANUS: THE IMPENDING EFFECTS ON PUBLIC SECTOR WORKERS FROM A DECISION AGAINST FAIR SHARE
20
Table C: Quantile (Median) Regressions on the Impact of RTW in the Public Sector on Hourly Wages Model ln(wage):
State and Local ln(wage): Teachers
Variable Coefficient (St. Err.) Coefficient (St. Err.) RTW in Public Sector (RTW*state_local or RTW*teacher)
-0.0378*** (0.009) -0.0635*** (0.015)
Union Member 0.1069*** (0.006) 0.1282*** (0.006) Employed in State or Local Government -0.0991*** (0.008) -0.0760*** (0.006) Employed as Pre-K through 12 or Special Ed Teacher -0.1734*** (0.013) RTW Law (Proxy Variable) -0.0718*** (0.003) -0.0712*** (0.003) Urban Status: Lives in City Center 0.0584*** (0.005) 0.0569*** (0.005) Urban Status: Lives in Suburb 0.0681*** (0.004) 0.0688*** (0.005) Urban Status: Lives in Rural Area -0.0231*** (0.005) -0.0216*** (0.005) Work Status: Usual Hours Worked Per Week 0.0072*** (0.000) 0.0073*** (0.000) Educational Attainment: Less than High School -0.5695*** (0.008) -0.5819*** (0.008) Educational Attainment: High School or Equivalent -0.4592*** (0.007) -0.4715*** (0.007) Educational Attainment: Some College -0.4058*** (0.006) -0.4189*** (0.006) Educational Attainment: College -0.1535*** (0.007) -0.1603*** (0.007) Occupation: Management, Business, and Financial 0.4271*** (0.009) 0.4202*** (0.009) Occupation: Professional and Related 0.3670*** (0.008) 0.3843*** (0.009) Occupation: Service 0.0238*** (0.008) 0.0171*** (0.008) Occupation: Sales and Related 0.1187*** (0.009) 0.1160*** (0.009) Occupation: Office and Administrative Support 0.1129*** (0.008) 0.1067*** (0.008) Occupation: Farming, Fishing, and Forestry -0.0513*** (0.021) -0.0506*** (0.021) Occupation: Construction and Extraction 0.1656*** (0.012) 0.1659*** (0.013) Occupation: Installation, Maintenance, and Repair 0.2605*** (0.011) 0.2585*** (0.012) Occupation: Production 0.0557*** (0.009) 0.0568*** (0.009) Occupation: Transportation and Material Moving Industry: Mining 0.2959*** (0.029) 0.2941*** (0.028) Industry: Construction 0.1058*** (0.023) 0.1092*** (0.022) Industry: Manufacturing 0.1284*** (0.021) 0.1313*** (0.021) Industry: Wholesale and Retail Trade -0.0400*** (0.021) -0.0331*** (0.021) Industry: Transportation and Utilities 0.1190*** (0.022) 0.1208*** (0.022) Industry: Information 0.0979*** (0.023) 0.0956*** (0.023) Industry: Financial Activities 0.0938*** (0.022) 0.0992*** (0.021) Industry: Professional and Business Services 0.0866*** (0.021) 0.0849*** (0.021) Industry: Educational and Health Services -0.0121*** (0.021) 0.0026*** (0.021) Industry: Leisure and Hospitality -0.0523*** (0.021) -0.0434*** (0.021) Industry: Other Services -0.0518*** (0.022) -0.0461*** (0.022) Industry: Public Administration 0.1896*** (0.022) 0.1525*** (0.022) Demographics: Age 0.0293*** (0.001) 0.0292*** (0.001) Demographics: Age2 -0.0003*** (0.000) -0.0003*** (0.000) Demographics: African American -0.1160*** (0.005) -0.1168*** (0.005) Demographics: Latinx -0.0615*** (0.005) -0.0592*** (0.005) Demographics: Other Nonwhite Race 0.0230*** (0.007) 0.0174*** (0.007) Demographics: Female -0.1407*** (0.004) -0.1364*** (0.004) Demographics: U.S. Citizen 0.0888*** (0.008) 0.0876*** (0.008) Demographics: Foreign Born -0.0213*** (0.006) -0.0233*** (0.007) Demographics: Military Veteran 0.0009*** (0.008) 0.0122*** (0.009) Demographics: Married 0.0743*** (0.004) 0.0748*** (0.004) Constant 2.0348*** (0.027) 2.0395*** (0.027)
R2 0.300 0.303
Observations 135,223 135,223 ***p ≤ |0.01|; **p ≤ |0.05|; *p ≤ |0.10|. All results are median effect. Source: Authors’ analysis of the Current Population Survey Outgoing Rotation Groups (CEPR, 2018) for employed persons in 2017. The full dataset includes 309,989 observations, including 183,181 employed persons and 21,729 in state or local government. Observations are weighted to match the overall population. For more, please email author Frank Manzo IV at [email protected].
AFTER JANUS: THE IMPENDING EFFECTS ON PUBLIC SECTOR WORKERS FROM A DECISION AGAINST FAIR SHARE
21
Table D: Union Membership Rates by Sector of Employment, RTW States vs. CB States, 2017
State Private and
Nonprofit Workers: Unionization (2017)
State and Local Government Employees:
Unionization (2017)
Pre-K through 12 and Special Ed Teachers: Unionization (2017)
Alabama 7.4% 23.5% 45.6% Arizona 4.0% 16.0% 28.8% Arkansas 5.1% 10.1% 26.3% Florida 5.6% 25.4% 41.7% Georgia 4.0% 11.0% 22.9% Idaho 4.8% 13.7% 43.8% Indiana 8.9% 26.0% 62.5% Iowa 7.0% 20.1% 43.3% Kansas 7.8% 15.5% 32.0% Kentucky 9.7% 17.2% 38.1% Louisiana 4.4% 10.0% 21.8% Michigan 15.6% 47.2% 77.8% Mississippi 5.3% 10.7% 22.4% Nebraska 8.1% 27.5% 68.6% Nevada 12.7% 35.9% 53.7% North Carolina 3.4% 8.2% 8.6% North Dakota 5.1% 16.3% 51.5% Oklahoma 5.5% 13.0% 30.3% South Carolina 2.6% 6.4% 12.5% South Dakota 5.3% 16.7% 33.2% Tennessee 5.7% 16.5% 32.3% Texas 4.7% 14.1% 30.6% Utah 3.9% 12.5% 28.1% Virginia 4.6% 13.1% 30.4% West Virginia 11.0% 26.8% 55.1% Wisconsin 8.3% 18.5% 39.8% Wyoming 6.0% 11.6% 32.6%
All "Right-to-Work" States 6.2% 17.8% 35.3%
Alaska 18.1% 50.9% 74.5% California 15.5% 58.3% 75.6% Colorado 9.5% 19.6% 40.0% Connecticut 17.0% 68.3% 91.1% Delaware 10.8% 43.2% 78.0% District of Columbia 9.7% 40.1% 50.9% Hawaii 21.3% 61.3% 76.5% Illinois 15.0% 52.1% 79.7% Maine 11.4% 51.0% 65.8% Maryland 10.7% 41.9% 68.3% Massachusetts 12.4% 57.2% 76.0% Minnesota 15.2% 54.3% 75.0% Missouri* 8.6% 14.6% 34.1% Montana 11.8% 36.4% 64.3% New Hampshire 11.2% 50.3% 74.4% New Jersey 16.1% 64.1% 85.4% New Mexico 6.7% 17.9% 35.6% New York 23.8% 69.8% 86.8% Ohio 12.5% 44.5% 73.5% Oregon 14.9% 54.4% 74.6% Pennsylvania 12.0% 52.5% 83.6% Rhode Island 16.1% 69.1% 79.9% Vermont 11.0% 48.2% 70.6% Washington 18.7% 55.9% 77.2%
All Collective Bargaining States 15.2% 53.7% 75.3%
United States Total 10.7% 36.1% 54.8% Source: Authors’ analysis of the Current Population Survey Outgoing Rotation Groups (CEPR, 2018) for employed persons in 2017. The full dataset includes 309,989 observations. Observations are weighted to match the overall population.