afro cps final - who | world health organization cps final.indd 1fro cps final.indd 1 113/01/2011...
TRANSCRIPT
1
PATTERNS OF DRINKING
ABSTAINERS (15+ years), 2004
Males Females Total
Lifetime abstainers 83.8% 93.7% 88.7%
Former drinkers 11.4% 2.6% 7.1%
Abstainers* 95.2% 96.3% 95.8%
* Persons who did not drink in the past 12 months.
DRINKERS ONLY
Adult (15+ years) per capita consumption*, total 22.62
Adult (15+ years) per capita consumption*, males 26.53
Adult (15+ years) per capita consumption*, females 15.63
Heavy episodic drinkers** (15–85+ years), males —
Heavy episodic drinkers** (15–85+ years), females —
* (Recorded + unrecorded – tourist) in litres of pure alcohol, average 2003–2005.** Had at least 60 grams or more of pure alcohol on at least one occasion weekly.
PATTERNS OF DRINKING SCORE
Patterns of drinking score* LEAST RISKY 1 2 3 4 5 MOST RISKY
* Given the same level of consumption, the higher the patterns of drinking score, the greater the alcohol-attributable burden of disease for the country.
ALCOHOL POLICYExcise tax on beer / wine / spirits Yes / Yes / Yes
National legal minimum age for off-premise sales of alcoholic beverages (selling) (beer / wine / spirits) 18 / 18 / 18
National legal minimum age for on-premise sales of alcoholic beverages (serving) (beer / wine / spirits) 18 / 18 / 18
Restrictions for on-/off-premise sales of alcoholic beverages:Time (hours and days) / location (places and density) No / YesSpecifi c events / intoxicated persons / petrol stations Yes / No / Yes
National maximum legal blood alcohol concentration (BAC) when driving a vehicle (general / young / professional), in % 0.08 / 0.08 / 0.08
Legally binding regulations on alcohol advertising / product placement Yes / Yes
Legally binding regulations on alcohol sponsorship / sales promotion Yes / Yes
HEALTH CONSEQUENCES
MORBIDITY
Prevalence estimates (12-month prevalence for 2004): Males Females
Alcohol use disorders (15+ years) 0.26% 0.03%
ALL CAUSE MORTALITY
Age-standardized deaths rates, 15+ years (per 100,000 population)
2000 2001 2002 2003 2004 2005
M F M F M F M F M F M F
Liver cirrhosisNo information availableRoad traffi c
accidents (1)
Data source: WHO Mortality Database, data as reported by countries (1) refer to transport accidents.
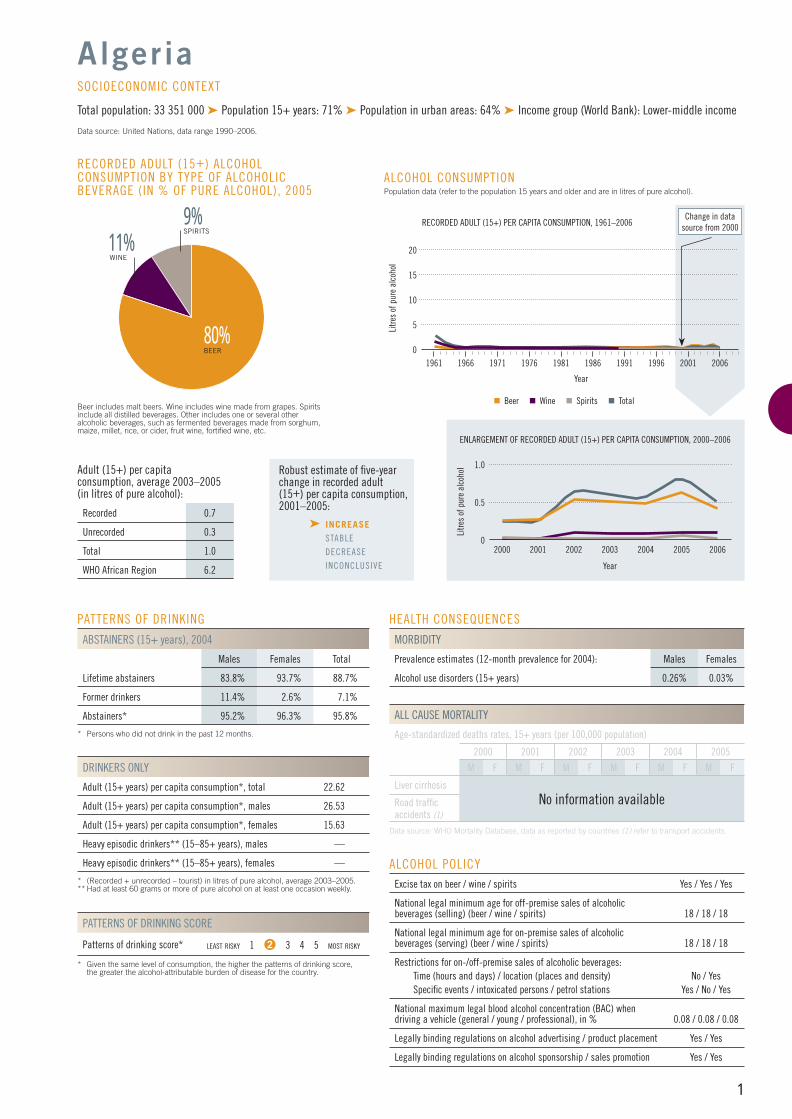
80%BEER
9%SPIRITS
RECORDED ADULT (15+) ALCOHOL CONSUMPTION BY TYPE OF ALCOHOLIC BEVERAGE (IN % OF PURE ALCOHOL), 2005
Beer includes malt beers. Wine includes wine made from grapes. Spirits include all distilled beverages. Other includes one or several other alcoholic beverages, such as fermented beverages made from sorghum, maize, millet, rice, or cider, fruit wine, fortifi ed wine, etc.
Adult (15+) per capita consumption, average 2003–2005 (in litres of pure alcohol):
Recorded 0.7
Unrecorded 0.3
Total 1.0
WHO African Region 6.2
Algeria
Total population: 33 351 000 ➤ Population 15+ years: 71% ➤ Population in urban areas: 64% ➤ Income group (World Bank): Lower-middle income
Data source: United Nations, data range 1990–2006.
SOCIOECONOMIC CONTEXT
Robust estimate of fi ve-year change in recorded adult(15+) per capita consumption,2001–2005:
➤ INCREASE STABLE
DECREASE
INCONCLUSIVE
11%WINE
1.0
0.5
2000 2002 2004
Litre
s of
pur
e al
coho
l
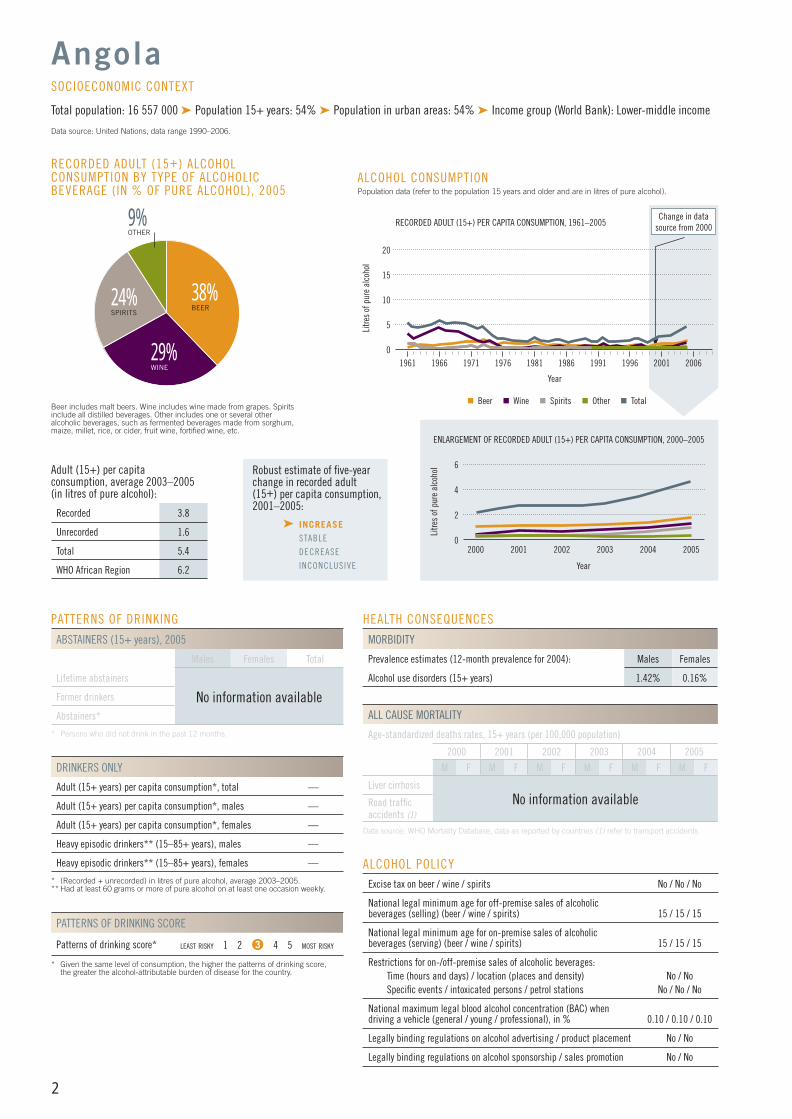
ENLARGEMENT OF RECORDED ADULT (15+) PER CAPITA CONSUMPTION, 2000–2006
Year
2003 2005 20062001
Beer Wine Spirits Total
ALCOHOL CONSUMPTION Population data (refer to the population 15 years and older and are in litres of pure alcohol).
15
5
10
1961 1966 1976
Litre
s of
pur
e al
coho
l
1991
RECORDED ADULT (15+) PER CAPITA CONSUMPTION, 1961–2006
Year
1971 1981 2001
20
19961986 2006
Change in data source from 2000
0
0
AFRO CPs FINAL.indd 1AFRO CPs FINAL.indd 1 13/01/2011 08:4513/01/2011 08:45
2
PATTERNS OF DRINKING
ABSTAINERS (15+ years), 2005
Males Females Total
Lifetime abstainers
No information availableFormer drinkers
Abstainers*
* Persons who did not drink in the past 12 months.
DRINKERS ONLY
Adult (15+ years) per capita consumption*, total —
Adult (15+ years) per capita consumption*, males —
Adult (15+ years) per capita consumption*, females —
Heavy episodic drinkers** (15–85+ years), males —
Heavy episodic drinkers** (15–85+ years), females —
* (Recorded + unrecorded) in litres of pure alcohol, average 2003–2005.** Had at least 60 grams or more of pure alcohol on at least one occasion weekly.
PATTERNS OF DRINKING SCORE
Patterns of drinking score* LEAST RISKY 1 2 3 4 5 MOST RISKY
* Given the same level of consumption, the higher the patterns of drinking score, the greater the alcohol-attributable burden of disease for the country.
ALCOHOL POLICYExcise tax on beer / wine / spirits No / No / No
National legal minimum age for off-premise sales of alcoholic beverages (selling) (beer / wine / spirits) 15 / 15 / 15
National legal minimum age for on-premise sales of alcoholic beverages (serving) (beer / wine / spirits) 15 / 15 / 15
Restrictions for on-/off-premise sales of alcoholic beverages:Time (hours and days) / location (places and density) No / NoSpecifi c events / intoxicated persons / petrol stations No / No / No
National maximum legal blood alcohol concentration (BAC) when driving a vehicle (general / young / professional), in % 0.10 / 0.10 / 0.10
Legally binding regulations on alcohol advertising / product placement No / No
Legally binding regulations on alcohol sponsorship / sales promotion No / No
HEALTH CONSEQUENCES
MORBIDITY
Prevalence estimates (12-month prevalence for 2004): Males Females
Alcohol use disorders (15+ years) 1.42% 0.16%
ALL CAUSE MORTALITY
Age-standardized deaths rates, 15+ years (per 100,000 population)
2000 2001 2002 2003 2004 2005
M F M F M F M F M F M F
Liver cirrhosisNo information availableRoad traffi c
accidents (1)
Data source: WHO Mortality Database, data as reported by countries (1) refer to transport accidents.
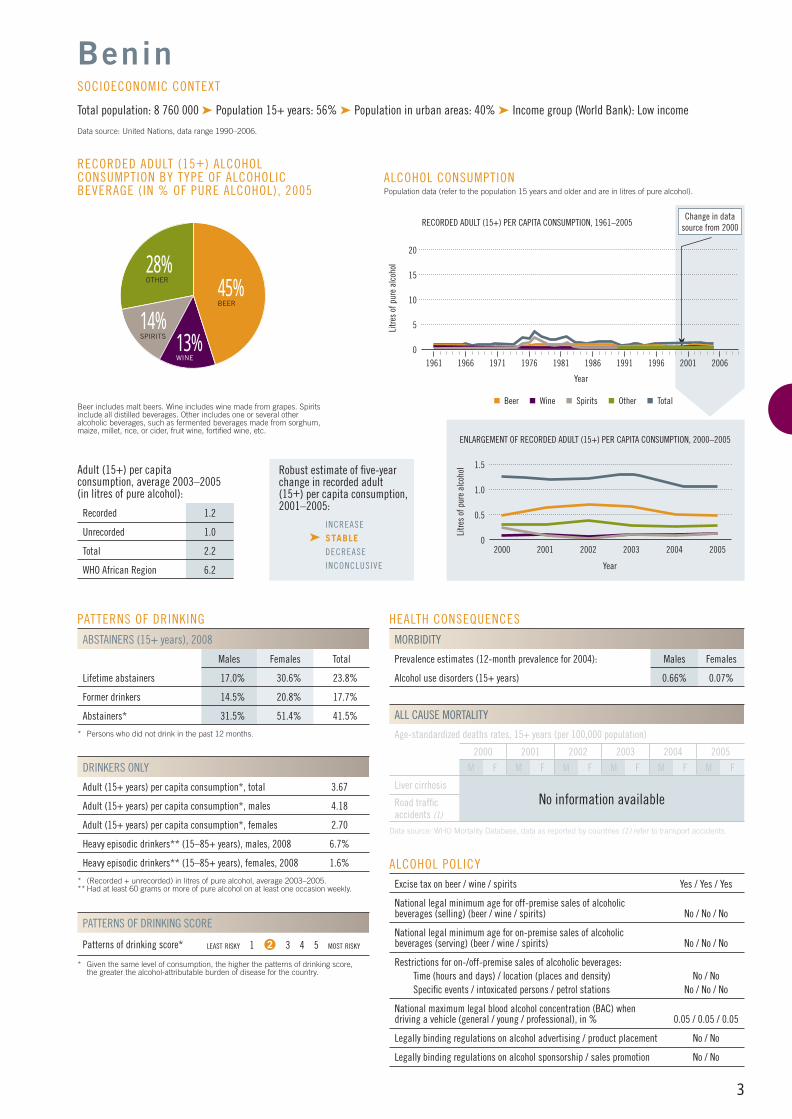
29%WINE
24%SPIRITS
9%OTHER
RECORDED ADULT (15+) ALCOHOL CONSUMPTION BY TYPE OF ALCOHOLIC BEVERAGE (IN % OF PURE ALCOHOL), 2005
Beer includes malt beers. Wine includes wine made from grapes. Spirits include all distilled beverages. Other includes one or several other alcoholic beverages, such as fermented beverages made from sorghum, maize, millet, rice, or cider, fruit wine, fortifi ed wine, etc.
Adult (15+) per capita consumption, average 2003–2005 (in litres of pure alcohol):
Recorded 3.8
Unrecorded 1.6
Total 5.4
WHO African Region 6.2
Angola
Total population: 16 557 000 ➤ Population 15+ years: 54% ➤ Population in urban areas: 54% ➤ Income group (World Bank): Lower-middle income
Data source: United Nations, data range 1990–2006.
SOCIOECONOMIC CONTEXT
Robust estimate of fi ve-year change in recorded adult(15+) per capita consumption,2001–2005:
➤ INCREASE STABLE
DECREASE
INCONCLUSIVE
6
2
4
2000 2002 2004
Litre
s of
pur
e al
coho
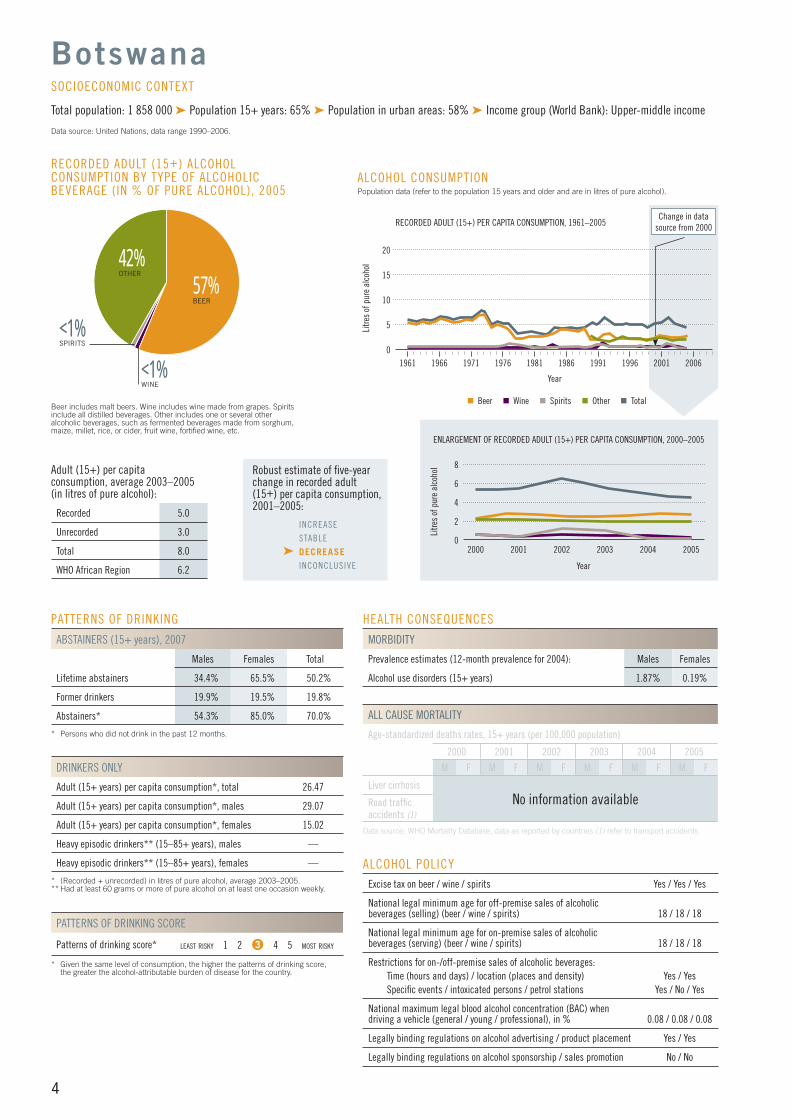
lENLARGEMENT OF RECORDED ADULT (15+) PER CAPITA CONSUMPTION, 2000–2005
Year
2003 20052001
ALCOHOL CONSUMPTION Population data (refer to the population 15 years and older and are in litres of pure alcohol).
15
5
10
1961 1966 1976Li
tres
of p
ure
alco
hol
1991
RECORDED ADULT (15+) PER CAPITA CONSUMPTION, 1961–2005
Year
1971 1981 2001
20
19961986 2006
Change in data source from 2000
0
Beer Wine Spirits Other Total
0
38%BEER
AFRO CPs FINAL.indd 2AFRO CPs FINAL.indd 2 13/01/2011 08:4513/01/2011 08:45
3
PATTERNS OF DRINKING
ABSTAINERS (15+ years), 2008
Males Females Total
Lifetime abstainers 17.0% 30.6% 23.8%
Former drinkers 14.5% 20.8% 17.7%
Abstainers* 31.5% 51.4% 41.5%
* Persons who did not drink in the past 12 months.
DRINKERS ONLY
Adult (15+ years) per capita consumption*, total 3.67
Adult (15+ years) per capita consumption*, males 4.18
Adult (15+ years) per capita consumption*, females 2.70
Heavy episodic drinkers** (15–85+ years), males, 2008 6.7%
Heavy episodic drinkers** (15–85+ years), females, 2008 1.6%
* (Recorded + unrecorded) in litres of pure alcohol, average 2003–2005.** Had at least 60 grams or more of pure alcohol on at least one occasion weekly.
PATTERNS OF DRINKING SCORE
Patterns of drinking score* LEAST RISKY 1 2 3 4 5 MOST RISKY
* Given the same level of consumption, the higher the patterns of drinking score, the greater the alcohol-attributable burden of disease for the country.
ALCOHOL POLICYExcise tax on beer / wine / spirits Yes / Yes / Yes
National legal minimum age for off-premise sales of alcoholic beverages (selling) (beer / wine / spirits) No / No / No
National legal minimum age for on-premise sales of alcoholic beverages (serving) (beer / wine / spirits) No / No / No
Restrictions for on-/off-premise sales of alcoholic beverages:Time (hours and days) / location (places and density) No / NoSpecifi c events / intoxicated persons / petrol stations No / No / No
National maximum legal blood alcohol concentration (BAC) when driving a vehicle (general / young / professional), in % 0.05 / 0.05 / 0.05
Legally binding regulations on alcohol advertising / product placement No / No
Legally binding regulations on alcohol sponsorship / sales promotion No / No
HEALTH CONSEQUENCES
MORBIDITY
Prevalence estimates (12-month prevalence for 2004): Males Females
Alcohol use disorders (15+ years) 0.66% 0.07%
ALL CAUSE MORTALITY
Age-standardized deaths rates, 15+ years (per 100,000 population)
2000 2001 2002 2003 2004 2005
M F M F M F M F M F M F
Liver cirrhosisNo information availableRoad traffi c
accidents (1)
Data source: WHO Mortality Database, data as reported by countries (1) refer to transport accidents.
45%BEER
14%SPIRITS
28%OTHER
13%WINE
RECORDED ADULT (15+) ALCOHOL CONSUMPTION BY TYPE OF ALCOHOLIC BEVERAGE (IN % OF PURE ALCOHOL), 2005
Beer includes malt beers. Wine includes wine made from grapes. Spirits include all distilled beverages. Other includes one or several other alcoholic beverages, such as fermented beverages made from sorghum, maize, millet, rice, or cider, fruit wine, fortifi ed wine, etc.
Adult (15+) per capita consumption, average 2003–2005 (in litres of pure alcohol):
Recorded 1.2
Unrecorded 1.0
Total 2.2
WHO African Region 6.2
Benin
Total population: 8 760 000 ➤ Population 15+ years: 56% ➤ Population in urban areas: 40% ➤ Income group (World Bank): Low income
Data source: United Nations, data range 1990–2006.
SOCIOECONOMIC CONTEXT
Robust estimate of fi ve-year change in recorded adult(15+) per capita consumption,2001–2005:
INCREASE
➤ STABLE DECREASE
INCONCLUSIVE
1.5
0.5
1.0
2000 2002 2004
Litre
s of
pur
e al
coho
l
ENLARGEMENT OF RECORDED ADULT (15+) PER CAPITA CONSUMPTION, 2000–2005
Year
2003 20052001
ALCOHOL CONSUMPTION Population data (refer to the population 15 years and older and are in litres of pure alcohol).
15
5
10
1961 1966 1976
Litre
s of
pur
e al
coho
l
1991
RECORDED ADULT (15+) PER CAPITA CONSUMPTION, 1961–2005
Year
1971 1981 2001
20
19961986 2006
Change in data source from 2000
Beer Wine Spirits Other Total
0
0
AFRO CPs FINAL.indd 3AFRO CPs FINAL.indd 3 13/01/2011 08:4513/01/2011 08:45
4
PATTERNS OF DRINKING
ABSTAINERS (15+ years), 2007
Males Females Total
Lifetime abstainers 34.4% 65.5% 50.2%
Former drinkers 19.9% 19.5% 19.8%
Abstainers* 54.3% 85.0% 70.0%
* Persons who did not drink in the past 12 months.
DRINKERS ONLY
Adult (15+ years) per capita consumption*, total 26.47
Adult (15+ years) per capita consumption*, males 29.07
Adult (15+ years) per capita consumption*, females 15.02
Heavy episodic drinkers** (15–85+ years), males —
Heavy episodic drinkers** (15–85+ years), females —
* (Recorded + unrecorded) in litres of pure alcohol, average 2003–2005.** Had at least 60 grams or more of pure alcohol on at least one occasion weekly.
PATTERNS OF DRINKING SCORE
Patterns of drinking score* LEAST RISKY 1 2 3 4 5 MOST RISKY
* Given the same level of consumption, the higher the patterns of drinking score, the greater the alcohol-attributable burden of disease for the country.
ALCOHOL POLICYExcise tax on beer / wine / spirits Yes / Yes / Yes
National legal minimum age for off-premise sales of alcoholic beverages (selling) (beer / wine / spirits) 18 / 18 / 18
National legal minimum age for on-premise sales of alcoholic beverages (serving) (beer / wine / spirits) 18 / 18 / 18
Restrictions for on-/off-premise sales of alcoholic beverages:Time (hours and days) / location (places and density) Yes / YesSpecifi c events / intoxicated persons / petrol stations Yes / No / Yes
National maximum legal blood alcohol concentration (BAC) when driving a vehicle (general / young / professional), in % 0.08 / 0.08 / 0.08
Legally binding regulations on alcohol advertising / product placement Yes / Yes
Legally binding regulations on alcohol sponsorship / sales promotion No / No
HEALTH CONSEQUENCES
MORBIDITY
Prevalence estimates (12-month prevalence for 2004): Males Females
Alcohol use disorders (15+ years) 1.87% 0.19%
ALL CAUSE MORTALITY
Age-standardized deaths rates, 15+ years (per 100,000 population)
2000 2001 2002 2003 2004 2005
M F M F M F M F M F M F
Liver cirrhosisNo information availableRoad traffi c
accidents (1)
Data source: WHO Mortality Database, data as reported by countries (1) refer to transport accidents.
57%BEER
42%OTHER
<1%SPIRITS
RECORDED ADULT (15+) ALCOHOL CONSUMPTION BY TYPE OF ALCOHOLIC BEVERAGE (IN % OF PURE ALCOHOL), 2005
Beer includes malt beers. Wine includes wine made from grapes. Spirits include all distilled beverages. Other includes one or several other alcoholic beverages, such as fermented beverages made from sorghum, maize, millet, rice, or cider, fruit wine, fortifi ed wine, etc.
Adult (15+) per capita consumption, average 2003–2005 (in litres of pure alcohol):
Recorded 5.0
Unrecorded 3.0
Total 8.0
WHO African Region 6.2
Botswana
Total population: 1 858 000 ➤ Population 15+ years: 65% ➤ Population in urban areas: 58% ➤ Income group (World Bank): Upper-middle income
Data source: United Nations, data range 1990–2006.
SOCIOECONOMIC CONTEXT
Robust estimate of fi ve-year change in recorded adult(15+) per capita consumption,2001–2005:
INCREASE
STABLE
➤ DECREASE INCONCLUSIVE
<1%WINE
8
4
6
2000 2002 2004
Litre
s of
pur
e al
coho
lENLARGEMENT OF RECORDED ADULT (15+) PER CAPITA CONSUMPTION, 2000–2005
Year
2003 20052001
ALCOHOL CONSUMPTION Population data (refer to the population 15 years and older and are in litres of pure alcohol).
15
5
10
1961 1966 1976Li
tres
of p
ure
alco
hol
1991
RECORDED ADULT (15+) PER CAPITA CONSUMPTION, 1961–2005
Year
1971 1981 2001
20
19961986 2006
Change in data source from 2000
Beer Wine Spirits Other Total
0
2
0
AFRO CPs FINAL.indd 4AFRO CPs FINAL.indd 4 13/01/2011 08:4513/01/2011 08:45
5
PATTERNS OF DRINKING
ABSTAINERS (15+ years), 2003
Males Females Total
Lifetime abstainers 63.4% 64.8% 64.1%
Former drinkers 12.0% 12.0% 12.0%
Abstainers* 75.4% 76.8% 76.1%
* Persons who did not drink in the past 12 months.
DRINKERS ONLY
Adult (15+ years) per capita consumption*, total 29.24
Adult (15+ years) per capita consumption*, males 39.70
Adult (15+ years) per capita consumption*, females 18.81
Heavy episodic drinkers** (15–85+ years), males, 2003 49.9%
Heavy episodic drinkers** (15–85+ years), females, 2003 36.8%
* (Recorded + unrecorded) in litres of pure alcohol, average 2003–2005.** Had at least 60 grams or more of pure alcohol on at least one occasion weekly.
PATTERNS OF DRINKING SCORE
Patterns of drinking score* LEAST RISKY 1 2 3 4 5 MOST RISKY
* Given the same level of consumption, the higher the patterns of drinking score, the greater the alcohol-attributable burden of disease for the country.
ALCOHOL POLICYExcise tax on beer / wine / spirits Yes / Yes / Yes
National legal minimum age for off-premise sales of alcoholic beverages (selling) (beer / wine / spirits) 18 / 18 / 18
National legal minimum age for on-premise sales of alcoholic beverages (serving) (beer / wine / spirits) 18 / 18 / 18
Restrictions for on-/off-premise sales of alcoholic beverages:Time (hours and days) / location (places and density) Yes & No / YesSpecifi c events / intoxicated persons / petrol stations Yes / Yes / Yes
National maximum legal blood alcohol concentration (BAC) when driving a vehicle (general / young / professional), in % No / No / No
Legally binding regulations on alcohol advertising / product placement Yes / Yes
Legally binding regulations on alcohol sponsorship / sales promotion No / No
HEALTH CONSEQUENCES
MORBIDITY
Prevalence estimates (12-month prevalence for 2004): Males Females
Alcohol use disorders (15+ years) 1.90% 0.21%
ALL CAUSE MORTALITY
Age-standardized deaths rates, 15+ years (per 100,000 population)
2000 2001 2002 2003 2004 2005
M F M F M F M F M F M F
Liver cirrhosisNo information availableRoad traffi c
accidents (1)
Data source: WHO Mortality Database, data as reported by countries (1) refer to transport accidents.
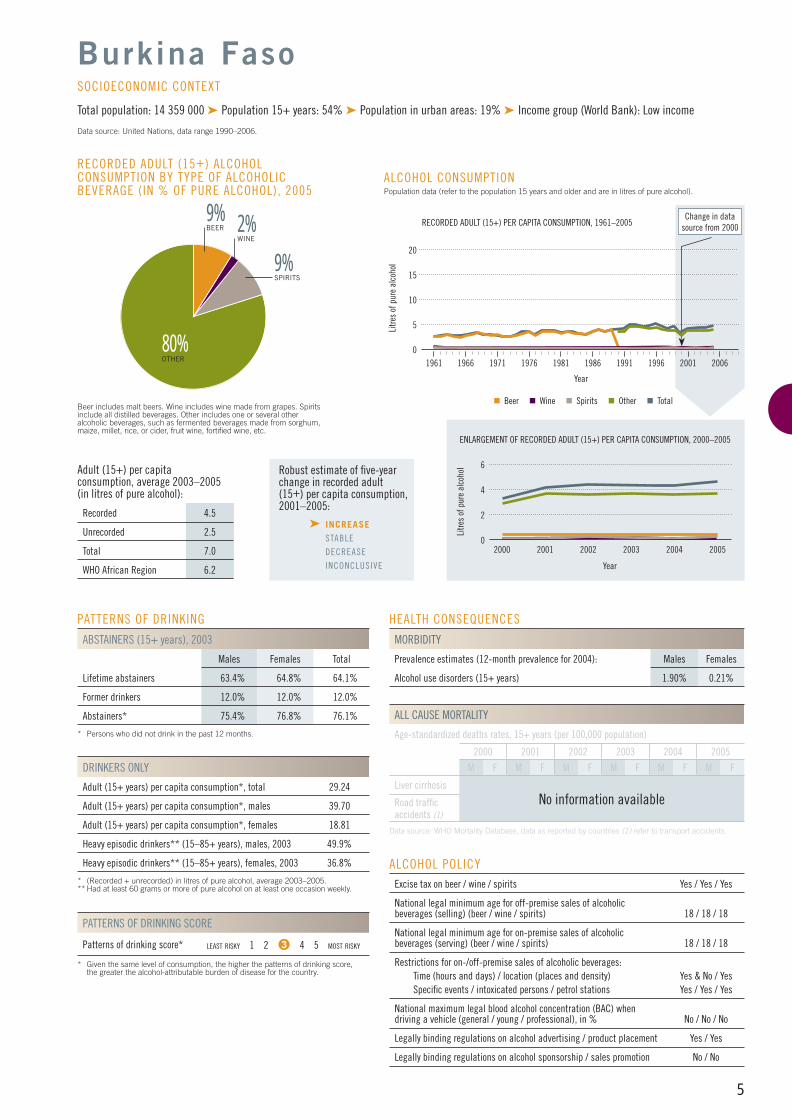
80%OTHER
2%WINE
RECORDED ADULT (15+) ALCOHOL CONSUMPTION BY TYPE OF ALCOHOLIC BEVERAGE (IN % OF PURE ALCOHOL), 2005
Beer includes malt beers. Wine includes wine made from grapes. Spirits include all distilled beverages. Other includes one or several other alcoholic beverages, such as fermented beverages made from sorghum, maize, millet, rice, or cider, fruit wine, fortifi ed wine, etc.
Adult (15+) per capita consumption, average 2003–2005 (in litres of pure alcohol):
Recorded 4.5
Unrecorded 2.5
Total 7.0
WHO African Region 6.2
Burkina Faso
Total population: 14 359 000 ➤ Population 15+ years: 54% ➤ Population in urban areas: 19% ➤ Income group (World Bank): Low income
Data source: United Nations, data range 1990–2006.
SOCIOECONOMIC CONTEXT
Robust estimate of fi ve-year change in recorded adult(15+) per capita consumption,2001–2005:
➤ INCREASE STABLE
DECREASE
INCONCLUSIVE
9%BEER
9%SPIRITS
6
2
4
2000 2002 2004
Litre
s of
pur
e al
coho
l
ENLARGEMENT OF RECORDED ADULT (15+) PER CAPITA CONSUMPTION, 2000–2005
Year
2003 20052001
ALCOHOL CONSUMPTION Population data (refer to the population 15 years and older and are in litres of pure alcohol).
15
5
10
1961 1966 1976
Litre
s of
pur
e al
coho
l
1991
RECORDED ADULT (15+) PER CAPITA CONSUMPTION, 1961–2005
Year
1971 1981 2001
20
19961986 2006
Change in data source from 2000
Beer Wine Spirits Other Total
0
0
AFRO CPs FINAL.indd 5AFRO CPs FINAL.indd 5 13/01/2011 08:4513/01/2011 08:45
6
PATTERNS OF DRINKING
ABSTAINERS (15+ years), 2005
Males Females Total
Lifetime abstainers
No information availableFormer drinkers
Abstainers*
* Persons who did not drink in the past 12 months.
DRINKERS ONLY
Adult (15+ years) per capita consumption*, total —
Adult (15+ years) per capita consumption*, males —
Adult (15+ years) per capita consumption*, females —
Heavy episodic drinkers** (15–85+ years), males —
Heavy episodic drinkers** (15–85+ years), females —
* (Recorded + unrecorded) in litres of pure alcohol, average 2003–2005.** Had at least 60 grams or more of pure alcohol on at least one occasion weekly.
PATTERNS OF DRINKING SCORE
Patterns of drinking score* LEAST RISKY 1 2 3 4 5 MOST RISKY
* Given the same level of consumption, the higher the patterns of drinking score, the greater the alcohol-attributable burden of disease for the country.
ALCOHOL POLICYExcise tax on beer / wine / spirits Yes / Yes / Yes
National legal minimum age for off-premise sales of alcoholic beverages (selling) (beer / wine / spirits) No / No / No
National legal minimum age for on-premise sales of alcoholic beverages (serving) (beer / wine / spirits) No / No / No
Restrictions for on-/off-premise sales of alcoholic beverages:Time (hours and days) / location (places and density) Yes & No / YesSpecifi c events / intoxicated persons / petrol stations Yes / Yes / Yes
National maximum legal blood alcohol concentration (BAC) when driving a vehicle (general / young / professional), in % 0.10 / 0.10/ 0.10
Legally binding regulations on alcohol advertising / product placement No / No
Legally binding regulations on alcohol sponsorship / sales promotion No / No
HEALTH CONSEQUENCES
MORBIDITY
Prevalence estimates (12-month prevalence for 2004): Males Females
Alcohol use disorders (15+ years) 2.76% 0.29%
ALL CAUSE MORTALITY
Age-standardized deaths rates, 15+ years (per 100,000 population)
2000 2001 2002 2003 2004 2005
M F M F M F M F M F M F
Liver cirrhosisNo information availableRoad traffi c
accidents (1)
Data source: WHO Mortality Database, data as reported by countries (1) refer to transport accidents.
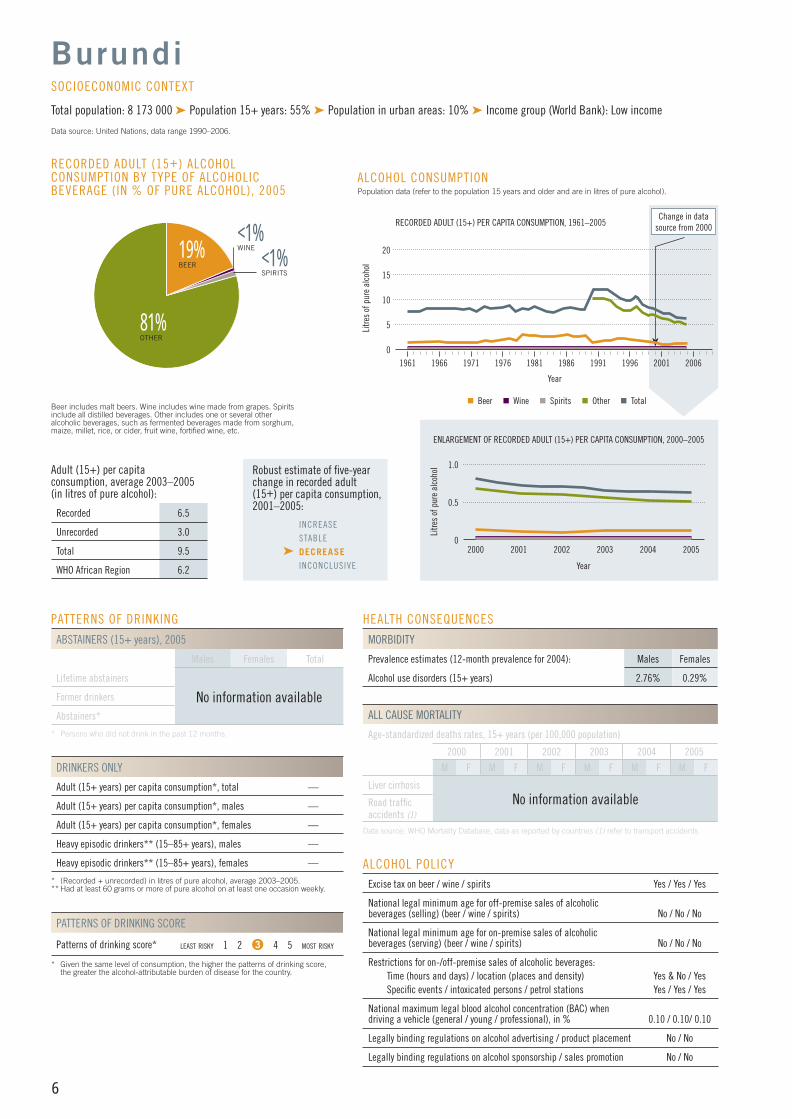
19%BEER
81%OTHER
<1%WINE
RECORDED ADULT (15+) ALCOHOL CONSUMPTION BY TYPE OF ALCOHOLIC BEVERAGE (IN % OF PURE ALCOHOL), 2005
Beer includes malt beers. Wine includes wine made from grapes. Spirits include all distilled beverages. Other includes one or several other alcoholic beverages, such as fermented beverages made from sorghum, maize, millet, rice, or cider, fruit wine, fortifi ed wine, etc.
Adult (15+) per capita consumption, average 2003–2005 (in litres of pure alcohol):
Recorded 6.5
Unrecorded 3.0
Total 9.5
WHO African Region 6.2
Burundi
Total population: 8 173 000 ➤ Population 15+ years: 55% ➤ Population in urban areas: 10% ➤ Income group (World Bank): Low income
Data source: United Nations, data range 1990–2006.
SOCIOECONOMIC CONTEXT
Robust estimate of fi ve-year change in recorded adult(15+) per capita consumption,2001–2005:
INCREASE
STABLE
➤ DECREASE INCONCLUSIVE
<1%SPIRITS
1.0
0.5
2000 2002 2004
Litre
s of
pur
e al
coho
lENLARGEMENT OF RECORDED ADULT (15+) PER CAPITA CONSUMPTION, 2000–2005
Year
2003 20052001
ALCOHOL CONSUMPTION Population data (refer to the population 15 years and older and are in litres of pure alcohol).
15
5
10
1961 1966 1976Li
tres
of p
ure
alco
hol
1991
RECORDED ADULT (15+) PER CAPITA CONSUMPTION, 1961–2005
Year
1971 1981 2001
20
19961986 2006
Change in data source from 2000
Beer Wine Spirits Other Total
0
0
AFRO CPs FINAL.indd 6AFRO CPs FINAL.indd 6 13/01/2011 08:4513/01/2011 08:45
7
PATTERNS OF DRINKING
ABSTAINERS (15+ years), 2007
Males Females Total
Lifetime abstainers 31.9% 39.8% 35.9%
Former drinkers 7.8% 9.8% 8.8%
Abstainers* 39.7% 49.6% 44.7%
* Persons who did not drink in the past 12 months.
DRINKERS ONLY
Adult (15+ years) per capita consumption*, total 13.74
Adult (15+ years) per capita consumption*, males 17.20
Adult (15+ years) per capita consumption*, females 9.34
Heavy episodic drinkers** (15–85+ years), males, 2007 8.4%
Heavy episodic drinkers** (15–85+ years), females, 2007 2.1%
* (Recorded + unrecorded) in litres of pure alcohol, average 2003–2005.** Had at least 60 grams or more of pure alcohol on at least one occasion weekly.
PATTERNS OF DRINKING SCORE
Patterns of drinking score* LEAST RISKY 1 2 3 4 5 MOST RISKY
* Given the same level of consumption, the higher the patterns of drinking score, the greater the alcohol-attributable burden of disease for the country.
ALCOHOL POLICYExcise tax on beer / wine / spirits Yes / Yes / Yes
National legal minimum age for off-premise sales of alcoholic beverages (selling) (beer / wine / spirits) 21 / 21 / 21
National legal minimum age for on-premise sales of alcoholic beverages (serving) (beer / wine / spirits) 21 / 21 / 21
Restrictions for on-/off-premise sales of alcoholic beverages:Time (hours and days) / location (places and density) Yes & No / YesSpecifi c events / intoxicated persons / petrol stations No / No / No
National maximum legal blood alcohol concentration (BAC) when driving a vehicle (general / young / professional), in % 0.08 / 0.08 / 0.08
Legally binding regulations on alcohol advertising / product placement Yes / No
Legally binding regulations on alcohol sponsorship / sales promotion No / No
HEALTH CONSEQUENCES
MORBIDITY
Prevalence estimates (12-month prevalence for 2004): Males Females
Alcohol use disorders (15+ years) 1.64% 0.18%
ALL CAUSE MORTALITY
Age-standardized deaths rates, 15+ years (per 100,000 population)
2000 2001 2002 2003 2004 2005
M F M F M F M F M F M F
Liver cirrhosisNo information availableRoad traffi c
accidents (1)
Data source: WHO Mortality Database, data as reported by countries (1) refer to transport accidents.
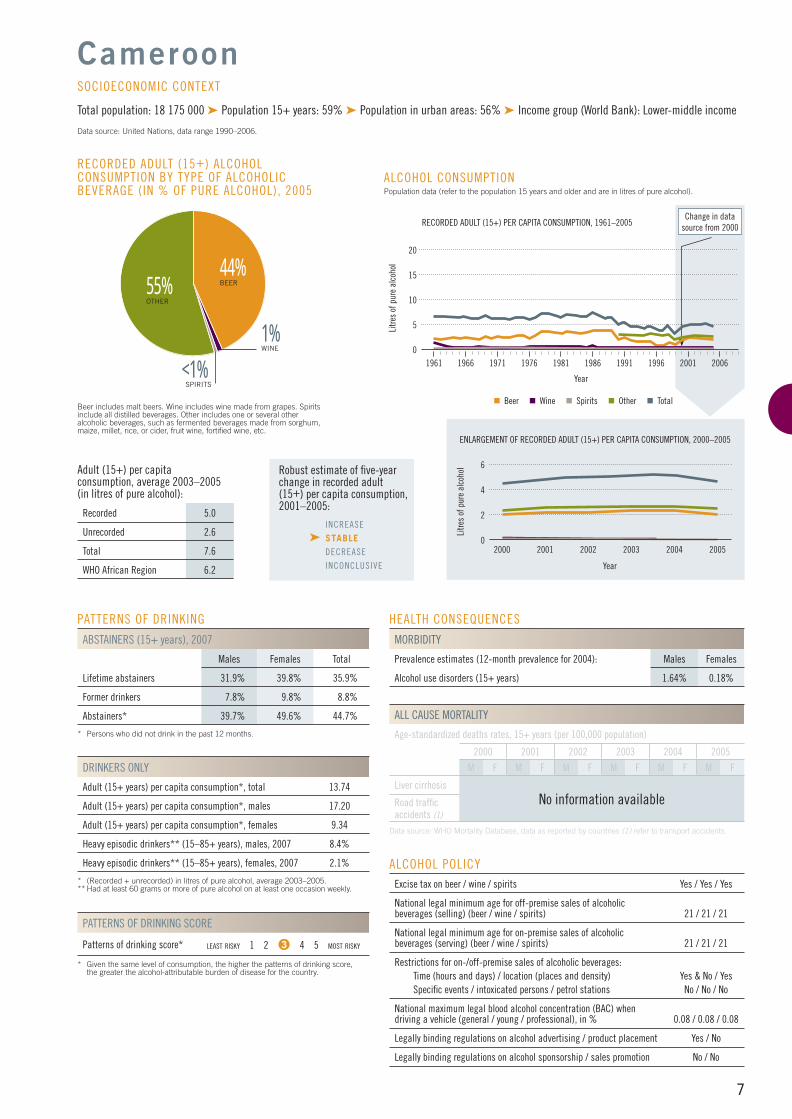
44%BEER55%
OTHER
<1%SPIRITS
RECORDED ADULT (15+) ALCOHOL CONSUMPTION BY TYPE OF ALCOHOLIC BEVERAGE (IN % OF PURE ALCOHOL), 2005
Beer includes malt beers. Wine includes wine made from grapes. Spirits include all distilled beverages. Other includes one or several other alcoholic beverages, such as fermented beverages made from sorghum, maize, millet, rice, or cider, fruit wine, fortifi ed wine, etc.
Adult (15+) per capita consumption, average 2003–2005 (in litres of pure alcohol):
Recorded 5.0
Unrecorded 2.6
Total 7.6
WHO African Region 6.2
Cameroon
Total population: 18 175 000 ➤ Population 15+ years: 59% ➤ Population in urban areas: 56% ➤ Income group (World Bank): Lower-middle income
Data source: United Nations, data range 1990–2006.
SOCIOECONOMIC CONTEXT
Robust estimate of fi ve-year change in recorded adult(15+) per capita consumption,2001–2005:
INCREASE
➤ STABLE DECREASE
INCONCLUSIVE
1%WINE
6
2
4
2000 2002 2004
Litre
s of
pur
e al
coho
l
ENLARGEMENT OF RECORDED ADULT (15+) PER CAPITA CONSUMPTION, 2000–2005
Year
2003 20052001
ALCOHOL CONSUMPTION Population data (refer to the population 15 years and older and are in litres of pure alcohol).
15
5
10
1961 1966 1976
Litre
s of
pur
e al
coho
l
1991
RECORDED ADULT (15+) PER CAPITA CONSUMPTION, 1961–2005
Year
1971 1981 2001
20
19961986 2006
Change in data source from 2000
Beer Wine Spirits Other Total
0
0
AFRO CPs FINAL.indd 7AFRO CPs FINAL.indd 7 13/01/2011 08:4513/01/2011 08:45
8
PATTERNS OF DRINKING
ABSTAINERS (15+ years), 2007
Males Females Total
Lifetime abstainers 11.4% 58.8% 36.8%
Former drinkers 13.6% 16.4% 15.0%
Abstainers* 25.0% 75.2% 51.8%
* Persons who did not drink in the past 12 months.
DRINKERS ONLY
Adult (15+ years) per capita consumption*, total 10.30
Adult (15+ years) per capita consumption*, males 11.63
Adult (15+ years) per capita consumption*, females 7.62
Heavy episodic drinkers** (15–85+ years), males —
Heavy episodic drinkers** (15–85+ years), females —
* (Recorded + unrecorded) in litres of pure alcohol, average 2003–2005.** Had at least 60 grams or more of pure alcohol on at least one occasion weekly.
PATTERNS OF DRINKING SCORE
Patterns of drinking score* LEAST RISKY 1 2 3 4 5 MOST RISKY
* Given the same level of consumption, the higher the patterns of drinking score, the greater the alcohol-attributable burden of disease for the country.
ALCOHOL POLICYExcise tax on beer / wine / spirits Yes / Yes / Yes
National legal minimum age for off-premise sales of alcoholic beverages (selling) (beer / wine / spirits) 18 / 18 / 18
National legal minimum age for on-premise sales of alcoholic beverages (serving) (beer / wine / spirits) 18 / 18 / 18
Restrictions for on-/off-premise sales of alcoholic beverages:Time (hours and days) / location (places and density) No / NoSpecifi c events / intoxicated persons / petrol stations No / No / No
National maximum legal blood alcohol concentration (BAC) when driving a vehicle (general / young / professional), in % 0.08 / 0.08 / 0.08
Legally binding regulations on alcohol advertising / product placement Yes / Yes
Legally binding regulations on alcohol sponsorship / sales promotion No / No
HEALTH CONSEQUENCES
MORBIDITY
Prevalence estimates (12-month prevalence for 2004): Males Females
Alcohol use disorders (15+ years) 1.60% 0.18%
ALL CAUSE MORTALITY
Age-standardized deaths rates, 15+ years (per 100,000 population)
2000 2001 2002 2003 2004 2005
M F M F M F M F M F M F
Liver cirrhosisNo information availableRoad traffi c
accidents (1)
Data source: WHO Mortality Database, data as reported by countries (1) refer to transport accidents.
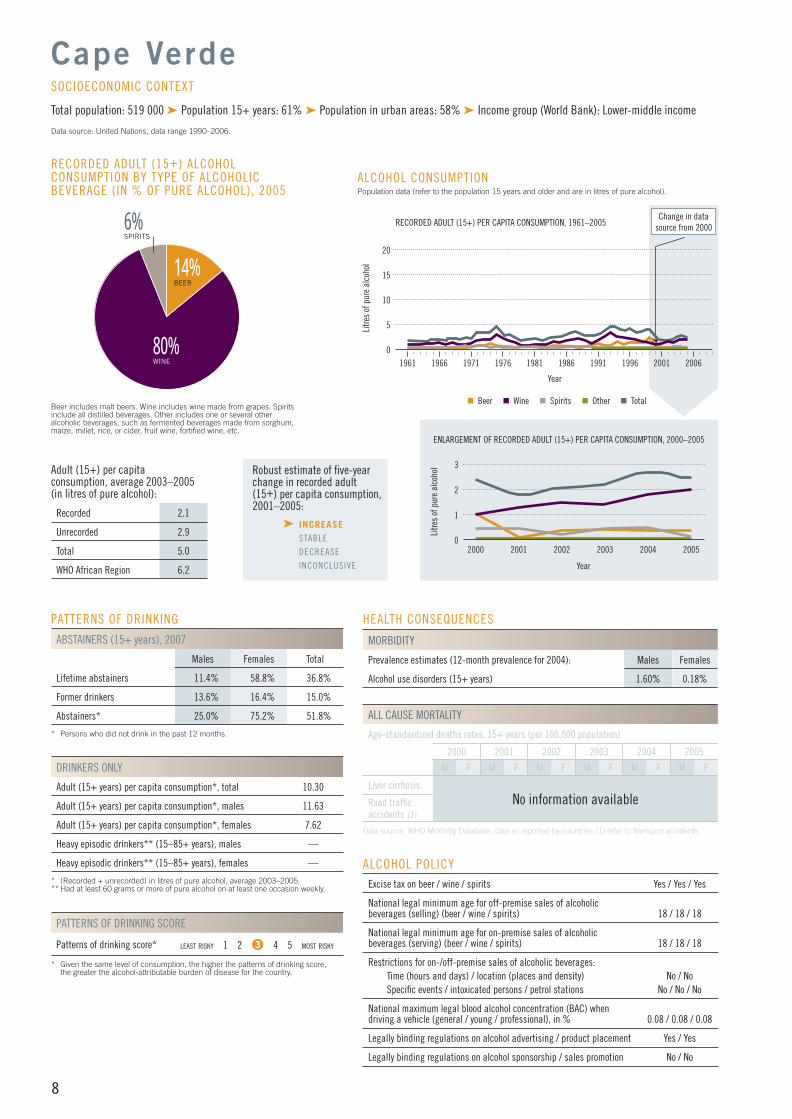
14%BEER
80%WINE
6%SPIRITS
RECORDED ADULT (15+) ALCOHOL CONSUMPTION BY TYPE OF ALCOHOLIC BEVERAGE (IN % OF PURE ALCOHOL), 2005
Beer includes malt beers. Wine includes wine made from grapes. Spirits include all distilled beverages. Other includes one or several other alcoholic beverages, such as fermented beverages made from sorghum, maize, millet, rice, or cider, fruit wine, fortifi ed wine, etc.
Adult (15+) per capita consumption, average 2003–2005 (in litres of pure alcohol):
Recorded 2.1
Unrecorded 2.9
Total 5.0
WHO African Region 6.2
Cape Verde
Total population: 519 000 ➤ Population 15+ years: 61% ➤ Population in urban areas: 58% ➤ Income group (World Bank): Lower-middle income
Data source: United Nations, data range 1990–2006.
SOCIOECONOMIC CONTEXT
Robust estimate of fi ve-year change in recorded adult(15+) per capita consumption,2001–2005:
➤ INCREASE STABLE
DECREASE
INCONCLUSIVE
3
1
2
2000 2002 2004
Litre
s of
pur
e al
coho
lENLARGEMENT OF RECORDED ADULT (15+) PER CAPITA CONSUMPTION, 2000–2005
Year
2003 20052001
ALCOHOL CONSUMPTION Population data (refer to the population 15 years and older and are in litres of pure alcohol).
15
5
10
1961 1966 1976Li
tres
of p
ure
alco
hol
1991
RECORDED ADULT (15+) PER CAPITA CONSUMPTION, 1961–2005
Year
1971 1981 2001
20
19961986 2006
Change in data source from 2000
Beer Wine Spirits Other Total
0
0
AFRO CPs FINAL.indd 8AFRO CPs FINAL.indd 8 13/01/2011 08:4513/01/2011 08:45
9
PATTERNS OF DRINKING
ABSTAINERS (15+ years), 2005
Males Females Total
Lifetime abstainers
No information availableFormer drinkers
Abstainers*
* Persons who did not drink in the past 12 months.
DRINKERS ONLY
Adult (15+ years) per capita consumption*, total —
Adult (15+ years) per capita consumption*, males —
Adult (15+ years) per capita consumption*, females —
Heavy episodic drinkers** (15–85+ years), males —
Heavy episodic drinkers** (15–85+ years), females —
* (Recorded + unrecorded) in litres of pure alcohol, average 2003–2005.** Had at least 60 grams or more of pure alcohol on at least one occasion weekly.
PATTERNS OF DRINKING SCORE
Patterns of drinking score* LEAST RISKY 1 2 3 4 5 MOST RISKY
* Given the same level of consumption, the higher the patterns of drinking score, the greater the alcohol-attributable burden of disease for the country.
ALCOHOL POLICYExcise tax on beer / wine / spirits Yes / Yes / Yes
National legal minimum age for off-premise sales of alcoholic beverages (selling) (beer / wine / spirits) No / No / No
National legal minimum age for on-premise sales of alcoholic beverages (serving) (beer / wine / spirits) No / No / No
Restrictions for on-/off-premise sales of alcoholic beverages:Time (hours and days) / location (places and density) No / NoSpecifi c events / intoxicated persons / petrol stations No / No / No
National maximum legal blood alcohol concentration (BAC) when driving a vehicle (general / young / professional), in % No / No / No
Legally binding regulations on alcohol advertising / product placement No / No
Legally binding regulations on alcohol sponsorship / sales promotion No / No
HEALTH CONSEQUENCES
MORBIDITY
Prevalence estimates (12-month prevalence for 2004): Males Females
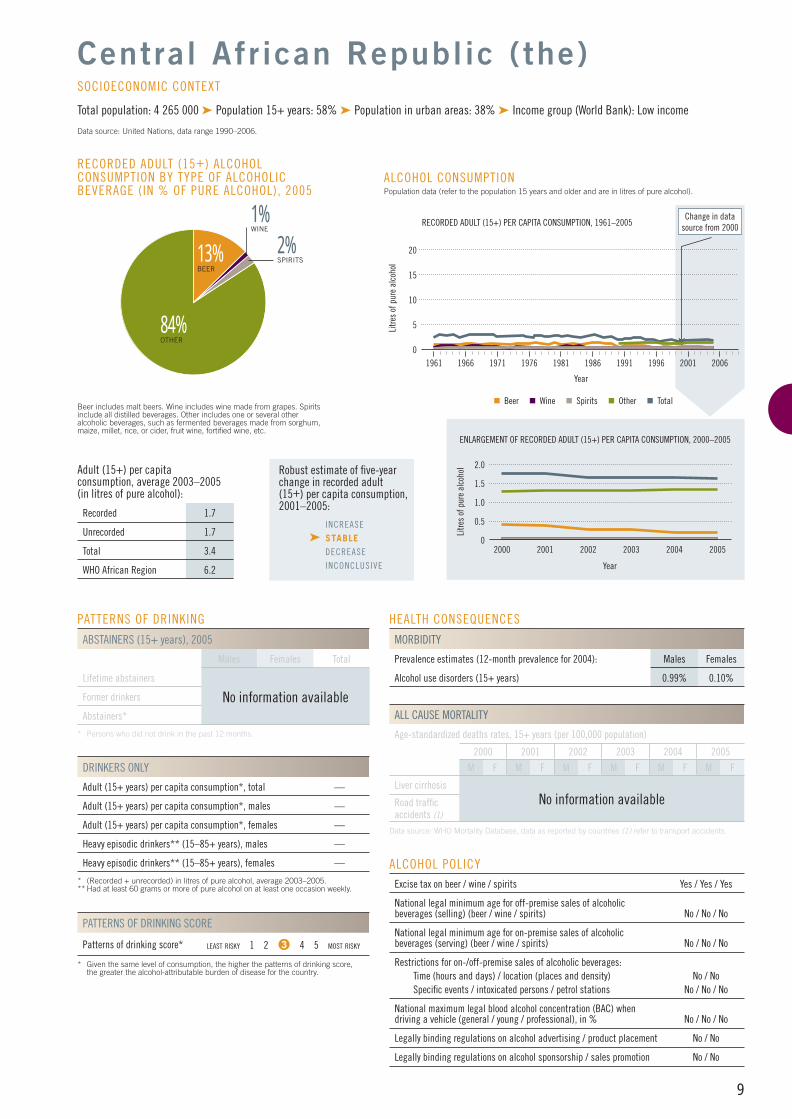
Alcohol use disorders (15+ years) 0.99% 0.10%
ALL CAUSE MORTALITY
Age-standardized deaths rates, 15+ years (per 100,000 population)
2000 2001 2002 2003 2004 2005
M F M F M F M F M F M F
Liver cirrhosisNo information availableRoad traffi c
accidents (1)
Data source: WHO Mortality Database, data as reported by countries (1) refer to transport accidents.
13%BEER
84%OTHER
1%WINE
RECORDED ADULT (15+) ALCOHOL CONSUMPTION BY TYPE OF ALCOHOLIC BEVERAGE (IN % OF PURE ALCOHOL), 2005
Beer includes malt beers. Wine includes wine made from grapes. Spirits include all distilled beverages. Other includes one or several other alcoholic beverages, such as fermented beverages made from sorghum, maize, millet, rice, or cider, fruit wine, fortifi ed wine, etc.
Adult (15+) per capita consumption, average 2003–2005 (in litres of pure alcohol):
Recorded 1.7
Unrecorded 1.7
Total 3.4
WHO African Region 6.2
Central Afr ican Republic (the)
Total population: 4 265 000 ➤ Population 15+ years: 58% ➤ Population in urban areas: 38% ➤ Income group (World Bank): Low income
Data source: United Nations, data range 1990–2006.
SOCIOECONOMIC CONTEXT
Robust estimate of fi ve-year change in recorded adult(15+) per capita consumption,2001–2005:
INCREASE
➤ STABLE DECREASE
INCONCLUSIVE
2%SPIRITS
2.0
0.5
1.0
2000 2002 2004
Litre
s of
pur
e al
coho
l
ENLARGEMENT OF RECORDED ADULT (15+) PER CAPITA CONSUMPTION, 2000–2005
Year
2003 20052001
ALCOHOL CONSUMPTION Population data (refer to the population 15 years and older and are in litres of pure alcohol).
15
5
10
1961 1966 1976
Litre
s of
pur
e al
coho
l
1991
RECORDED ADULT (15+) PER CAPITA CONSUMPTION, 1961–2005
Year
1971 1981 2001
20
19961986 2006
Change in data source from 2000
Beer Wine Spirits Other Total
1.5
0
0
AFRO CPs FINAL.indd 9AFRO CPs FINAL.indd 9 13/01/2011 08:4513/01/2011 08:45
10
PATTERNS OF DRINKING
ABSTAINERS (15+ years), 2003
Males Females Total
Lifetime abstainers 68.4% 78.8% 73.7%
Former drinkers 8.4% 2.2% 5.2%
Abstainers* 76.8% 81.0% 78.9%
* Persons who did not drink in the past 12 months.
DRINKERS ONLY
Adult (15+ years) per capita consumption*, total 20.68
Adult (15+ years) per capita consumption*, males 26.16
Adult (15+ years) per capita consumption*, females 14.23
Heavy episodic drinkers** (15–85+ years), males, 2003 39.7
Heavy episodic drinkers** (15–85+ years), females, 2003 17.4
* (Recorded + unrecorded) in litres of pure alcohol, average 2003–2005.** Had at least 60 grams or more of pure alcohol on at least one occasion weekly.
PATTERNS OF DRINKING SCORE
Patterns of drinking score* LEAST RISKY 1 2 3 4 5 MOST RISKY
* Given the same level of consumption, the higher the patterns of drinking score, the greater the alcohol-attributable burden of disease for the country.
ALCOHOL POLICYExcise tax on beer / wine / spirits Yes / Yes / Yes
National legal minimum age for off-premise sales of alcoholic beverages (selling) (beer / wine / spirits) 18 / 18 / 18
National legal minimum age for on-premise sales of alcoholic beverages (serving) (beer / wine / spirits) 18 / 18 / 18
Restrictions for on-/off-premise sales of alcoholic beverages:Time (hours and days) / location (places and density) Yes & No / NoSpecifi c events / intoxicated persons / petrol stations No / No / Yes
National maximum legal blood alcohol concentration (BAC) when driving a vehicle (general / young / professional), in % 0.08 / 0.08 / 0.08
Legally binding regulations on alcohol advertising / product placement No / No
Legally binding regulations on alcohol sponsorship / sales promotion No / No
HEALTH CONSEQUENCES
MORBIDITY
Prevalence estimates (12-month prevalence for 2004): Males Females
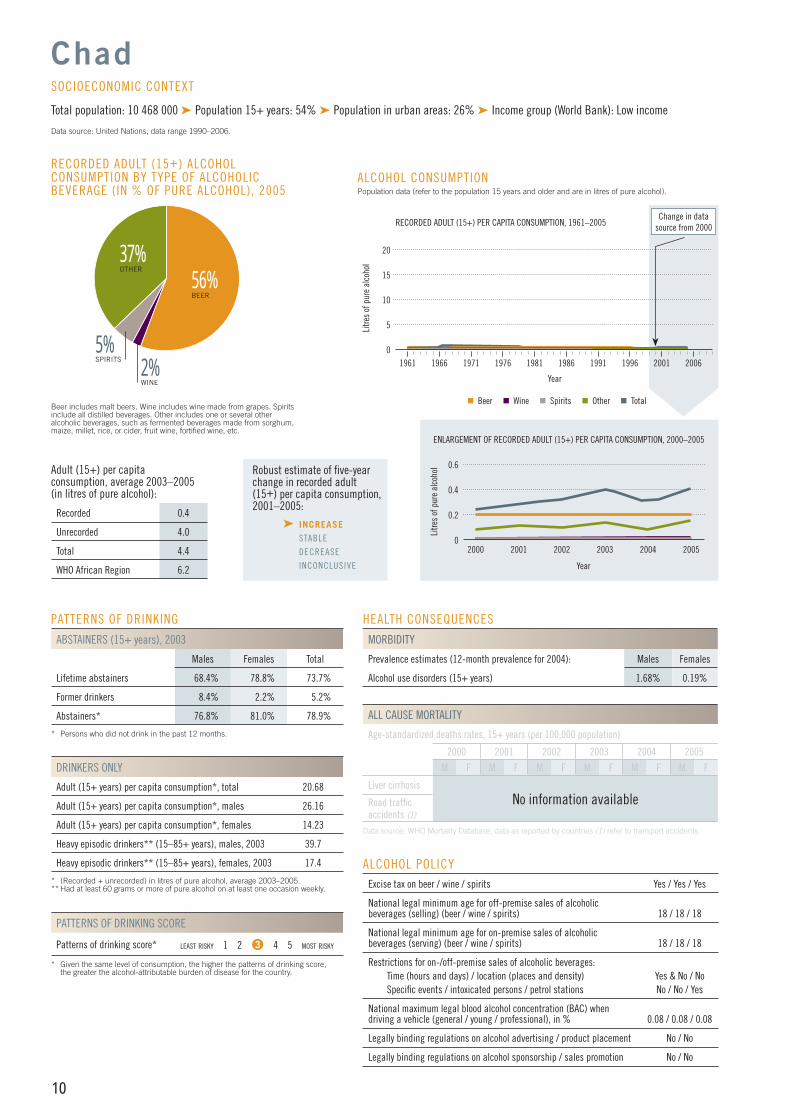
Alcohol use disorders (15+ years) 1.68% 0.19%
ALL CAUSE MORTALITY
Age-standardized deaths rates, 15+ years (per 100,000 population)
2000 2001 2002 2003 2004 2005
M F M F M F M F M F M F
Liver cirrhosisNo information availableRoad traffi c
accidents (1)
Data source: WHO Mortality Database, data as reported by countries (1) refer to transport accidents.
56%BEER
37%OTHER
5%SPIRITS
RECORDED ADULT (15+) ALCOHOL CONSUMPTION BY TYPE OF ALCOHOLIC BEVERAGE (IN % OF PURE ALCOHOL), 2005
Beer includes malt beers. Wine includes wine made from grapes. Spirits include all distilled beverages. Other includes one or several other alcoholic beverages, such as fermented beverages made from sorghum, maize, millet, rice, or cider, fruit wine, fortifi ed wine, etc.
Adult (15+) per capita consumption, average 2003–2005 (in litres of pure alcohol):
Recorded 0.4
Unrecorded 4.0
Total 4.4
WHO African Region 6.2
Chad
Total population: 10 468 000 ➤ Population 15+ years: 54% ➤ Population in urban areas: 26% ➤ Income group (World Bank): Low income
Data source: United Nations, data range 1990–2006.
SOCIOECONOMIC CONTEXT
Robust estimate of fi ve-year change in recorded adult(15+) per capita consumption,2001–2005:
➤ INCREASE STABLE
DECREASE
INCONCLUSIVE
2%WINE
0.6
0.2
0.4
2000 2002 2004
Litre
s of
pur
e al
coho
lENLARGEMENT OF RECORDED ADULT (15+) PER CAPITA CONSUMPTION, 2000–2005
Year
2003 20052001
ALCOHOL CONSUMPTION Population data (refer to the population 15 years and older and are in litres of pure alcohol).
15
5
10
1961 1966 1976Li
tres
of p
ure
alco
hol
1991
RECORDED ADULT (15+) PER CAPITA CONSUMPTION, 1961–2005
Year
1971 1981 2001
20
19961986 2006
Change in data source from 2000
Beer Wine Spirits Other Total
0
0
AFRO CPs FINAL.indd 10AFRO CPs FINAL.indd 10 13/01/2011 08:4513/01/2011 08:45
11
PATTERNS OF DRINKING
ABSTAINERS (15+ years), 2003
Males Females Total
Lifetime abstainers 96.5% 99.0% 97.8%
Former drinkers 2.5% 0.1% 1.2%
Abstainers* 99.0% 99.1% 99.0%
* Persons who did not drink in the past 12 months.
DRINKERS ONLY
Adult (15+ years) per capita consumption*, total 37.02
Adult (15+ years) per capita consumption*, males 45.72
Adult (15+ years) per capita consumption*, females 24.25
Heavy episodic drinkers** (15–85+ years), males, 2003 19.1%
Heavy episodic drinkers** (15–85+ years), females, 2003 0.0%
* (Recorded + unrecorded) in litres of pure alcohol, average 2003–2005.** Had at least 60 grams or more of pure alcohol on at least one occasion weekly.
PATTERNS OF DRINKING SCORE
Patterns of drinking score* LEAST RISKY No information available MOST RISKY
* Given the same level of consumption, the higher the patterns of drinking score, the greater the alcohol-attributable burden of disease for the country.
ALCOHOL POLICYExcise tax on beer / wine / spirits Yes / Yes / Yes
National legal minimum age for off-premise sales of alcoholic beverages (selling) (beer / wine / spirits) 18 / 18 / 18
National legal minimum age for on-premise sales of alcoholic beverages (serving) (beer / wine / spirits) 18 / 18 / 18
Restrictions for on-/off-premise sales of alcoholic beverages:Time (hours and days) / location (places and density) No / Yes & NoSpecifi c events / intoxicated persons / petrol stations No / No / No
National maximum legal blood alcohol concentration (BAC) when driving a vehicle (general / young / professional), in % ZT
Legally binding regulations on alcohol advertising / product placement No / No
Legally binding regulations on alcohol sponsorship / sales promotion No / No
ZT = Zero tolerance.
HEALTH CONSEQUENCES
MORBIDITY
Prevalence estimates (12-month prevalence for 2004): Males Females
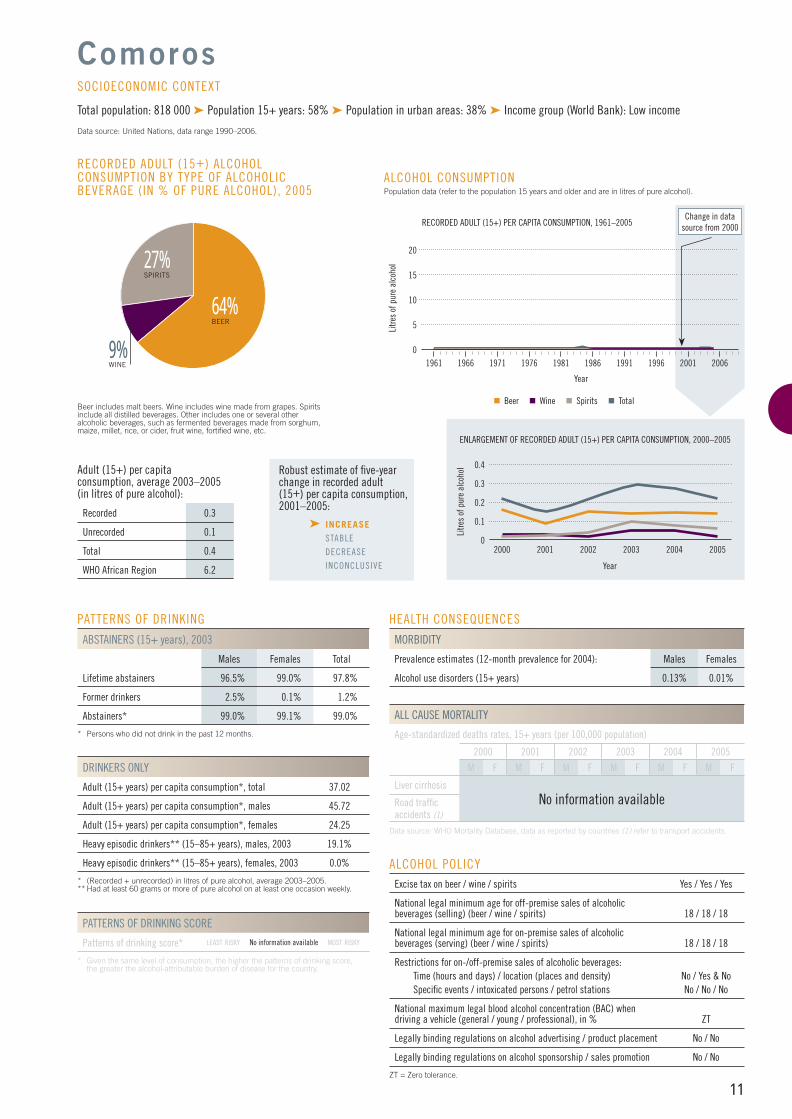
Alcohol use disorders (15+ years) 0.13% 0.01%
ALL CAUSE MORTALITY
Age-standardized deaths rates, 15+ years (per 100,000 population)
2000 2001 2002 2003 2004 2005
M F M F M F M F M F M F
Liver cirrhosisNo information availableRoad traffi c
accidents (1)
Data source: WHO Mortality Database, data as reported by countries (1) refer to transport accidents.
64%BEER
27%SPIRITS
RECORDED ADULT (15+) ALCOHOL CONSUMPTION BY TYPE OF ALCOHOLIC BEVERAGE (IN % OF PURE ALCOHOL), 2005
Beer includes malt beers. Wine includes wine made from grapes. Spirits include all distilled beverages. Other includes one or several other alcoholic beverages, such as fermented beverages made from sorghum, maize, millet, rice, or cider, fruit wine, fortifi ed wine, etc.
Adult (15+) per capita consumption, average 2003–2005 (in litres of pure alcohol):
Recorded 0.3
Unrecorded 0.1
Total 0.4
WHO African Region 6.2
Comoros
Total population: 818 000 ➤ Population 15+ years: 58% ➤ Population in urban areas: 38% ➤ Income group (World Bank): Low income
Data source: United Nations, data range 1990–2006.
SOCIOECONOMIC CONTEXT
Robust estimate of fi ve-year change in recorded adult(15+) per capita consumption,2001–2005:
➤ INCREASE STABLE
DECREASE
INCONCLUSIVE
9%WINE
0.4
0.1
0.2
2000 2002 2004
Litre
s of
pur
e al
coho
l
ENLARGEMENT OF RECORDED ADULT (15+) PER CAPITA CONSUMPTION, 2000–2005
Year
2003 20052001
ALCOHOL CONSUMPTION Population data (refer to the population 15 years and older and are in litres of pure alcohol).
15
5
10
1961 1966 1976
Litre
s of
pur
e al
coho
l
1991
RECORDED ADULT (15+) PER CAPITA CONSUMPTION, 1961–2005
Year
1971 1981 2001
20
19961986 2006
Change in data source from 2000
Beer Wine Spirits Total
0.3
0
0
AFRO CPs FINAL.indd 11AFRO CPs FINAL.indd 11 13/01/2011 08:4513/01/2011 08:45
12
PATTERNS OF DRINKING
ABSTAINERS (15+ years), 2003
Males Females Total
Lifetime abstainers 48.3% 60.9% 54.7%
Former drinkers 5.8% 6.8% 6.3%
Abstainers* 54.1% 67.7% 61.0%
* Persons who did not drink in the past 12 months.
DRINKERS ONLY
Adult (15+ years) per capita consumption*, total 11.25
Adult (15+ years) per capita consumption*, males 14.32
Adult (15+ years) per capita consumption*, females 7.05
Heavy episodic drinkers** (15–85+ years), males, 2003 15.0%
Heavy episodic drinkers** (15–85+ years), females, 2003 9.0%
* (Recorded + unrecorded) in litres of pure alcohol, average 2003–2005.** Had at least 60 grams or more of pure alcohol on at least one occasion weekly.
PATTERNS OF DRINKING SCORE
Patterns of drinking score* LEAST RISKY 1 2 3 4 5 MOST RISKY
* Given the same level of consumption, the higher the patterns of drinking score, the greater the alcohol-attributable burden of disease for the country.
ALCOHOL POLICYExcise tax on beer / wine / spirits Yes / Yes / Yes
National legal minimum age for off-premise sales of alcoholic beverages (selling) (beer / wine / spirits) 18 / 18 / 18
National legal minimum age for on-premise sales of alcoholic beverages (serving) (beer / wine / spirits) 18 / 18 / 18
Restrictions for on-/off-premise sales of alcoholic beverages:Time (hours and days) / location (places and density) Yes / YesSpecifi c events / intoxicated persons / petrol stations No / Yes / No
National maximum legal blood alcohol concentration (BAC) when driving a vehicle (general / young / professional), in % 0.08 / 0.08 / 0.08
Legally binding regulations on alcohol advertising / product placement No / No
Legally binding regulations on alcohol sponsorship / sales promotion No / No
HEALTH CONSEQUENCES
MORBIDITY
Prevalence estimates (12-month prevalence for 2004): Males Females
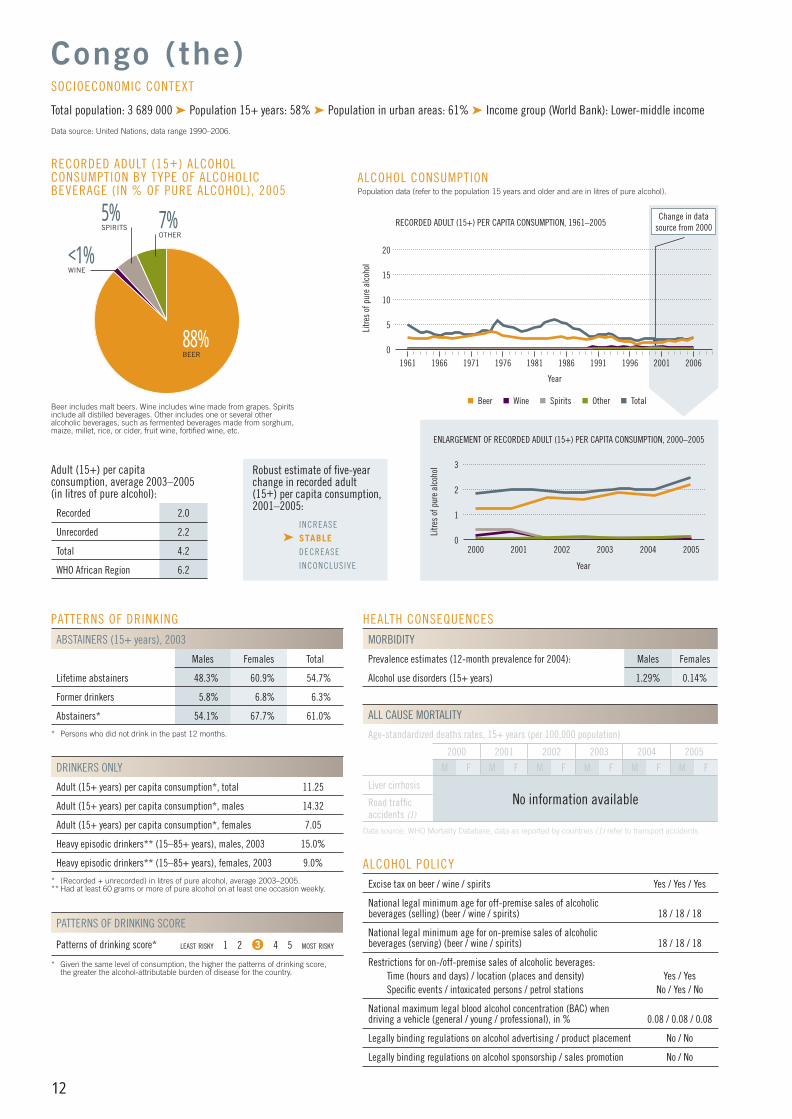
Alcohol use disorders (15+ years) 1.29% 0.14%
ALL CAUSE MORTALITY
Age-standardized deaths rates, 15+ years (per 100,000 population)
2000 2001 2002 2003 2004 2005
M F M F M F M F M F M F
Liver cirrhosisNo information availableRoad traffi c
accidents (1)
Data source: WHO Mortality Database, data as reported by countries (1) refer to transport accidents.
88%BEER
<1%WINE
RECORDED ADULT (15+) ALCOHOL CONSUMPTION BY TYPE OF ALCOHOLIC BEVERAGE (IN % OF PURE ALCOHOL), 2005
Beer includes malt beers. Wine includes wine made from grapes. Spirits include all distilled beverages. Other includes one or several other alcoholic beverages, such as fermented beverages made from sorghum, maize, millet, rice, or cider, fruit wine, fortifi ed wine, etc.
Adult (15+) per capita consumption, average 2003–2005 (in litres of pure alcohol):
Recorded 2.0
Unrecorded 2.2
Total 4.2
WHO African Region 6.2
Congo (the)
Total population: 3 689 000 ➤ Population 15+ years: 58% ➤ Population in urban areas: 61% ➤ Income group (World Bank): Lower-middle income
Data source: United Nations, data range 1990–2006.
SOCIOECONOMIC CONTEXT
Robust estimate of fi ve-year change in recorded adult(15+) per capita consumption,2001–2005:
INCREASE
➤ STABLE DECREASE
INCONCLUSIVE
5%SPIRITS 7%
OTHER
3
1
2
2000 2002 2004
Litre
s of
pur
e al
coho
lENLARGEMENT OF RECORDED ADULT (15+) PER CAPITA CONSUMPTION, 2000–2005
Year
2003 20052001
ALCOHOL CONSUMPTION Population data (refer to the population 15 years and older and are in litres of pure alcohol).
15
5
10
1961 1966 1976Li
tres
of p
ure
alco
hol
1991
RECORDED ADULT (15+) PER CAPITA CONSUMPTION, 1961–2005
Year
1971 1981 2001
20
19961986 2006
Change in data source from 2000
Beer Wine Spirits Other Total
0
0
AFRO CPs FINAL.indd 12AFRO CPs FINAL.indd 12 13/01/2011 08:4513/01/2011 08:45
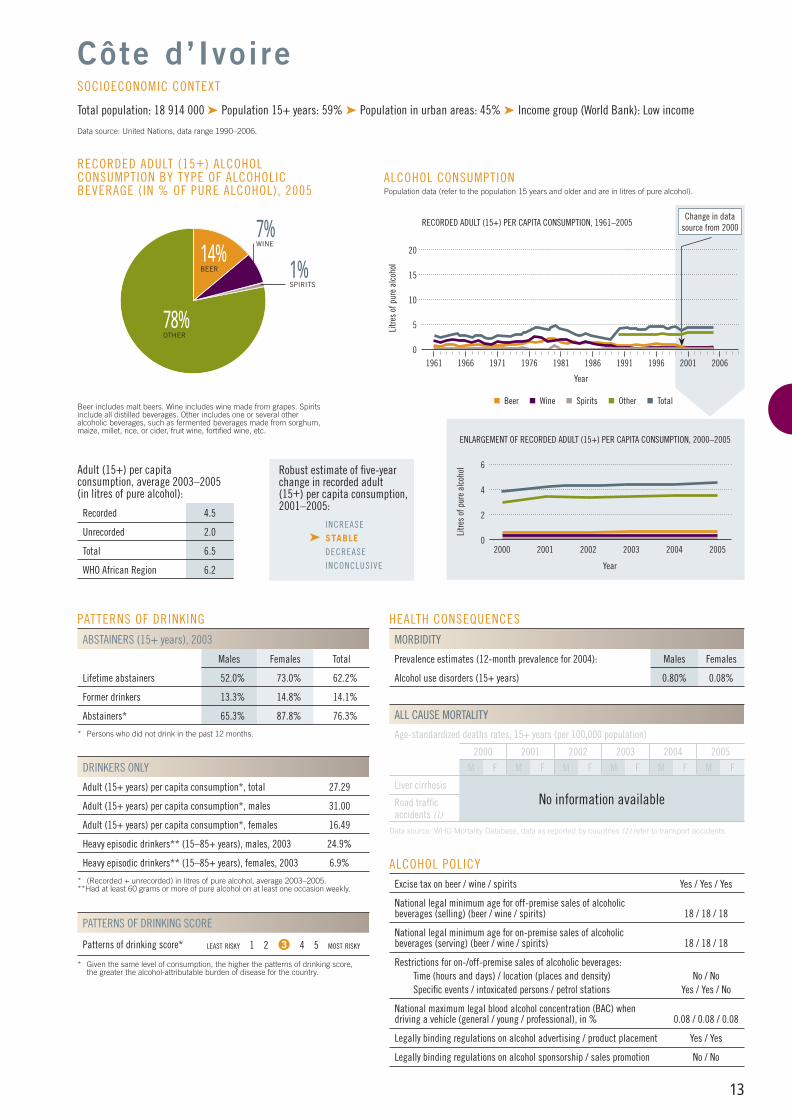
13
PATTERNS OF DRINKING
ABSTAINERS (15+ years), 2003
Males Females Total
Lifetime abstainers 52.0% 73.0% 62.2%
Former drinkers 13.3% 14.8% 14.1%
Abstainers* 65.3% 87.8% 76.3%
* Persons who did not drink in the past 12 months.
DRINKERS ONLY
Adult (15+ years) per capita consumption*, total 27.29
Adult (15+ years) per capita consumption*, males 31.00
Adult (15+ years) per capita consumption*, females 16.49
Heavy episodic drinkers** (15–85+ years), males, 2003 24.9%
Heavy episodic drinkers** (15–85+ years), females, 2003 6.9%
* (Recorded + unrecorded) in litres of pure alcohol, average 2003–2005.**Had at least 60 grams or more of pure alcohol on at least one occasion weekly.
PATTERNS OF DRINKING SCORE
Patterns of drinking score* LEAST RISKY 1 2 3 4 5 MOST RISKY
* Given the same level of consumption, the higher the patterns of drinking score, the greater the alcohol-attributable burden of disease for the country.
ALCOHOL POLICYExcise tax on beer / wine / spirits Yes / Yes / Yes
National legal minimum age for off-premise sales of alcoholic beverages (selling) (beer / wine / spirits) 18 / 18 / 18
National legal minimum age for on-premise sales of alcoholic beverages (serving) (beer / wine / spirits) 18 / 18 / 18
Restrictions for on-/off-premise sales of alcoholic beverages:Time (hours and days) / location (places and density) No / NoSpecifi c events / intoxicated persons / petrol stations Yes / Yes / No
National maximum legal blood alcohol concentration (BAC) when driving a vehicle (general / young / professional), in % 0.08 / 0.08 / 0.08
Legally binding regulations on alcohol advertising / product placement Yes / Yes
Legally binding regulations on alcohol sponsorship / sales promotion No / No
HEALTH CONSEQUENCES
MORBIDITY
Prevalence estimates (12-month prevalence for 2004): Males Females
Alcohol use disorders (15+ years) 0.80% 0.08%
ALL CAUSE MORTALITY
Age-standardized deaths rates, 15+ years (per 100,000 population)
2000 2001 2002 2003 2004 2005
M F M F M F M F M F M F
Liver cirrhosisNo information availableRoad traffi c
accidents (1)
Data source: WHO Mortality Database, data as reported by countries (1) refer to transport accidents.
14%BEER
78%OTHER
7%WINE
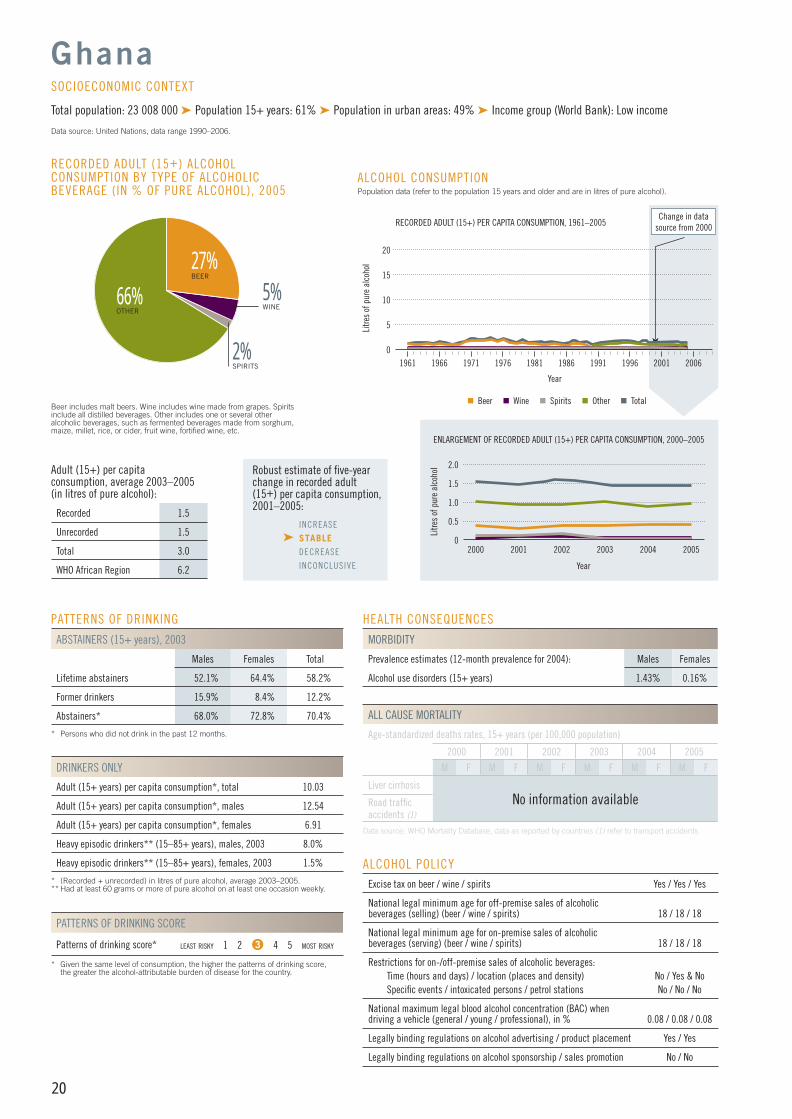
RECORDED ADULT (15+) ALCOHOL CONSUMPTION BY TYPE OF ALCOHOLIC BEVERAGE (IN % OF PURE ALCOHOL), 2005
Beer includes malt beers. Wine includes wine made from grapes. Spirits include all distilled beverages. Other includes one or several other alcoholic beverages, such as fermented beverages made from sorghum, maize, millet, rice, or cider, fruit wine, fortifi ed wine, etc.
Adult (15+) per capita consumption, average 2003–2005 (in litres of pure alcohol):
Recorded 4.5
Unrecorded 2.0
Total 6.5
WHO African Region 6.2
Côte d’Ivoire
Total population: 18 914 000 ➤ Population 15+ years: 59% ➤ Population in urban areas: 45% ➤ Income group (World Bank): Low income
Data source: United Nations, data range 1990–2006.
SOCIOECONOMIC CONTEXT
Robust estimate of fi ve-year change in recorded adult(15+) per capita consumption,2001–2005:
INCREASE
➤ STABLE DECREASE
INCONCLUSIVE
1%SPIRITS
6
2
4
2000 2002 2004
Litre
s of
pur
e al
coho
l
ENLARGEMENT OF RECORDED ADULT (15+) PER CAPITA CONSUMPTION, 2000–2005
Year
2003 20052001
ALCOHOL CONSUMPTION Population data (refer to the population 15 years and older and are in litres of pure alcohol).
15
5
10
1961 1966 1976
Litre
s of
pur
e al
coho
l
1991
RECORDED ADULT (15+) PER CAPITA CONSUMPTION, 1961–2005
Year
1971 1981 2001
20
19961986 2006
Change in data source from 2000
Beer Wine Spirits Other Total
0
0
AFRO CPs FINAL.indd 13AFRO CPs FINAL.indd 13 13/01/2011 08:4513/01/2011 08:45
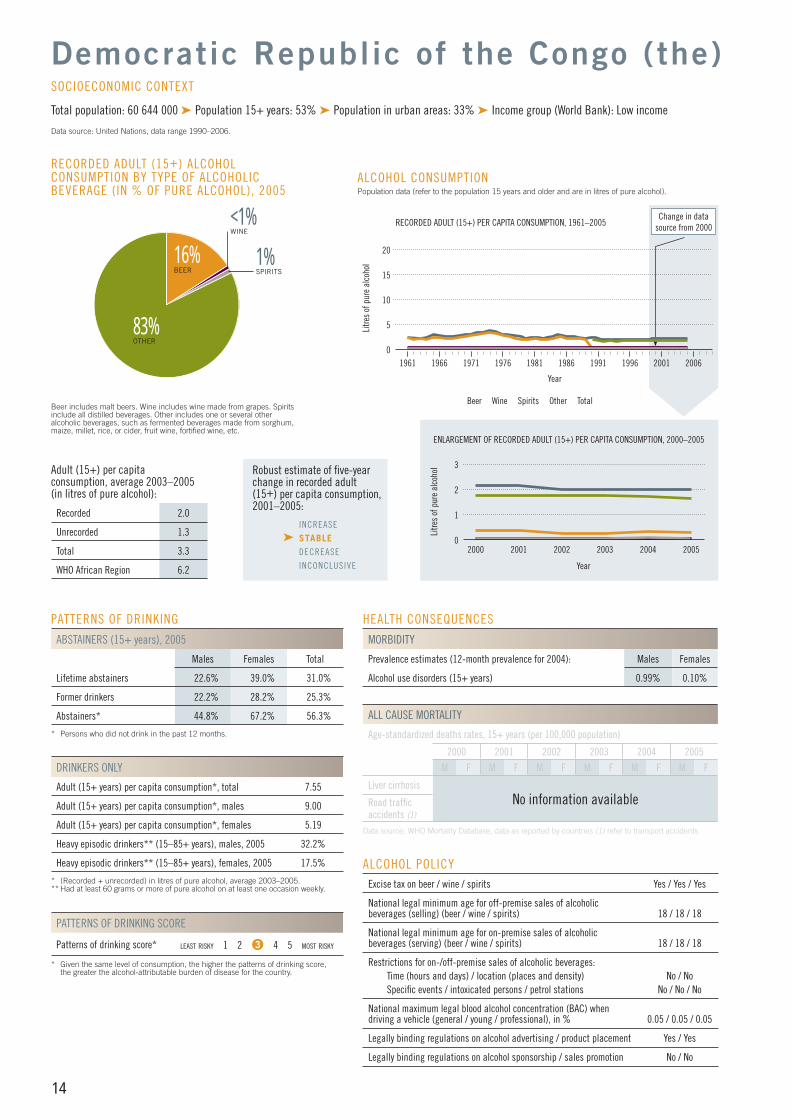
14
PATTERNS OF DRINKING
ABSTAINERS (15+ years), 2005
Males Females Total
Lifetime abstainers 22.6% 39.0% 31.0%
Former drinkers 22.2% 28.2% 25.3%
Abstainers* 44.8% 67.2% 56.3%
* Persons who did not drink in the past 12 months.
DRINKERS ONLY
Adult (15+ years) per capita consumption*, total 7.55
Adult (15+ years) per capita consumption*, males 9.00
Adult (15+ years) per capita consumption*, females 5.19
Heavy episodic drinkers** (15–85+ years), males, 2005 32.2%
Heavy episodic drinkers** (15–85+ years), females, 2005 17.5%
* (Recorded + unrecorded) in litres of pure alcohol, average 2003–2005.** Had at least 60 grams or more of pure alcohol on at least one occasion weekly.
PATTERNS OF DRINKING SCORE
Patterns of drinking score* LEAST RISKY 1 2 3 4 5 MOST RISKY
* Given the same level of consumption, the higher the patterns of drinking score, the greater the alcohol-attributable burden of disease for the country.
ALCOHOL POLICYExcise tax on beer / wine / spirits Yes / Yes / Yes
National legal minimum age for off-premise sales of alcoholic beverages (selling) (beer / wine / spirits) 18 / 18 / 18
National legal minimum age for on-premise sales of alcoholic beverages (serving) (beer / wine / spirits) 18 / 18 / 18
Restrictions for on-/off-premise sales of alcoholic beverages:Time (hours and days) / location (places and density) No / NoSpecifi c events / intoxicated persons / petrol stations No / No / No
National maximum legal blood alcohol concentration (BAC) when driving a vehicle (general / young / professional), in % 0.05 / 0.05 / 0.05
Legally binding regulations on alcohol advertising / product placement Yes / Yes
Legally binding regulations on alcohol sponsorship / sales promotion No / No
HEALTH CONSEQUENCES
MORBIDITY
Prevalence estimates (12-month prevalence for 2004): Males Females
Alcohol use disorders (15+ years) 0.99% 0.10%
ALL CAUSE MORTALITY
Age-standardized deaths rates, 15+ years (per 100,000 population)
2000 2001 2002 2003 2004 2005
M F M F M F M F M F M F
Liver cirrhosisNo information availableRoad traffi c
accidents (1)
Data source: WHO Mortality Database, data as reported by countries (1) refer to transport accidents.
16%BEER
<1%WINE
RECORDED ADULT (15+) ALCOHOL CONSUMPTION BY TYPE OF ALCOHOLIC BEVERAGE (IN % OF PURE ALCOHOL), 2005
Beer includes malt beers. Wine includes wine made from grapes. Spirits include all distilled beverages. Other includes one or several other alcoholic beverages, such as fermented beverages made from sorghum, maize, millet, rice, or cider, fruit wine, fortifi ed wine, etc.
Adult (15+) per capita consumption, average 2003–2005 (in litres of pure alcohol):
Recorded 2.0
Unrecorded 1.3
Total 3.3
WHO African Region 6.2
Democratic Republic of the Congo (the)
Total population: 60 644 000 ➤ Population 15+ years: 53% ➤ Population in urban areas: 33% ➤ Income group (World Bank): Low income
Data source: United Nations, data range 1990–2006.
SOCIOECONOMIC CONTEXT
Robust estimate of fi ve-year change in recorded adult(15+) per capita consumption,2001–2005:
INCREASE
➤ STABLE DECREASE
INCONCLUSIVE
1%SPIRITS
83%OTHER
3
1
2
2000 2002 2004
Litre
s of
pur
e al
coho
lENLARGEMENT OF RECORDED ADULT (15+) PER CAPITA CONSUMPTION, 2000–2005
Year
2003 20052001
ALCOHOL CONSUMPTION Population data (refer to the population 15 years and older and are in litres of pure alcohol).
15
5
10
1961 1966 1976Li
tres
of p
ure
alco
hol
1991
RECORDED ADULT (15+) PER CAPITA CONSUMPTION, 1961–2005
Year
1971 1981 2001
20
19961986 2006
Change in data source from 2000
Beer Wine Spirits Other Total
0
0
AFRO CPs FINAL.indd 14AFRO CPs FINAL.indd 14 13/01/2011 08:4513/01/2011 08:45
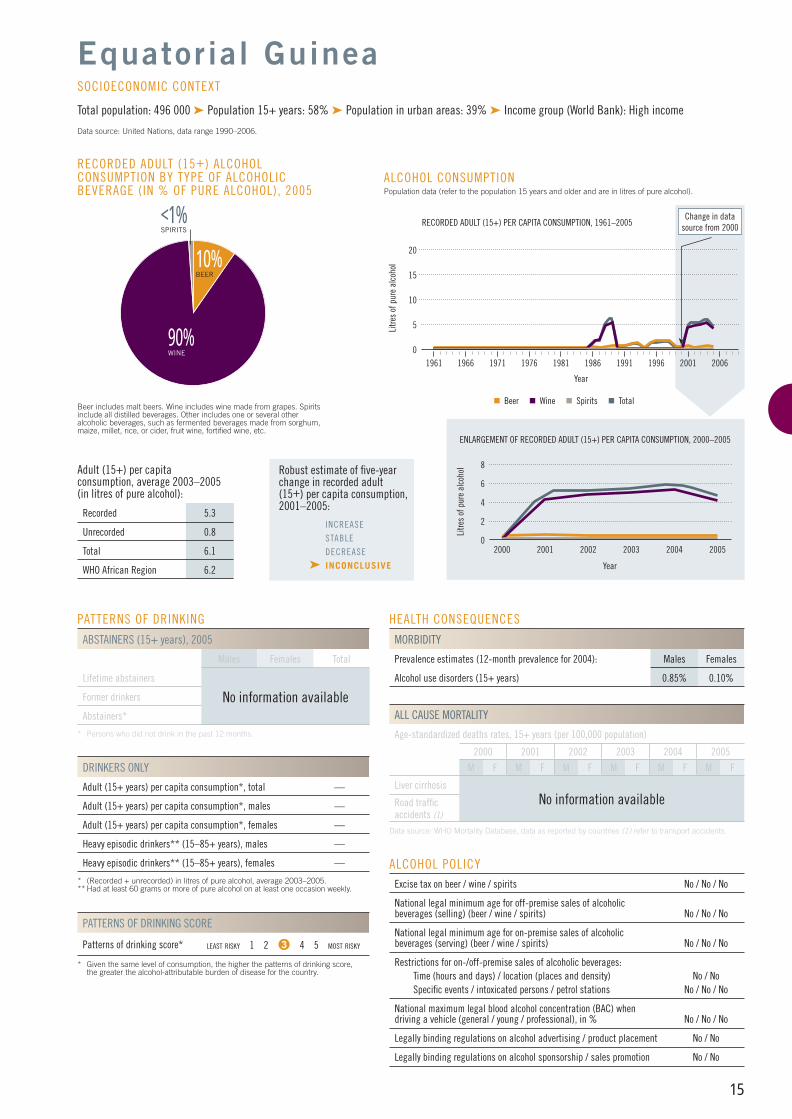
15
PATTERNS OF DRINKING
ABSTAINERS (15+ years), 2005
Males Females Total
Lifetime abstainers
No information availableFormer drinkers
Abstainers*
* Persons who did not drink in the past 12 months.
DRINKERS ONLY
Adult (15+ years) per capita consumption*, total —
Adult (15+ years) per capita consumption*, males —
Adult (15+ years) per capita consumption*, females —
Heavy episodic drinkers** (15–85+ years), males —
Heavy episodic drinkers** (15–85+ years), females —
* (Recorded + unrecorded) in litres of pure alcohol, average 2003–2005.** Had at least 60 grams or more of pure alcohol on at least one occasion weekly.
PATTERNS OF DRINKING SCORE
Patterns of drinking score* LEAST RISKY 1 2 3 4 5 MOST RISKY
* Given the same level of consumption, the higher the patterns of drinking score, the greater the alcohol-attributable burden of disease for the country.
ALCOHOL POLICYExcise tax on beer / wine / spirits No / No / No
National legal minimum age for off-premise sales of alcoholic beverages (selling) (beer / wine / spirits) No / No / No
National legal minimum age for on-premise sales of alcoholic beverages (serving) (beer / wine / spirits) No / No / No
Restrictions for on-/off-premise sales of alcoholic beverages:Time (hours and days) / location (places and density) No / NoSpecifi c events / intoxicated persons / petrol stations No / No / No
National maximum legal blood alcohol concentration (BAC) when driving a vehicle (general / young / professional), in % No / No / No
Legally binding regulations on alcohol advertising / product placement No / No
Legally binding regulations on alcohol sponsorship / sales promotion No / No
HEALTH CONSEQUENCES
MORBIDITY
Prevalence estimates (12-month prevalence for 2004): Males Females
Alcohol use disorders (15+ years) 0.85% 0.10%
ALL CAUSE MORTALITY
Age-standardized deaths rates, 15+ years (per 100,000 population)
2000 2001 2002 2003 2004 2005
M F M F M F M F M F M F
Liver cirrhosisNo information availableRoad traffi c
accidents (1)
Data source: WHO Mortality Database, data as reported by countries (1) refer to transport accidents.
10%BEER
90%WINE
<1%SPIRITS
RECORDED ADULT (15+) ALCOHOL CONSUMPTION BY TYPE OF ALCOHOLIC BEVERAGE (IN % OF PURE ALCOHOL), 2005
Beer includes malt beers. Wine includes wine made from grapes. Spirits include all distilled beverages. Other includes one or several other alcoholic beverages, such as fermented beverages made from sorghum, maize, millet, rice, or cider, fruit wine, fortifi ed wine, etc.
Adult (15+) per capita consumption, average 2003–2005 (in litres of pure alcohol):
Recorded 5.3
Unrecorded 0.8
Total 6.1
WHO African Region 6.2
Equatorial Guinea
Total population: 496 000 ➤ Population 15+ years: 58% ➤ Population in urban areas: 39% ➤ Income group (World Bank): High income
Data source: United Nations, data range 1990–2006.
SOCIOECONOMIC CONTEXT
Robust estimate of fi ve-year change in recorded adult(15+) per capita consumption,2001–2005:
INCREASE
STABLE
DECREASE
➤ INCONCLUSIVE
8
2
4
2000 2002 2004
Litre
s of
pur
e al
coho
l
ENLARGEMENT OF RECORDED ADULT (15+) PER CAPITA CONSUMPTION, 2000–2005
Year
2003 20052001
ALCOHOL CONSUMPTION Population data (refer to the population 15 years and older and are in litres of pure alcohol).
15
5
10
1961 1966 1976
Litre
s of
pur
e al
coho
l
1991
RECORDED ADULT (15+) PER CAPITA CONSUMPTION, 1961–2005
Year
1971 1981 2001
20
19961986 2006
Change in data source from 2000
Beer Wine Spirits Total
6
0
0
AFRO CPs FINAL.indd 15AFRO CPs FINAL.indd 15 13/01/2011 08:4513/01/2011 08:45
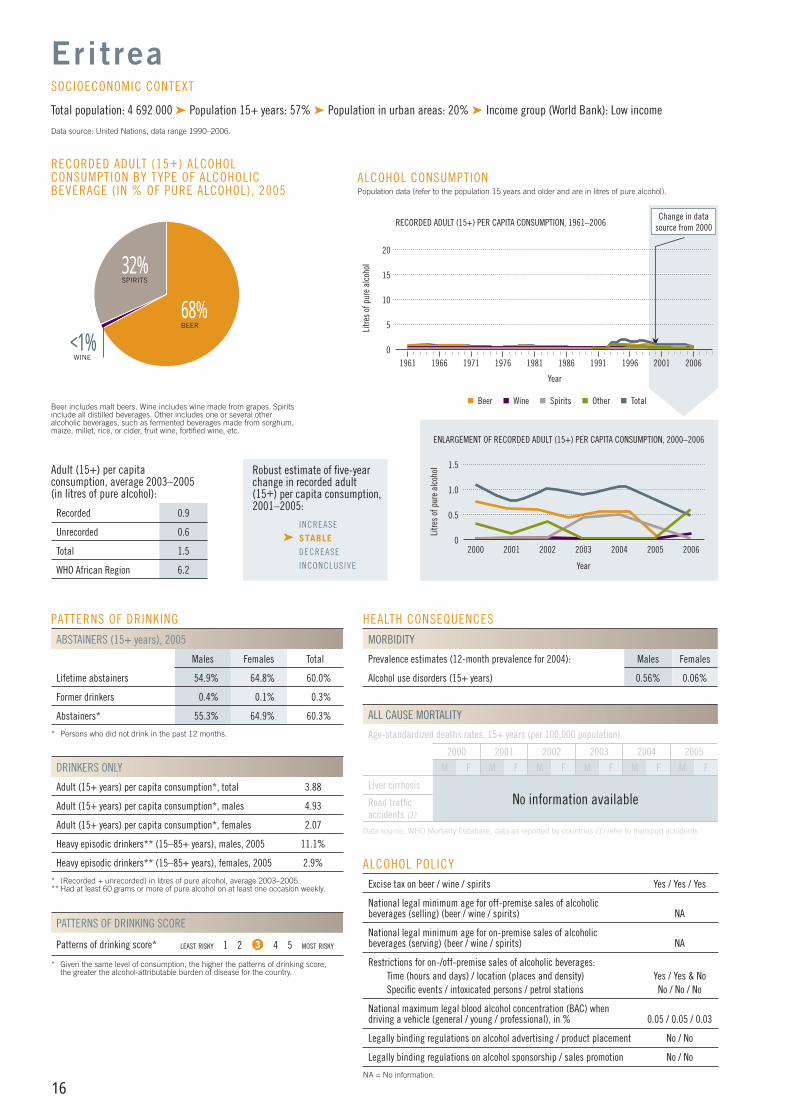
16
PATTERNS OF DRINKING
ABSTAINERS (15+ years), 2005
Males Females Total
Lifetime abstainers 54.9% 64.8% 60.0%
Former drinkers 0.4% 0.1% 0.3%
Abstainers* 55.3% 64.9% 60.3%
* Persons who did not drink in the past 12 months.
DRINKERS ONLY
Adult (15+ years) per capita consumption*, total 3.88
Adult (15+ years) per capita consumption*, males 4.93
Adult (15+ years) per capita consumption*, females 2.07
Heavy episodic drinkers** (15–85+ years), males, 2005 11.1%
Heavy episodic drinkers** (15–85+ years), females, 2005 2.9%
* (Recorded + unrecorded) in litres of pure alcohol, average 2003–2005.** Had at least 60 grams or more of pure alcohol on at least one occasion weekly.
PATTERNS OF DRINKING SCORE
Patterns of drinking score* LEAST RISKY 1 2 3 4 5 MOST RISKY
* Given the same level of consumption, the higher the patterns of drinking score, the greater the alcohol-attributable burden of disease for the country.
ALCOHOL POLICYExcise tax on beer / wine / spirits Yes / Yes / Yes
National legal minimum age for off-premise sales of alcoholic beverages (selling) (beer / wine / spirits) NA
National legal minimum age for on-premise sales of alcoholic beverages (serving) (beer / wine / spirits) NA
Restrictions for on-/off-premise sales of alcoholic beverages:Time (hours and days) / location (places and density) Yes / Yes & NoSpecifi c events / intoxicated persons / petrol stations No / No / No
National maximum legal blood alcohol concentration (BAC) when driving a vehicle (general / young / professional), in % 0.05 / 0.05 / 0.03
Legally binding regulations on alcohol advertising / product placement No / No
Legally binding regulations on alcohol sponsorship / sales promotion No / No
NA = No information.
HEALTH CONSEQUENCES
MORBIDITY
Prevalence estimates (12-month prevalence for 2004): Males Females
Alcohol use disorders (15+ years) 0.56% 0.06%
ALL CAUSE MORTALITY
Age-standardized deaths rates, 15+ years (per 100,000 population)
2000 2001 2002 2003 2004 2005
M F M F M F M F M F M F
Liver cirrhosisNo information availableRoad traffi c
accidents (1)
Data source: WHO Mortality Database, data as reported by countries (1) refer to transport accidents.
68%BEER
<1%WINE
RECORDED ADULT (15+) ALCOHOL CONSUMPTION BY TYPE OF ALCOHOLIC BEVERAGE (IN % OF PURE ALCOHOL), 2005
Beer includes malt beers. Wine includes wine made from grapes. Spirits include all distilled beverages. Other includes one or several other alcoholic beverages, such as fermented beverages made from sorghum, maize, millet, rice, or cider, fruit wine, fortifi ed wine, etc.
Adult (15+) per capita consumption, average 2003–2005 (in litres of pure alcohol):
Recorded 0.9
Unrecorded 0.6
Total 1.5
WHO African Region 6.2
Eritrea
Total population: 4 692 000 ➤ Population 15+ years: 57% ➤ Population in urban areas: 20% ➤ Income group (World Bank): Low income
Data source: United Nations, data range 1990–2006.
SOCIOECONOMIC CONTEXT
Robust estimate of fi ve-year change in recorded adult(15+) per capita consumption,2001–2005:
INCREASE
➤ STABLE DECREASE
INCONCLUSIVE
32%SPIRITS
1.5
0.5
1.0
2000 2002
Litre
s of
pur
e al
coho
lENLARGEMENT OF RECORDED ADULT (15+) PER CAPITA CONSUMPTION, 2000–2006
Year
2003 20062001
ALCOHOL CONSUMPTION Population data (refer to the population 15 years and older and are in litres of pure alcohol).
15
5
10
1961 1966 1976Li
tres
of p
ure
alco
hol
1991
RECORDED ADULT (15+) PER CAPITA CONSUMPTION, 1961–2006
Year
1971 1981 2001
20
19961986 2006
Change in data source from 2000
Beer Wine Spirits Other Total
0
0
20052004
AFRO CPs FINAL.indd 16AFRO CPs FINAL.indd 16 13/01/2011 08:4513/01/2011 08:45
17
PATTERNS OF DRINKING
ABSTAINERS (15+ years), 2003
Males Females Total
Lifetime abstainers 59.0% 64.2% 61.6%
Former drinkers 12.9% 8.4% 10.7%
Abstainers* 71.9% 72.6% 72.3%
* Persons who did not drink in the past 12 months.
DRINKERS ONLY
Adult (15+ years) per capita consumption*, total 14.51
Adult (15+ years) per capita consumption*, males 21.65
Adult (15+ years) per capita consumption*, females 7.22
Heavy episodic drinkers** (15–85+ years), males, 2003 27.5%
Heavy episodic drinkers** (15–85+ years), females, 2003 1.2%
* (Recorded + unrecorded) in litres of pure alcohol, average 2003–2005.** Had at least 60 grams or more of pure alcohol on at least one occasion weekly.
PATTERNS OF DRINKING SCORE
Patterns of drinking score* LEAST RISKY 1 2 3 4 5 MOST RISKY
* Given the same level of consumption, the higher the patterns of drinking score, the greater the alcohol-attributable burden of disease for the country.
ALCOHOL POLICYExcise tax on beer / wine / spirits Yes / Yes / Yes
National legal minimum age for off-premise sales of alcoholic beverages (selling) (beer / wine / spirits) 18 / 18 / 18
National legal minimum age for on-premise sales of alcoholic beverages (serving) (beer / wine / spirits) 18 / 18 / 18
Restrictions for on-/off-premise sales of alcoholic beverages:Time (hours and days) / location (places and density) No / Yes & NoSpecifi c events / intoxicated persons / petrol stations Yes / No / Yes
National maximum legal blood alcohol concentration (BAC) when driving a vehicle (general / young / professional), in % No / No / No
Legally binding regulations on alcohol advertising / product placement Yes / Yes
Legally binding regulations on alcohol sponsorship / sales promotion Yes / Yes
HEALTH CONSEQUENCES
MORBIDITY
Prevalence estimates (12-month prevalence for 2004): Males Females
Alcohol use disorders (15+ years) 1.88% 0.10%
ALL CAUSE MORTALITY
Age-standardized deaths rates, 15+ years (per 100,000 population)
2000 2001 2002 2003 2004 2005
M F M F M F M F M F M F
Liver cirrhosisNo information availableRoad traffi c
accidents (1)
Data source: WHO Mortality Database, data as reported by countries (1) refer to transport accidents.
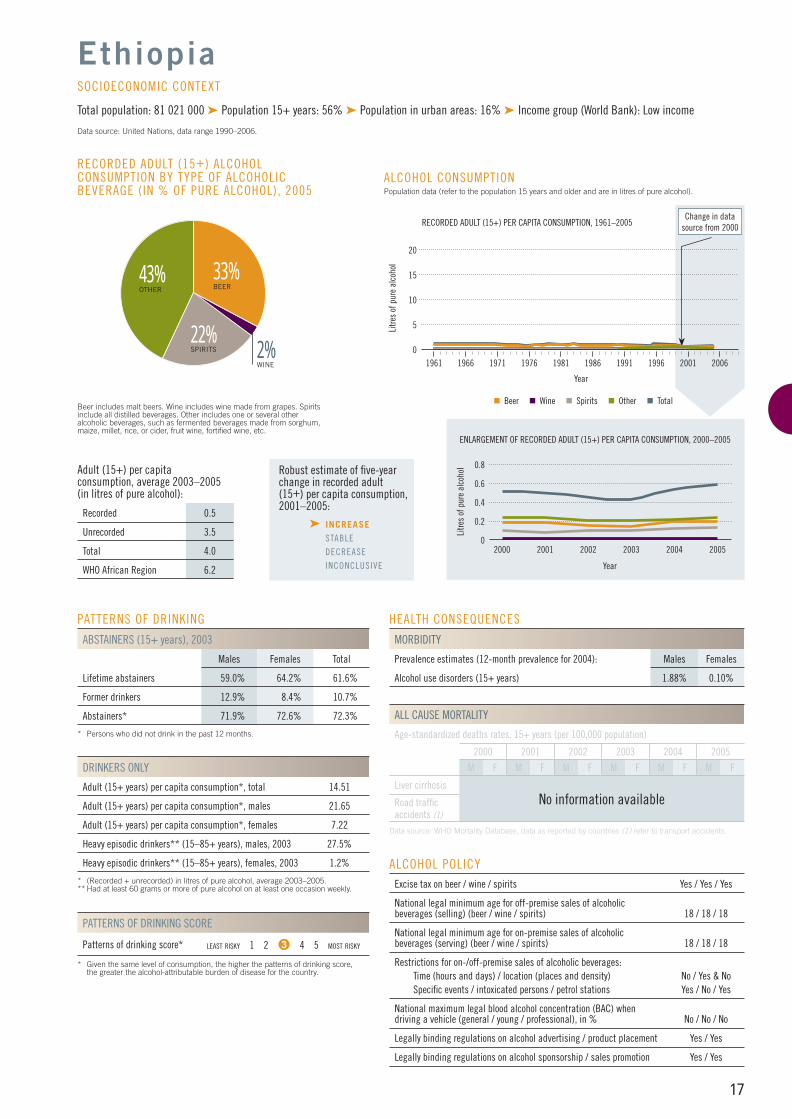
33%BEER
43%OTHER
22%SPIRITS
RECORDED ADULT (15+) ALCOHOL CONSUMPTION BY TYPE OF ALCOHOLIC BEVERAGE (IN % OF PURE ALCOHOL), 2005
Beer includes malt beers. Wine includes wine made from grapes. Spirits include all distilled beverages. Other includes one or several other alcoholic beverages, such as fermented beverages made from sorghum, maize, millet, rice, or cider, fruit wine, fortifi ed wine, etc.
Adult (15+) per capita consumption, average 2003–2005 (in litres of pure alcohol):
Recorded 0.5
Unrecorded 3.5
Total 4.0
WHO African Region 6.2
Ethiopia
Total population: 81 021 000 ➤ Population 15+ years: 56% ➤ Population in urban areas: 16% ➤ Income group (World Bank): Low income
Data source: United Nations, data range 1990–2006.
SOCIOECONOMIC CONTEXT
Robust estimate of fi ve-year change in recorded adult(15+) per capita consumption,2001–2005:
➤ INCREASE STABLE
DECREASE
INCONCLUSIVE
2%WINE
0.8
0.2
0.4
2000 2002 2004
Litre
s of
pur
e al
coho
l
ENLARGEMENT OF RECORDED ADULT (15+) PER CAPITA CONSUMPTION, 2000–2005
Year
2003 20052001
ALCOHOL CONSUMPTION Population data (refer to the population 15 years and older and are in litres of pure alcohol).
15
5
10
1961 1966 1976
Litre
s of
pur
e al
coho
l
1991
RECORDED ADULT (15+) PER CAPITA CONSUMPTION, 1961–2005
Year
1971 1981 2001
20
19961986 2006
Change in data source from 2000
Beer Wine Spirits Other Total
0
0.6
0
AFRO CPs FINAL.indd 17AFRO CPs FINAL.indd 17 13/01/2011 08:4513/01/2011 08:45
18
PATTERNS OF DRINKING
ABSTAINERS (15+ years), 2005
Males Females Total
Lifetime abstainers
No information availableFormer drinkers
Abstainers*
* Persons who did not drink in the past 12 months.
DRINKERS ONLY
Adult (15+ years) per capita consumption*, total —
Adult (15+ years) per capita consumption*, males —
Adult (15+ years) per capita consumption*, females —
Heavy episodic drinkers** (15–85+ years), males —
Heavy episodic drinkers** (15–85+ years), females —
* (Recorded + unrecorded) in litres of pure alcohol, average 2003–2005.** Had at least 60 grams or more of pure alcohol on at least one occasion weekly.
PATTERNS OF DRINKING SCORE
Patterns of drinking score* LEAST RISKY 1 2 3 4 5 MOST RISKY
* Given the same level of consumption, the higher the patterns of drinking score, the greater the alcohol-attributable burden of disease for the country.
ALCOHOL POLICYExcise tax on beer / wine / spirits NA
National legal minimum age for off-premise sales of alcoholic beverages (selling) (beer / wine / spirits) NA
National legal minimum age for on-premise sales of alcoholic beverages (serving) (beer / wine / spirits) NA
Restrictions for on-/off-premise sales of alcoholic beverages:Time (hours and days) / location (places and density) No & Yes / NoSpecifi c events / intoxicated persons / petrol stations No / No / No
National maximum legal blood alcohol concentration (BAC) when driving a vehicle (general / young / professional), in % 0.08 / 0.08 / 0.08
Legally binding regulations on alcohol advertising / product placement NA
Legally binding regulations on alcohol sponsorship / sales promotion No / No
NA = No information.
HEALTH CONSEQUENCES
MORBIDITY
Prevalence estimates (12-month prevalence for 2004): Males Females
Alcohol use disorders (15+ years) 2.57% 0.29%
ALL CAUSE MORTALITY
Age-standardized deaths rates, 15+ years (per 100,000 population)
2000 2001 2002 2003 2004 2005
M F M F M F M F M F M F
Liver cirrhosisNo information availableRoad traffi c
accidents (1)
Data source: WHO Mortality Database, data as reported by countries (1) refer to transport accidents.
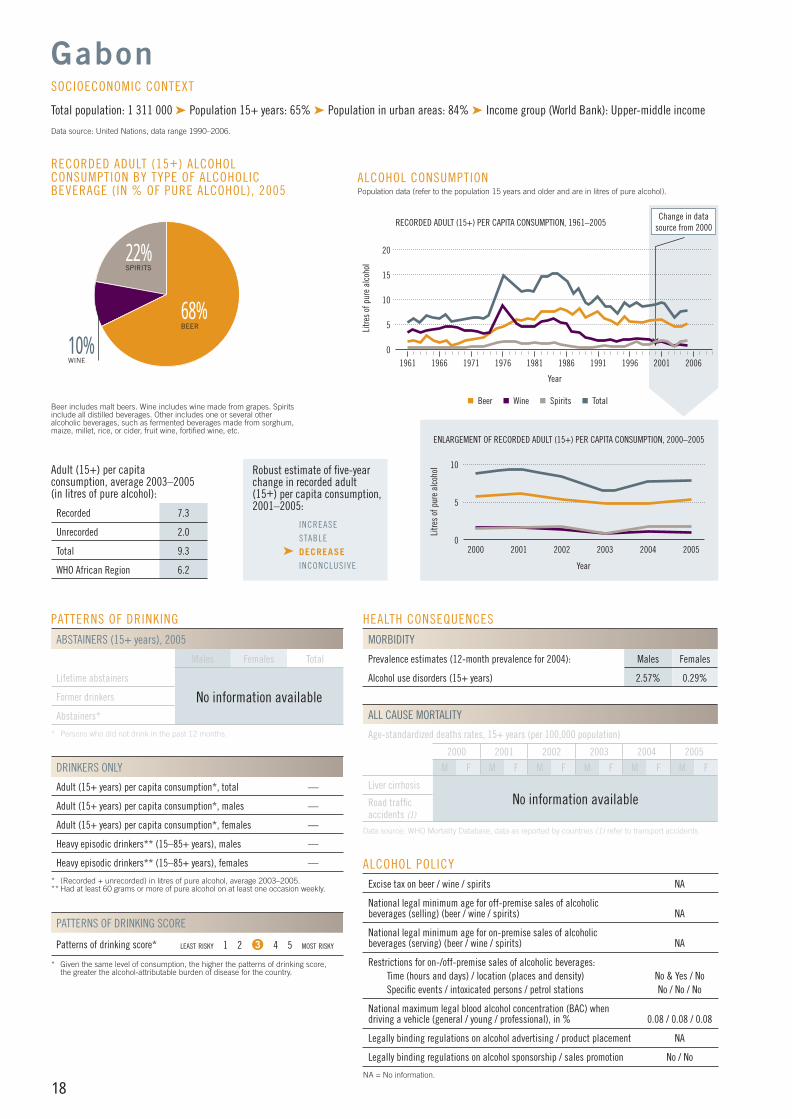
68%BEER
10%WINE
RECORDED ADULT (15+) ALCOHOL CONSUMPTION BY TYPE OF ALCOHOLIC BEVERAGE (IN % OF PURE ALCOHOL), 2005
Beer includes malt beers. Wine includes wine made from grapes. Spirits include all distilled beverages. Other includes one or several other alcoholic beverages, such as fermented beverages made from sorghum, maize, millet, rice, or cider, fruit wine, fortifi ed wine, etc.
Adult (15+) per capita consumption, average 2003–2005 (in litres of pure alcohol):
Recorded 7.3
Unrecorded 2.0
Total 9.3
WHO African Region 6.2
Gabon
Total population: 1 311 000 ➤ Population 15+ years: 65% ➤ Population in urban areas: 84% ➤ Income group (World Bank): Upper-middle income
Data source: United Nations, data range 1990–2006.
SOCIOECONOMIC CONTEXT
Robust estimate of fi ve-year change in recorded adult(15+) per capita consumption,2001–2005:
INCREASE
STABLE
➤ DECREASE INCONCLUSIVE
22%SPIRITS
10
5
2000 2002 2004
Litre
s of
pur
e al
coho
lENLARGEMENT OF RECORDED ADULT (15+) PER CAPITA CONSUMPTION, 2000–2005
Year
2003 20052001
ALCOHOL CONSUMPTION Population data (refer to the population 15 years and older and are in litres of pure alcohol).
15
5
10
1961 1966 1976Li
tres
of p
ure
alco
hol
1991
RECORDED ADULT (15+) PER CAPITA CONSUMPTION, 1961–2005
Year
1971 1981 2001
20
19961986 2006
Change in data source from 2000
Beer Wine Spirits Total
0
0
AFRO CPs FINAL.indd 18AFRO CPs FINAL.indd 18 13/01/2011 08:4513/01/2011 08:45
19
PATTERNS OF DRINKING
ABSTAINERS (15+ years), 2005
Males Females Total
Lifetime abstainers
No information availableFormer drinkers
Abstainers*
* Persons who did not drink in the past 12 months.
DRINKERS ONLY
Adult (15+ years) per capita consumption*, total —
Adult (15+ years) per capita consumption*, males —
Adult (15+ years) per capita consumption*, females —
Heavy episodic drinkers** (15–85+ years), males —
Heavy episodic drinkers** (15–85+ years), females —
* (Recorded + unrecorded) in litres of pure alcohol, average 2003–2005.** Had at least 60 grams or more of pure alcohol on at least one occasion weekly.
PATTERNS OF DRINKING SCORE
Patterns of drinking score* LEAST RISKY No information available MOST RISKY
* Given the same level of consumption, the higher the patterns of drinking score, the greater the alcohol-attributable burden of disease for the country.
ALCOHOL POLICYExcise tax on beer / wine / spirits Yes / Yes / Yes
National legal minimum age for off-premise sales of alcoholic beverages (selling) (beer / wine / spirits) 18 / 18 / 18
National legal minimum age for on-premise sales of alcoholic beverages (serving) (beer / wine / spirits) 18 / 18 / 18
Restrictions for on-/off-premise sales of alcoholic beverages:Time (hours and days) / location (places and density) Yes & No / NoSpecifi c events / intoxicated persons / petrol stations Yes / No / No
National maximum legal blood alcohol concentration (BAC) when driving a vehicle (general / young / professional), in % No / No / No
Legally binding regulations on alcohol advertising / product placement Yes / Yes
Legally binding regulations on alcohol sponsorship / sales promotion Yes / Yes
HEALTH CONSEQUENCES
MORBIDITY
Prevalence estimates (12-month prevalence for 2004): Males Females
Alcohol use disorders (15+ years) 1.03% 0.12%
ALL CAUSE MORTALITY
Age-standardized deaths rates, 15+ years (per 100,000 population)
2000 2001 2002 2003 2004 2005
M F M F M F M F M F M F
Liver cirrhosisNo information availableRoad traffi c
accidents (1)
Data source: WHO Mortality Database, data as reported by countries (1) refer to transport accidents.
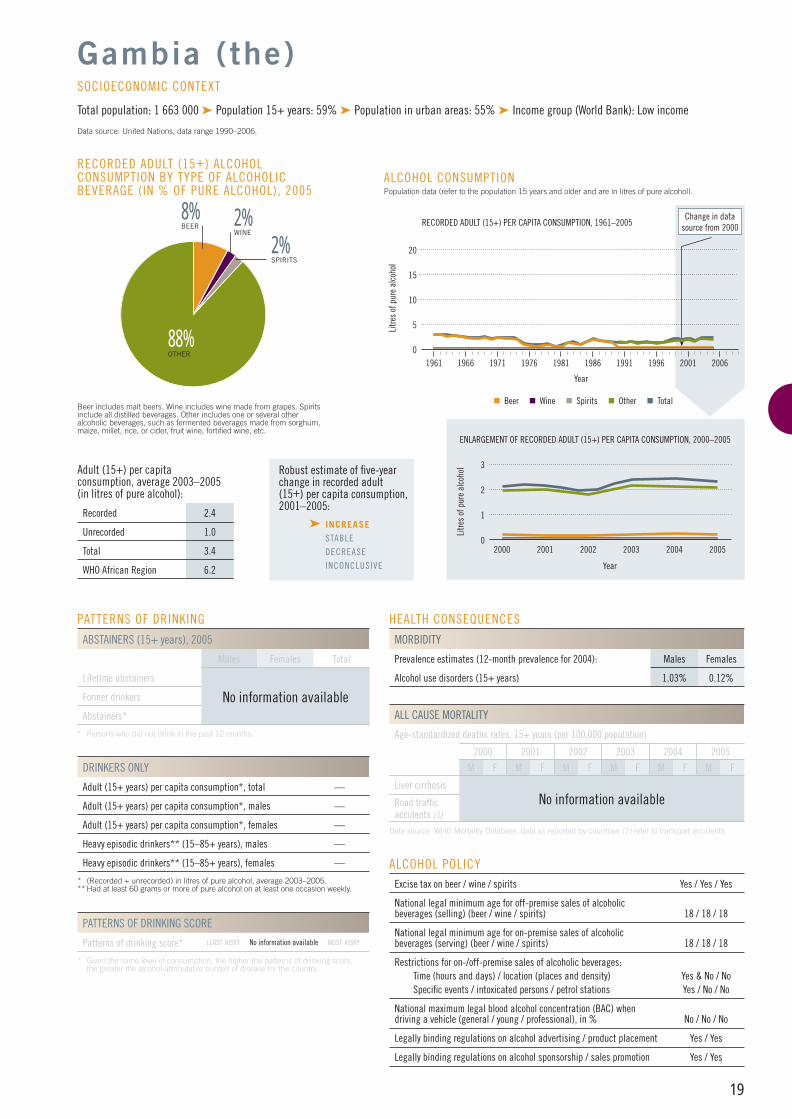
88%OTHER
2%SPIRITS
RECORDED ADULT (15+) ALCOHOL CONSUMPTION BY TYPE OF ALCOHOLIC BEVERAGE (IN % OF PURE ALCOHOL), 2005
Beer includes malt beers. Wine includes wine made from grapes. Spirits include all distilled beverages. Other includes one or several other alcoholic beverages, such as fermented beverages made from sorghum, maize, millet, rice, or cider, fruit wine, fortifi ed wine, etc.
Adult (15+) per capita consumption, average 2003–2005 (in litres of pure alcohol):
Recorded 2.4
Unrecorded 1.0
Total 3.4
WHO African Region 6.2
Gambia (the)
Total population: 1 663 000 ➤ Population 15+ years: 59% ➤ Population in urban areas: 55% ➤ Income group (World Bank): Low income
Data source: United Nations, data range 1990–2006.
SOCIOECONOMIC CONTEXT
Robust estimate of fi ve-year change in recorded adult(15+) per capita consumption,2001–2005:
➤ INCREASE STABLE
DECREASE
INCONCLUSIVE
2%WINE
8%BEER
3
1
2
2000 2002 2004
Litre
s of
pur
e al
coho
l
ENLARGEMENT OF RECORDED ADULT (15+) PER CAPITA CONSUMPTION, 2000–2005
Year
2003 20052001
ALCOHOL CONSUMPTION Population data (refer to the population 15 years and older and are in litres of pure alcohol).
15
5
10
1961 1966 1976
Litre
s of
pur
e al
coho
l
1991
RECORDED ADULT (15+) PER CAPITA CONSUMPTION, 1961–2005
Year
1971 1981 2001
20
19961986 2006
Change in data source from 2000
Beer Wine Spirits Other Total
0
0
AFRO CPs FINAL.indd 19AFRO CPs FINAL.indd 19 13/01/2011 08:4513/01/2011 08:45
20
PATTERNS OF DRINKING
ABSTAINERS (15+ years), 2003
Males Females Total
Lifetime abstainers 52.1% 64.4% 58.2%
Former drinkers 15.9% 8.4% 12.2%
Abstainers* 68.0% 72.8% 70.4%
* Persons who did not drink in the past 12 months.
DRINKERS ONLY
Adult (15+ years) per capita consumption*, total 10.03
Adult (15+ years) per capita consumption*, males 12.54
Adult (15+ years) per capita consumption*, females 6.91
Heavy episodic drinkers** (15–85+ years), males, 2003 8.0%
Heavy episodic drinkers** (15–85+ years), females, 2003 1.5%
* (Recorded + unrecorded) in litres of pure alcohol, average 2003–2005.** Had at least 60 grams or more of pure alcohol on at least one occasion weekly.
PATTERNS OF DRINKING SCORE
Patterns of drinking score* LEAST RISKY 1 2 3 4 5 MOST RISKY
* Given the same level of consumption, the higher the patterns of drinking score, the greater the alcohol-attributable burden of disease for the country.
ALCOHOL POLICYExcise tax on beer / wine / spirits Yes / Yes / Yes
National legal minimum age for off-premise sales of alcoholic beverages (selling) (beer / wine / spirits) 18 / 18 / 18
National legal minimum age for on-premise sales of alcoholic beverages (serving) (beer / wine / spirits) 18 / 18 / 18
Restrictions for on-/off-premise sales of alcoholic beverages:Time (hours and days) / location (places and density) No / Yes & NoSpecifi c events / intoxicated persons / petrol stations No / No / No
National maximum legal blood alcohol concentration (BAC) when driving a vehicle (general / young / professional), in % 0.08 / 0.08 / 0.08
Legally binding regulations on alcohol advertising / product placement Yes / Yes
Legally binding regulations on alcohol sponsorship / sales promotion No / No
HEALTH CONSEQUENCES
MORBIDITY
Prevalence estimates (12-month prevalence for 2004): Males Females
Alcohol use disorders (15+ years) 1.43% 0.16%
ALL CAUSE MORTALITY
Age-standardized deaths rates, 15+ years (per 100,000 population)
2000 2001 2002 2003 2004 2005
M F M F M F M F M F M F
Liver cirrhosisNo information availableRoad traffi c
accidents (1)
Data source: WHO Mortality Database, data as reported by countries (1) refer to transport accidents.
27%BEER
5%WINE
RECORDED ADULT (15+) ALCOHOL CONSUMPTION BY TYPE OF ALCOHOLIC BEVERAGE (IN % OF PURE ALCOHOL), 2005
Beer includes malt beers. Wine includes wine made from grapes. Spirits include all distilled beverages. Other includes one or several other alcoholic beverages, such as fermented beverages made from sorghum, maize, millet, rice, or cider, fruit wine, fortifi ed wine, etc.
Adult (15+) per capita consumption, average 2003–2005 (in litres of pure alcohol):
Recorded 1.5
Unrecorded 1.5
Total 3.0
WHO African Region 6.2
Ghana
Total population: 23 008 000 ➤ Population 15+ years: 61% ➤ Population in urban areas: 49% ➤ Income group (World Bank): Low income
Data source: United Nations, data range 1990–2006.
SOCIOECONOMIC CONTEXT
Robust estimate of fi ve-year change in recorded adult(15+) per capita consumption,2001–2005:
INCREASE
➤ STABLE DECREASE
INCONCLUSIVE
2%SPIRITS
66%OTHER
2.0
0.5
1.5
2000 2002 2004
Litre
s of
pur
e al
coho
lENLARGEMENT OF RECORDED ADULT (15+) PER CAPITA CONSUMPTION, 2000–2005
Year
2003 20052001
ALCOHOL CONSUMPTION Population data (refer to the population 15 years and older and are in litres of pure alcohol).
15
5
10
1961 1966 1976Li
tres
of p
ure
alco
hol
1991
RECORDED ADULT (15+) PER CAPITA CONSUMPTION, 1961–2005
Year
1971 1981 2001
20
19961986 2006
Change in data source from 2000
Beer Wine Spirits Other Total
1.0
0
0
AFRO CPs FINAL.indd 20AFRO CPs FINAL.indd 20 13/01/2011 08:4513/01/2011 08:45
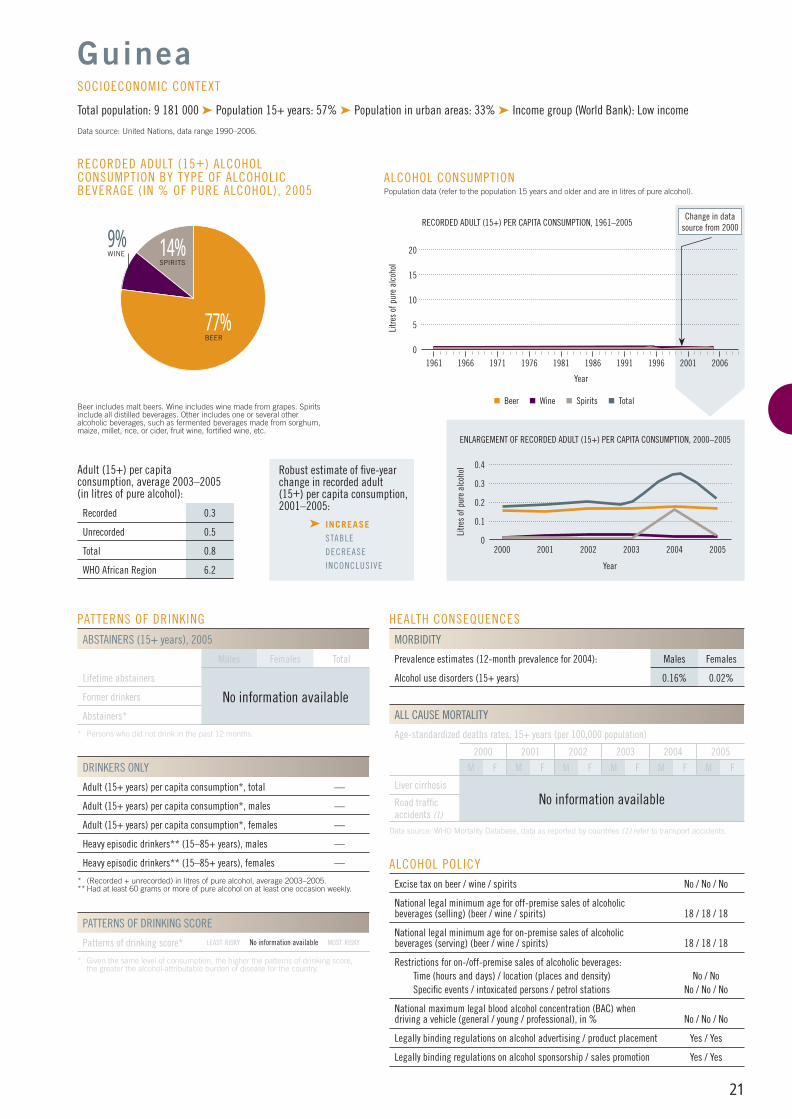
21
PATTERNS OF DRINKING
ABSTAINERS (15+ years), 2005
Males Females Total
Lifetime abstainers
No information availableFormer drinkers
Abstainers*
* Persons who did not drink in the past 12 months.
DRINKERS ONLY
Adult (15+ years) per capita consumption*, total —
Adult (15+ years) per capita consumption*, males —
Adult (15+ years) per capita consumption*, females —
Heavy episodic drinkers** (15–85+ years), males —
Heavy episodic drinkers** (15–85+ years), females —
* (Recorded + unrecorded) in litres of pure alcohol, average 2003–2005.** Had at least 60 grams or more of pure alcohol on at least one occasion weekly.
PATTERNS OF DRINKING SCORE
Patterns of drinking score* LEAST RISKY No information available MOST RISKY
* Given the same level of consumption, the higher the patterns of drinking score, the greater the alcohol-attributable burden of disease for the country.
ALCOHOL POLICYExcise tax on beer / wine / spirits No / No / No
National legal minimum age for off-premise sales of alcoholic beverages (selling) (beer / wine / spirits) 18 / 18 / 18
National legal minimum age for on-premise sales of alcoholic beverages (serving) (beer / wine / spirits) 18 / 18 / 18
Restrictions for on-/off-premise sales of alcoholic beverages:Time (hours and days) / location (places and density) No / NoSpecifi c events / intoxicated persons / petrol stations No / No / No
National maximum legal blood alcohol concentration (BAC) when driving a vehicle (general / young / professional), in % No / No / No
Legally binding regulations on alcohol advertising / product placement Yes / Yes
Legally binding regulations on alcohol sponsorship / sales promotion Yes / Yes
HEALTH CONSEQUENCES
MORBIDITY
Prevalence estimates (12-month prevalence for 2004): Males Females
Alcohol use disorders (15+ years) 0.16% 0.02%
ALL CAUSE MORTALITY
Age-standardized deaths rates, 15+ years (per 100,000 population)
2000 2001 2002 2003 2004 2005
M F M F M F M F M F M F
Liver cirrhosisNo information availableRoad traffi c
accidents (1)
Data source: WHO Mortality Database, data as reported by countries (1) refer to transport accidents.
77%BEER
9%WINE
RECORDED ADULT (15+) ALCOHOL CONSUMPTION BY TYPE OF ALCOHOLIC BEVERAGE (IN % OF PURE ALCOHOL), 2005
Beer includes malt beers. Wine includes wine made from grapes. Spirits include all distilled beverages. Other includes one or several other alcoholic beverages, such as fermented beverages made from sorghum, maize, millet, rice, or cider, fruit wine, fortifi ed wine, etc.
Adult (15+) per capita consumption, average 2003–2005 (in litres of pure alcohol):
Recorded 0.3
Unrecorded 0.5
Total 0.8
WHO African Region 6.2
Guinea
Total population: 9 181 000 ➤ Population 15+ years: 57% ➤ Population in urban areas: 33% ➤ Income group (World Bank): Low income
Data source: United Nations, data range 1990–2006.
SOCIOECONOMIC CONTEXT
Robust estimate of fi ve-year change in recorded adult(15+) per capita consumption,2001–2005:
➤ INCREASE STABLE
DECREASE
INCONCLUSIVE
14%SPIRITS
0.4
0.2
2000 2002 2004
Litre
s of
pur
e al
coho
l
ENLARGEMENT OF RECORDED ADULT (15+) PER CAPITA CONSUMPTION, 2000–2005
Year
2003 20052001
ALCOHOL CONSUMPTION Population data (refer to the population 15 years and older and are in litres of pure alcohol).
15
5
10
1961 1966 1976
Litre
s of
pur
e al
coho
l
1991
RECORDED ADULT (15+) PER CAPITA CONSUMPTION, 1961–2005
Year
1971 1981 2001
20
19961986 2006
Change in data source from 2000
Beer Wine Spirits Total
0.3
0.1
0
0
AFRO CPs FINAL.indd 21AFRO CPs FINAL.indd 21 13/01/2011 08:4513/01/2011 08:45
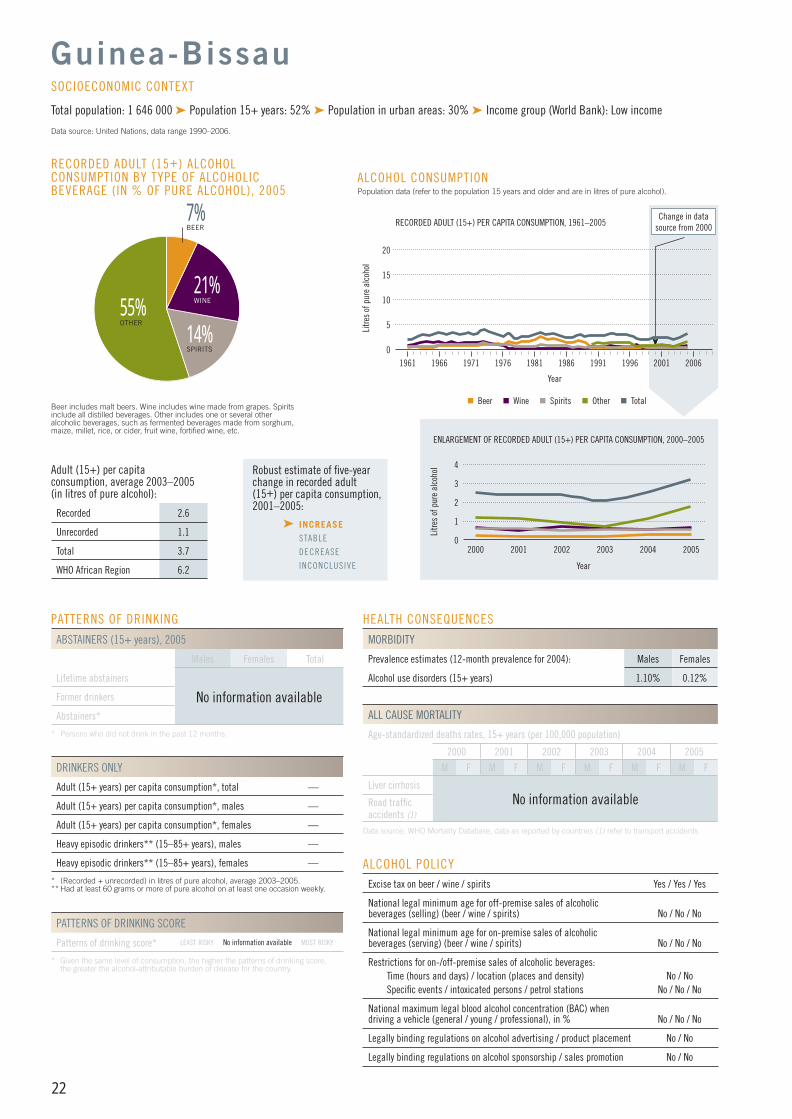
22
PATTERNS OF DRINKING
ABSTAINERS (15+ years), 2005
Males Females Total
Lifetime abstainers
No information availableFormer drinkers
Abstainers*
* Persons who did not drink in the past 12 months.
DRINKERS ONLY
Adult (15+ years) per capita consumption*, total —
Adult (15+ years) per capita consumption*, males —
Adult (15+ years) per capita consumption*, females —
Heavy episodic drinkers** (15–85+ years), males —
Heavy episodic drinkers** (15–85+ years), females —
* (Recorded + unrecorded) in litres of pure alcohol, average 2003–2005.** Had at least 60 grams or more of pure alcohol on at least one occasion weekly.
PATTERNS OF DRINKING SCORE
Patterns of drinking score* LEAST RISKY No information available MOST RISKY
* Given the same level of consumption, the higher the patterns of drinking score, the greater the alcohol-attributable burden of disease for the country.
ALCOHOL POLICYExcise tax on beer / wine / spirits Yes / Yes / Yes
National legal minimum age for off-premise sales of alcoholic beverages (selling) (beer / wine / spirits) No / No / No
National legal minimum age for on-premise sales of alcoholic beverages (serving) (beer / wine / spirits) No / No / No
Restrictions for on-/off-premise sales of alcoholic beverages:Time (hours and days) / location (places and density) No / NoSpecifi c events / intoxicated persons / petrol stations No / No / No
National maximum legal blood alcohol concentration (BAC) when driving a vehicle (general / young / professional), in % No / No / No
Legally binding regulations on alcohol advertising / product placement No / No
Legally binding regulations on alcohol sponsorship / sales promotion No / No
HEALTH CONSEQUENCES
MORBIDITY
Prevalence estimates (12-month prevalence for 2004): Males Females
Alcohol use disorders (15+ years) 1.10% 0.12%
ALL CAUSE MORTALITY
Age-standardized deaths rates, 15+ years (per 100,000 population)
2000 2001 2002 2003 2004 2005
M F M F M F M F M F M F
Liver cirrhosisNo information availableRoad traffi c
accidents (1)
Data source: WHO Mortality Database, data as reported by countries (1) refer to transport accidents.
21%WINE55%
OTHER
14%SPIRITS
RECORDED ADULT (15+) ALCOHOL CONSUMPTION BY TYPE OF ALCOHOLIC BEVERAGE (IN % OF PURE ALCOHOL), 2005
Beer includes malt beers. Wine includes wine made from grapes. Spirits include all distilled beverages. Other includes one or several other alcoholic beverages, such as fermented beverages made from sorghum, maize, millet, rice, or cider, fruit wine, fortifi ed wine, etc.
Adult (15+) per capita consumption, average 2003–2005 (in litres of pure alcohol):
Recorded 2.6
Unrecorded 1.1
Total 3.7
WHO African Region 6.2
Guinea-Bissau
Total population: 1 646 000 ➤ Population 15+ years: 52% ➤ Population in urban areas: 30% ➤ Income group (World Bank): Low income
Data source: United Nations, data range 1990–2006.
SOCIOECONOMIC CONTEXT
Robust estimate of fi ve-year change in recorded adult(15+) per capita consumption,2001–2005:
➤ INCREASE STABLE
DECREASE
INCONCLUSIVE
7%BEER
4
1
2
2000 2002 2004
Litre
s of
pur
e al
coho
lENLARGEMENT OF RECORDED ADULT (15+) PER CAPITA CONSUMPTION, 2000–2005
Year
2003 20052001
ALCOHOL CONSUMPTION Population data (refer to the population 15 years and older and are in litres of pure alcohol).
15
5
10
1961 1966 1976Li
tres
of p
ure
alco
hol
1991
RECORDED ADULT (15+) PER CAPITA CONSUMPTION, 1961–2005
Year
1971 1981 2001
20
19961986 2006
Change in data source from 2000
Beer Wine Spirits Other Total
0
3
0
AFRO CPs FINAL.indd 22AFRO CPs FINAL.indd 22 13/01/2011 08:4513/01/2011 08:45
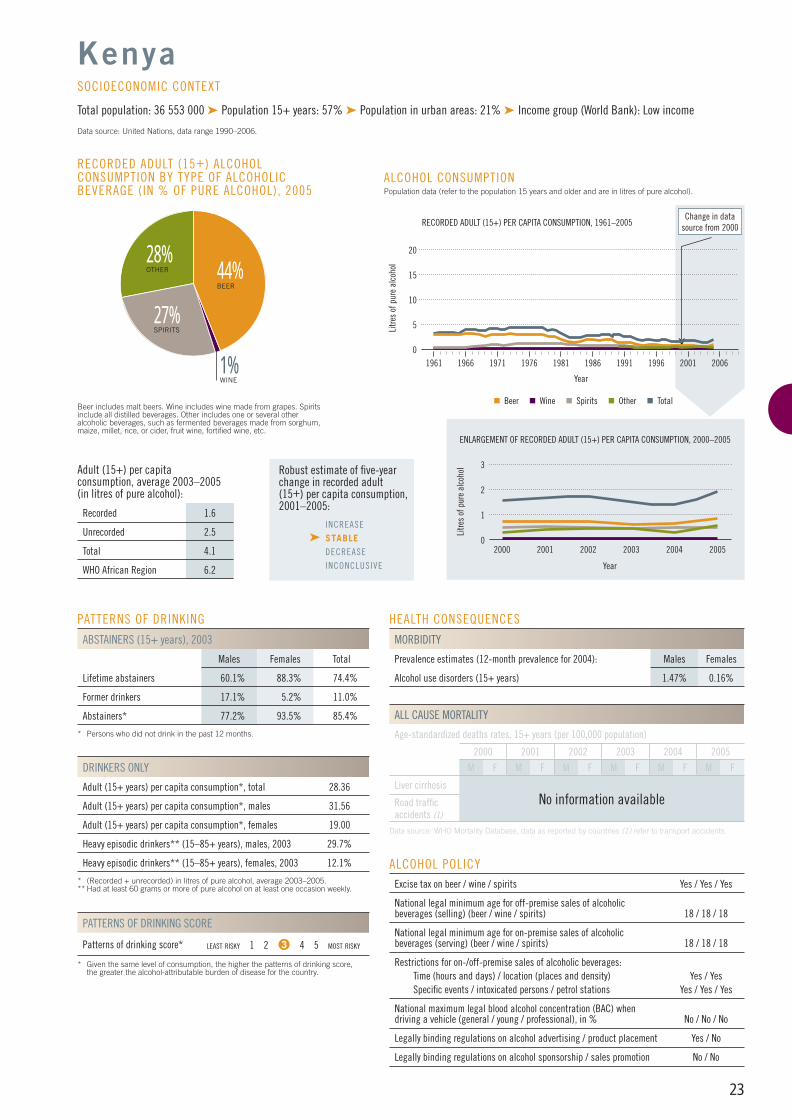
23
PATTERNS OF DRINKING
ABSTAINERS (15+ years), 2003
Males Females Total
Lifetime abstainers 60.1% 88.3% 74.4%
Former drinkers 17.1% 5.2% 11.0%
Abstainers* 77.2% 93.5% 85.4%
* Persons who did not drink in the past 12 months.
DRINKERS ONLY
Adult (15+ years) per capita consumption*, total 28.36
Adult (15+ years) per capita consumption*, males 31.56
Adult (15+ years) per capita consumption*, females 19.00
Heavy episodic drinkers** (15–85+ years), males, 2003 29.7%
Heavy episodic drinkers** (15–85+ years), females, 2003 12.1%
* (Recorded + unrecorded) in litres of pure alcohol, average 2003–2005.** Had at least 60 grams or more of pure alcohol on at least one occasion weekly.
PATTERNS OF DRINKING SCORE
Patterns of drinking score* LEAST RISKY 1 2 3 4 5 MOST RISKY
* Given the same level of consumption, the higher the patterns of drinking score, the greater the alcohol-attributable burden of disease for the country.
ALCOHOL POLICYExcise tax on beer / wine / spirits Yes / Yes / Yes
National legal minimum age for off-premise sales of alcoholic beverages (selling) (beer / wine / spirits) 18 / 18 / 18
National legal minimum age for on-premise sales of alcoholic beverages (serving) (beer / wine / spirits) 18 / 18 / 18
Restrictions for on-/off-premise sales of alcoholic beverages:Time (hours and days) / location (places and density) Yes / YesSpecifi c events / intoxicated persons / petrol stations Yes / Yes / Yes
National maximum legal blood alcohol concentration (BAC) when driving a vehicle (general / young / professional), in % No / No / No
Legally binding regulations on alcohol advertising / product placement Yes / No
Legally binding regulations on alcohol sponsorship / sales promotion No / No
HEALTH CONSEQUENCES
MORBIDITY
Prevalence estimates (12-month prevalence for 2004): Males Females
Alcohol use disorders (15+ years) 1.47% 0.16%
ALL CAUSE MORTALITY
Age-standardized deaths rates, 15+ years (per 100,000 population)
2000 2001 2002 2003 2004 2005
M F M F M F M F M F M F
Liver cirrhosisNo information availableRoad traffi c
accidents (1)
Data source: WHO Mortality Database, data as reported by countries (1) refer to transport accidents.
44%BEER
28%OTHER
27%SPIRITS
RECORDED ADULT (15+) ALCOHOL CONSUMPTION BY TYPE OF ALCOHOLIC BEVERAGE (IN % OF PURE ALCOHOL), 2005
Beer includes malt beers. Wine includes wine made from grapes. Spirits include all distilled beverages. Other includes one or several other alcoholic beverages, such as fermented beverages made from sorghum, maize, millet, rice, or cider, fruit wine, fortifi ed wine, etc.
Adult (15+) per capita consumption, average 2003–2005 (in litres of pure alcohol):
Recorded 1.6
Unrecorded 2.5
Total 4.1
WHO African Region 6.2
Kenya
Total population: 36 553 000 ➤ Population 15+ years: 57% ➤ Population in urban areas: 21% ➤ Income group (World Bank): Low income
Data source: United Nations, data range 1990–2006.
SOCIOECONOMIC CONTEXT
Robust estimate of fi ve-year change in recorded adult(15+) per capita consumption,2001–2005:
INCREASE
➤ STABLE DECREASE
INCONCLUSIVE
1%WINE
3
1
2
2000 2002 2004
Litre
s of
pur
e al
coho
l
ENLARGEMENT OF RECORDED ADULT (15+) PER CAPITA CONSUMPTION, 2000–2005
Year
2003 20052001
ALCOHOL CONSUMPTION Population data (refer to the population 15 years and older and are in litres of pure alcohol).
15
5
10
1961 1966 1976
Litre
s of
pur
e al
coho
l
1991
RECORDED ADULT (15+) PER CAPITA CONSUMPTION, 1961–2005
Year
1971 1981 2001
20
19961986 2006
Change in data source from 2000
Beer Wine Spirits Other Total
0
0
AFRO CPs FINAL.indd 23AFRO CPs FINAL.indd 23 13/01/2011 08:4513/01/2011 08:45
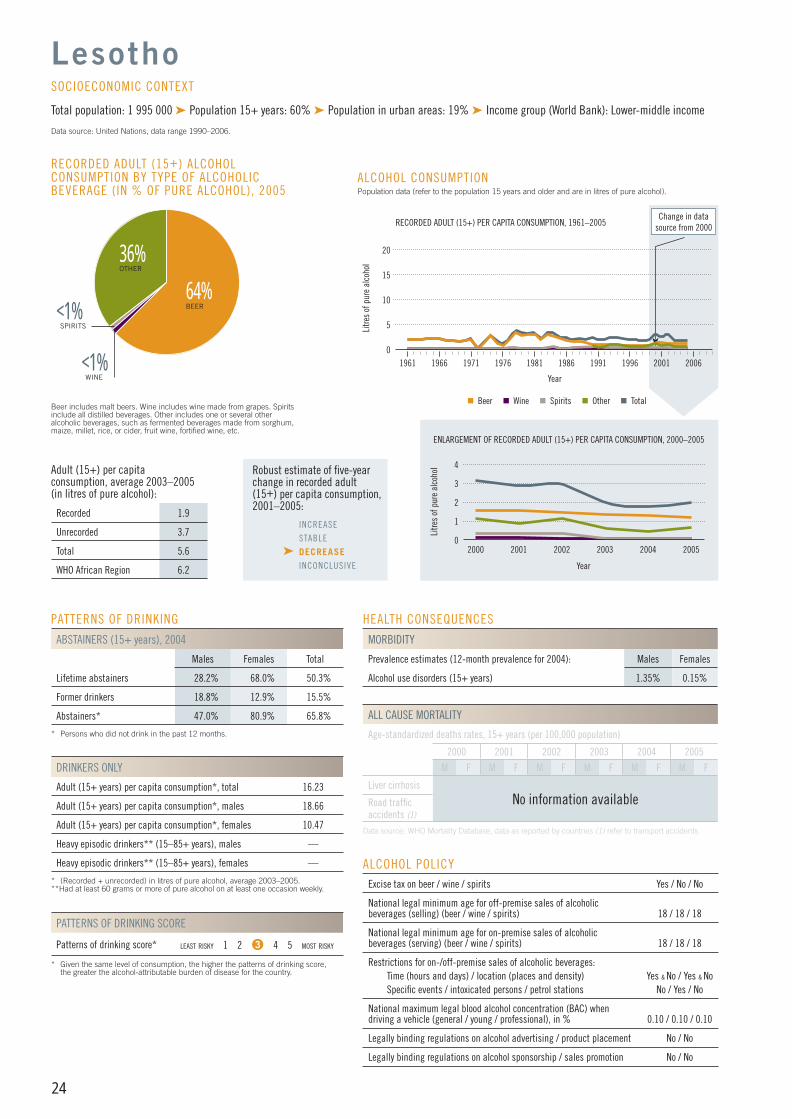
24
PATTERNS OF DRINKING
ABSTAINERS (15+ years), 2004
Males Females Total
Lifetime abstainers 28.2% 68.0% 50.3%
Former drinkers 18.8% 12.9% 15.5%
Abstainers* 47.0% 80.9% 65.8%
* Persons who did not drink in the past 12 months.
DRINKERS ONLY
Adult (15+ years) per capita consumption*, total 16.23
Adult (15+ years) per capita consumption*, males 18.66
Adult (15+ years) per capita consumption*, females 10.47
Heavy episodic drinkers** (15–85+ years), males —
Heavy episodic drinkers** (15–85+ years), females —
* (Recorded + unrecorded) in litres of pure alcohol, average 2003–2005.**Had at least 60 grams or more of pure alcohol on at least one occasion weekly.
PATTERNS OF DRINKING SCORE
Patterns of drinking score* LEAST RISKY 1 2 3 4 5 MOST RISKY
* Given the same level of consumption, the higher the patterns of drinking score, the greater the alcohol-attributable burden of disease for the country.
ALCOHOL POLICYExcise tax on beer / wine / spirits Yes / No / No
National legal minimum age for off-premise sales of alcoholic beverages (selling) (beer / wine / spirits) 18 / 18 / 18
National legal minimum age for on-premise sales of alcoholic beverages (serving) (beer / wine / spirits) 18 / 18 / 18
Restrictions for on-/off-premise sales of alcoholic beverages:Time (hours and days) / location (places and density) Yes & No / Yes & NoSpecifi c events / intoxicated persons / petrol stations No / Yes / No
National maximum legal blood alcohol concentration (BAC) when driving a vehicle (general / young / professional), in % 0.10 / 0.10 / 0.10
Legally binding regulations on alcohol advertising / product placement No / No
Legally binding regulations on alcohol sponsorship / sales promotion No / No
HEALTH CONSEQUENCES
MORBIDITY
Prevalence estimates (12-month prevalence for 2004): Males Females
Alcohol use disorders (15+ years) 1.35% 0.15%
ALL CAUSE MORTALITY
Age-standardized deaths rates, 15+ years (per 100,000 population)
2000 2001 2002 2003 2004 2005
M F M F M F M F M F M F
Liver cirrhosisNo information availableRoad traffi c
accidents (1)
Data source: WHO Mortality Database, data as reported by countries (1) refer to transport accidents.
64%BEER
<1%WINE
RECORDED ADULT (15+) ALCOHOL CONSUMPTION BY TYPE OF ALCOHOLIC BEVERAGE (IN % OF PURE ALCOHOL), 2005
Beer includes malt beers. Wine includes wine made from grapes. Spirits include all distilled beverages. Other includes one or several other alcoholic beverages, such as fermented beverages made from sorghum, maize, millet, rice, or cider, fruit wine, fortifi ed wine, etc.
Adult (15+) per capita consumption, average 2003–2005 (in litres of pure alcohol):
Recorded 1.9
Unrecorded 3.7
Total 5.6
WHO African Region 6.2
Lesotho
Total population: 1 995 000 ➤ Population 15+ years: 60% ➤ Population in urban areas: 19% ➤ Income group (World Bank): Lower-middle income
Data source: United Nations, data range 1990–2006.
SOCIOECONOMIC CONTEXT
Robust estimate of fi ve-year change in recorded adult(15+) per capita consumption,2001–2005:
INCREASE
STABLE
➤ DECREASE INCONCLUSIVE
<1%SPIRITS
36%OTHER
4
2
2000 2002 2004
Litre
s of
pur
e al
coho
lENLARGEMENT OF RECORDED ADULT (15+) PER CAPITA CONSUMPTION, 2000–2005
Year
2003 20052001
ALCOHOL CONSUMPTION Population data (refer to the population 15 years and older and are in litres of pure alcohol).
15
5
10
1961 1966 1976Li
tres
of p
ure
alco
hol
1991
RECORDED ADULT (15+) PER CAPITA CONSUMPTION, 1961–2005
Year
1971 1981 2001
20
19961986 2006
Change in data source from 2000
Beer Wine Spirits Other Total
3
1
0
0
AFRO CPs FINAL.indd 24AFRO CPs FINAL.indd 24 13/01/2011 08:4513/01/2011 08:45
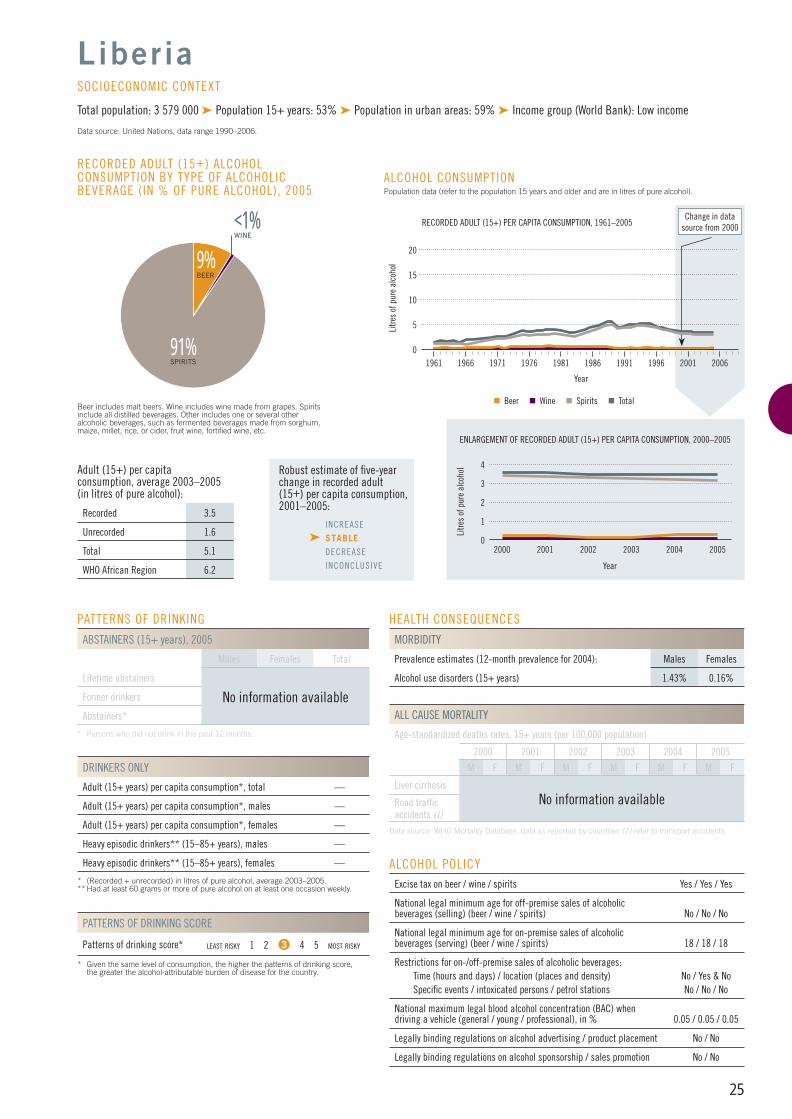
25
PATTERNS OF DRINKING
ABSTAINERS (15+ years), 2005
Males Females Total
Lifetime abstainers
No information availableFormer drinkers
Abstainers*
* Persons who did not drink in the past 12 months.
DRINKERS ONLY
Adult (15+ years) per capita consumption*, total —
Adult (15+ years) per capita consumption*, males —
Adult (15+ years) per capita consumption*, females —
Heavy episodic drinkers** (15–85+ years), males —
Heavy episodic drinkers** (15–85+ years), females —
* (Recorded + unrecorded) in litres of pure alcohol, average 2003–2005.** Had at least 60 grams or more of pure alcohol on at least one occasion weekly.
PATTERNS OF DRINKING SCORE
Patterns of drinking score* LEAST RISKY 1 2 3 4 5 MOST RISKY
* Given the same level of consumption, the higher the patterns of drinking score, the greater the alcohol-attributable burden of disease for the country.
ALCOHOL POLICYExcise tax on beer / wine / spirits Yes / Yes / Yes
National legal minimum age for off-premise sales of alcoholic beverages (selling) (beer / wine / spirits) No / No / No
National legal minimum age for on-premise sales of alcoholic beverages (serving) (beer / wine / spirits) 18 / 18 / 18
Restrictions for on-/off-premise sales of alcoholic beverages:Time (hours and days) / location (places and density) No / Yes & NoSpecifi c events / intoxicated persons / petrol stations No / No / No
National maximum legal blood alcohol concentration (BAC) when driving a vehicle (general / young / professional), in % 0.05 / 0.05 / 0.05
Legally binding regulations on alcohol advertising / product placement No / No
Legally binding regulations on alcohol sponsorship / sales promotion No / No
HEALTH CONSEQUENCES
MORBIDITY
Prevalence estimates (12-month prevalence for 2004): Males Females
Alcohol use disorders (15+ years) 1.43% 0.16%
ALL CAUSE MORTALITY
Age-standardized deaths rates, 15+ years (per 100,000 population)
2000 2001 2002 2003 2004 2005
M F M F M F M F M F M F
Liver cirrhosisNo information availableRoad traffi c
accidents (1)
Data source: WHO Mortality Database, data as reported by countries (1) refer to transport accidents.
9%BEER
91%SPIRITS
RECORDED ADULT (15+) ALCOHOL CONSUMPTION BY TYPE OF ALCOHOLIC BEVERAGE (IN % OF PURE ALCOHOL), 2005
Beer includes malt beers. Wine includes wine made from grapes. Spirits include all distilled beverages. Other includes one or several other alcoholic beverages, such as fermented beverages made from sorghum, maize, millet, rice, or cider, fruit wine, fortifi ed wine, etc.
Adult (15+) per capita consumption, average 2003–2005 (in litres of pure alcohol):
Recorded 3.5
Unrecorded 1.6
Total 5.1
WHO African Region 6.2
Liberia
Total population: 3 579 000 ➤ Population 15+ years: 53% ➤ Population in urban areas: 59% ➤ Income group (World Bank): Low income
Data source: United Nations, data range 1990–2006.
SOCIOECONOMIC CONTEXT
Robust estimate of fi ve-year change in recorded adult(15+) per capita consumption,2001–2005:
INCREASE
➤ STABLE DECREASE
INCONCLUSIVE
<1%WINE
4
1
2
2000 2002 2004
Litre
s of
pur
e al
coho
l
ENLARGEMENT OF RECORDED ADULT (15+) PER CAPITA CONSUMPTION, 2000–2005
Year
2003 20052001
ALCOHOL CONSUMPTION Population data (refer to the population 15 years and older and are in litres of pure alcohol).
15
5
10
1961 1966 1976
Litre
s of
pur
e al
coho
l
1991
RECORDED ADULT (15+) PER CAPITA CONSUMPTION, 1961–2005
Year
1971 1981 2001
20
19961986 2006
Change in data source from 2000
Beer Wine Spirits Total
3
0
0
AFRO CPs FINAL.indd 25AFRO CPs FINAL.indd 25 13/01/2011 08:4513/01/2011 08:45
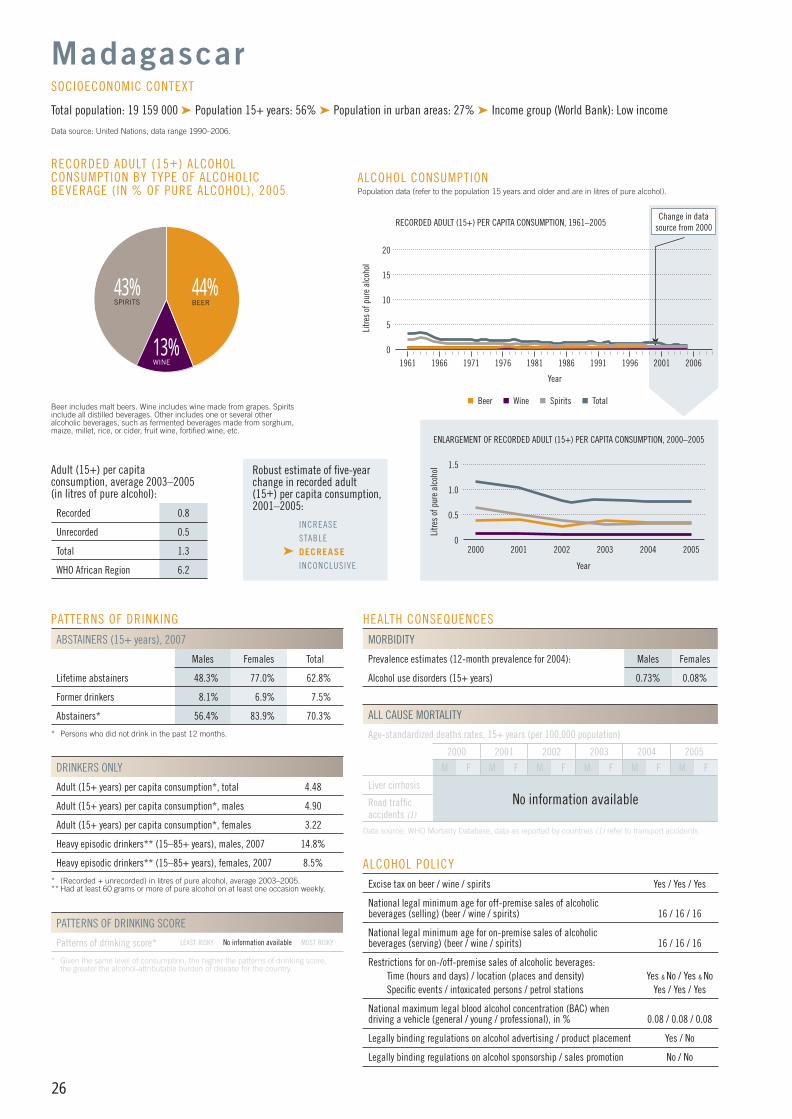
26
PATTERNS OF DRINKING
ABSTAINERS (15+ years), 2007
Males Females Total
Lifetime abstainers 48.3% 77.0% 62.8%
Former drinkers 8.1% 6.9% 7.5%
Abstainers* 56.4% 83.9% 70.3%
* Persons who did not drink in the past 12 months.
DRINKERS ONLY
Adult (15+ years) per capita consumption*, total 4.48
Adult (15+ years) per capita consumption*, males 4.90
Adult (15+ years) per capita consumption*, females 3.22
Heavy episodic drinkers** (15–85+ years), males, 2007 14.8%
Heavy episodic drinkers** (15–85+ years), females, 2007 8.5%
* (Recorded + unrecorded) in litres of pure alcohol, average 2003–2005.** Had at least 60 grams or more of pure alcohol on at least one occasion weekly.
PATTERNS OF DRINKING SCORE
Patterns of drinking score* LEAST RISKY No information available MOST RISKY
* Given the same level of consumption, the higher the patterns of drinking score, the greater the alcohol-attributable burden of disease for the country.
ALCOHOL POLICYExcise tax on beer / wine / spirits Yes / Yes / Yes
National legal minimum age for off-premise sales of alcoholic beverages (selling) (beer / wine / spirits) 16 / 16 / 16
National legal minimum age for on-premise sales of alcoholic beverages (serving) (beer / wine / spirits) 16 / 16 / 16
Restrictions for on-/off-premise sales of alcoholic beverages:Time (hours and days) / location (places and density) Yes & No / Yes & NoSpecifi c events / intoxicated persons / petrol stations Yes / Yes / Yes
National maximum legal blood alcohol concentration (BAC) when driving a vehicle (general / young / professional), in % 0.08 / 0.08 / 0.08
Legally binding regulations on alcohol advertising / product placement Yes / No
Legally binding regulations on alcohol sponsorship / sales promotion No / No
HEALTH CONSEQUENCES
MORBIDITY
Prevalence estimates (12-month prevalence for 2004): Males Females
Alcohol use disorders (15+ years) 0.73% 0.08%
ALL CAUSE MORTALITY
Age-standardized deaths rates, 15+ years (per 100,000 population)
2000 2001 2002 2003 2004 2005
M F M F M F M F M F M F
Liver cirrhosisNo information availableRoad traffi c
accidents (1)
Data source: WHO Mortality Database, data as reported by countries (1) refer to transport accidents.
44%BEER
13%WINE
RECORDED ADULT (15+) ALCOHOL CONSUMPTION BY TYPE OF ALCOHOLIC BEVERAGE (IN % OF PURE ALCOHOL), 2005
Beer includes malt beers. Wine includes wine made from grapes. Spirits include all distilled beverages. Other includes one or several other alcoholic beverages, such as fermented beverages made from sorghum, maize, millet, rice, or cider, fruit wine, fortifi ed wine, etc.
Adult (15+) per capita consumption, average 2003–2005 (in litres of pure alcohol):
Recorded 0.8
Unrecorded 0.5
Total 1.3
WHO African Region 6.2
Madagascar
Total population: 19 159 000 ➤ Population 15+ years: 56% ➤ Population in urban areas: 27% ➤ Income group (World Bank): Low income
Data source: United Nations, data range 1990–2006.
SOCIOECONOMIC CONTEXT
Robust estimate of fi ve-year change in recorded adult(15+) per capita consumption,2001–2005:
INCREASE
STABLE
➤ DECREASE INCONCLUSIVE
43%SPIRITS
1.5
1.0
2000 2002 2004
Litre
s of
pur
e al
coho
lENLARGEMENT OF RECORDED ADULT (15+) PER CAPITA CONSUMPTION, 2000–2005
Year
2003 20052001
ALCOHOL CONSUMPTION Population data (refer to the population 15 years and older and are in litres of pure alcohol).
15
5
10
1961 1966 1976Li
tres
of p
ure
alco
hol
1991
RECORDED ADULT (15+) PER CAPITA CONSUMPTION, 1961–2005
Year
1971 1981 2001
20
19961986 2006
Change in data source from 2000
Beer Wine Spirits Total
0.5
0
0
AFRO CPs FINAL.indd 26AFRO CPs FINAL.indd 26 13/01/2011 08:4513/01/2011 08:45
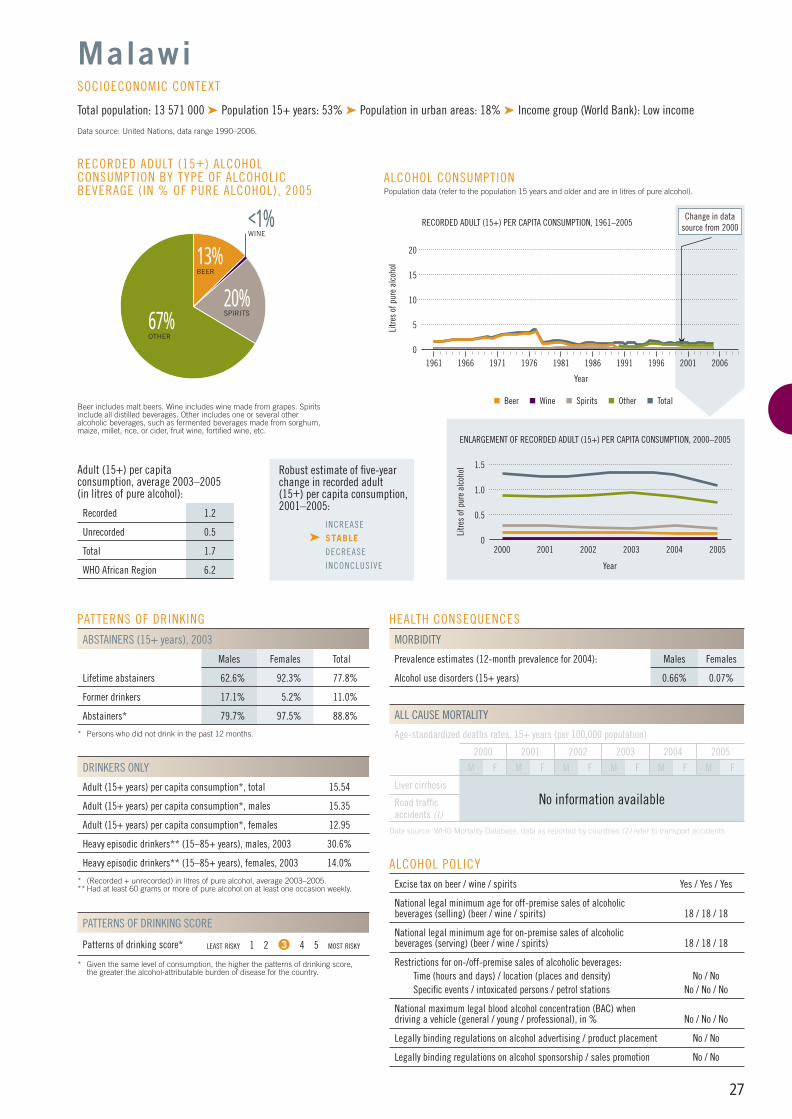
27
PATTERNS OF DRINKING
ABSTAINERS (15+ years), 2003
Males Females Total
Lifetime abstainers 62.6% 92.3% 77.8%
Former drinkers 17.1% 5.2% 11.0%
Abstainers* 79.7% 97.5% 88.8%
* Persons who did not drink in the past 12 months.
DRINKERS ONLY
Adult (15+ years) per capita consumption*, total 15.54
Adult (15+ years) per capita consumption*, males 15.35
Adult (15+ years) per capita consumption*, females 12.95
Heavy episodic drinkers** (15–85+ years), males, 2003 30.6%
Heavy episodic drinkers** (15–85+ years), females, 2003 14.0%
* (Recorded + unrecorded) in litres of pure alcohol, average 2003–2005.** Had at least 60 grams or more of pure alcohol on at least one occasion weekly.
PATTERNS OF DRINKING SCORE
Patterns of drinking score* LEAST RISKY 1 2 3 4 5 MOST RISKY
* Given the same level of consumption, the higher the patterns of drinking score, the greater the alcohol-attributable burden of disease for the country.
ALCOHOL POLICYExcise tax on beer / wine / spirits Yes / Yes / Yes
National legal minimum age for off-premise sales of alcoholic beverages (selling) (beer / wine / spirits) 18 / 18 / 18
National legal minimum age for on-premise sales of alcoholic beverages (serving) (beer / wine / spirits) 18 / 18 / 18
Restrictions for on-/off-premise sales of alcoholic beverages:Time (hours and days) / location (places and density) No / NoSpecifi c events / intoxicated persons / petrol stations No / No / No
National maximum legal blood alcohol concentration (BAC) when driving a vehicle (general / young / professional), in % No / No / No
Legally binding regulations on alcohol advertising / product placement No / No
Legally binding regulations on alcohol sponsorship / sales promotion No / No
HEALTH CONSEQUENCES
MORBIDITY
Prevalence estimates (12-month prevalence for 2004): Males Females
Alcohol use disorders (15+ years) 0.66% 0.07%
ALL CAUSE MORTALITY
Age-standardized deaths rates, 15+ years (per 100,000 population)
2000 2001 2002 2003 2004 2005
M F M F M F M F M F M F
Liver cirrhosisNo information availableRoad traffi c
accidents (1)
Data source: WHO Mortality Database, data as reported by countries (1) refer to transport accidents.
13%BEER
67%OTHER
20%SPIRITS
RECORDED ADULT (15+) ALCOHOL CONSUMPTION BY TYPE OF ALCOHOLIC BEVERAGE (IN % OF PURE ALCOHOL), 2005
Beer includes malt beers. Wine includes wine made from grapes. Spirits include all distilled beverages. Other includes one or several other alcoholic beverages, such as fermented beverages made from sorghum, maize, millet, rice, or cider, fruit wine, fortifi ed wine, etc.
Adult (15+) per capita consumption, average 2003–2005 (in litres of pure alcohol):
Recorded 1.2
Unrecorded 0.5
Total 1.7
WHO African Region 6.2
Malawi
Total population: 13 571 000 ➤ Population 15+ years: 53% ➤ Population in urban areas: 18% ➤ Income group (World Bank): Low income
Data source: United Nations, data range 1990–2006.
SOCIOECONOMIC CONTEXT
Robust estimate of fi ve-year change in recorded adult(15+) per capita consumption,2001–2005:
INCREASE
➤ STABLE DECREASE
INCONCLUSIVE
<1%WINE
1.5
0.5
1.0
2000 2002 2004
Litre
s of
pur
e al
coho
l
ENLARGEMENT OF RECORDED ADULT (15+) PER CAPITA CONSUMPTION, 2000–2005
Year
2003 20052001
ALCOHOL CONSUMPTION Population data (refer to the population 15 years and older and are in litres of pure alcohol).
15
5
10
1961 1966 1976
Litre
s of
pur
e al
coho
l
1991
RECORDED ADULT (15+) PER CAPITA CONSUMPTION, 1961–2005
Year
1971 1981 2001
20
19961986 2006
Change in data source from 2000
Beer Wine Spirits Other Total
0
0
AFRO CPs FINAL.indd 27AFRO CPs FINAL.indd 27 13/01/2011 08:4513/01/2011 08:45
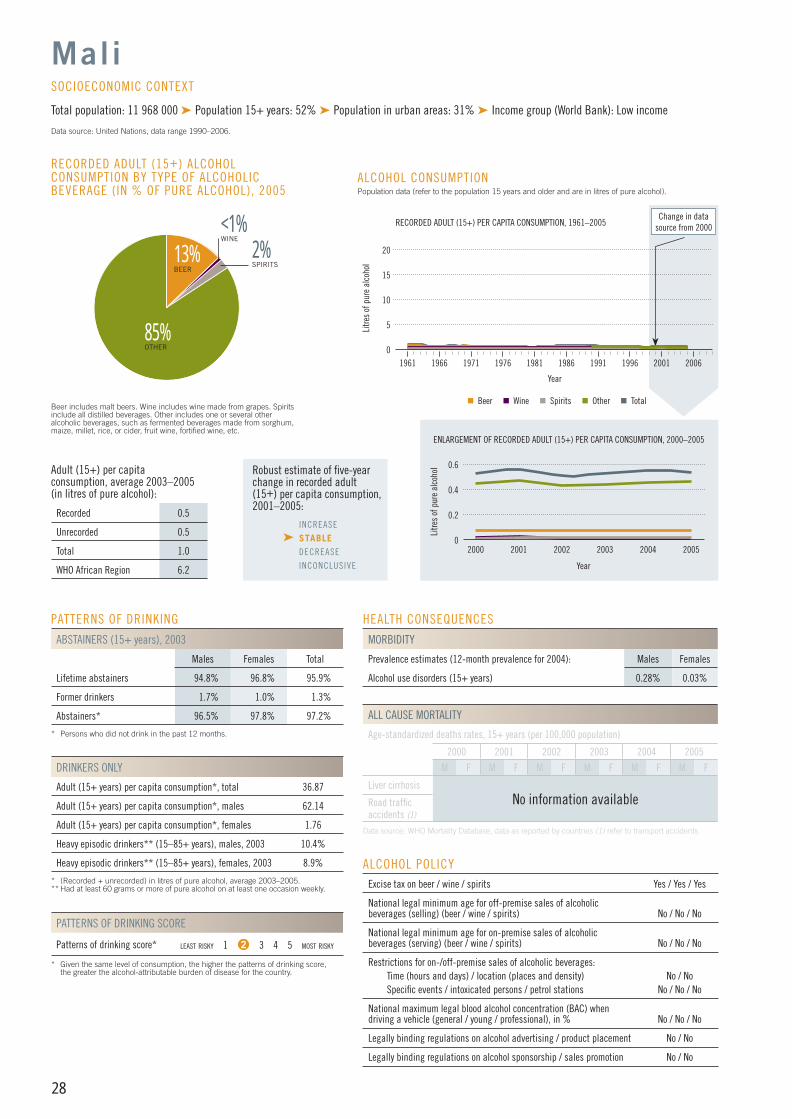
28
PATTERNS OF DRINKING
ABSTAINERS (15+ years), 2003
Males Females Total
Lifetime abstainers 94.8% 96.8% 95.9%
Former drinkers 1.7% 1.0% 1.3%
Abstainers* 96.5% 97.8% 97.2%
* Persons who did not drink in the past 12 months.
DRINKERS ONLY
Adult (15+ years) per capita consumption*, total 36.87
Adult (15+ years) per capita consumption*, males 62.14
Adult (15+ years) per capita consumption*, females 1.76
Heavy episodic drinkers** (15–85+ years), males, 2003 10.4%
Heavy episodic drinkers** (15–85+ years), females, 2003 8.9%
* (Recorded + unrecorded) in litres of pure alcohol, average 2003–2005.** Had at least 60 grams or more of pure alcohol on at least one occasion weekly.
PATTERNS OF DRINKING SCORE
Patterns of drinking score* LEAST RISKY 1 2 3 4 5 MOST RISKY
* Given the same level of consumption, the higher the patterns of drinking score, the greater the alcohol-attributable burden of disease for the country.
ALCOHOL POLICYExcise tax on beer / wine / spirits Yes / Yes / Yes
National legal minimum age for off-premise sales of alcoholic beverages (selling) (beer / wine / spirits) No / No / No
National legal minimum age for on-premise sales of alcoholic beverages (serving) (beer / wine / spirits) No / No / No
Restrictions for on-/off-premise sales of alcoholic beverages:Time (hours and days) / location (places and density) No / NoSpecifi c events / intoxicated persons / petrol stations No / No / No
National maximum legal blood alcohol concentration (BAC) when driving a vehicle (general / young / professional), in % No / No / No
Legally binding regulations on alcohol advertising / product placement No / No
Legally binding regulations on alcohol sponsorship / sales promotion No / No
HEALTH CONSEQUENCES
MORBIDITY
Prevalence estimates (12-month prevalence for 2004): Males Females
Alcohol use disorders (15+ years) 0.28% 0.03%
ALL CAUSE MORTALITY
Age-standardized deaths rates, 15+ years (per 100,000 population)
2000 2001 2002 2003 2004 2005
M F M F M F M F M F M F
Liver cirrhosisNo information availableRoad traffi c
accidents (1)
Data source: WHO Mortality Database, data as reported by countries (1) refer to transport accidents.
13%BEER
<1%WINE
RECORDED ADULT (15+) ALCOHOL CONSUMPTION BY TYPE OF ALCOHOLIC BEVERAGE (IN % OF PURE ALCOHOL), 2005
Beer includes malt beers. Wine includes wine made from grapes. Spirits include all distilled beverages. Other includes one or several other alcoholic beverages, such as fermented beverages made from sorghum, maize, millet, rice, or cider, fruit wine, fortifi ed wine, etc.
Adult (15+) per capita consumption, average 2003–2005 (in litres of pure alcohol):
Recorded 0.5
Unrecorded 0.5
Total 1.0
WHO African Region 6.2
Mali
Total population: 11 968 000 ➤ Population 15+ years: 52% ➤ Population in urban areas: 31% ➤ Income group (World Bank): Low income
Data source: United Nations, data range 1990–2006.
SOCIOECONOMIC CONTEXT
Robust estimate of fi ve-year change in recorded adult(15+) per capita consumption,2001–2005:
INCREASE
➤ STABLE DECREASE
INCONCLUSIVE
2%SPIRITS
85%OTHER
0.6
2000 2002 2004
Litre
s of
pur
e al
coho
lENLARGEMENT OF RECORDED ADULT (15+) PER CAPITA CONSUMPTION, 2000–2005
Year
2003 20052001
ALCOHOL CONSUMPTION Population data (refer to the population 15 years and older and are in litres of pure alcohol).
15
5
10
1961 1966 1976Li
tres
of p
ure
alco
hol
1991
RECORDED ADULT (15+) PER CAPITA CONSUMPTION, 1961–2005
Year
1971 1981 2001
20
19961986 2006
Change in data source from 2000
Beer Wine Spirits Other Total
0.4
0.2
0
0
AFRO CPs FINAL.indd 28AFRO CPs FINAL.indd 28 13/01/2011 08:4513/01/2011 08:45
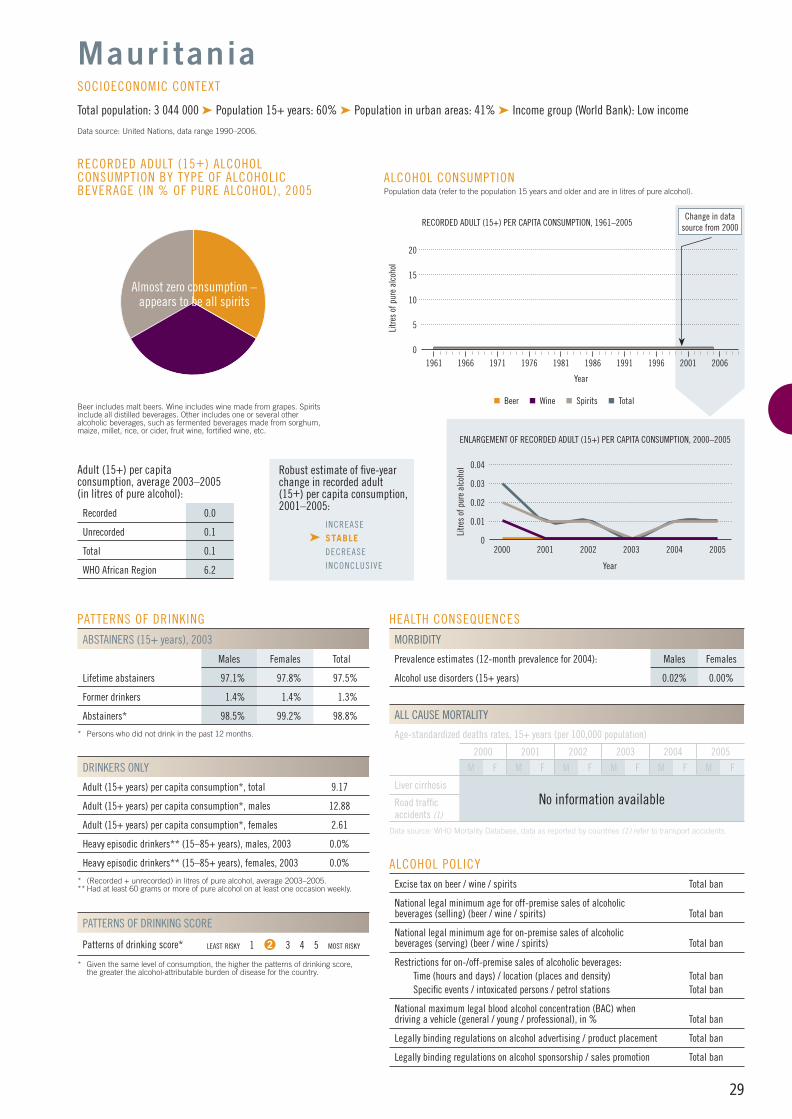
29
PATTERNS OF DRINKING
ABSTAINERS (15+ years), 2003
Males Females Total
Lifetime abstainers 97.1% 97.8% 97.5%
Former drinkers 1.4% 1.4% 1.3%
Abstainers* 98.5% 99.2% 98.8%
* Persons who did not drink in the past 12 months.
DRINKERS ONLY
Adult (15+ years) per capita consumption*, total 9.17
Adult (15+ years) per capita consumption*, males 12.88
Adult (15+ years) per capita consumption*, females 2.61
Heavy episodic drinkers** (15–85+ years), males, 2003 0.0%
Heavy episodic drinkers** (15–85+ years), females, 2003 0.0%
* (Recorded + unrecorded) in litres of pure alcohol, average 2003–2005.** Had at least 60 grams or more of pure alcohol on at least one occasion weekly.
PATTERNS OF DRINKING SCORE
Patterns of drinking score* LEAST RISKY 1 2 3 4 5 MOST RISKY
* Given the same level of consumption, the higher the patterns of drinking score, the greater the alcohol-attributable burden of disease for the country.
ALCOHOL POLICYExcise tax on beer / wine / spirits Total ban
National legal minimum age for off-premise sales of alcoholic beverages (selling) (beer / wine / spirits) Total ban
National legal minimum age for on-premise sales of alcoholic beverages (serving) (beer / wine / spirits) Total ban
Restrictions for on-/off-premise sales of alcoholic beverages:Time (hours and days) / location (places and density) Total banSpecifi c events / intoxicated persons / petrol stations Total ban
National maximum legal blood alcohol concentration (BAC) when driving a vehicle (general / young / professional), in % Total ban
Legally binding regulations on alcohol advertising / product placement Total ban
Legally binding regulations on alcohol sponsorship / sales promotion Total ban
HEALTH CONSEQUENCES
MORBIDITY
Prevalence estimates (12-month prevalence for 2004): Males Females
Alcohol use disorders (15+ years) 0.02% 0.00%
ALL CAUSE MORTALITY
Age-standardized deaths rates, 15+ years (per 100,000 population)
2000 2001 2002 2003 2004 2005
M F M F M F M F M F M F
Liver cirrhosisNo information availableRoad traffi c
accidents (1)
Data source: WHO Mortality Database, data as reported by countries (1) refer to transport accidents.
RECORDED ADULT (15+) ALCOHOL CONSUMPTION BY TYPE OF ALCOHOLIC BEVERAGE (IN % OF PURE ALCOHOL), 2005
Beer includes malt beers. Wine includes wine made from grapes. Spirits include all distilled beverages. Other includes one or several other alcoholic beverages, such as fermented beverages made from sorghum, maize, millet, rice, or cider, fruit wine, fortifi ed wine, etc.
Adult (15+) per capita consumption, average 2003–2005 (in litres of pure alcohol):
Recorded 0.0
Unrecorded 0.1
Total 0.1
WHO African Region 6.2
Mauritania
Total population: 3 044 000 ➤ Population 15+ years: 60% ➤ Population in urban areas: 41% ➤ Income group (World Bank): Low income
Data source: United Nations, data range 1990–2006.
SOCIOECONOMIC CONTEXT
Robust estimate of fi ve-year change in recorded adult(15+) per capita consumption,2001–2005:
INCREASE
➤ STABLE DECREASE
INCONCLUSIVE
0.04
0.01
0.02
2000 2002 2004
Litre
s of
pur
e al
coho
l
ENLARGEMENT OF RECORDED ADULT (15+) PER CAPITA CONSUMPTION, 2000–2005
Year
2003 20052001
ALCOHOL CONSUMPTION Population data (refer to the population 15 years and older and are in litres of pure alcohol).
15
5
10
1961 1966 1976
Litre
s of
pur
e al
coho
l
1991
RECORDED ADULT (15+) PER CAPITA CONSUMPTION, 1961–2005
Year
1971 1981 2001
20
19961986 2006
Change in data source from 2000
Beer Wine Spirits Total
0.03
0
0
Almost zero consumption – appears to be all spirits
AFRO CPs FINAL.indd 29AFRO CPs FINAL.indd 29 13/01/2011 08:4513/01/2011 08:45
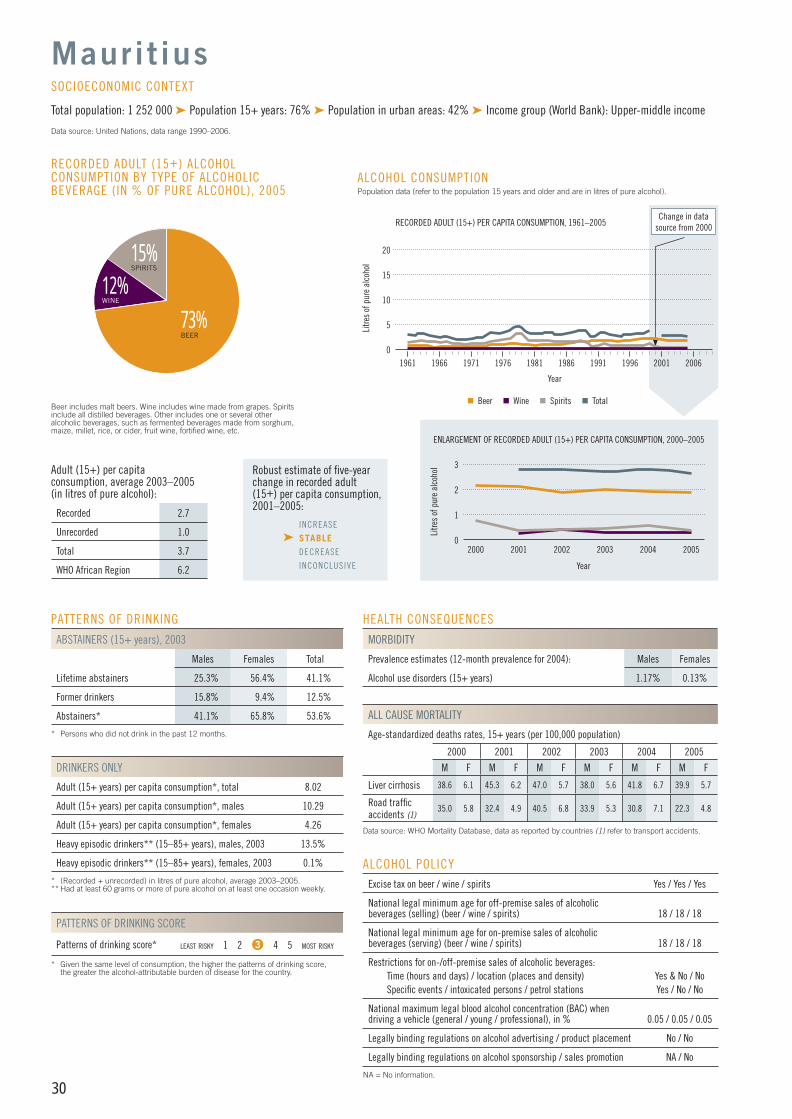
30
PATTERNS OF DRINKING
ABSTAINERS (15+ years), 2003
Males Females Total
Lifetime abstainers 25.3% 56.4% 41.1%
Former drinkers 15.8% 9.4% 12.5%
Abstainers* 41.1% 65.8% 53.6%
* Persons who did not drink in the past 12 months.
DRINKERS ONLY
Adult (15+ years) per capita consumption*, total 8.02
Adult (15+ years) per capita consumption*, males 10.29
Adult (15+ years) per capita consumption*, females 4.26
Heavy episodic drinkers** (15–85+ years), males, 2003 13.5%
Heavy episodic drinkers** (15–85+ years), females, 2003 0.1%
* (Recorded + unrecorded) in litres of pure alcohol, average 2003–2005.** Had at least 60 grams or more of pure alcohol on at least one occasion weekly.
PATTERNS OF DRINKING SCORE
Patterns of drinking score* LEAST RISKY 1 2 3 4 5 MOST RISKY
* Given the same level of consumption, the higher the patterns of drinking score, the greater the alcohol-attributable burden of disease for the country.
ALCOHOL POLICYExcise tax on beer / wine / spirits Yes / Yes / Yes
National legal minimum age for off-premise sales of alcoholic beverages (selling) (beer / wine / spirits) 18 / 18 / 18
National legal minimum age for on-premise sales of alcoholic beverages (serving) (beer / wine / spirits) 18 / 18 / 18
Restrictions for on-/off-premise sales of alcoholic beverages:Time (hours and days) / location (places and density) Yes & No / NoSpecifi c events / intoxicated persons / petrol stations Yes / No / No
National maximum legal blood alcohol concentration (BAC) when driving a vehicle (general / young / professional), in % 0.05 / 0.05 / 0.05
Legally binding regulations on alcohol advertising / product placement No / No
Legally binding regulations on alcohol sponsorship / sales promotion NA / No
NA = No information.
HEALTH CONSEQUENCES
MORBIDITY
Prevalence estimates (12-month prevalence for 2004): Males Females
Alcohol use disorders (15+ years) 1.17% 0.13%
ALL CAUSE MORTALITY
Age-standardized deaths rates, 15+ years (per 100,000 population)
2000 2001 2002 2003 2004 2005
M F M F M F M F M F M F
Liver cirrhosis 38.6 6.1 45.3 6.2 47.0 5.7 38.0 5.6 41.8 6.7 39.9 5.7
Road traffi c accidents (1)
35.0 5.8 32.4 4.9 40.5 6.8 33.9 5.3 30.8 7.1 22.3 4.8
Data source: WHO Mortality Database, data as reported by countries (1) refer to transport accidents.
73%BEER
12%WINE
RECORDED ADULT (15+) ALCOHOL CONSUMPTION BY TYPE OF ALCOHOLIC BEVERAGE (IN % OF PURE ALCOHOL), 2005
Beer includes malt beers. Wine includes wine made from grapes. Spirits include all distilled beverages. Other includes one or several other alcoholic beverages, such as fermented beverages made from sorghum, maize, millet, rice, or cider, fruit wine, fortifi ed wine, etc.
Adult (15+) per capita consumption, average 2003–2005 (in litres of pure alcohol):
Recorded 2.7
Unrecorded 1.0
Total 3.7
WHO African Region 6.2
Maurit ius
Total population: 1 252 000 ➤ Population 15+ years: 76% ➤ Population in urban areas: 42% ➤ Income group (World Bank): Upper-middle income
Data source: United Nations, data range 1990–2006.
SOCIOECONOMIC CONTEXT
Robust estimate of fi ve-year change in recorded adult(15+) per capita consumption,2001–2005:
INCREASE
➤ STABLE DECREASE
INCONCLUSIVE
15%SPIRITS
3
2000 2002 2004
Litre
s of
pur
e al
coho
lENLARGEMENT OF RECORDED ADULT (15+) PER CAPITA CONSUMPTION, 2000–2005
Year
2003 20052001
ALCOHOL CONSUMPTION Population data (refer to the population 15 years and older and are in litres of pure alcohol).
15
5
10
1961 1966 1976Li
tres
of p
ure
alco
hol
1991
RECORDED ADULT (15+) PER CAPITA CONSUMPTION, 1961–2005
Year
1971 1981 2001
20
19961986 2006
Change in data source from 2000
Beer Wine Spirits Total
2
1
0
0
AFRO CPs FINAL.indd 30AFRO CPs FINAL.indd 30 13/01/2011 08:4513/01/2011 08:45
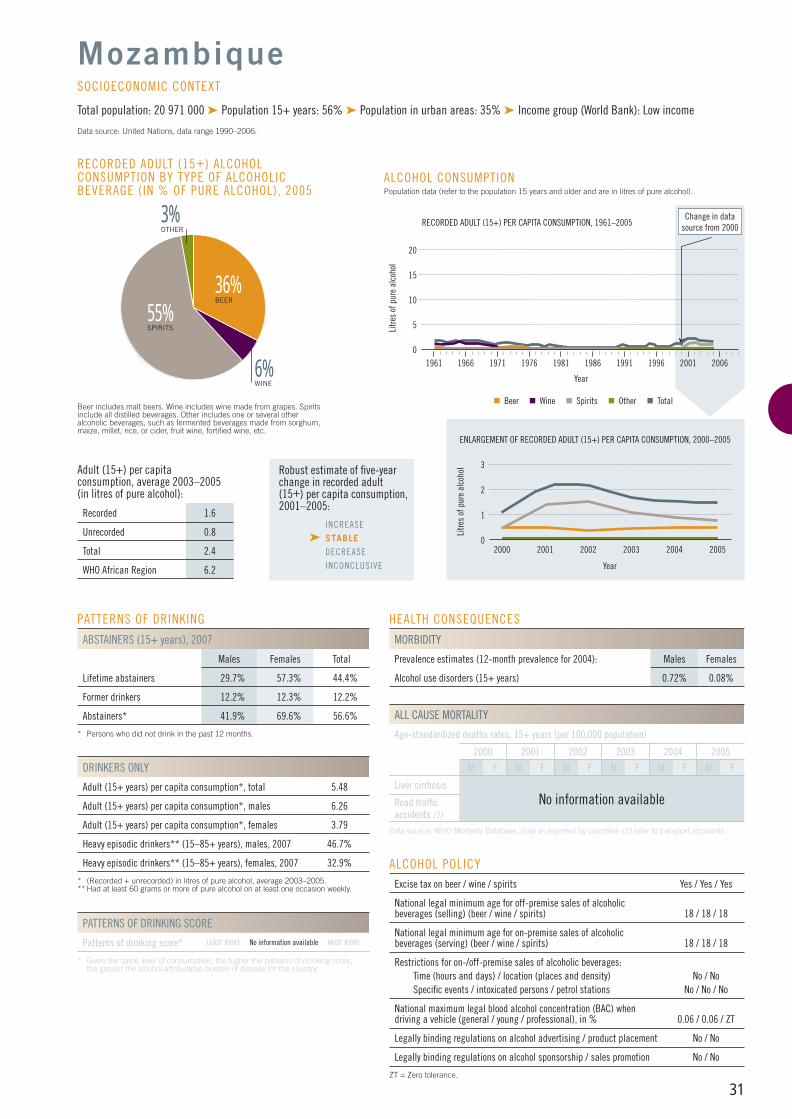
31
PATTERNS OF DRINKING
ABSTAINERS (15+ years), 2007
Males Females Total
Lifetime abstainers 29.7% 57.3% 44.4%
Former drinkers 12.2% 12.3% 12.2%
Abstainers* 41.9% 69.6% 56.6%
* Persons who did not drink in the past 12 months.
DRINKERS ONLY
Adult (15+ years) per capita consumption*, total 5.48
Adult (15+ years) per capita consumption*, males 6.26
Adult (15+ years) per capita consumption*, females 3.79
Heavy episodic drinkers** (15–85+ years), males, 2007 46.7%
Heavy episodic drinkers** (15–85+ years), females, 2007 32.9%
* (Recorded + unrecorded) in litres of pure alcohol, average 2003–2005.** Had at least 60 grams or more of pure alcohol on at least one occasion weekly.
PATTERNS OF DRINKING SCORE
Patterns of drinking score* LEAST RISKY No information available MOST RISKY
* Given the same level of consumption, the higher the patterns of drinking score, the greater the alcohol-attributable burden of disease for the country.
ALCOHOL POLICYExcise tax on beer / wine / spirits Yes / Yes / Yes
National legal minimum age for off-premise sales of alcoholic beverages (selling) (beer / wine / spirits) 18 / 18 / 18
National legal minimum age for on-premise sales of alcoholic beverages (serving) (beer / wine / spirits) 18 / 18 / 18
Restrictions for on-/off-premise sales of alcoholic beverages:Time (hours and days) / location (places and density) No / NoSpecifi c events / intoxicated persons / petrol stations No / No / No
National maximum legal blood alcohol concentration (BAC) when driving a vehicle (general / young / professional), in % 0.06 / 0.06 / ZT
Legally binding regulations on alcohol advertising / product placement No / No
Legally binding regulations on alcohol sponsorship / sales promotion No / No
ZT = Zero tolerance.
HEALTH CONSEQUENCES
MORBIDITY
Prevalence estimates (12-month prevalence for 2004): Males Females
Alcohol use disorders (15+ years) 0.72% 0.08%
ALL CAUSE MORTALITY
Age-standardized deaths rates, 15+ years (per 100,000 population)
2000 2001 2002 2003 2004 2005
M F M F M F M F M F M F
Liver cirrhosisNo information availableRoad traffi c
accidents (1)
Data source: WHO Mortality Database, data as reported by countries (1) refer to transport accidents.
36%BEER
3%OTHER
55%SPIRITS
RECORDED ADULT (15+) ALCOHOL CONSUMPTION BY TYPE OF ALCOHOLIC BEVERAGE (IN % OF PURE ALCOHOL), 2005
Beer includes malt beers. Wine includes wine made from grapes. Spirits include all distilled beverages. Other includes one or several other alcoholic beverages, such as fermented beverages made from sorghum, maize, millet, rice, or cider, fruit wine, fortifi ed wine, etc.
Adult (15+) per capita consumption, average 2003–2005 (in litres of pure alcohol):
Recorded 1.6
Unrecorded 0.8
Total 2.4
WHO African Region 6.2
Mozambique
Total population: 20 971 000 ➤ Population 15+ years: 56% ➤ Population in urban areas: 35% ➤ Income group (World Bank): Low income
Data source: United Nations, data range 1990–2006.
SOCIOECONOMIC CONTEXT
Robust estimate of fi ve-year change in recorded adult(15+) per capita consumption,2001–2005:
INCREASE
➤ STABLE DECREASE
INCONCLUSIVE
6%WINE
3
1
2
2000 2002 2004
Litre
s of
pur
e al
coho
l
ENLARGEMENT OF RECORDED ADULT (15+) PER CAPITA CONSUMPTION, 2000–2005
Year
2003 20052001
ALCOHOL CONSUMPTION Population data (refer to the population 15 years and older and are in litres of pure alcohol).
15
5
10
1961 1966 1976
Litre
s of
pur
e al
coho
l
1991
RECORDED ADULT (15+) PER CAPITA CONSUMPTION, 1961–2005
Year
1971 1981 2001
20
19961986 2006
Change in data source from 2000
Beer Wine Spirits Other Total
0
0
AFRO CPs FINAL.indd 31AFRO CPs FINAL.indd 31 13/01/2011 08:4513/01/2011 08:45
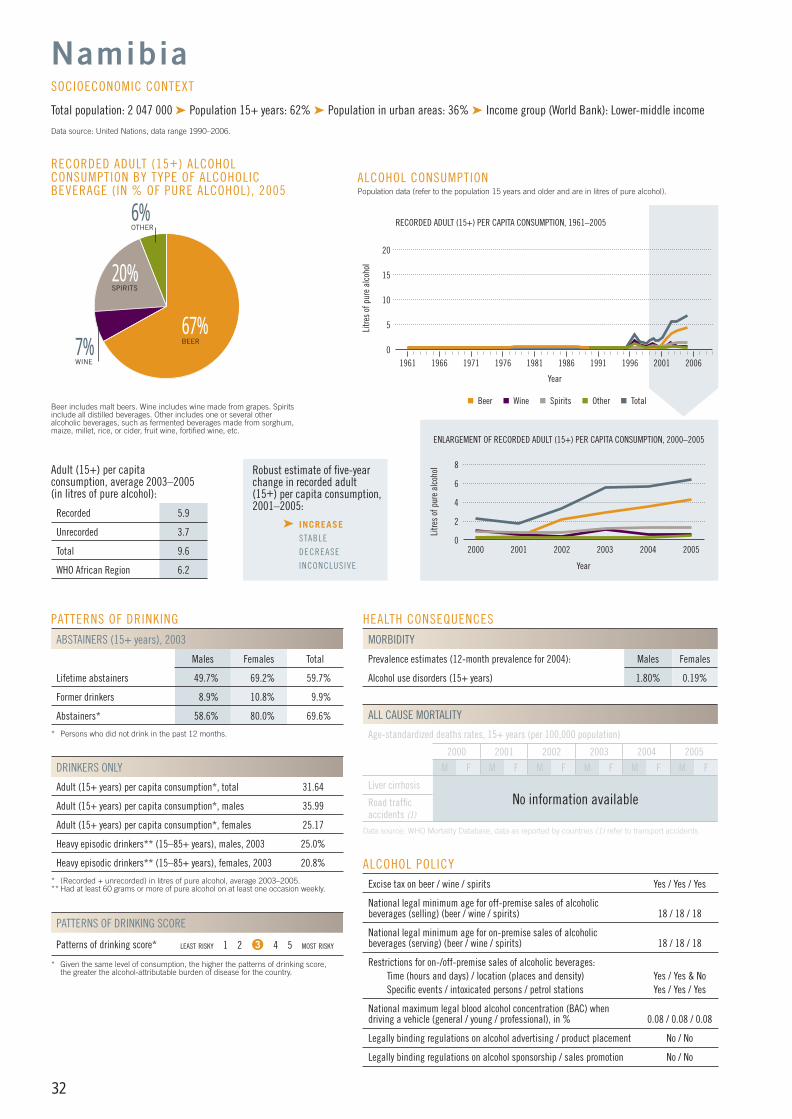
32
PATTERNS OF DRINKING
ABSTAINERS (15+ years), 2003
Males Females Total
Lifetime abstainers 49.7% 69.2% 59.7%
Former drinkers 8.9% 10.8% 9.9%
Abstainers* 58.6% 80.0% 69.6%
* Persons who did not drink in the past 12 months.
DRINKERS ONLY
Adult (15+ years) per capita consumption*, total 31.64
Adult (15+ years) per capita consumption*, males 35.99
Adult (15+ years) per capita consumption*, females 25.17
Heavy episodic drinkers** (15–85+ years), males, 2003 25.0%
Heavy episodic drinkers** (15–85+ years), females, 2003 20.8%
* (Recorded + unrecorded) in litres of pure alcohol, average 2003–2005.** Had at least 60 grams or more of pure alcohol on at least one occasion weekly.
PATTERNS OF DRINKING SCORE
Patterns of drinking score* LEAST RISKY 1 2 3 4 5 MOST RISKY
* Given the same level of consumption, the higher the patterns of drinking score, the greater the alcohol-attributable burden of disease for the country.
ALCOHOL POLICYExcise tax on beer / wine / spirits Yes / Yes / Yes
National legal minimum age for off-premise sales of alcoholic beverages (selling) (beer / wine / spirits) 18 / 18 / 18
National legal minimum age for on-premise sales of alcoholic beverages (serving) (beer / wine / spirits) 18 / 18 / 18
Restrictions for on-/off-premise sales of alcoholic beverages:Time (hours and days) / location (places and density) Yes / Yes & NoSpecifi c events / intoxicated persons / petrol stations Yes / Yes / Yes
National maximum legal blood alcohol concentration (BAC) when driving a vehicle (general / young / professional), in % 0.08 / 0.08 / 0.08
Legally binding regulations on alcohol advertising / product placement No / No
Legally binding regulations on alcohol sponsorship / sales promotion No / No
HEALTH CONSEQUENCES
MORBIDITY
Prevalence estimates (12-month prevalence for 2004): Males Females
Alcohol use disorders (15+ years) 1.80% 0.19%
ALL CAUSE MORTALITY
Age-standardized deaths rates, 15+ years (per 100,000 population)
2000 2001 2002 2003 2004 2005
M F M F M F M F M F M F
Liver cirrhosisNo information availableRoad traffi c
accidents (1)
Data source: WHO Mortality Database, data as reported by countries (1) refer to transport accidents.
67%BEER7%
WINE
RECORDED ADULT (15+) ALCOHOL CONSUMPTION BY TYPE OF ALCOHOLIC BEVERAGE (IN % OF PURE ALCOHOL), 2005
Beer includes malt beers. Wine includes wine made from grapes. Spirits include all distilled beverages. Other includes one or several other alcoholic beverages, such as fermented beverages made from sorghum, maize, millet, rice, or cider, fruit wine, fortifi ed wine, etc.
Adult (15+) per capita consumption, average 2003–2005 (in litres of pure alcohol):
Recorded 5.9
Unrecorded 3.7
Total 9.6
WHO African Region 6.2
Namibia
Total population: 2 047 000 ➤ Population 15+ years: 62% ➤ Population in urban areas: 36% ➤ Income group (World Bank): Lower-middle income
Data source: United Nations, data range 1990–2006.
SOCIOECONOMIC CONTEXT
Robust estimate of fi ve-year change in recorded adult(15+) per capita consumption,2001–2005:
➤ INCREASE STABLE
DECREASE
INCONCLUSIVE
20%SPIRITS
6%OTHER
8
2000 2002 2004
Litre
s of
pur
e al
coho
lENLARGEMENT OF RECORDED ADULT (15+) PER CAPITA CONSUMPTION, 2000–2005
Year
2003 20052001
ALCOHOL CONSUMPTION Population data (refer to the population 15 years and older and are in litres of pure alcohol).
15
5
10
1961 1966 1976Li
tres
of p
ure
alco
hol
1991
RECORDED ADULT (15+) PER CAPITA CONSUMPTION, 1961–2005
Year
1971 1981 2001
20
19961986 2006
Beer Wine Spirits Other Total
4
2
6
0
0
AFRO CPs FINAL.indd 32AFRO CPs FINAL.indd 32 13/01/2011 08:4513/01/2011 08:45
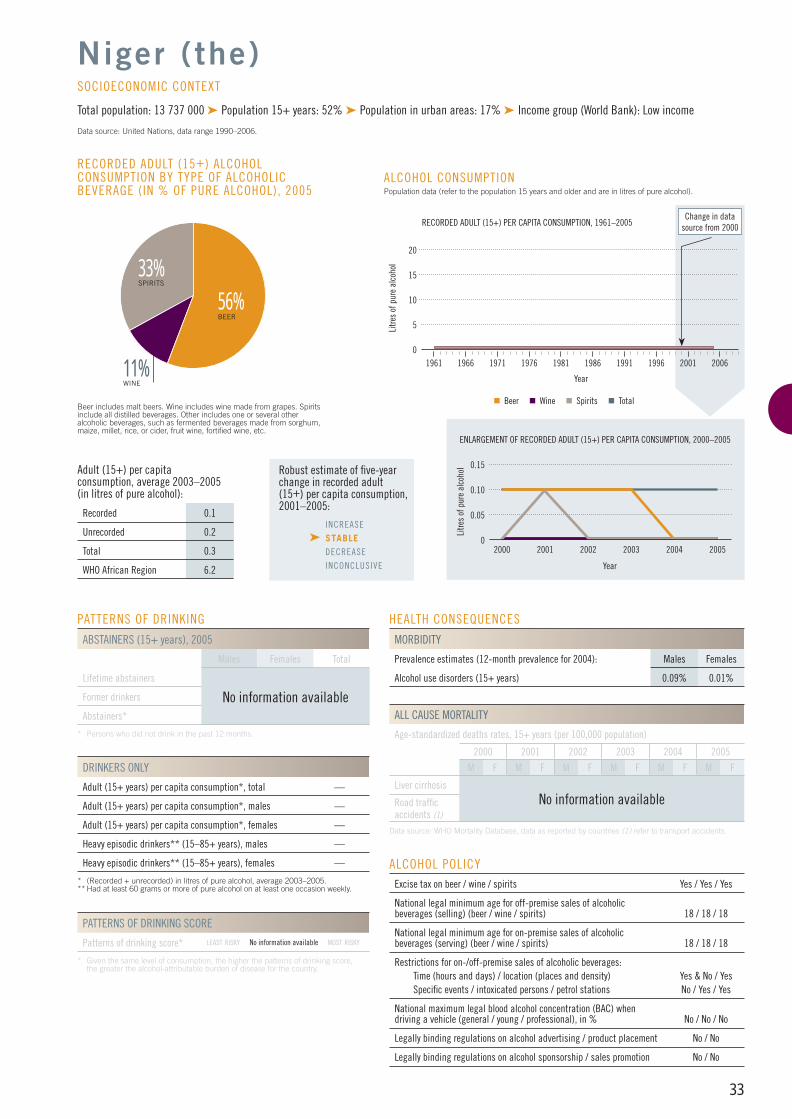
33
PATTERNS OF DRINKING
ABSTAINERS (15+ years), 2005
Males Females Total
Lifetime abstainers
No information availableFormer drinkers
Abstainers*
* Persons who did not drink in the past 12 months.
DRINKERS ONLY
Adult (15+ years) per capita consumption*, total —
Adult (15+ years) per capita consumption*, males —
Adult (15+ years) per capita consumption*, females —
Heavy episodic drinkers** (15–85+ years), males —
Heavy episodic drinkers** (15–85+ years), females —
* (Recorded + unrecorded) in litres of pure alcohol, average 2003–2005.** Had at least 60 grams or more of pure alcohol on at least one occasion weekly.
PATTERNS OF DRINKING SCORE
Patterns of drinking score* LEAST RISKY No information available MOST RISKY
* Given the same level of consumption, the higher the patterns of drinking score, the greater the alcohol-attributable burden of disease for the country.
ALCOHOL POLICYExcise tax on beer / wine / spirits Yes / Yes / Yes
National legal minimum age for off-premise sales of alcoholic beverages (selling) (beer / wine / spirits) 18 / 18 / 18
National legal minimum age for on-premise sales of alcoholic beverages (serving) (beer / wine / spirits) 18 / 18 / 18
Restrictions for on-/off-premise sales of alcoholic beverages:Time (hours and days) / location (places and density) Yes & No / YesSpecifi c events / intoxicated persons / petrol stations No / Yes / Yes
National maximum legal blood alcohol concentration (BAC) when driving a vehicle (general / young / professional), in % No / No / No
Legally binding regulations on alcohol advertising / product placement No / No
Legally binding regulations on alcohol sponsorship / sales promotion No / No
HEALTH CONSEQUENCES
MORBIDITY
Prevalence estimates (12-month prevalence for 2004): Males Females
Alcohol use disorders (15+ years) 0.09% 0.01%
ALL CAUSE MORTALITY
Age-standardized deaths rates, 15+ years (per 100,000 population)
2000 2001 2002 2003 2004 2005
M F M F M F M F M F M F
Liver cirrhosisNo information availableRoad traffi c
accidents (1)
Data source: WHO Mortality Database, data as reported by countries (1) refer to transport accidents.
56%BEER
33%SPIRITS
RECORDED ADULT (15+) ALCOHOL CONSUMPTION BY TYPE OF ALCOHOLIC BEVERAGE (IN % OF PURE ALCOHOL), 2005
Beer includes malt beers. Wine includes wine made from grapes. Spirits include all distilled beverages. Other includes one or several other alcoholic beverages, such as fermented beverages made from sorghum, maize, millet, rice, or cider, fruit wine, fortifi ed wine, etc.
Adult (15+) per capita consumption, average 2003–2005 (in litres of pure alcohol):
Recorded 0.1
Unrecorded 0.2
Total 0.3
WHO African Region 6.2
Niger (the)
Total population: 13 737 000 ➤ Population 15+ years: 52% ➤ Population in urban areas: 17% ➤ Income group (World Bank): Low income
Data source: United Nations, data range 1990–2006.
SOCIOECONOMIC CONTEXT
Robust estimate of fi ve-year change in recorded adult(15+) per capita consumption,2001–2005:
INCREASE
➤ STABLE DECREASE
INCONCLUSIVE
11%WINE
0.15
0.05
0.10
2000 2002 2004
Litre
s of
pur
e al
coho
l
ENLARGEMENT OF RECORDED ADULT (15+) PER CAPITA CONSUMPTION, 2000–2005
Year
2003 20052001
ALCOHOL CONSUMPTION Population data (refer to the population 15 years and older and are in litres of pure alcohol).
15
5
10
1961 1966 1976
Litre
s of
pur
e al
coho
l
1991
RECORDED ADULT (15+) PER CAPITA CONSUMPTION, 1961–2005
Year
1971 1981 2001
20
19961986 2006
Change in data source from 2000
Beer Wine Spirits Total
0
0
AFRO CPs FINAL.indd 33AFRO CPs FINAL.indd 33 13/01/2011 08:4513/01/2011 08:45
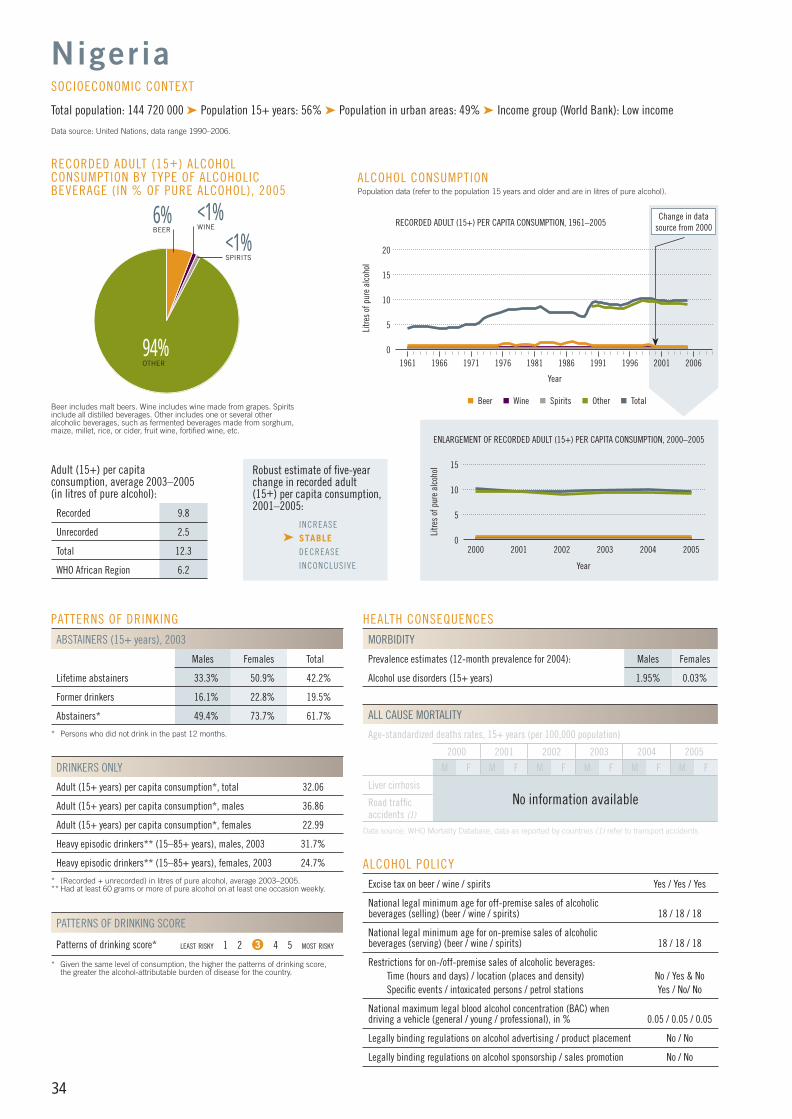
34
PATTERNS OF DRINKING
ABSTAINERS (15+ years), 2003
Males Females Total
Lifetime abstainers 33.3% 50.9% 42.2%
Former drinkers 16.1% 22.8% 19.5%
Abstainers* 49.4% 73.7% 61.7%
* Persons who did not drink in the past 12 months.
DRINKERS ONLY
Adult (15+ years) per capita consumption*, total 32.06
Adult (15+ years) per capita consumption*, males 36.86
Adult (15+ years) per capita consumption*, females 22.99
Heavy episodic drinkers** (15–85+ years), males, 2003 31.7%
Heavy episodic drinkers** (15–85+ years), females, 2003 24.7%
* (Recorded + unrecorded) in litres of pure alcohol, average 2003–2005.** Had at least 60 grams or more of pure alcohol on at least one occasion weekly.
PATTERNS OF DRINKING SCORE
Patterns of drinking score* LEAST RISKY 1 2 3 4 5 MOST RISKY
* Given the same level of consumption, the higher the patterns of drinking score, the greater the alcohol-attributable burden of disease for the country.
ALCOHOL POLICYExcise tax on beer / wine / spirits Yes / Yes / Yes
National legal minimum age for off-premise sales of alcoholic beverages (selling) (beer / wine / spirits) 18 / 18 / 18
National legal minimum age for on-premise sales of alcoholic beverages (serving) (beer / wine / spirits) 18 / 18 / 18
Restrictions for on-/off-premise sales of alcoholic beverages:Time (hours and days) / location (places and density) No / Yes & NoSpecifi c events / intoxicated persons / petrol stations Yes / No/ No
National maximum legal blood alcohol concentration (BAC) when driving a vehicle (general / young / professional), in % 0.05 / 0.05 / 0.05
Legally binding regulations on alcohol advertising / product placement No / No
Legally binding regulations on alcohol sponsorship / sales promotion No / No
HEALTH CONSEQUENCES
MORBIDITY
Prevalence estimates (12-month prevalence for 2004): Males Females
Alcohol use disorders (15+ years) 1.95% 0.03%
ALL CAUSE MORTALITY
Age-standardized deaths rates, 15+ years (per 100,000 population)
2000 2001 2002 2003 2004 2005
M F M F M F M F M F M F
Liver cirrhosisNo information availableRoad traffi c
accidents (1)
Data source: WHO Mortality Database, data as reported by countries (1) refer to transport accidents.
94%OTHER
<1%WINE
RECORDED ADULT (15+) ALCOHOL CONSUMPTION BY TYPE OF ALCOHOLIC BEVERAGE (IN % OF PURE ALCOHOL), 2005
Beer includes malt beers. Wine includes wine made from grapes. Spirits include all distilled beverages. Other includes one or several other alcoholic beverages, such as fermented beverages made from sorghum, maize, millet, rice, or cider, fruit wine, fortifi ed wine, etc.
Adult (15+) per capita consumption, average 2003–2005 (in litres of pure alcohol):
Recorded 9.8
Unrecorded 2.5
Total 12.3
WHO African Region 6.2
Nigeria
Total population: 144 720 000 ➤ Population 15+ years: 56% ➤ Population in urban areas: 49% ➤ Income group (World Bank): Low income
Data source: United Nations, data range 1990–2006.
SOCIOECONOMIC CONTEXT
Robust estimate of fi ve-year change in recorded adult(15+) per capita consumption,2001–2005:
INCREASE
➤ STABLE DECREASE
INCONCLUSIVE
<1%SPIRITS
6%BEER
15
2000 2002 2004
Litre
s of
pur
e al
coho
lENLARGEMENT OF RECORDED ADULT (15+) PER CAPITA CONSUMPTION, 2000–2005
Year
2003 20052001
ALCOHOL CONSUMPTION Population data (refer to the population 15 years and older and are in litres of pure alcohol).
15
5
10
1961 1966 1976Li
tres
of p
ure
alco
hol
1991
RECORDED ADULT (15+) PER CAPITA CONSUMPTION, 1961–2005
Year
1971 1981 2001
20
19961986 2006
Change in data source from 2000
Beer Wine Spirits Other Total
10
5
0
0
AFRO CPs FINAL.indd 34AFRO CPs FINAL.indd 34 13/01/2011 08:4513/01/2011 08:45
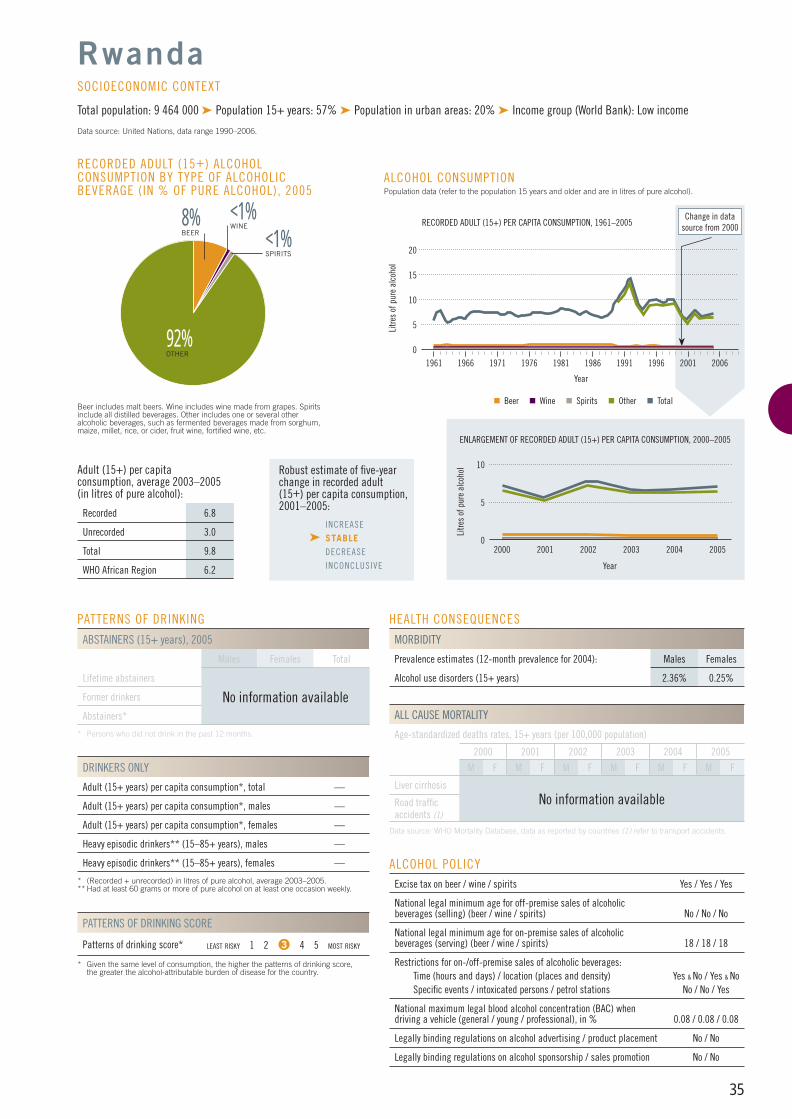
35
PATTERNS OF DRINKING
ABSTAINERS (15+ years), 2005
Males Females Total
Lifetime abstainers
No information availableFormer drinkers
Abstainers*
* Persons who did not drink in the past 12 months.
DRINKERS ONLY
Adult (15+ years) per capita consumption*, total —
Adult (15+ years) per capita consumption*, males —
Adult (15+ years) per capita consumption*, females —
Heavy episodic drinkers** (15–85+ years), males —
Heavy episodic drinkers** (15–85+ years), females —
* (Recorded + unrecorded) in litres of pure alcohol, average 2003–2005.** Had at least 60 grams or more of pure alcohol on at least one occasion weekly.
PATTERNS OF DRINKING SCORE
Patterns of drinking score* LEAST RISKY 1 2 3 4 5 MOST RISKY
* Given the same level of consumption, the higher the patterns of drinking score, the greater the alcohol-attributable burden of disease for the country.
ALCOHOL POLICYExcise tax on beer / wine / spirits Yes / Yes / Yes
National legal minimum age for off-premise sales of alcoholic beverages (selling) (beer / wine / spirits) No / No / No
National legal minimum age for on-premise sales of alcoholic beverages (serving) (beer / wine / spirits) 18 / 18 / 18
Restrictions for on-/off-premise sales of alcoholic beverages:Time (hours and days) / location (places and density) Yes & No / Yes & NoSpecifi c events / intoxicated persons / petrol stations No / No / Yes
National maximum legal blood alcohol concentration (BAC) when driving a vehicle (general / young / professional), in % 0.08 / 0.08 / 0.08
Legally binding regulations on alcohol advertising / product placement No / No
Legally binding regulations on alcohol sponsorship / sales promotion No / No
HEALTH CONSEQUENCES
MORBIDITY
Prevalence estimates (12-month prevalence for 2004): Males Females
Alcohol use disorders (15+ years) 2.36% 0.25%
ALL CAUSE MORTALITY
Age-standardized deaths rates, 15+ years (per 100,000 population)
2000 2001 2002 2003 2004 2005
M F M F M F M F M F M F
Liver cirrhosisNo information availableRoad traffi c
accidents (1)
Data source: WHO Mortality Database, data as reported by countries (1) refer to transport accidents.
8%BEER
92%OTHER
<1%WINE
RECORDED ADULT (15+) ALCOHOL CONSUMPTION BY TYPE OF ALCOHOLIC BEVERAGE (IN % OF PURE ALCOHOL), 2005
Beer includes malt beers. Wine includes wine made from grapes. Spirits include all distilled beverages. Other includes one or several other alcoholic beverages, such as fermented beverages made from sorghum, maize, millet, rice, or cider, fruit wine, fortifi ed wine, etc.
Adult (15+) per capita consumption, average 2003–2005 (in litres of pure alcohol):
Recorded 6.8
Unrecorded 3.0
Total 9.8
WHO African Region 6.2
Rwanda
Total population: 9 464 000 ➤ Population 15+ years: 57% ➤ Population in urban areas: 20% ➤ Income group (World Bank): Low income
Data source: United Nations, data range 1990–2006.
SOCIOECONOMIC CONTEXT
Robust estimate of fi ve-year change in recorded adult(15+) per capita consumption,2001–2005:
INCREASE
➤ STABLE DECREASE
INCONCLUSIVE
<1%SPIRITS
10
5
2000 2002 2004
Litre
s of
pur
e al
coho
l
ENLARGEMENT OF RECORDED ADULT (15+) PER CAPITA CONSUMPTION, 2000–2005
Year
2003 20052001
ALCOHOL CONSUMPTION Population data (refer to the population 15 years and older and are in litres of pure alcohol).
15
5
10
1961 1966 1976
Litre
s of
pur
e al
coho
l
1991
RECORDED ADULT (15+) PER CAPITA CONSUMPTION, 1961–2005
Year
1971 1981 2001
20
19961986 2006
Change in data source from 2000
Beer Wine Spirits Other Total
0
0
AFRO CPs FINAL.indd 35AFRO CPs FINAL.indd 35 13/01/2011 08:4513/01/2011 08:45
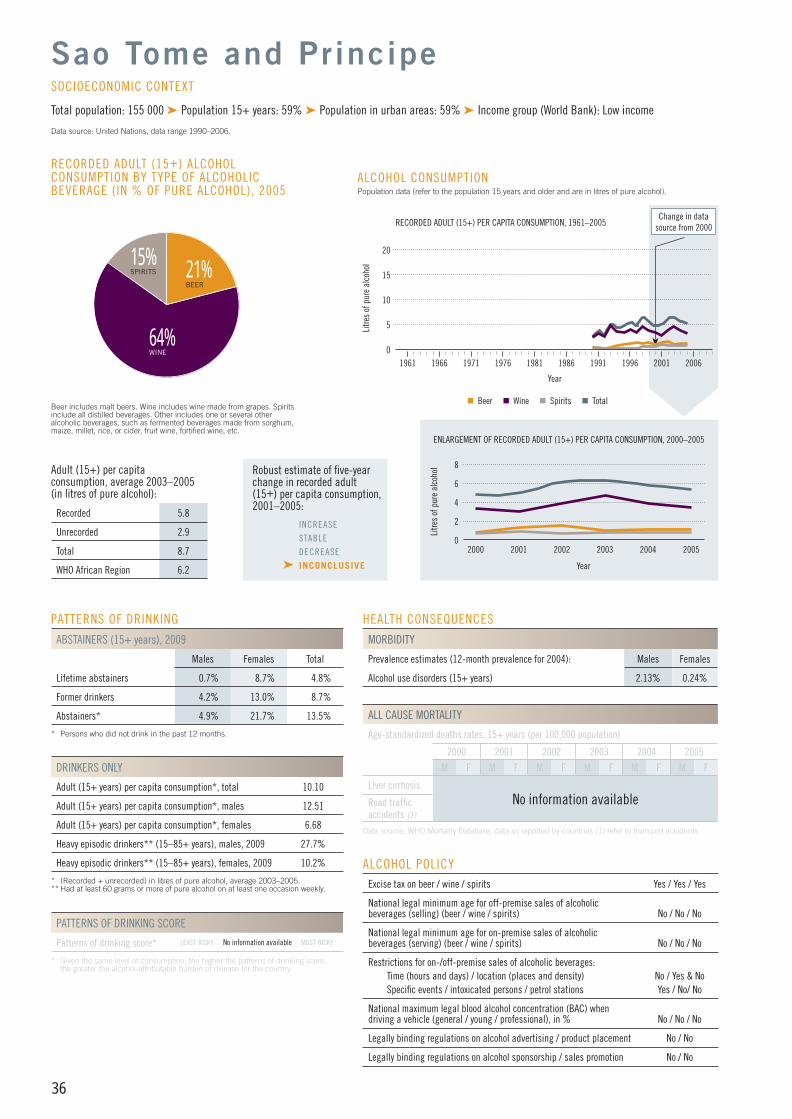
36
PATTERNS OF DRINKING
ABSTAINERS (15+ years), 2009
Males Females Total
Lifetime abstainers 0.7% 8.7% 4.8%
Former drinkers 4.2% 13.0% 8.7%
Abstainers* 4.9% 21.7% 13.5%
* Persons who did not drink in the past 12 months.
DRINKERS ONLY
Adult (15+ years) per capita consumption*, total 10.10
Adult (15+ years) per capita consumption*, males 12.51
Adult (15+ years) per capita consumption*, females 6.68
Heavy episodic drinkers** (15–85+ years), males, 2009 27.7%
Heavy episodic drinkers** (15–85+ years), females, 2009 10.2%
* (Recorded + unrecorded) in litres of pure alcohol, average 2003–2005.** Had at least 60 grams or more of pure alcohol on at least one occasion weekly.
PATTERNS OF DRINKING SCORE
Patterns of drinking score* LEAST RISKY No information available MOST RISKY
* Given the same level of consumption, the higher the patterns of drinking score, the greater the alcohol-attributable burden of disease for the country.
ALCOHOL POLICYExcise tax on beer / wine / spirits Yes / Yes / Yes
National legal minimum age for off-premise sales of alcoholic beverages (selling) (beer / wine / spirits) No / No / No
National legal minimum age for on-premise sales of alcoholic beverages (serving) (beer / wine / spirits) No / No / No
Restrictions for on-/off-premise sales of alcoholic beverages:Time (hours and days) / location (places and density) No / Yes & NoSpecifi c events / intoxicated persons / petrol stations Yes / No/ No
National maximum legal blood alcohol concentration (BAC) when driving a vehicle (general / young / professional), in % No / No / No
Legally binding regulations on alcohol advertising / product placement No / No
Legally binding regulations on alcohol sponsorship / sales promotion No / No
HEALTH CONSEQUENCES
MORBIDITY
Prevalence estimates (12-month prevalence for 2004): Males Females
Alcohol use disorders (15+ years) 2.13% 0.24%
ALL CAUSE MORTALITY
Age-standardized deaths rates, 15+ years (per 100,000 population)
2000 2001 2002 2003 2004 2005
M F M F M F M F M F M F
Liver cirrhosisNo information availableRoad traffi c
accidents (1)
Data source: WHO Mortality Database, data as reported by countries (1) refer to transport accidents.
21%BEER
64%WINE
RECORDED ADULT (15+) ALCOHOL CONSUMPTION BY TYPE OF ALCOHOLIC BEVERAGE (IN % OF PURE ALCOHOL), 2005
Beer includes malt beers. Wine includes wine made from grapes. Spirits include all distilled beverages. Other includes one or several other alcoholic beverages, such as fermented beverages made from sorghum, maize, millet, rice, or cider, fruit wine, fortifi ed wine, etc.
Adult (15+) per capita consumption, average 2003–2005 (in litres of pure alcohol):
Recorded 5.8
Unrecorded 2.9
Total 8.7
WHO African Region 6.2
Sao Tome and Principe
Total population: 155 000 ➤ Population 15+ years: 59% ➤ Population in urban areas: 59% ➤ Income group (World Bank): Low income
Data source: United Nations, data range 1990–2006.
SOCIOECONOMIC CONTEXT
Robust estimate of fi ve-year change in recorded adult(15+) per capita consumption,2001–2005:
INCREASE
STABLE
DECREASE
➤ INCONCLUSIVE
15%SPIRITS
8
2000 2002 2004
Litre
s of
pur
e al
coho
lENLARGEMENT OF RECORDED ADULT (15+) PER CAPITA CONSUMPTION, 2000–2005
Year
2003 20052001
ALCOHOL CONSUMPTION Population data (refer to the population 15 years and older and are in litres of pure alcohol).
15
5
10
1961 1966 1976Li
tres
of p
ure
alco
hol
1991
RECORDED ADULT (15+) PER CAPITA CONSUMPTION, 1961–2005
Year
1971 1981 2001
20
19961986 2006
Change in data source from 2000
Beer Wine Spirits Total
4
2
0
6
0
AFRO CPs FINAL.indd 36AFRO CPs FINAL.indd 36 13/01/2011 08:4513/01/2011 08:45
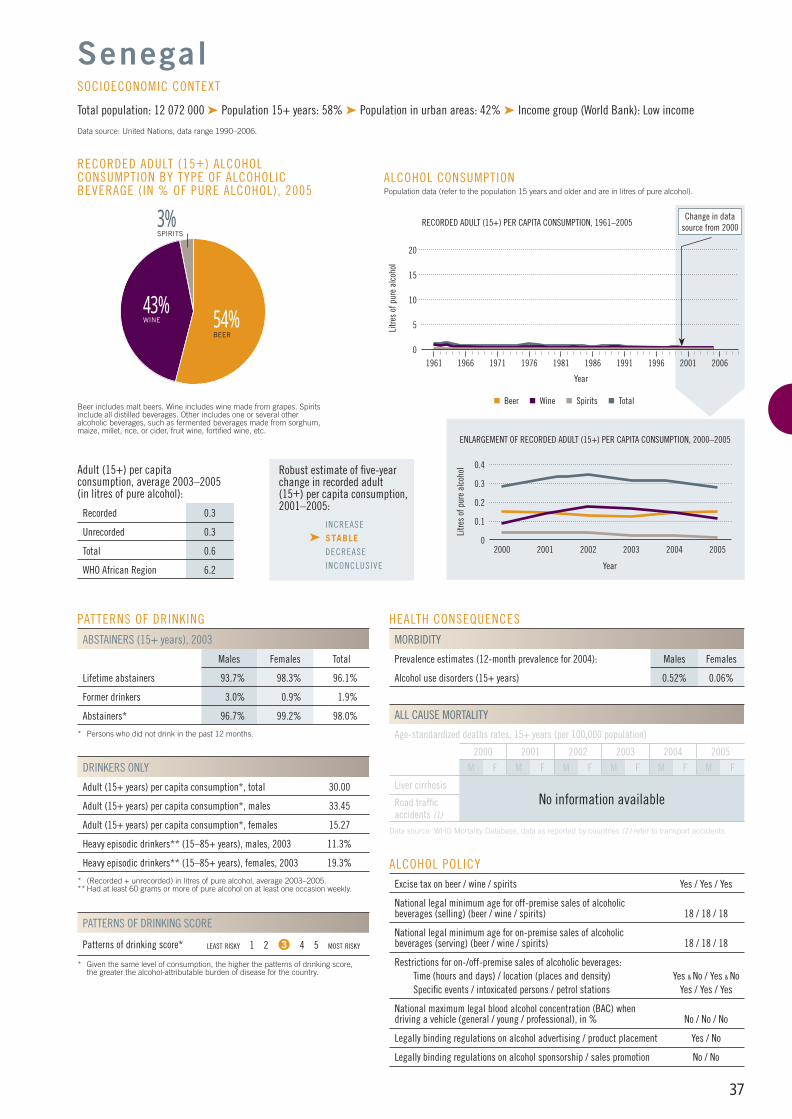
37
PATTERNS OF DRINKING
ABSTAINERS (15+ years), 2003
Males Females Total
Lifetime abstainers 93.7% 98.3% 96.1%
Former drinkers 3.0% 0.9% 1.9%
Abstainers* 96.7% 99.2% 98.0%
* Persons who did not drink in the past 12 months.
DRINKERS ONLY
Adult (15+ years) per capita consumption*, total 30.00
Adult (15+ years) per capita consumption*, males 33.45
Adult (15+ years) per capita consumption*, females 15.27
Heavy episodic drinkers** (15–85+ years), males, 2003 11.3%
Heavy episodic drinkers** (15–85+ years), females, 2003 19.3%
* (Recorded + unrecorded) in litres of pure alcohol, average 2003–2005.** Had at least 60 grams or more of pure alcohol on at least one occasion weekly.
PATTERNS OF DRINKING SCORE
Patterns of drinking score* LEAST RISKY 1 2 3 4 5 MOST RISKY
* Given the same level of consumption, the higher the patterns of drinking score, the greater the alcohol-attributable burden of disease for the country.
ALCOHOL POLICYExcise tax on beer / wine / spirits Yes / Yes / Yes
National legal minimum age for off-premise sales of alcoholic beverages (selling) (beer / wine / spirits) 18 / 18 / 18
National legal minimum age for on-premise sales of alcoholic beverages (serving) (beer / wine / spirits) 18 / 18 / 18
Restrictions for on-/off-premise sales of alcoholic beverages:Time (hours and days) / location (places and density) Yes & No / Yes & NoSpecifi c events / intoxicated persons / petrol stations Yes / Yes / Yes
National maximum legal blood alcohol concentration (BAC) when driving a vehicle (general / young / professional), in % No / No / No
Legally binding regulations on alcohol advertising / product placement Yes / No
Legally binding regulations on alcohol sponsorship / sales promotion No / No
HEALTH CONSEQUENCES
MORBIDITY
Prevalence estimates (12-month prevalence for 2004): Males Females
Alcohol use disorders (15+ years) 0.52% 0.06%
ALL CAUSE MORTALITY
Age-standardized deaths rates, 15+ years (per 100,000 population)
2000 2001 2002 2003 2004 2005
M F M F M F M F M F M F
Liver cirrhosisNo information availableRoad traffi c
accidents (1)
Data source: WHO Mortality Database, data as reported by countries (1) refer to transport accidents.
54%BEER
3%SPIRITS
RECORDED ADULT (15+) ALCOHOL CONSUMPTION BY TYPE OF ALCOHOLIC BEVERAGE (IN % OF PURE ALCOHOL), 2005
Beer includes malt beers. Wine includes wine made from grapes. Spirits include all distilled beverages. Other includes one or several other alcoholic beverages, such as fermented beverages made from sorghum, maize, millet, rice, or cider, fruit wine, fortifi ed wine, etc.
Adult (15+) per capita consumption, average 2003–2005 (in litres of pure alcohol):
Recorded 0.3
Unrecorded 0.3
Total 0.6
WHO African Region 6.2
Senegal
Total population: 12 072 000 ➤ Population 15+ years: 58% ➤ Population in urban areas: 42% ➤ Income group (World Bank): Low income
Data source: United Nations, data range 1990–2006.
SOCIOECONOMIC CONTEXT
Robust estimate of fi ve-year change in recorded adult(15+) per capita consumption,2001–2005:
INCREASE
➤ STABLE DECREASE
INCONCLUSIVE
43%WINE
0.4
0.2
2000 2002 2004
Litre
s of
pur
e al
coho
l
ENLARGEMENT OF RECORDED ADULT (15+) PER CAPITA CONSUMPTION, 2000–2005
Year
2003 20052001
ALCOHOL CONSUMPTION Population data (refer to the population 15 years and older and are in litres of pure alcohol).
15
5
10
1961 1966 1976
Litre
s of
pur
e al
coho
l
1991
RECORDED ADULT (15+) PER CAPITA CONSUMPTION, 1961–2005
Year
1971 1981 2001
20
19961986 2006
Change in data source from 2000
Beer Wine Spirits Total
0.3
0.1
0
0
AFRO CPs FINAL.indd 37AFRO CPs FINAL.indd 37 13/01/2011 08:4513/01/2011 08:45
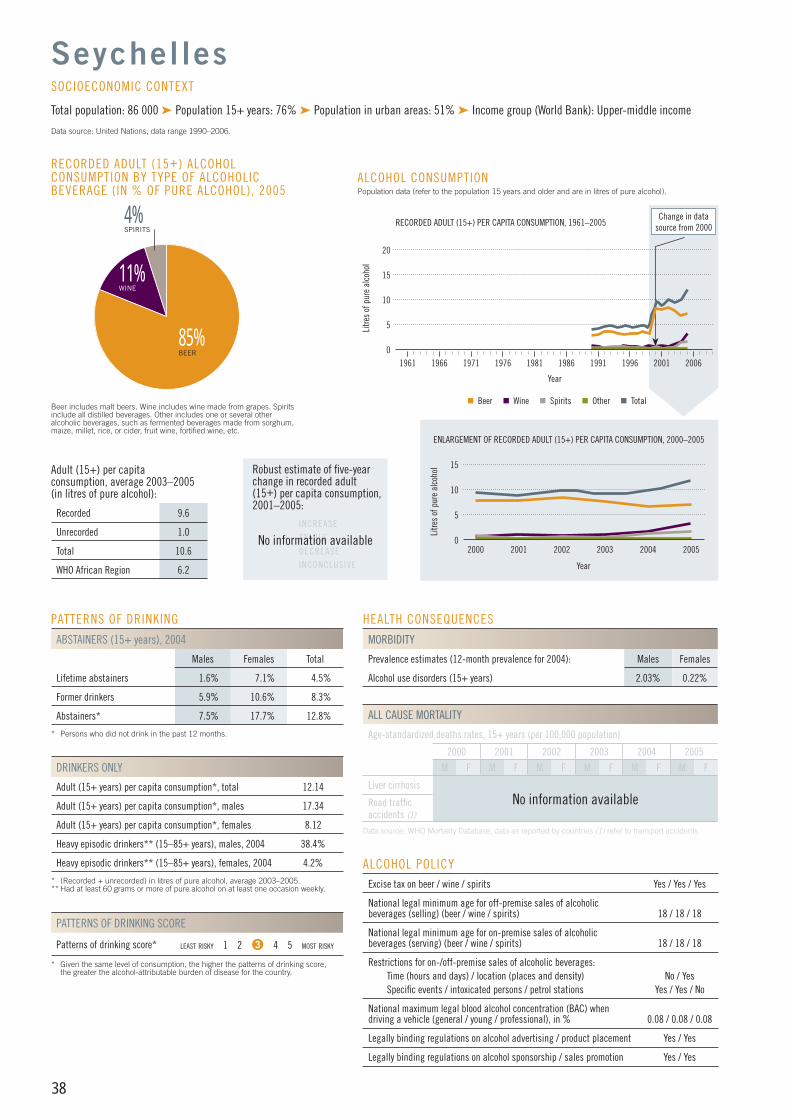
38
PATTERNS OF DRINKING
ABSTAINERS (15+ years), 2004
Males Females Total
Lifetime abstainers 1.6% 7.1% 4.5%
Former drinkers 5.9% 10.6% 8.3%
Abstainers* 7.5% 17.7% 12.8%
* Persons who did not drink in the past 12 months.
DRINKERS ONLY
Adult (15+ years) per capita consumption*, total 12.14
Adult (15+ years) per capita consumption*, males 17.34
Adult (15+ years) per capita consumption*, females 8.12
Heavy episodic drinkers** (15–85+ years), males, 2004 38.4%
Heavy episodic drinkers** (15–85+ years), females, 2004 4.2%
* (Recorded + unrecorded) in litres of pure alcohol, average 2003–2005.** Had at least 60 grams or more of pure alcohol on at least one occasion weekly.
PATTERNS OF DRINKING SCORE
Patterns of drinking score* LEAST RISKY 1 2 3 4 5 MOST RISKY
* Given the same level of consumption, the higher the patterns of drinking score, the greater the alcohol-attributable burden of disease for the country.
ALCOHOL POLICYExcise tax on beer / wine / spirits Yes / Yes / Yes
National legal minimum age for off-premise sales of alcoholic beverages (selling) (beer / wine / spirits) 18 / 18 / 18
National legal minimum age for on-premise sales of alcoholic beverages (serving) (beer / wine / spirits) 18 / 18 / 18
Restrictions for on-/off-premise sales of alcoholic beverages:Time (hours and days) / location (places and density) No / YesSpecifi c events / intoxicated persons / petrol stations Yes / Yes / No
National maximum legal blood alcohol concentration (BAC) when driving a vehicle (general / young / professional), in % 0.08 / 0.08 / 0.08
Legally binding regulations on alcohol advertising / product placement Yes / Yes
Legally binding regulations on alcohol sponsorship / sales promotion Yes / Yes
HEALTH CONSEQUENCES
MORBIDITY
Prevalence estimates (12-month prevalence for 2004): Males Females
Alcohol use disorders (15+ years) 2.03% 0.22%
ALL CAUSE MORTALITY
Age-standardized deaths rates, 15+ years (per 100,000 population)
2000 2001 2002 2003 2004 2005
M F M F M F M F M F M F
Liver cirrhosisNo information availableRoad traffi c
accidents (1)
Data source: WHO Mortality Database, data as reported by countries (1) refer to transport accidents.
85%BEER
11%WINE
RECORDED ADULT (15+) ALCOHOL CONSUMPTION BY TYPE OF ALCOHOLIC BEVERAGE (IN % OF PURE ALCOHOL), 2005
Beer includes malt beers. Wine includes wine made from grapes. Spirits include all distilled beverages. Other includes one or several other alcoholic beverages, such as fermented beverages made from sorghum, maize, millet, rice, or cider, fruit wine, fortifi ed wine, etc.
Adult (15+) per capita consumption, average 2003–2005 (in litres of pure alcohol):
Recorded 9.6
Unrecorded 1.0
Total 10.6
WHO African Region 6.2
Seychelles
Total population: 86 000 ➤ Population 15+ years: 76% ➤ Population in urban areas: 51% ➤ Income group (World Bank): Upper-middle income
Data source: United Nations, data range 1990–2006.
SOCIOECONOMIC CONTEXT
4%SPIRITS
15
2000 2002 2004
Litre
s of
pur
e al
coho
lENLARGEMENT OF RECORDED ADULT (15+) PER CAPITA CONSUMPTION, 2000–2005
Year
2003 20052001
ALCOHOL CONSUMPTION Population data (refer to the population 15 years and older and are in litres of pure alcohol).
15
5
10
1961 1966 1976Li
tres
of p
ure
alco
hol
1991
RECORDED ADULT (15+) PER CAPITA CONSUMPTION, 1961–2005
Year
1971 1981 2001
20
19961986 2006
Change in data source from 2000
Beer Wine Spirits Other Total
5
10
0
0
Robust estimate of fi ve-year change in recorded adult(15+) per capita consumption,2001–2005:
INCREASE
STABLE
DECREASE
INCONCLUSIVE
No information available
AFRO CPs FINAL.indd 38AFRO CPs FINAL.indd 38 13/01/2011 08:4513/01/2011 08:45
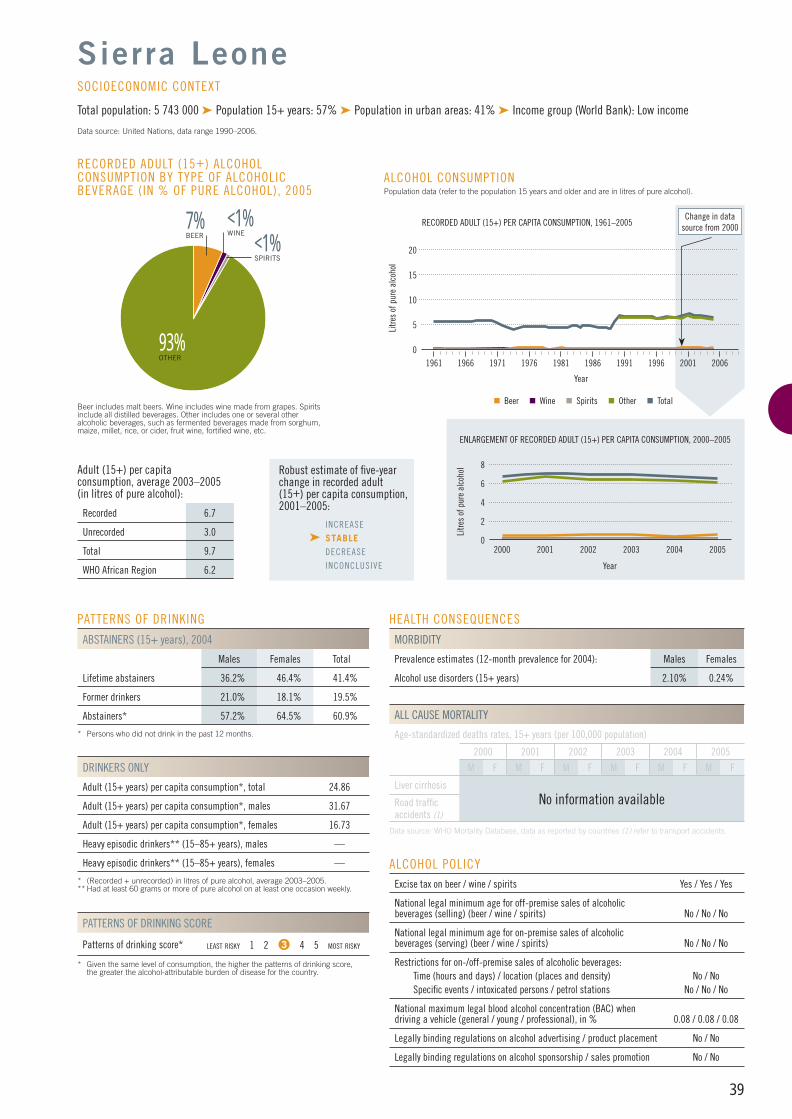
39
PATTERNS OF DRINKING
ABSTAINERS (15+ years), 2004
Males Females Total
Lifetime abstainers 36.2% 46.4% 41.4%
Former drinkers 21.0% 18.1% 19.5%
Abstainers* 57.2% 64.5% 60.9%
* Persons who did not drink in the past 12 months.
DRINKERS ONLY
Adult (15+ years) per capita consumption*, total 24.86
Adult (15+ years) per capita consumption*, males 31.67
Adult (15+ years) per capita consumption*, females 16.73
Heavy episodic drinkers** (15–85+ years), males —
Heavy episodic drinkers** (15–85+ years), females —
* (Recorded + unrecorded) in litres of pure alcohol, average 2003–2005.** Had at least 60 grams or more of pure alcohol on at least one occasion weekly.
PATTERNS OF DRINKING SCORE
Patterns of drinking score* LEAST RISKY 1 2 3 4 5 MOST RISKY
* Given the same level of consumption, the higher the patterns of drinking score, the greater the alcohol-attributable burden of disease for the country.
ALCOHOL POLICYExcise tax on beer / wine / spirits Yes / Yes / Yes
National legal minimum age for off-premise sales of alcoholic beverages (selling) (beer / wine / spirits) No / No / No
National legal minimum age for on-premise sales of alcoholic beverages (serving) (beer / wine / spirits) No / No / No
Restrictions for on-/off-premise sales of alcoholic beverages:Time (hours and days) / location (places and density) No / No Specifi c events / intoxicated persons / petrol stations No / No / No
National maximum legal blood alcohol concentration (BAC) when driving a vehicle (general / young / professional), in % 0.08 / 0.08 / 0.08
Legally binding regulations on alcohol advertising / product placement No / No
Legally binding regulations on alcohol sponsorship / sales promotion No / No
HEALTH CONSEQUENCES
MORBIDITY
Prevalence estimates (12-month prevalence for 2004): Males Females
Alcohol use disorders (15+ years) 2.10% 0.24%
ALL CAUSE MORTALITY
Age-standardized deaths rates, 15+ years (per 100,000 population)
2000 2001 2002 2003 2004 2005
M F M F M F M F M F M F
Liver cirrhosisNo information availableRoad traffi c
accidents (1)
Data source: WHO Mortality Database, data as reported by countries (1) refer to transport accidents.
93%OTHER
<1%WINE
RECORDED ADULT (15+) ALCOHOL CONSUMPTION BY TYPE OF ALCOHOLIC BEVERAGE (IN % OF PURE ALCOHOL), 2005
Beer includes malt beers. Wine includes wine made from grapes. Spirits include all distilled beverages. Other includes one or several other alcoholic beverages, such as fermented beverages made from sorghum, maize, millet, rice, or cider, fruit wine, fortifi ed wine, etc.
Adult (15+) per capita consumption, average 2003–2005 (in litres of pure alcohol):
Recorded 6.7
Unrecorded 3.0
Total 9.7
WHO African Region 6.2
Sierra Leone
Total population: 5 743 000 ➤ Population 15+ years: 57% ➤ Population in urban areas: 41% ➤ Income group (World Bank): Low income
Data source: United Nations, data range 1990–2006.
SOCIOECONOMIC CONTEXT
Robust estimate of fi ve-year change in recorded adult(15+) per capita consumption,2001–2005:
INCREASE
➤ STABLE DECREASE
INCONCLUSIVE
<1%SPIRITS
8
4
2000 2002 2004
Litre
s of
pur
e al
coho
l
ENLARGEMENT OF RECORDED ADULT (15+) PER CAPITA CONSUMPTION, 2000–2005
Year
2003 20052001
ALCOHOL CONSUMPTION Population data (refer to the population 15 years and older and are in litres of pure alcohol).
15
5
10
1961 1966 1976
Litre
s of
pur
e al
coho
l
1991
RECORDED ADULT (15+) PER CAPITA CONSUMPTION, 1961–2005
Year
1971 1981 2001
20
19961986 2006
Change in data source from 2000
Beer Wine Spirits Other Total
6
2
0
0
7%BEER
AFRO CPs FINAL.indd 39AFRO CPs FINAL.indd 39 13/01/2011 08:4513/01/2011 08:45
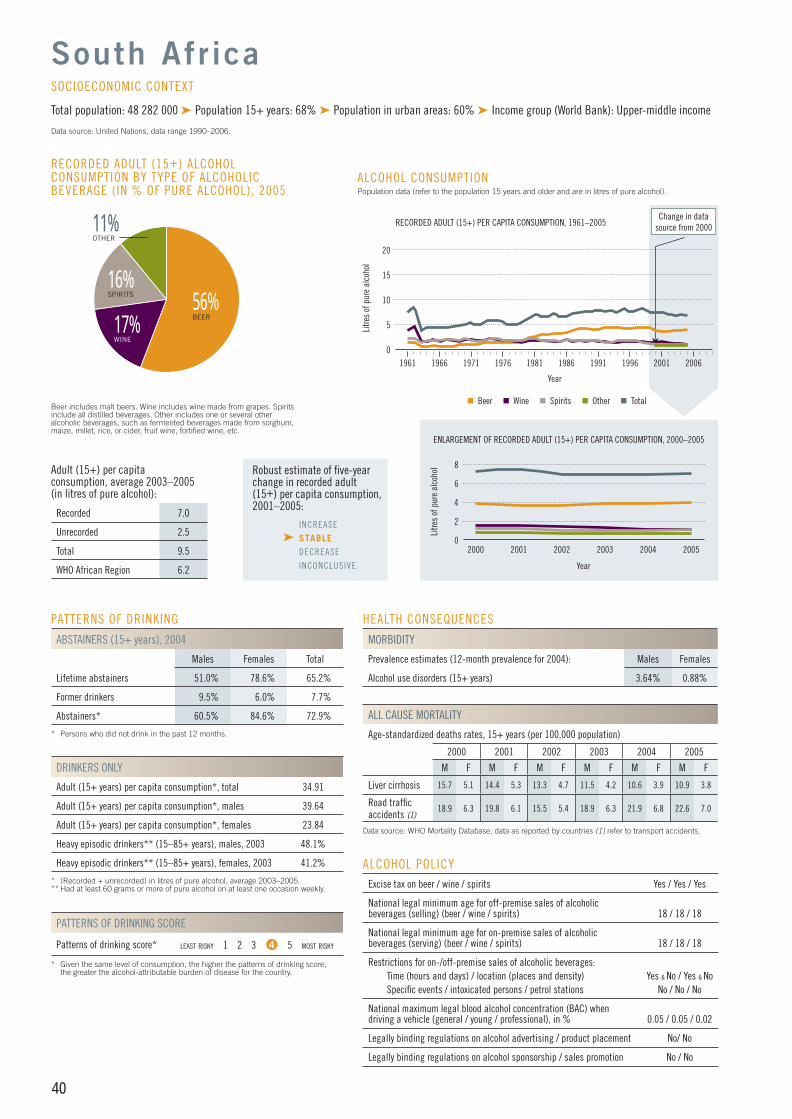
40
PATTERNS OF DRINKING
ABSTAINERS (15+ years), 2004
Males Females Total
Lifetime abstainers 51.0% 78.6% 65.2%
Former drinkers 9.5% 6.0% 7.7%
Abstainers* 60.5% 84.6% 72.9%
* Persons who did not drink in the past 12 months.
DRINKERS ONLY
Adult (15+ years) per capita consumption*, total 34.91
Adult (15+ years) per capita consumption*, males 39.64
Adult (15+ years) per capita consumption*, females 23.84
Heavy episodic drinkers** (15–85+ years), males, 2003 48.1%
Heavy episodic drinkers** (15–85+ years), females, 2003 41.2%
* (Recorded + unrecorded) in litres of pure alcohol, average 2003–2005.** Had at least 60 grams or more of pure alcohol on at least one occasion weekly.
PATTERNS OF DRINKING SCORE
Patterns of drinking score* LEAST RISKY 1 2 3 4 5 MOST RISKY
* Given the same level of consumption, the higher the patterns of drinking score, the greater the alcohol-attributable burden of disease for the country.
ALCOHOL POLICYExcise tax on beer / wine / spirits Yes / Yes / Yes
National legal minimum age for off-premise sales of alcoholic beverages (selling) (beer / wine / spirits) 18 / 18 / 18
National legal minimum age for on-premise sales of alcoholic beverages (serving) (beer / wine / spirits) 18 / 18 / 18
Restrictions for on-/off-premise sales of alcoholic beverages:Time (hours and days) / location (places and density) Yes & No / Yes & NoSpecifi c events / intoxicated persons / petrol stations No / No / No
National maximum legal blood alcohol concentration (BAC) when driving a vehicle (general / young / professional), in % 0.05 / 0.05 / 0.02
Legally binding regulations on alcohol advertising / product placement No/ No
Legally binding regulations on alcohol sponsorship / sales promotion No / No
HEALTH CONSEQUENCES
MORBIDITY
Prevalence estimates (12-month prevalence for 2004): Males Females
Alcohol use disorders (15+ years) 3.64% 0.88%
ALL CAUSE MORTALITY
Age-standardized deaths rates, 15+ years (per 100,000 population)
2000 2001 2002 2003 2004 2005
M F M F M F M F M F M F
Liver cirrhosis 15.7 5.1 14.4 5.3 13.3 4.7 11.5 4.2 10.6 3.9 10.9 3.8
Road traffi c accidents (1)
18.9 6.3 19.8 6.1 15.5 5.4 18.9 6.3 21.9 6.8 22.6 7.0
Data source: WHO Mortality Database, data as reported by countries (1) refer to transport accidents.
56%BEER17%
WINE
RECORDED ADULT (15+) ALCOHOL CONSUMPTION BY TYPE OF ALCOHOLIC BEVERAGE (IN % OF PURE ALCOHOL), 2005
Beer includes malt beers. Wine includes wine made from grapes. Spirits include all distilled beverages. Other includes one or several other alcoholic beverages, such as fermented beverages made from sorghum, maize, millet, rice, or cider, fruit wine, fortifi ed wine, etc.
Adult (15+) per capita consumption, average 2003–2005 (in litres of pure alcohol):
Recorded 7.0
Unrecorded 2.5
Total 9.5
WHO African Region 6.2
South Afr ica
Total population: 48 282 000 ➤ Population 15+ years: 68% ➤ Population in urban areas: 60% ➤ Income group (World Bank): Upper-middle income
Data source: United Nations, data range 1990–2006.
SOCIOECONOMIC CONTEXT
Robust estimate of fi ve-year change in recorded adult(15+) per capita consumption,2001–2005:
INCREASE
➤ STABLE DECREASE
INCONCLUSIVE
16%SPIRITS
11%OTHER
8
4
2000 2002 2004
Litre
s of
pur
e al
coho
lENLARGEMENT OF RECORDED ADULT (15+) PER CAPITA CONSUMPTION, 2000–2005
Year
2003 20052001
6
2
0
ALCOHOL CONSUMPTION Population data (refer to the population 15 years and older and are in litres of pure alcohol).
15
5
10
1961 1966 1976Li
tres
of p
ure
alco
hol
1991
RECORDED ADULT (15+) PER CAPITA CONSUMPTION, 1961–2005
Year
1971 1981 2001
20
19961986 2006
Change in data source from 2000
Beer Wine Spirits Other Total
0
AFRO CPs FINAL.indd 40AFRO CPs FINAL.indd 40 13/01/2011 08:4513/01/2011 08:45

41
PATTERNS OF DRINKING
ABSTAINERS (15+ years), 2003
Males Females Total
Lifetime abstainers 53.5% 67.7% 61.0%
Former drinkers 15.9% 10.8% 13.2%
Abstainers* 69.4% 78.5% 74.2%
* Persons who did not drink in the past 12 months.
DRINKERS ONLY
Adult (15+ years) per capita consumption*, total 20.96
Adult (15+ years) per capita consumption*, males 33.89
Adult (15+ years) per capita consumption*, females 4.73
Heavy episodic drinkers** (15–85+ years), males, 2003 12.5%
Heavy episodic drinkers** (15–85+ years), females, 2003 4.4%
* (Recorded + unrecorded) in litres of pure alcohol, average 2003–2005.** Had at least 60 grams or more of pure alcohol on at least one occasion weekly.
PATTERNS OF DRINKING SCORE
Patterns of drinking score* LEAST RISKY 1 2 3 4 5 MOST RISKY
* Given the same level of consumption, the higher the patterns of drinking score, the greater the alcohol-attributable burden of disease for the country.
ALCOHOL POLICYExcise tax on beer / wine / spirits Yes / Yes / Yes
National legal minimum age for off-premise sales of alcoholic beverages (selling) (beer / wine / spirits) 18 / 18 / 18
National legal minimum age for on-premise sales of alcoholic beverages (serving) (beer / wine / spirits) 18 / 18 / 18
Restrictions for on-/off-premise sales of alcoholic beverages:Time (hours and days) / location (places and density) Yes / Yes Specifi c events / intoxicated persons / petrol stations Yes / Yes / Yes
National maximum legal blood alcohol concentration (BAC) when driving a vehicle (general / young / professional), in % 0.05 / 0.05 / 0.05
Legally binding regulations on alcohol advertising / product placement No / No
Legally binding regulations on alcohol sponsorship / sales promotion No / Yes
HEALTH CONSEQUENCES
MORBIDITY
Prevalence estimates (12-month prevalence for 2004): Males Females
Alcohol use disorders (15+ years) 2.27% 0.25%
ALL CAUSE MORTALITY
Age-standardized deaths rates, 15+ years (per 100,000 population)
2000 2001 2002 2003 2004 2005
M F M F M F M F M F M F
Liver cirrhosisNo information availableRoad traffi c
accidents (1)
Data source: WHO Mortality Database, data as reported by countries (1) refer to transport accidents.
33%BEER
60%OTHER
3%SPIRITS
RECORDED ADULT (15+) ALCOHOL CONSUMPTION BY TYPE OF ALCOHOLIC BEVERAGE (IN % OF PURE ALCOHOL), 2005
Beer includes malt beers. Wine includes wine made from grapes. Spirits include all distilled beverages. Other includes one or several other alcoholic beverages, such as fermented beverages made from sorghum, maize, millet, rice, or cider, fruit wine, fortifi ed wine, etc.
Adult (15+) per capita consumption, average 2003–2005 (in litres of pure alcohol):
Recorded 5.7
Unrecorded 0.0
Total 5.7
WHO African Region 6.2
Swaziland
Total population: 1 134 000 ➤ Population 15+ years: 61% ➤ Population in urban areas: 24% ➤ Income group (World Bank): Lower-middle income
Data source: United Nations, data range 1990–2006.
SOCIOECONOMIC CONTEXT
Robust estimate of fi ve-year change in recorded adult(15+) per capita consumption,2001–2005:
INCREASE
STABLE
➤ DECREASE INCONCLUSIVE
4%WINE
10
2000 2002 2004
Litre
s of
pur
e al
coho
l
ENLARGEMENT OF RECORDED ADULT (15+) PER CAPITA CONSUMPTION, 2000–2005
Year
2003 20052001
ALCOHOL CONSUMPTION Population data (refer to the population 15 years and older and are in litres of pure alcohol).
15
5
10
1961 1966 1976
Litre
s of
pur
e al
coho
l
1991
RECORDED ADULT (15+) PER CAPITA CONSUMPTION, 1961–2005
Year
1971 1981 2001
20
19961986 2006
Change in data source from 2000
Beer Wine Spirits Other Total
5
0
0
AFRO CPs FINAL.indd 41AFRO CPs FINAL.indd 41 13/01/2011 08:4513/01/2011 08:45
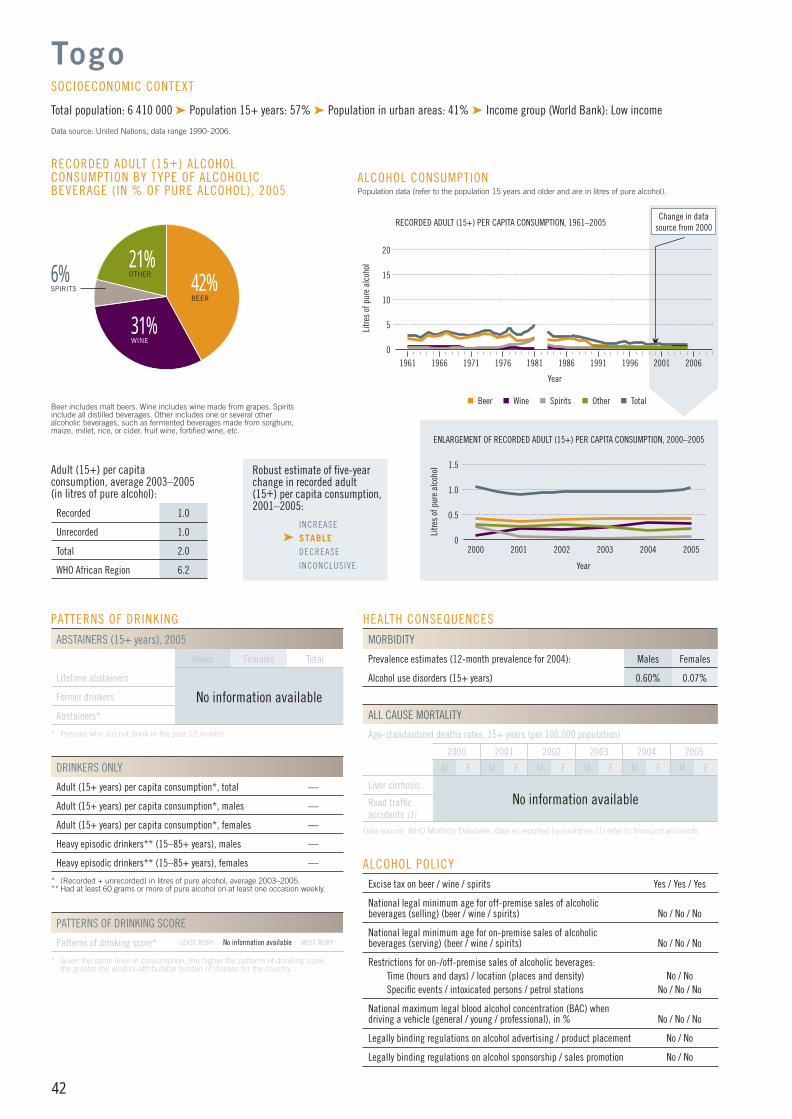
42
PATTERNS OF DRINKING
ABSTAINERS (15+ years), 2005
Males Females Total
Lifetime abstainers
No information availableFormer drinkers
Abstainers*
* Persons who did not drink in the past 12 months.
DRINKERS ONLY
Adult (15+ years) per capita consumption*, total —
Adult (15+ years) per capita consumption*, males —
Adult (15+ years) per capita consumption*, females —
Heavy episodic drinkers** (15–85+ years), males —
Heavy episodic drinkers** (15–85+ years), females —
* (Recorded + unrecorded) in litres of pure alcohol, average 2003–2005.** Had at least 60 grams or more of pure alcohol on at least one occasion weekly.
PATTERNS OF DRINKING SCORE
Patterns of drinking score* LEAST RISKY No information available MOST RISKY
* Given the same level of consumption, the higher the patterns of drinking score, the greater the alcohol-attributable burden of disease for the country.
ALCOHOL POLICYExcise tax on beer / wine / spirits Yes / Yes / Yes
National legal minimum age for off-premise sales of alcoholic beverages (selling) (beer / wine / spirits) No / No / No
National legal minimum age for on-premise sales of alcoholic beverages (serving) (beer / wine / spirits) No / No / No
Restrictions for on-/off-premise sales of alcoholic beverages:Time (hours and days) / location (places and density) No / NoSpecifi c events / intoxicated persons / petrol stations No / No / No
National maximum legal blood alcohol concentration (BAC) when driving a vehicle (general / young / professional), in % No / No / No
Legally binding regulations on alcohol advertising / product placement No / No
Legally binding regulations on alcohol sponsorship / sales promotion No / No
HEALTH CONSEQUENCES
MORBIDITY
Prevalence estimates (12-month prevalence for 2004): Males Females
Alcohol use disorders (15+ years) 0.60% 0.07%
ALL CAUSE MORTALITY
Age-standardized deaths rates, 15+ years (per 100,000 population)
2000 2001 2002 2003 2004 2005
M F M F M F M F M F M F
Liver cirrhosisNo information availableRoad traffi c
accidents (1)
Data source: WHO Mortality Database, data as reported by countries (1) refer to transport accidents.
42%BEER
31%WINE
RECORDED ADULT (15+) ALCOHOL CONSUMPTION BY TYPE OF ALCOHOLIC BEVERAGE (IN % OF PURE ALCOHOL), 2005
Beer includes malt beers. Wine includes wine made from grapes. Spirits include all distilled beverages. Other includes one or several other alcoholic beverages, such as fermented beverages made from sorghum, maize, millet, rice, or cider, fruit wine, fortifi ed wine, etc.
Adult (15+) per capita consumption, average 2003–2005 (in litres of pure alcohol):
Recorded 1.0
Unrecorded 1.0
Total 2.0
WHO African Region 6.2
Togo
Total population: 6 410 000 ➤ Population 15+ years: 57% ➤ Population in urban areas: 41% ➤ Income group (World Bank): Low income
Data source: United Nations, data range 1990–2006.
SOCIOECONOMIC CONTEXT
Robust estimate of fi ve-year change in recorded adult(15+) per capita consumption,2001–2005:
INCREASE
➤ STABLE DECREASE
INCONCLUSIVE
6%SPIRITS
21%OTHER
1.5
1.0
2000 2002 2004
Litre
s of
pur
e al
coho
lENLARGEMENT OF RECORDED ADULT (15+) PER CAPITA CONSUMPTION, 2000–2005
Year
2003 20052001
ALCOHOL CONSUMPTION Population data (refer to the population 15 years and older and are in litres of pure alcohol).
15
5
10
1961 1966 1976Li
tres
of p
ure
alco
hol
1991
RECORDED ADULT (15+) PER CAPITA CONSUMPTION, 1961–2005
Year
1971 1981 2001
20
19961986 2006
Change in data source from 2000
Beer Wine Spirits Other Total
0.5
0
0
AFRO CPs FINAL.indd 42AFRO CPs FINAL.indd 42 13/01/2011 08:4513/01/2011 08:45
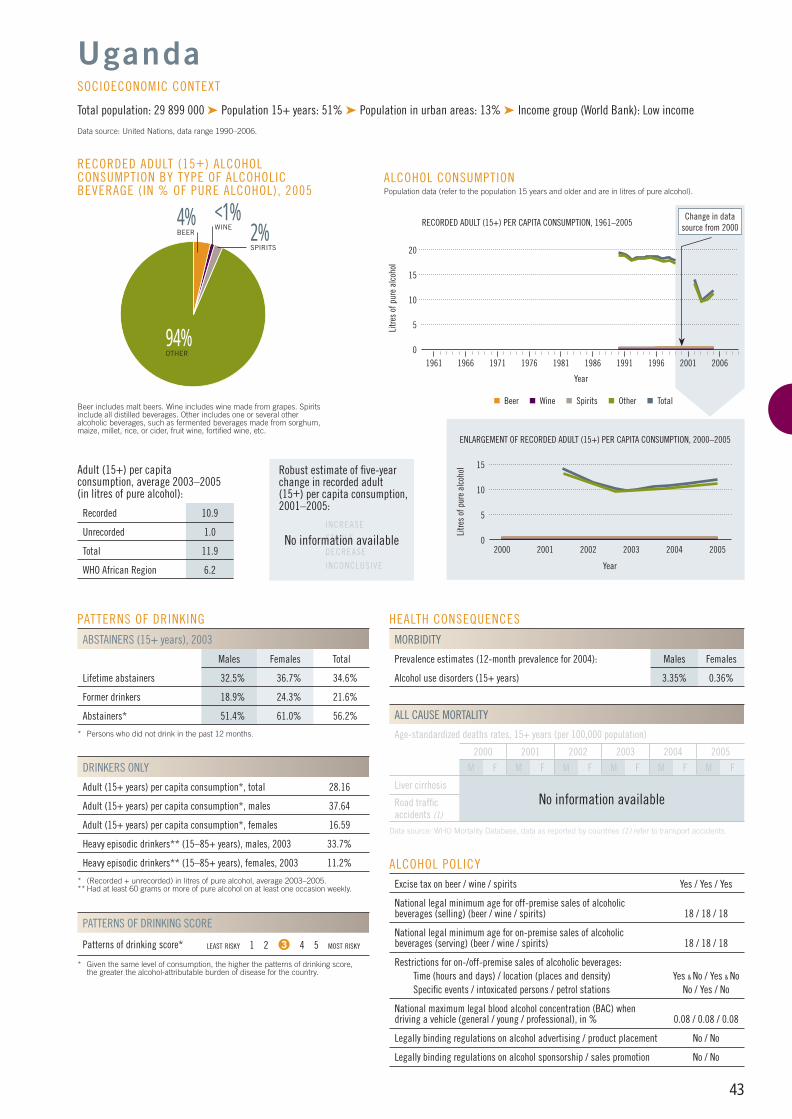
43
PATTERNS OF DRINKING
ABSTAINERS (15+ years), 2003
Males Females Total
Lifetime abstainers 32.5% 36.7% 34.6%
Former drinkers 18.9% 24.3% 21.6%
Abstainers* 51.4% 61.0% 56.2%
* Persons who did not drink in the past 12 months.
DRINKERS ONLY
Adult (15+ years) per capita consumption*, total 28.16
Adult (15+ years) per capita consumption*, males 37.64
Adult (15+ years) per capita consumption*, females 16.59
Heavy episodic drinkers** (15–85+ years), males, 2003 33.7%
Heavy episodic drinkers** (15–85+ years), females, 2003 11.2%
* (Recorded + unrecorded) in litres of pure alcohol, average 2003–2005.** Had at least 60 grams or more of pure alcohol on at least one occasion weekly.
PATTERNS OF DRINKING SCORE
Patterns of drinking score* LEAST RISKY 1 2 3 4 5 MOST RISKY
* Given the same level of consumption, the higher the patterns of drinking score, the greater the alcohol-attributable burden of disease for the country.
ALCOHOL POLICYExcise tax on beer / wine / spirits Yes / Yes / Yes
National legal minimum age for off-premise sales of alcoholic beverages (selling) (beer / wine / spirits) 18 / 18 / 18
National legal minimum age for on-premise sales of alcoholic beverages (serving) (beer / wine / spirits) 18 / 18 / 18
Restrictions for on-/off-premise sales of alcoholic beverages:Time (hours and days) / location (places and density) Yes & No / Yes & NoSpecifi c events / intoxicated persons / petrol stations No / Yes / No
National maximum legal blood alcohol concentration (BAC) when driving a vehicle (general / young / professional), in % 0.08 / 0.08 / 0.08
Legally binding regulations on alcohol advertising / product placement No / No
Legally binding regulations on alcohol sponsorship / sales promotion No / No
HEALTH CONSEQUENCES
MORBIDITY
Prevalence estimates (12-month prevalence for 2004): Males Females
Alcohol use disorders (15+ years) 3.35% 0.36%
ALL CAUSE MORTALITY
Age-standardized deaths rates, 15+ years (per 100,000 population)
2000 2001 2002 2003 2004 2005
M F M F M F M F M F M F
Liver cirrhosisNo information availableRoad traffi c
accidents (1)
Data source: WHO Mortality Database, data as reported by countries (1) refer to transport accidents.
4%BEER
94%OTHER
<1%WINE
RECORDED ADULT (15+) ALCOHOL CONSUMPTION BY TYPE OF ALCOHOLIC BEVERAGE (IN % OF PURE ALCOHOL), 2005
Beer includes malt beers. Wine includes wine made from grapes. Spirits include all distilled beverages. Other includes one or several other alcoholic beverages, such as fermented beverages made from sorghum, maize, millet, rice, or cider, fruit wine, fortifi ed wine, etc.
Adult (15+) per capita consumption, average 2003–2005 (in litres of pure alcohol):
Recorded 10.9
Unrecorded 1.0
Total 11.9
WHO African Region 6.2
Uganda
Total population: 29 899 000 ➤ Population 15+ years: 51% ➤ Population in urban areas: 13% ➤ Income group (World Bank): Low income
Data source: United Nations, data range 1990–2006.
SOCIOECONOMIC CONTEXT
2%SPIRITS
15
2000 2002 2004
Litre
s of
pur
e al
coho
l
ENLARGEMENT OF RECORDED ADULT (15+) PER CAPITA CONSUMPTION, 2000–2005
Year
2003 20052001
ALCOHOL CONSUMPTION Population data (refer to the population 15 years and older and are in litres of pure alcohol).
15
5
10
1961 1966 1976
Litre
s of
pur
e al
coho
l
1991
RECORDED ADULT (15+) PER CAPITA CONSUMPTION, 1961–2005
Year
1971 1981 2001
20
19961986 2006
Change in data source from 2000
Beer Wine Spirits Other Total
5
10
0
0
Robust estimate of fi ve-year change in recorded adult(15+) per capita consumption,2001–2005:
INCREASE
STABLE
DECREASE
INCONCLUSIVE
No information available
AFRO CPs FINAL.indd 43AFRO CPs FINAL.indd 43 13/01/2011 08:4513/01/2011 08:45
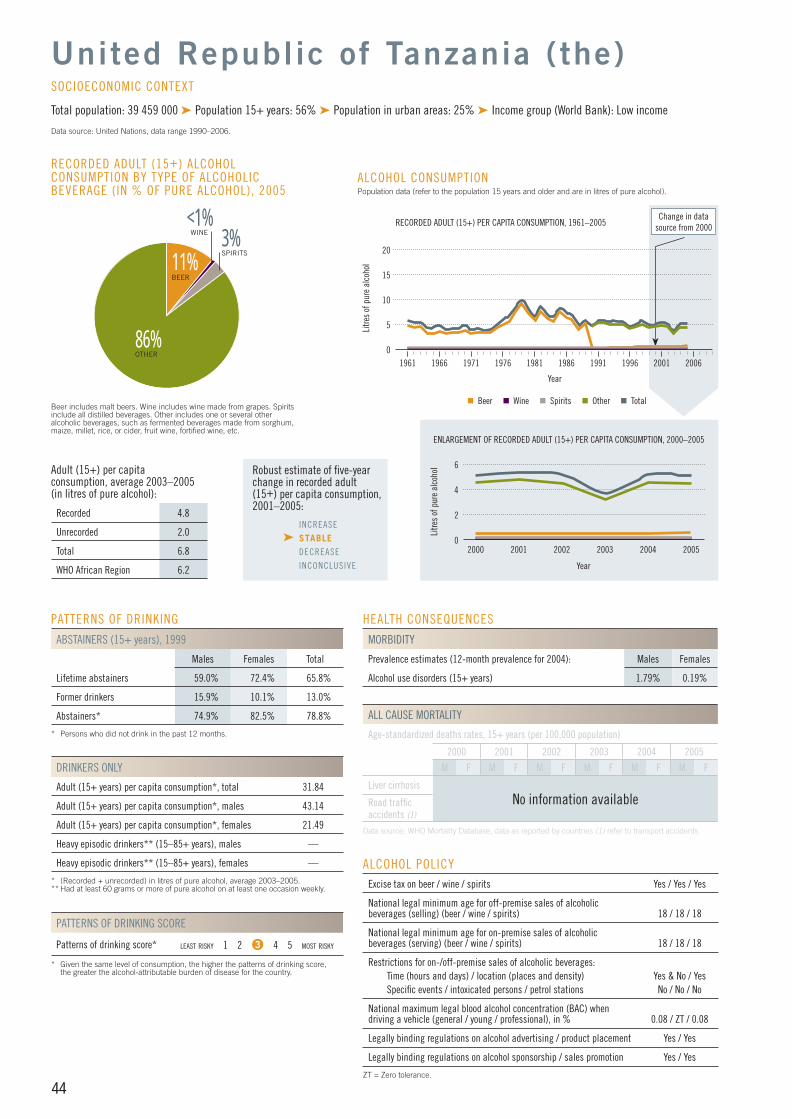
44
PATTERNS OF DRINKING
ABSTAINERS (15+ years), 1999
Males Females Total
Lifetime abstainers 59.0% 72.4% 65.8%
Former drinkers 15.9% 10.1% 13.0%
Abstainers* 74.9% 82.5% 78.8%
* Persons who did not drink in the past 12 months.
DRINKERS ONLY
Adult (15+ years) per capita consumption*, total 31.84
Adult (15+ years) per capita consumption*, males 43.14
Adult (15+ years) per capita consumption*, females 21.49
Heavy episodic drinkers** (15–85+ years), males —
Heavy episodic drinkers** (15–85+ years), females —
* (Recorded + unrecorded) in litres of pure alcohol, average 2003–2005.** Had at least 60 grams or more of pure alcohol on at least one occasion weekly.
PATTERNS OF DRINKING SCORE
Patterns of drinking score* LEAST RISKY 1 2 3 4 5 MOST RISKY
* Given the same level of consumption, the higher the patterns of drinking score, the greater the alcohol-attributable burden of disease for the country.
ALCOHOL POLICYExcise tax on beer / wine / spirits Yes / Yes / Yes
National legal minimum age for off-premise sales of alcoholic beverages (selling) (beer / wine / spirits) 18 / 18 / 18
National legal minimum age for on-premise sales of alcoholic beverages (serving) (beer / wine / spirits) 18 / 18 / 18
Restrictions for on-/off-premise sales of alcoholic beverages:Time (hours and days) / location (places and density) Yes & No / YesSpecifi c events / intoxicated persons / petrol stations No / No / No
National maximum legal blood alcohol concentration (BAC) when driving a vehicle (general / young / professional), in % 0.08 / ZT / 0.08
Legally binding regulations on alcohol advertising / product placement Yes / Yes
Legally binding regulations on alcohol sponsorship / sales promotion Yes / Yes
ZT = Zero tolerance.
HEALTH CONSEQUENCES
MORBIDITY
Prevalence estimates (12-month prevalence for 2004): Males Females
Alcohol use disorders (15+ years) 1.79% 0.19%
ALL CAUSE MORTALITY
Age-standardized deaths rates, 15+ years (per 100,000 population)
2000 2001 2002 2003 2004 2005
M F M F M F M F M F M F
Liver cirrhosisNo information availableRoad traffi c
accidents (1)
Data source: WHO Mortality Database, data as reported by countries (1) refer to transport accidents.
11%BEER
3%SPIRITS
RECORDED ADULT (15+) ALCOHOL CONSUMPTION BY TYPE OF ALCOHOLIC BEVERAGE (IN % OF PURE ALCOHOL), 2005
Beer includes malt beers. Wine includes wine made from grapes. Spirits include all distilled beverages. Other includes one or several other alcoholic beverages, such as fermented beverages made from sorghum, maize, millet, rice, or cider, fruit wine, fortifi ed wine, etc.
Adult (15+) per capita consumption, average 2003–2005 (in litres of pure alcohol):
Recorded 4.8
Unrecorded 2.0
Total 6.8
WHO African Region 6.2
United Republic of Tanzania (the)
Total population: 39 459 000 ➤ Population 15+ years: 56% ➤ Population in urban areas: 25% ➤ Income group (World Bank): Low income
Data source: United Nations, data range 1990–2006.
SOCIOECONOMIC CONTEXT
Robust estimate of fi ve-year change in recorded adult(15+) per capita consumption,2001–2005:
INCREASE
➤ STABLE DECREASE
INCONCLUSIVE
<1%WINE
86%OTHER
6
4
2000 2002 2004
Litre
s of
pur
e al
coho
lENLARGEMENT OF RECORDED ADULT (15+) PER CAPITA CONSUMPTION, 2000–2005
Year
2003 20052001
ALCOHOL CONSUMPTION Population data (refer to the population 15 years and older and are in litres of pure alcohol).
15
5
10
1961 1966 1976Li
tres
of p
ure
alco
hol
1991
RECORDED ADULT (15+) PER CAPITA CONSUMPTION, 1961–2005
Year
1971 1981 2001
20
19961986 2006
Change in data source from 2000
Beer Wine Spirits Other Total
2
0
0
AFRO CPs FINAL.indd 44AFRO CPs FINAL.indd 44 13/01/2011 08:4513/01/2011 08:45
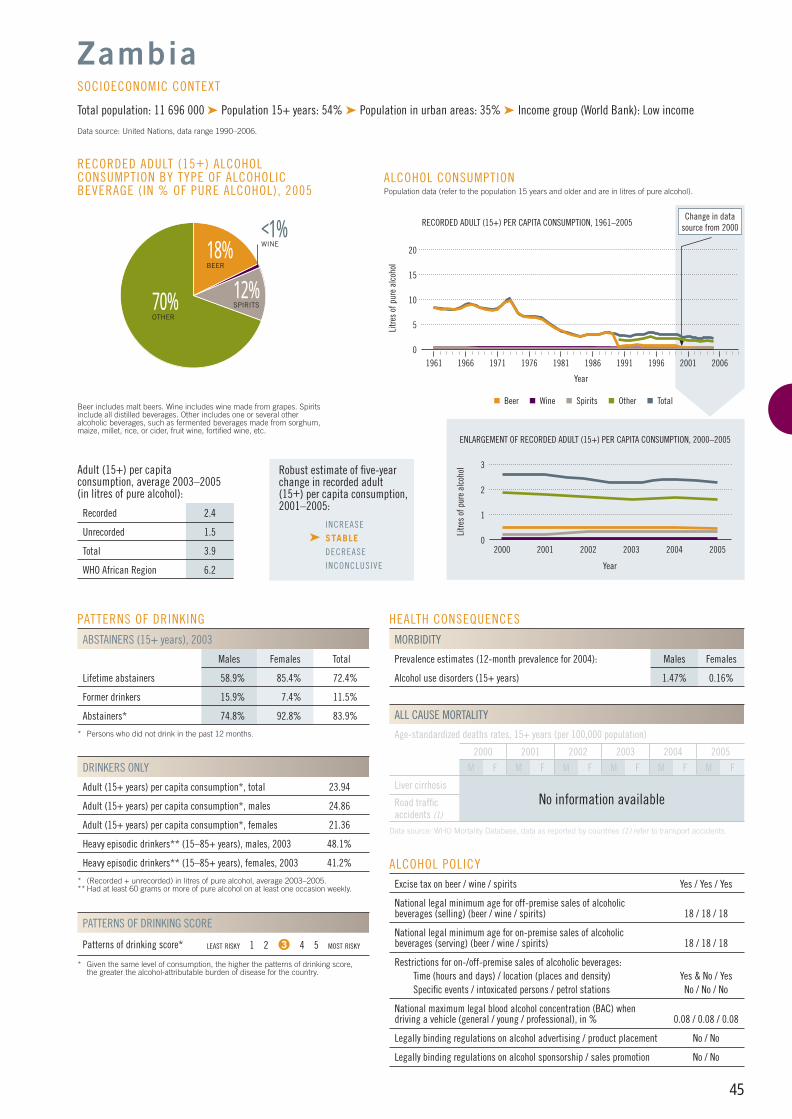
45
PATTERNS OF DRINKING
ABSTAINERS (15+ years), 2003
Males Females Total
Lifetime abstainers 58.9% 85.4% 72.4%
Former drinkers 15.9% 7.4% 11.5%
Abstainers* 74.8% 92.8% 83.9%
* Persons who did not drink in the past 12 months.
DRINKERS ONLY
Adult (15+ years) per capita consumption*, total 23.94
Adult (15+ years) per capita consumption*, males 24.86
Adult (15+ years) per capita consumption*, females 21.36
Heavy episodic drinkers** (15–85+ years), males, 2003 48.1%
Heavy episodic drinkers** (15–85+ years), females, 2003 41.2%
* (Recorded + unrecorded) in litres of pure alcohol, average 2003–2005.** Had at least 60 grams or more of pure alcohol on at least one occasion weekly.
PATTERNS OF DRINKING SCORE
Patterns of drinking score* LEAST RISKY 1 2 3 4 5 MOST RISKY
* Given the same level of consumption, the higher the patterns of drinking score, the greater the alcohol-attributable burden of disease for the country.
ALCOHOL POLICYExcise tax on beer / wine / spirits Yes / Yes / Yes
National legal minimum age for off-premise sales of alcoholic beverages (selling) (beer / wine / spirits) 18 / 18 / 18
National legal minimum age for on-premise sales of alcoholic beverages (serving) (beer / wine / spirits) 18 / 18 / 18
Restrictions for on-/off-premise sales of alcoholic beverages:Time (hours and days) / location (places and density) Yes & No / Yes Specifi c events / intoxicated persons / petrol stations No / No / No
National maximum legal blood alcohol concentration (BAC) when driving a vehicle (general / young / professional), in % 0.08 / 0.08 / 0.08
Legally binding regulations on alcohol advertising / product placement No / No
Legally binding regulations on alcohol sponsorship / sales promotion No / No
HEALTH CONSEQUENCES
MORBIDITY
Prevalence estimates (12-month prevalence for 2004): Males Females
Alcohol use disorders (15+ years) 1.47% 0.16%
ALL CAUSE MORTALITY
Age-standardized deaths rates, 15+ years (per 100,000 population)
2000 2001 2002 2003 2004 2005
M F M F M F M F M F M F
Liver cirrhosisNo information availableRoad traffi c
accidents (1)
Data source: WHO Mortality Database, data as reported by countries (1) refer to transport accidents.
18%BEER
70%OTHER
12%SPIRITS
RECORDED ADULT (15+) ALCOHOL CONSUMPTION BY TYPE OF ALCOHOLIC BEVERAGE (IN % OF PURE ALCOHOL), 2005
Beer includes malt beers. Wine includes wine made from grapes. Spirits include all distilled beverages. Other includes one or several other alcoholic beverages, such as fermented beverages made from sorghum, maize, millet, rice, or cider, fruit wine, fortifi ed wine, etc.
Adult (15+) per capita consumption, average 2003–2005 (in litres of pure alcohol):
Recorded 2.4
Unrecorded 1.5
Total 3.9
WHO African Region 6.2
Zambia
Total population: 11 696 000 ➤ Population 15+ years: 54% ➤ Population in urban areas: 35% ➤ Income group (World Bank): Low income
Data source: United Nations, data range 1990–2006.
SOCIOECONOMIC CONTEXT
Robust estimate of fi ve-year change in recorded adult(15+) per capita consumption,2001–2005:
INCREASE
➤ STABLE DECREASE
INCONCLUSIVE
<1%WINE
3
1
2000 2002 2004
Litre
s of
pur
e al
coho
l
ENLARGEMENT OF RECORDED ADULT (15+) PER CAPITA CONSUMPTION, 2000–2005
Year
2003 20052001
ALCOHOL CONSUMPTION Population data (refer to the population 15 years and older and are in litres of pure alcohol).
15
5
10
1961 1966 1976
Litre
s of
pur
e al
coho
l
1991
RECORDED ADULT (15+) PER CAPITA CONSUMPTION, 1961–2005
Year
1971 1981 2001
20
19961986 2006
Change in data source from 2000
Beer Wine Spirits Other Total
2
0
0
AFRO CPs FINAL.indd 45AFRO CPs FINAL.indd 45 13/01/2011 08:4513/01/2011 08:45
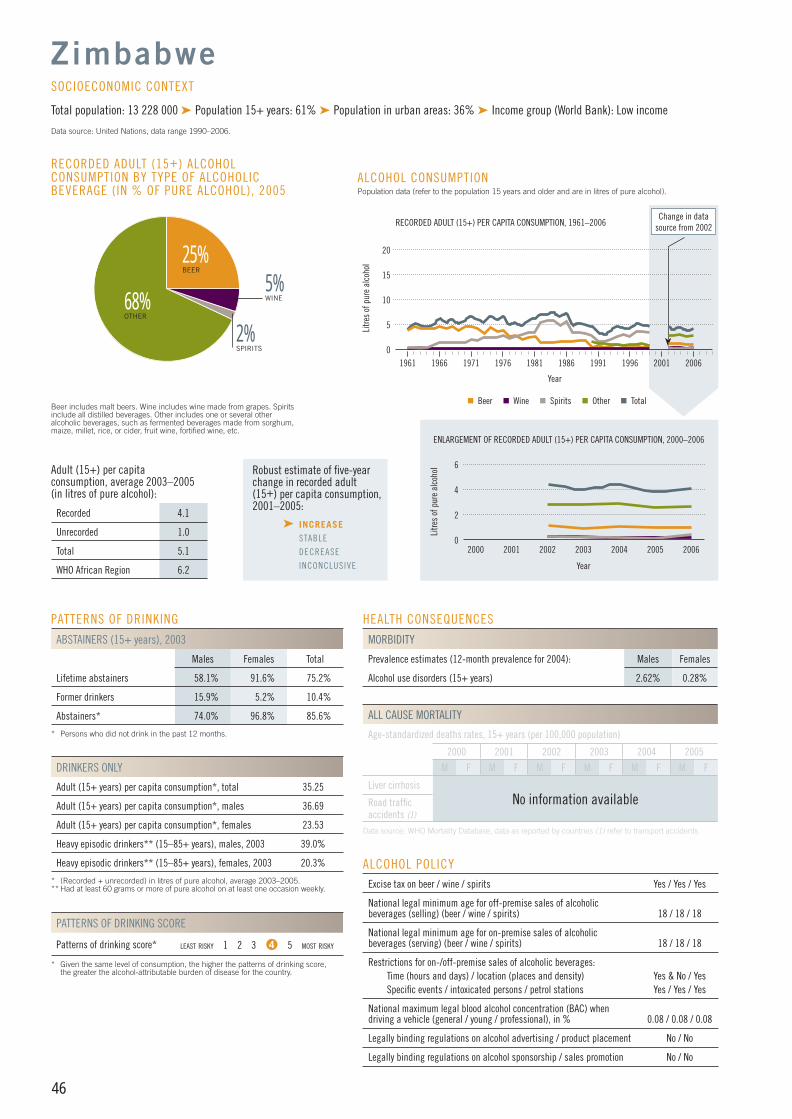
46
PATTERNS OF DRINKING
ABSTAINERS (15+ years), 2003
Males Females Total
Lifetime abstainers 58.1% 91.6% 75.2%
Former drinkers 15.9% 5.2% 10.4%
Abstainers* 74.0% 96.8% 85.6%
* Persons who did not drink in the past 12 months.
DRINKERS ONLY
Adult (15+ years) per capita consumption*, total 35.25
Adult (15+ years) per capita consumption*, males 36.69
Adult (15+ years) per capita consumption*, females 23.53
Heavy episodic drinkers** (15–85+ years), males, 2003 39.0%
Heavy episodic drinkers** (15–85+ years), females, 2003 20.3%
* (Recorded + unrecorded) in litres of pure alcohol, average 2003–2005.** Had at least 60 grams or more of pure alcohol on at least one occasion weekly.
PATTERNS OF DRINKING SCORE
Patterns of drinking score* LEAST RISKY 1 2 3 4 5 MOST RISKY
* Given the same level of consumption, the higher the patterns of drinking score, the greater the alcohol-attributable burden of disease for the country.
ALCOHOL POLICYExcise tax on beer / wine / spirits Yes / Yes / Yes
National legal minimum age for off-premise sales of alcoholic beverages (selling) (beer / wine / spirits) 18 / 18 / 18
National legal minimum age for on-premise sales of alcoholic beverages (serving) (beer / wine / spirits) 18 / 18 / 18
Restrictions for on-/off-premise sales of alcoholic beverages:Time (hours and days) / location (places and density) Yes & No / YesSpecifi c events / intoxicated persons / petrol stations Yes / Yes / Yes
National maximum legal blood alcohol concentration (BAC) when driving a vehicle (general / young / professional), in % 0.08 / 0.08 / 0.08
Legally binding regulations on alcohol advertising / product placement No / No
Legally binding regulations on alcohol sponsorship / sales promotion No / No
HEALTH CONSEQUENCES
MORBIDITY
Prevalence estimates (12-month prevalence for 2004): Males Females
Alcohol use disorders (15+ years) 2.62% 0.28%
ALL CAUSE MORTALITY
Age-standardized deaths rates, 15+ years (per 100,000 population)
2000 2001 2002 2003 2004 2005
M F M F M F M F M F M F
Liver cirrhosisNo information availableRoad traffi c
accidents (1)
Data source: WHO Mortality Database, data as reported by countries (1) refer to transport accidents.
25%BEER
5%WINE
RECORDED ADULT (15+) ALCOHOL CONSUMPTION BY TYPE OF ALCOHOLIC BEVERAGE (IN % OF PURE ALCOHOL), 2005
Beer includes malt beers. Wine includes wine made from grapes. Spirits include all distilled beverages. Other includes one or several other alcoholic beverages, such as fermented beverages made from sorghum, maize, millet, rice, or cider, fruit wine, fortifi ed wine, etc.
Adult (15+) per capita consumption, average 2003–2005 (in litres of pure alcohol):
Recorded 4.1
Unrecorded 1.0
Total 5.1
WHO African Region 6.2
Zimbabwe
Total population: 13 228 000 ➤ Population 15+ years: 61% ➤ Population in urban areas: 36% ➤ Income group (World Bank): Low income
Data source: United Nations, data range 1990–2006.
SOCIOECONOMIC CONTEXT
Robust estimate of fi ve-year change in recorded adult(15+) per capita consumption,2001–2005:
➤ INCREASE STABLE
DECREASE
INCONCLUSIVE
2%SPIRITS
68%OTHER
6
4
2000 2002 2004
Litre
s of
pur
e al
coho
lENLARGEMENT OF RECORDED ADULT (15+) PER CAPITA CONSUMPTION, 2000–2006
Year
2003 2005 20062001
ALCOHOL CONSUMPTION Population data (refer to the population 15 years and older and are in litres of pure alcohol).
15
5
10
1961 1966 1976Li
tres
of p
ure
alco
hol
1991
RECORDED ADULT (15+) PER CAPITA CONSUMPTION, 1961–2006
Year
1971 1981 2001
20
19961986 2006
Change in data source from 2002
Beer Wine Spirits Other Total
2
0
0
AFRO CPs FINAL.indd 46AFRO CPs FINAL.indd 46 13/01/2011 08:4513/01/2011 08:45