african association for public administration and...
TRANSCRIPT

1
AFRICAN ASSOCIATION FOR PUBLIC ADMINISTRATION AND MANAGEMENT
28TH AAPAM ANNUAL ROUNDTABLE CONFERENCE, ARUSHA , TANZANIA
4TH – 8TH DECEMBER 2006
THEME: TOWARDS AN EFFECTIVE DELIVERY OF PUBLIC SERVICES IN AFRICA
TOPIC: THE BENEFITS OF PUBLIC PRIVATE PARTNERSHIP IN HEALTH SERVICE DELIVERY: EVIDENCE FROM SELECTED CASES IN
TANZANIA
By: Josephat itika and Eleuther Mwageni
Mzumbe University

2
Abstract
Public- Private Partnership (PPP) is collaboration between the public and the private sector
organisations (private for profit, faith based, or NGOs). Collaborations could be in the form of
institutional arrangements ranging from simple collaboration, joint venture, direct contract,
lease and concession. Collaboration between the government and the private sector is expected
to create a window of opportunity for addressing problems of both government and market
failures in social service provision.
The paper attempts to measure the benefits of partnerships between the local authority and the
private sector in health service delivery in eleven cases from Tanzania.
The findings reveal that despite inadequacies in regulatory framework, the emerging evidence
shows that PPP in health service provision is the right policy choice because of several
deliverables. It significantly reduces distance to the health centre, service time, and service
costs. Furthermore, it increases capacity to deliver services, profits, information sharing and
service reliability.

3
1.0 INTRODUCTION
In Tanzania, Public Private Partnership (PPP) as philosophy as well as policy in public service
delivery appeared in government policy papers in the mid 1980s but more commonly in the
1990s through 2000s as part of government reforms to improve public service delivery including
health. Health services delivery in Tanzania is provided through a decentralised three tier
pyramidal system. That is national, regional and district levels whereby in the later there are
health centres and dispensaries. (MoH, 2003). Different organs work together to ensure access
and quality health care in the country. The Ministry of Health is responsible for policy,
governance, and financing, quality assurance while the President’s Office Regional
Administration and Local Government is the implementer. At the national level, Executive
Boards manage hospitals. At the regional and district levels, there are Regional and Council
Health Boards respectively where private health service providers have representation.
The are strong arguments that partnership between the government and the private sector creates
windows of opportunities for improved service access, variety, service time, and reliability,
increased value for money, capital, innovation, transparency and accountability in spending
public money ( Lowden, 1999; Humes 1999; Birmingham, 2000; Austin, 2000; Fiszbein, 2000;
1999; World Bank, 2004).
Despite this positivist outlook, there are also frequent warnings that PPPs are not necessarily
without problems particularly in the developing countries where the “right” institutional
arrangements might be absent or not effective and hence making PPPs beneficial to some
partners at the expense of others (Humes, 1999; Reich, 2000; Hartwich et al; 2003).
In Tanzania, the most recent study on PPP in health service delivery commissioned by the
Ministry of Health and Presidents’ Office Regional Administration and Local Government
(MoH/PORALG (2005), and Tanzania Joint Annual Review, MoH (2005) have jointly
recommended many areas that require thorough study under the umbrella of PPP. So far there is

4
inadequate knowledge on the extent to which stakeholders involved in PPPs in health service
delivery have benefited or may have benefited.
The paper assesses the benefits of PPPs in health service delivery for key stakeholders by
focusing on eleven cases in Tanzania. The paper uses data obtained through in-depth interviews
of key informants from the Ministry of Health (now Ministry of Health and Social Welfare-
MoH&SW) and the Ministry of Regional Administration and Local Government (PORALG). It
included officials responsible for policy reforms and facilitation of public private partnership
initiatives. In addition, data were collected from the heads of departments, programme
coordinators, managers, and owners of private hospitals, dispensaries, and the general staff. In
addition, questionnaire was used to get opinion from 165 health service beneficiaries who were
targeted by PPP projects.
Other sources of data were from two focus group discussions, which were selected randomly,
and one community meeting which was organised by the village chairperson.
Several important documents were also reviewed. They included the Dodoma Municipal Profile,
Comprehensive Health Plan, Strategic Plan, Private Hospitals Act 2002, MTUHA (Mfumo wa
Taarifa za Uendeshaji wa Huduma za Afya Na 2.1), the Public Procurement Act, 2001, 2004,
and Local Government Act, 1982. Others were various policy guidelines from MoH and
technical reports on PPPs in the health sector.
2.0 CONCEPTUAL ISSUES IN PPPs
PPP has no common meaning to all people and has evolved over years by taking different forms,
PPP should be seen as ranging from simple cooperation, more participatory approaches to
complete privatisation. Such collaborations could cover a wide range of possible relationships,
from contracting the private sector to supply goods, or services, e.g. cleaning, and catering
through to arrangements where a private company may manage a public hospital. Figure 1 is
constructed for the purpose of illustration.
Figure 1: Public Private Partnership Continuum models

5
Source: Adapted from Bennet et al., (1999:8), Brinkerhoff (2002:20-22), Sohail et al.,
(2003:2-5)
Figure 1 denotes a continuum of PPPs models from a situation where the private sector is fully
passive to where the public role becomes fully passive but in between the two extremes, there are
many models including joint venture, direct contract, lease and concession. In appreciation of the
fluid nature of PPPs, Sohail et al., (2003:2) comment that “… indeed, the types of partnership
that have emerged most often in developing countries contain many variations not found in
conventional definitions…. Many partnerships in developing contexts occur to respond to gaps
in municipal service provision.”
In response to public service delivery gaps for example in a municipality, the starting point could
be simple cooperation between the government or government organ and private sector. This
could include a situation in which local authority invites ideas from the business community to
improve bylaws for regulating certain service delivery mechanisms. In this case, the role of the
private sector is just simple and advisory. Joint venture entails the government forming a joint
venture with a private party where they take joint responsibility for the overall delivery package.
The parties have to balance their roles, interests, risks, and hence strong accountability
mechanisms, transparency in decision-making, equitable costing and spread of financial profit
and risks are necessary. Direct service contract is another PPP arrangement. The government
may contract out public service to the private provider to an agreed level within defined
specifications, payments, and for a fixed period. Contracts are awarded through competitive
Simple cooperation
Direct contract
Lease ConcessionJoint venture
Full Public PPP CONTINUUM Full Private

6
bidding. The government retains ownership of all assets and is accountable to the public for
ultimate performance. Under lease arrangement, the government leases infrastructure and
facilities to a private firm for a fixed period of time, but the government remains the owner and
hence accountable for such public service delivery. The private sector will have exclusive rights
to operate, bears commercial risks for non-payment of fees, and charges by the service
beneficiaries. Concessions entail the Municipality transferring full responsibility for service
delivery in a specified area in a specified time to a concessionaire. This will include all
construction, maintenance, collection and management. The concessionaire is responsible for all
capital investment to build, upgrade or extend the system. The client will generally retain
responsibility for establishing and monitoring performance standards, regulation of price and
service volumes. The main difference with lease is the additional responsibility for capital
investment.
3.0 THE EVOLUTION AND DEVELOPMENT OF PPPS IN TANZANIA
3.1 Policy and regulatory trends
Prior to independence, Tanzania’s health system concentrated in urban areas and services were
essentially curative in nature (URT, 2001). In 1967, the Arusha Declaration stated that the
government would provide free medical care to all citizens (with an exception of Grade One and
Two). This was made part of community rights and one of the fundamental indicators of social
developments (MoH, 2002). As part of that declaration, an expansion strategy for facilities
especially in the rural areas was adopted. The results of the strategy were impressive. By 1978, a
health facility was located within 10 kilometers of 90 percent of the population (Benson, 2001).
In line with its free-health-for-all policy, private for-profit health services were forbidden. The
private sector for profit was particularly hit hard by the enactment of Private Hospitals
Regulations Act of 1977, which banned health services for profit in the country.
Private not for profit health facilities operated by non-governmental organisations, however,
continued to provide a large share (currently about one-third) of the health services in the
country with subsidies from the government. Despite inadequate revenues, the government
adhered to these policies throughout the 1970s and 1980s. Under funding led to shortages in
supplies of drugs, deterioration of facilities, low staff morale, and poor quality of care (MoH,

7
1998). The importance of the private sector in health service delivery and the move towards
market-based economic reforms resulted into the establishment of Private Hospitals Regulation
Amendment Act of 1991. It also facilitated the re-establishment of private medical and dental
services with the approval of the Ministry of Health in 1991 (Wyss et al., 2000, URT, 2002).
The demand for better services and the need to improve the population’s health status,
particularly the rural poor, led to the development of Health Sector Reform (HSR) proposals in
1994 and in 1996, and a health sector reform strategy was approved by the government. Later
Health Sector Reform Plan of Action for 1996-1999 was also endorsed. The action plan included
six strategies: decentralisation, improvement of central health systems, health management,
financing, human resources, and partnership.
In 1999, the HSR Programme of Work 1999-2002 and Action Plan was developed. In order to
put more power at the local level, Local Government Reform (URT, 1998) was passed as policy
instrument to facilitate decision making and accountability in municipalities and district councils
on public health related matters amongst others. These policy documents have made clear the
government intent to work closely with the private sector for profit and NGOs.
Therefore, health sector reforms are closely linked with Local Government Reforms, which
aimed at decentralising personnel, planning, and financing decisions of service delivery to the
districts. As of January 2000, 35 districts had been decentralised. Forty-five more districts were
to be decentralised by January 2001 and the remaining ones by January 2002 (URT, 2001).
Districts are responsible for staffing decisions and set service priorities. District Health Plans are
funded through block grants, in addition to donor funding provided through the basket financing
mechanism. A significant emphasis has been placed on human resource development to ensure
adequate planning and budgeting of services. This is part of capacity building initiatives which is
stirred by on going reforms. Implementation of health plans is monitored and additional funding
is withheld if standards of achievement are not accomplished. The Ministry of Health and Social
Welfare retains control of policy, regulatory, and strategic functions and also continues to
provide certain essential services including immunisations, family planning, and the treatment of
chronic illnesses, tuberculosis, and leprosy.

8
In the year 2000, the Ministry of Health (MoH) developed key performance indicators and
outputs for assessing public private partnership in health service delivery in the country. The
indicators cover the degree of collaboration among partners in terms of numbers, contribution of
private and public sector in partnerships and client satisfaction rate. The performance of PPPs
was expected to be through the following implementation strategies and time frames.
• Policy and legal review to be completed by 2001
• Mechanisms for promoting PPPs discipline in place by 2002
• Guidelines to enable private providers qualify for government support in place and
operational by 2002.
• Mechanisms for joint inspection of health facilities in place by 2002 (MoH, 2000:36).
The Public Procurement Act, 2001 has been used to guide outsourcing of public services to the
private sector, but it was not meant for PPPs as such. The government passed yet another Public
Procurement Act in 2004. Section 59 (3) of the Act outlines procedures to be undertaken for
solicited or unsolicited PPP projects. However, although it puts a strong ground for transparent
procurement system, since the model used emerged from privatisation model rather than PPPs
where emphasis is on sharing of resources, risks, rewards and responsibilities much of these
issues are under represented. Therefore, there are still cries for specific government regulations
and an organ for managing PPPs in the country. More recently in July 2005, the government
inaugurated health boards which were delayed since 2001 (MoH/PORALG, 2001) with the
objective among others to promote PPPs at the local authorities level.
4. 0. THE BENEFITS OF PPPS IN HEALTH SERVICE DELIVERY
4.1 AN OVERVIEW
PPPs in the selected cases were formal, semi formal and informal arrangements for sharing
available resources and expertise between the local authorities and private sector organisations
for direct or implied benefits to the key stakeholders. Partnership was solicited either by the local
authority or the private sector with the objective of sharing available resources mainly for the
improvement of Reproductive and Child Health Services and HIV AIDS programmes. The types

9
of resources shared include staff, expertise, offices, furniture and fittings, transport, cash for
salaries and other necessities, vaccines and related accessories. Therefore, there is no systematic
and formalised system for engaging into partnerships. In recognition of the need to have strong
regulatory framework, the Ministry of Health and Social Welfare has of recent established
technical working group to facilitate the establishment of robust PPPs including preparation of
service contracts. However, although there is no regulatory mechanism in place which
established the existing PPPs some of which are older than a decade, still the key stakeholders
have benefited from the collaborations. The following section focuses on the benefits accrued to
each key part in PPP projects.
4.2 THE BENEFITS TO SERVICE BENEFICIARIES
Distance to the health service provision centre
The first measure of performance was on the distance travelled to the service provision points.
The respondents were asked to compare the distance travelled to get services in the government
and in the private centres where services were offered through PPPs. In order to reduce over and
under estimations due to lack of knowledge by the respondents, actual kilometers were
calculated from the municipal and town maps. In addition, more informed people in the areas
were asked to give distance estimates from different villages and streets to the health centre,
hospital or dispensary whichever was applicable. At times, mileage was recorded when visiting
service provision points by using a hired car. Table 1 shows the mean distances travelled and
reduced.
Table 1: Average reduced distance to the health centre (N = 165)
No Health provider Mean distance
travelled
(Kms)
Mean reduced
distance (Kms)
1 Case 1 1.80 0.43
2 Case 2 10.40 19.80
3 Case 3 2.20 0.46
4 Case 4 8.26 7.36
5 Case 5 7.20 7.00

10
6 Case 6 14.00 9.46
7 Case 7 9.70 6.13
8 Case 8 3.73 1.53
9 Case 9 42.00 0.00
10 Case 10 15.53 11.06
11 Case 11 25.33 13.00
Average 12.74 10.56
Source: Survey Data, 2005
The estimates in Table 1 are for go and return journeys. This does not consider shortcuts, which
were sometimes used particularly when they could walk or use bicycles. However, even with
such shortcuts, the results did not seem to influence substantially the results because on average,
the saving was not more than one kilometre. The results show that PPP was able to reduce
distance travelled to the health service by an average of 19.80 to 0.43 Kilometres in Case 2 and
Case 1 respectively. Although, beneficiaries from Case 9 seem to have been travelling a distance
of about 42 kilometres (to and fro), this was only implied than direct. They would have travelled
that distance if the government in the town centre delivered services. Since the services were
home based and for the first time through PPP, it means the reduced distance was 0.00.
Service access costs
Secondly, service cost reduction (money) is one of the key reasons for a PPP option. Since, the
services under PPP were free, and people were not forced to buy other services from the private
providers, and also it was not possible to get genuine figures for the costs of other services
sought, the most common cost element that could fairly be assessed was transport component.
Reduction in distance has one far-reaching implication. Since most of the beneficiaries were
ordinary poor people, shorter distance also meant, even those who could not afford to pay for car
transport could hire bicycles or walk and spend the money for other necessities including
laboratory tests or drugs. Table 2 shows money saved out of transport.
Table 2: Service costs recovered from transport (N = 165).
No Health provider Mean (Tshs)
1 Case 1 0.00
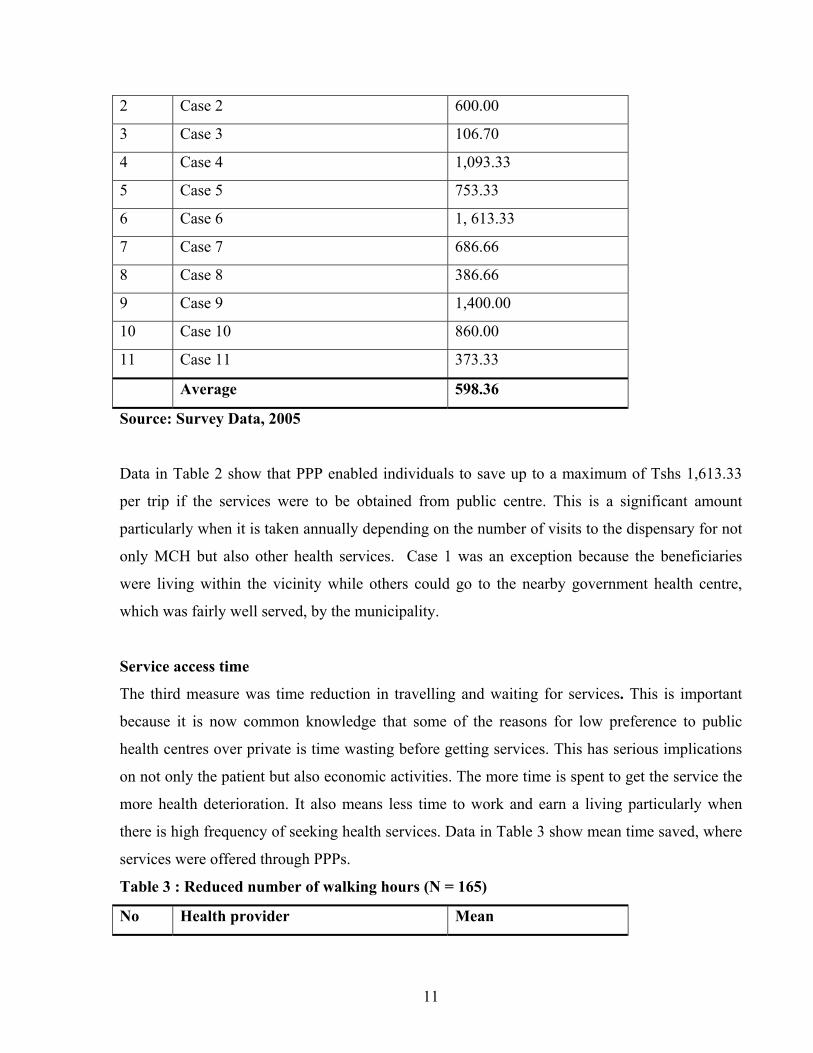
11
2 Case 2 600.00
3 Case 3 106.70
4 Case 4 1,093.33
5 Case 5 753.33
6 Case 6 1, 613.33
7 Case 7 686.66
8 Case 8 386.66
9 Case 9 1,400.00
10 Case 10 860.00
11 Case 11 373.33
Average 598.36
Source: Survey Data, 2005
Data in Table 2 show that PPP enabled individuals to save up to a maximum of Tshs 1,613.33
per trip if the services were to be obtained from public centre. This is a significant amount
particularly when it is taken annually depending on the number of visits to the dispensary for not
only MCH but also other health services. Case 1 was an exception because the beneficiaries
were living within the vicinity while others could go to the nearby government health centre,
which was fairly well served, by the municipality.
Service access time
The third measure was time reduction in travelling and waiting for services. This is important
because it is now common knowledge that some of the reasons for low preference to public
health centres over private is time wasting before getting services. This has serious implications
on not only the patient but also economic activities. The more time is spent to get the service the
more health deterioration. It also means less time to work and earn a living particularly when
there is high frequency of seeking health services. Data in Table 3 show mean time saved, where
services were offered through PPPs.
Table 3 : Reduced number of walking hours (N = 165)
No Health provider Mean

12
1 Case 1 0.29
2 Case 2 5.20
3 Case 3 0.53
4 Case 4 4.73
5 Case 5 2.00
6 Case 6 3.20
7 Case 7 1.30
8 Case 8 0.78
9 Case 9 9.8
10 Case 10 3.50
11 Case 11 4.20
Average 3.23
Source: Survey Data, 2005
The data in Table 3 show that the mean number of hours saved were highest in Case 9 and
lowest in Case 1. These results are normal because it is also noted in table 1 that, mean distances
travelled were long and shortest respectively.
PPPs have potentials for reducing the number of service seekers in one centre by spreading them
to other nearby centres. The implication is that there will be less people to attend and hence less
waiting hours for patients. Respondents were asked to compare time spent in public service
centre against the private one. Data in Table 4 show the mean numbers of hours saved because of
getting services through PPP.
Table 4: Reduced number of waiting hours for services (N = 165)
No Health provider Mean
1 Case 1 0.43
2 Case 2 2.06
3 Case 3 0.17
4 Case 4 2.31
5 Case 5 1.18
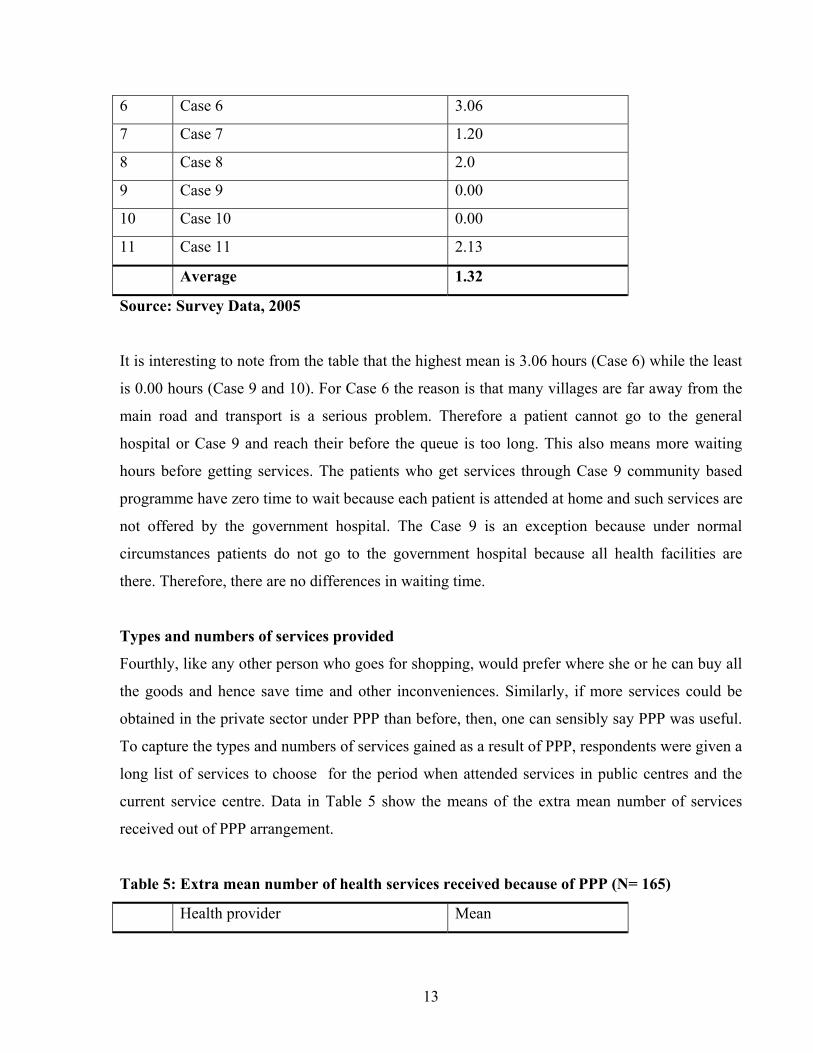
13
6 Case 6 3.06
7 Case 7 1.20
8 Case 8 2.0
9 Case 9 0.00
10 Case 10 0.00
11 Case 11 2.13
Average 1.32
Source: Survey Data, 2005
It is interesting to note from the table that the highest mean is 3.06 hours (Case 6) while the least
is 0.00 hours (Case 9 and 10). For Case 6 the reason is that many villages are far away from the
main road and transport is a serious problem. Therefore a patient cannot go to the general
hospital or Case 9 and reach their before the queue is too long. This also means more waiting
hours before getting services. The patients who get services through Case 9 community based
programme have zero time to wait because each patient is attended at home and such services are
not offered by the government hospital. The Case 9 is an exception because under normal
circumstances patients do not go to the government hospital because all health facilities are
there. Therefore, there are no differences in waiting time.
Types and numbers of services provided
Fourthly, like any other person who goes for shopping, would prefer where she or he can buy all
the goods and hence save time and other inconveniences. Similarly, if more services could be
obtained in the private sector under PPP than before, then, one can sensibly say PPP was useful.
To capture the types and numbers of services gained as a result of PPP, respondents were given a
long list of services to choose for the period when attended services in public centres and the
current service centre. Data in Table 5 show the means of the extra mean number of services
received out of PPP arrangement.
Table 5: Extra mean number of health services received because of PPP (N= 165)
Health provider Mean

14
1 Case 1 4.06
2 Case 2 2.00
3 Case 3 0.93
4 Case 4 3.06
5 Case 5 2.73
6 Case 6 2.46
7 Case 7 3.93
8 Case 8 3.20
9 Case 9 7.35
10 Case 10 0.00
11 Case 11 1.20
Average 2.78
Source: Survey Data, 2005
Data in Table 5 show that HIV AIDS patients who were receiving health services through Case
Programme were the most beneficiaries because of social welfare component. Data in Table 6
shows the benefits.
Table 6: List of items contributed by Case 9
S/N Contributions Value in Tshs
1 50 kgs of maize flour 5500
2 12 kgs of beans 5000
3 12 Kgs of groundnuts 6000
4 Cash 4000
5 Mosquito net (provided only once) 3500
6 Second hand clothes and school
uniforms for children
3000
Total value 27,000
Source: In-depth interviews and observations during field visits
15
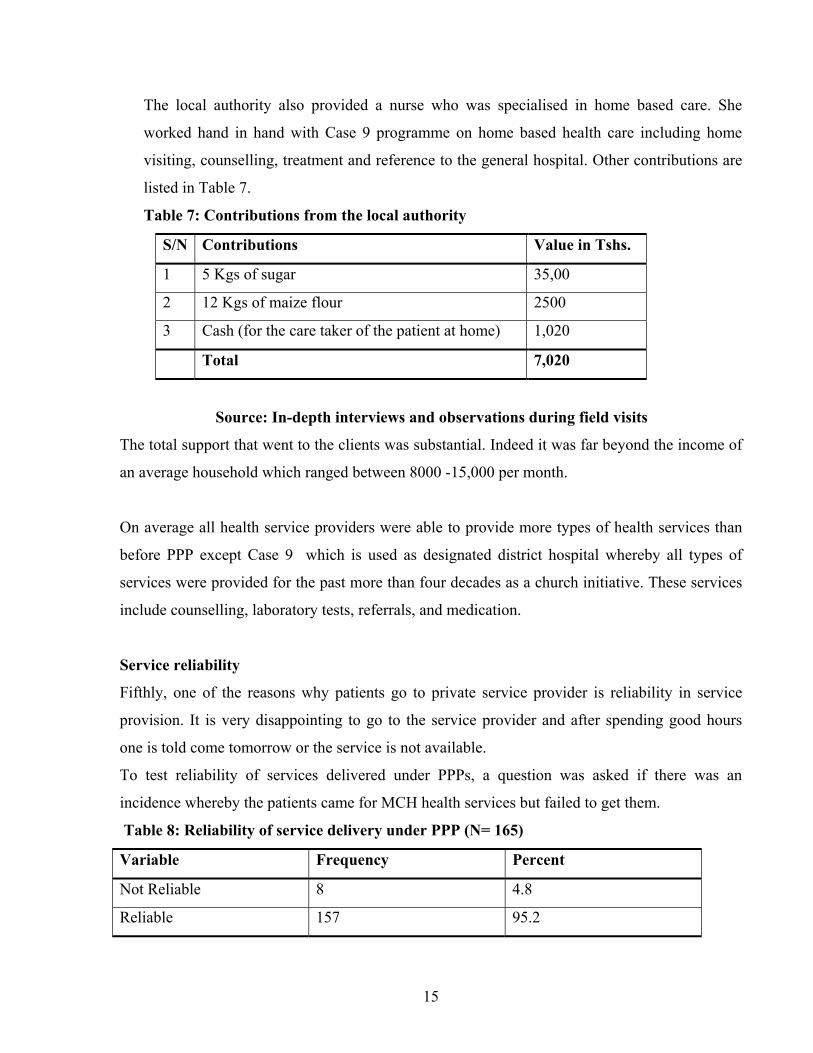
The local authority also provided a nurse who was specialised in home based care. She
worked hand in hand with Case 9 programme on home based health care including home
visiting, counselling, treatment and reference to the general hospital. Other contributions are
listed in Table 7.
Table 7: Contributions from the local authority
S/N Contributions Value in Tshs.
1 5 Kgs of sugar 35,00
2 12 Kgs of maize flour 2500
3 Cash (for the care taker of the patient at home) 1,020
Total 7,020
Source: In-depth interviews and observations during field visits
The total support that went to the clients was substantial. Indeed it was far beyond the income of
an average household which ranged between 8000 -15,000 per month.
On average all health service providers were able to provide more types of health services than
before PPP except Case 9 which is used as designated district hospital whereby all types of
services were provided for the past more than four decades as a church initiative. These services
include counselling, laboratory tests, referrals, and medication.
Service reliability
Fifthly, one of the reasons why patients go to private service provider is reliability in service
provision. It is very disappointing to go to the service provider and after spending good hours
one is told come tomorrow or the service is not available.
To test reliability of services delivered under PPPs, a question was asked if there was an
incidence whereby the patients came for MCH health services but failed to get them.
Table 8: Reliability of service delivery under PPP (N= 165)
Variable Frequency Percent
Not Reliable 8 4.8
Reliable 157 95.2

16
Total 165 100
Source: Survey Data, 2005
Data in Table 8 show that 95.2% of the patients never missed services. These results are very
encouraging. Service reliability could also encourage health service seekers to attend the same
health service provider even for service not provided through collaboration. Data in Table 9
reveal that more than 65% of respondents attended the same health service provider than others.
Table 9: Frequency of attending health services in the private sector ( N= 165)
Frequency of attendance Frequency Percent
Always 38 23.0
Frequently 70 42.4
Nearly frequently 18 10.9
Rarely 8 4.8
Not at all 31 18.8
Total 165 100.0
Source: Survey Data, 2005
There is evidence that PPP has not only attracted significant number of mothers seeking
Reproductive and Child Health services but also other health services. Data in Table 10 show
that when mothers had other health problems preferred to go to the private rather than
government health service provision centres.
Table 10: Frequency of attending services under PPPs for different health problems (N=
165)
Attendance to private
health service provider
Frequency Percent
Always 28 17.0
Frequently 58 35.1
Nearly frequently 32 19.4
Rarely 28 17.0
Not at all 19 11.5

17
Total 165 100.0
Source: Survey Data, 2005
4.3 PPPS BENEFITS ON THE PART OF HEALTH SERVICE PROVIDERS
Capacity to deliver
The first expected measure of PPP performance to the service providers is capacity to deliver
better services. The task here was to find out whether each stakeholder was able to improve own
capacity to deliver services after engaging in collaborations. The units of assessment were
changes in the technical knowledge of staff, tools, equipments and other supplies, geographical
spread of the services and number of customers saved.
It is hard to imagine a situation whereby there is partnership, which does not improve capacity of
the partners to deliver services. However, to measure the extent to which capacity to deliver
affected service delivery, the best way is to look at the numbers of service beneficiaries over
years. Data collected through MTUHA system for four years shows fluctuating trends for TT2,
Measles and pregnancies in each PPP Case reported.
Figure 2: Number of service beneficiaries

18
Source: Processed from MTUHA Reports, 2001-2004
Figure 2 shows fluctuating patterns in the trends of number of service beneficiaries for TT2,
Measles and Pregnancies for four years. It is shown that almost 2500 people benefited as a result
of capacity building through collaborations. However, there is declining trends towards 2004
onwards. It is not clear why the trend is descending although inconsistent supply of vaccines and
poor recording keeping were the major reasons.
Service costs
The second component in assessing the benefits of PPPs is on cost reduction on the part of
service providers. This was not possible because, Firstly, it was difficult to estimate the real
market values of knowledge gained through training, service rooms, furniture and fittings,
informal consultations frequently done with local authority nurses, supervision, stationery and
provision of information.
Trend for total vaccinations
0
500
1000
1500
2000
2500
2001 2002 2003 2004
Year
Number of beneficiaries
CASE 1
CASE 2
CASE 3
CASE 4
CASE 5
CASE 6
CASE 7
CASE 8
CASE 9 CASE 10 CASE 11

19
Secondly, with the exception of Case 1 and 9 which were receiving cash and or materials other
health service providers were not ready to admit that service costs were reduced because they did
not charge for services under PPPs. Indeed the opposite was claimed by the key informants to be
the case including paying for electricity bills, preparing and sending MTUHA reports, and office
and furniture maintenance. Few examples can be cited as cases of cost reduction.
a) Private staff were trained almost freely and hence reduced training costs for staff
b) All stationeries for medical purposes were supplied freely by the local authority
c) In Case 1, the municipality supplemented the costs of electricity and salaries
d) From the private service providers’ point of view, the average cost for hiring an empty
service room and the furniture were estimated at Tshs 30,000 per month that was paid in
directly by the private sector. This was a benefit to the government.
e) The average cost of electricity for the service room per month paid by the private service
provider was Tshs 5,000. This was also cost reduction on the part of the government
f) It was also estimated that the average maintenance cost of the service room was
100,000 per year. This includes painting, repairs, and replacement of furniture and
fittings. This was gain on the part of the government.
It was not possible to get average costs for supervision, record keeping and submission to the
municipality. Therefore, with the examples one can confidently say that generally PPP reduced
costs of service delivery if were to be provided by the private sector or the local authority alone.
Profits
The third benefit accrued to the private sector was in the form of profits. This is a grey area and
the most difficult to deal with because of two major reasons.
Firstly, there was no private health service providers were not ready to admit that there were
improved profits. Unfortunately, there were no possibilities to get access to the books of
accounts.
Secondly, even if such books were accessible, it was impractical to link the profit with PPP
services because such services were not meant for profit. Complaining that PPP was not
profitable, one owner/manager said:

20
…There was a time we had joint diagnose and treatment of STIs. The municipality
provided reagents while I conducted laboratory tests under subsidised rates. The
patient paid an average of Tshs. 300 instead of Tshs. 500, which is the market
rate.
Although the manager was right, there is also hidden argument that the more the customers the
more the marginal profits.
In addition, position was not supported by not for profit service providers because they were
offering cheaper services ranging from Tshs. 200 to 300. Therefore, TShs 300 might have been
the break-even point.
In the absence of raw data on profits made, the alternative approach is to look at the
circumstances surrounding service delivery. Assuming that all businesspersons are rational and
motivated by profit and profits would increase with increased number of customers, deductive
method can be used to predict the profit scenario. The establishment of MCH unit increased the
number of customers. It is wise to assume that some customers who go for MCH services will
ask for other services which have to be paid for. Therefore, the identification of the number of
services offered outside MCH can give a general picture about profits.
Questionnaire survey has shown that the a good number of mothers who attended MCH services
also received other services for a charge.
Table 11: Types of services for profit
S/N Types of services Frequency Percent
1 Laboratory tests 118 71.8
2 Medical examination 96 58.2
3 Medical prescriptions 94 57.0
4 Bought drugs 93 56.4
5 Referrals 79 47.9
Source: Survey Data, 2005

21
Their family members also went to the private service providers and paid for other services. It
was also interesting to find out that largely, even the family members who did not need services
under PPPs were also seeking other health services from private health service providers. Data in
Table 12 show the frequencies of attendance.
Table 12: Frequency of attendance of family members to the private health service
providers
Attendance by other
family members
Frequency Percent
Always 27 16.4
Frequently 47 28.5
Rarely frequently 31 18.8
Rarely 29 17.6
Not at all 31 18.8
Total 165 100.0
Source: Survey data October 2005
According to Table 12 more than 60% of the family members of the respondents attended the
same service providers for a variety of health problems, which required medical examination and
treatment. Therefore, there is no doubt that profits were made out of consultation fees, laboratory
tests and selling of drugs.
Information
The fourth important aspect in PPPs is information sharing. Information was shared through
seminars and in few instances during meetings. The rest of information received by the private
sector was in the form of guidelines and instructions as directed by the ministry of health. The
role of the private providers in informational aspect was record keeping and submission to the
local authority as prescribed by MTUHA guidelines. Although, this information could have been
a strong base in the collaboration, it was one-way traffic. There was no feedback. Complaining
on lack of feedback, one official from the private sector said;

22
… we have been sending them reports for years but we do not what do they do
with them and how we help (Quoted from the manager of private hospital-
translated from Kiswahili)
There was no information sharing through research, consultancy and publication.
5.0 CONCLUSIONS AND POLICY IMPLICATIONS
The paper supports the argument that PPP is the right policy option for improved health service
delivery to the people as far as simple health service delivery is concerned. There is no evidence
to suggest that more complex PPP arrangements including joint venture, direct contract, lease,
and concession can equally produce such positive results. Indeed, we need to do more work to
improve these simple collaborations but much more into more formalised PPP arrangements.
Much as this direction is desirable we need to do ore homework in order to address the following
challenges:
Firstly, although the intention of government to use PPP as an alternative modality for public
health service provision is fairly well documented in health sector policy reforms since the mid
1990s through strategy “7”, it has remained a vision with limited impact at the local level where
PPPs are initiated and managed because, the open ended- ness of the policy has created vacuum
in PPP ownership. The ministry of health and social welfare has passed the responsibility for
implementation of PPPs to the local authorities while most resources for making substantial
PPPs tick remain under the control of the former. Therefore more decentralisation of resources is
important.
Secondly, in order to have strong PPPs with some kind of uniformity and consistency but also
allowing room for flexibility that is required in classical PPP models, it is important to have one
responsible unit for managing PPPs for all ministries and sectors in the country. The unit will
have specialised personnel in PPPs. In order to give the unit enough powers and support from
top-level government officials, it could be housed in the treasury, prime ministers’ or presidents’
office. The role of the unit will be to develop general regulatory framework for PPPs, monitoring
and provision of technical support services. Among others, the regulatory framework will

23
establish ministerial and sectoral PPP units that will be responsible for identifying suitable areas
for partnerships, conduct feasibility studies, facilitate establishments, monitor and evaluate. The
national unit will work closely with municipal and district level PPP units. Such units will
coordinate PPP initiatives under support from the national level unit. Such views were also held
jointly by CRISL Advisory Infrastructure, Economic and Social Research Foundation (ESRF)
and National Business Initiative (NBI) in their institutional and legal review of PPPs in Tanzania
two years ago.
Thirdly, any strong PPP arrangement has to be legalised through the establishment of specific
laws through review of the existing laws. The Ministry of Health and Social Welfare has moved
a good step in this direction including drafting service contracts for health services. This will
help to standardise PPP arrangements in the country. However, there might be the need to make
such regulatory framework relevant and responsive to some special situations in local authorities
through enactment of bylaws by the relevant local authorities. This is a good strategy, but its
utility may be limited if capacity building in terms of developing appropriate levels of
knowledge, skills, motivation and resources will not be addressed simultaneously.
Fourthly, and in relation to the above issues, having appropriate PPP policy and regulatory
framework is one thing, but making it effective is another. Strong PPP requires that each partner
to have certain sustained strengths including financial, technical and human resources to fulfil
agreed obligations and be ready to account for whatever happens. As a matter of policy, while
the current PPP programmes go on, it is high time to renegotiate with development partners so
that some contractual relationships give opportunities for channelling resources directly to PPPs
projects at the local authority level.
Fifthly, strong PPP arrangement has to be diversified and sustainable. So far the achievements in
PPPs are attributed by large to the development partners who support different health projects
which include reproductive and child health, HIV Aids, tuberculosis etc. Diversification of areas
and types of PPPs, effective management and sustainability cannot be attained through donor
dependency.

24
REFERENCES
Austin, J (2000) How non profits and business succeed through strategic alliance. Jossey-Bass.
San Francisco. 390pp.
San Francisco
Bennett, E., Peter, G., and Brad, G., (1999) “Public Private for the Urban Environment. Options
and Issues”. PPPUE Working Paper Series. Vol. 1. New York: Yale University
Benson, J, S. (2001) The impact of privatization on access in Tanzania. Social Science and
Medicine (52): 1903-1915
Birmingham, K (2000) The need for public private partnerships. NATURE MED. 5, 481
Fiszbein, A. (2000). Public- private partnership as a strategy for local capacity building: Some
suggestive evidence from Latin America. In Collins (Ed.) Applying public administration in
development. Guide posts to the future. New York: John Willey and Sons Ltd. 328pp
Humes, D., (1999). Globalisation and new development priorities in CDB’S Lending strategy:
ILO Trinidad and Tobago. JZ 69pp
Hartwich, F. Janssen, W. and Tola, J. (2003). Public private partnerships in agro industrial
research recommendations from an expert consultation. ISNAR: Paper (61).
Humes, D., (1999). Globalisation and new development priorities in CDB’S Lending strategy:
ILO Trinidad and Tobago. JZ 69pp
Itika, J. S. (2003) “Public-Private Partnership in Health Services Delivery: Does it make a
Difference to the Public?”: The Experience from Dodoma Municipal Council in Tanzania
Mzumbe University. Unpublished Research Report.
Itika, J. S. (2004) “The Impact of Public Private Partnerships in Health Service Delivery:
Perceptions from Stakeholders”. Economics and Development Papers. No1
Itika, J. S. (2005) “Institutional Arrangements and Accountability in Public Private Partnership
in Health Service Delivery: Cases from Dodoma Municipal Council in Tanzania”. Research
Report. OSSREA.
Mubyazi, G.M. Massaga, J. J, Njunwa, K.J., Mdira, K.Y., Salum, F.M., Alilio, M.S. and
Kamugisha. M.L (2000). Health financing policy reform n Tanzania: Payment mechanisms for
poor and vulnerable groups in Korogwe District. Small Applied Research Report (13).

25
MoH and NIMR (2000). Health sector reform: Situational analysis of 45 councils under phase II
of the joint health sector/local government reform. Dar es Salaam. Unpublished Report 146pp
MoH (2000). Medium term strategic plan 2000-2004. Dar es Salaam
MoH (2002 The speech of the minister of health. [www.tanzania.go.tz/health.html.] 6/8/04
MoH (1998). Health sector reform: Plan of works 1999-2002. Dar es Salaam.
MoH (2005) Report of the 6th Tanzania Joint Annual Health Sector Review. Dar es Salaam.
Health Sector Reform Secretariat
MoH and NIMR (2000). Health sector reform: Situational analysis of 45 councils under phase II
of the joint health sector/local government reform. Dar es Salaam. Unpublished Report
MoH/PORALG (2001) Mwongozo wa Uanzishaji na Uendelezaji wa Bodi za Huduma za Afya za
Halmashauri na Kamati za Afya za Vituo vya Huduma. Dar es Salaam
MoH/PORALG (2005) Public Private Partnership for Equitable Provision of Quality Health
Services. Independent Technical Review on Behalf of the MoH, PORALG and the Government
of Tanzania. Final Report. HERA. Laarstraat
Reich, M,. (2000) Public private partnership for public health. Havard University School of
Public Health, Boston 187pp.
Sohail, M., Plummer, J., Slater, R., and Heymans, C., (2003) Local Government Service
Partnerships: A Background. Commonwealth Local Government Conference. Pretoria,
South Africa.
URT (1998). Local government reform programme: Policy paper on local government reform.
Dar es Salaam
URT(2001). Public expenditure review: Health sector in Tanzania. Dar es Salaam. Government
Printer
World Bank (2004) Making services work for poor people. World Development Report.
Washington: Oxford University Press
Wyss, K, Lorenz, N, and Taner, M. (2000) Health Services in Dar es Salaam. An Overview on
Experiences and Key Issues within the Dar es Salaam Health Project. Dar es Salaam. Swiss
Agency for Development and Cooperation