africa – an opportunity for pharma and patients
TRANSCRIPT

Africa – an opportunity for Pharma and Patients
UNIDO2018
CONFIDENTIAL AND PROPRIETARYAny use of this material without specific permission of McKinsey & Company is strictly prohibited
McKinsey & Company | 1
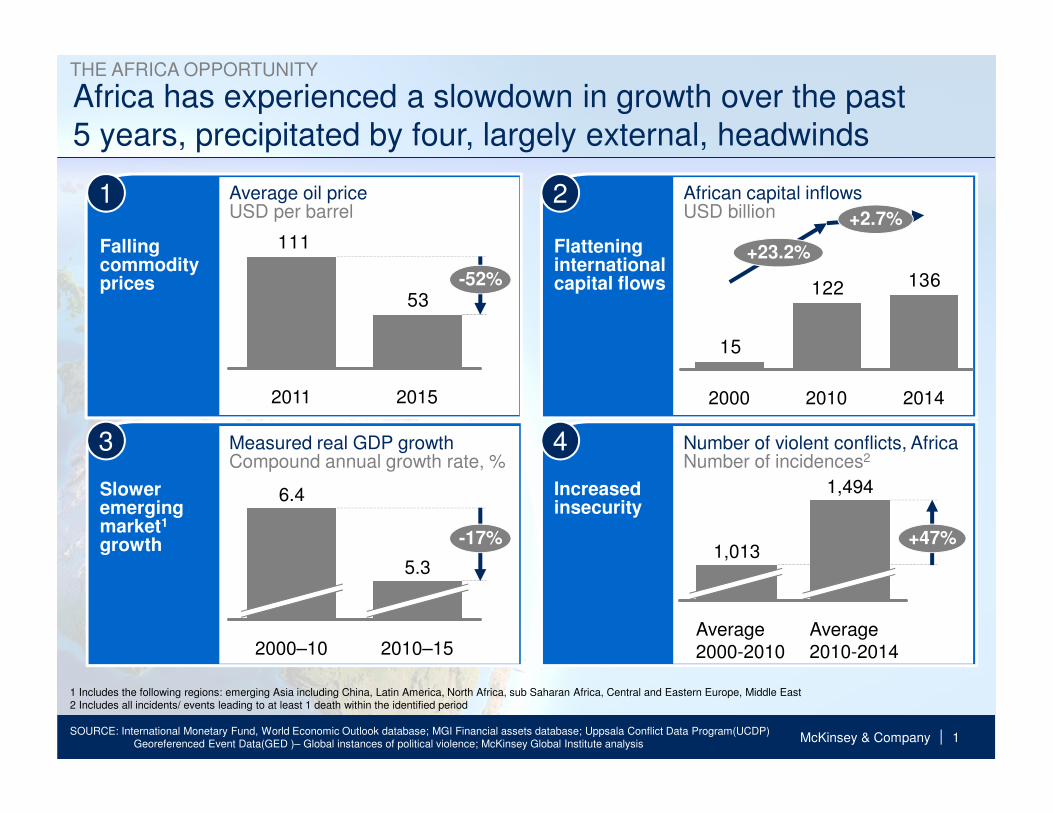
Africa has experienced a slowdown in growth over the past 5 years, precipitated by four, largely external, headwinds
SOURCE: International Monetary Fund, World Economic Outlook database; MGI Financial assets database; Uppsala Conflict Data Program(UCDP) Georeferenced Event Data(GED )– Global instances of political violence; McKinsey Global Institute analysis
1 2
3 4
Falling commodity prices
Slower emerging market1
growth
Flatteninginternationalcapital flows
Increasedinsecurity
53
111
-52%
2011 2015
Average oil priceUSD per barrel
136122
15
+2.7%
2000
+23.2%
20142010
African capital inflowsUSD billion
-17%
2000–10
5.3
2010–15
6.4
1,013
1,494
Average2000-2010
+47%
Average2010-2014
Measured real GDP growthCompound annual growth rate, %
Number of violent conflicts, AfricaNumber of incidences2
1 Includes the following regions: emerging Asia including China, Latin America, North Africa, sub Saharan Africa, Central and Eastern Europe, Middle East2 Includes all incidents/ events leading to at least 1 death within the identified period
THE AFRICA OPPORTUNITY
McKinsey & Company | 2
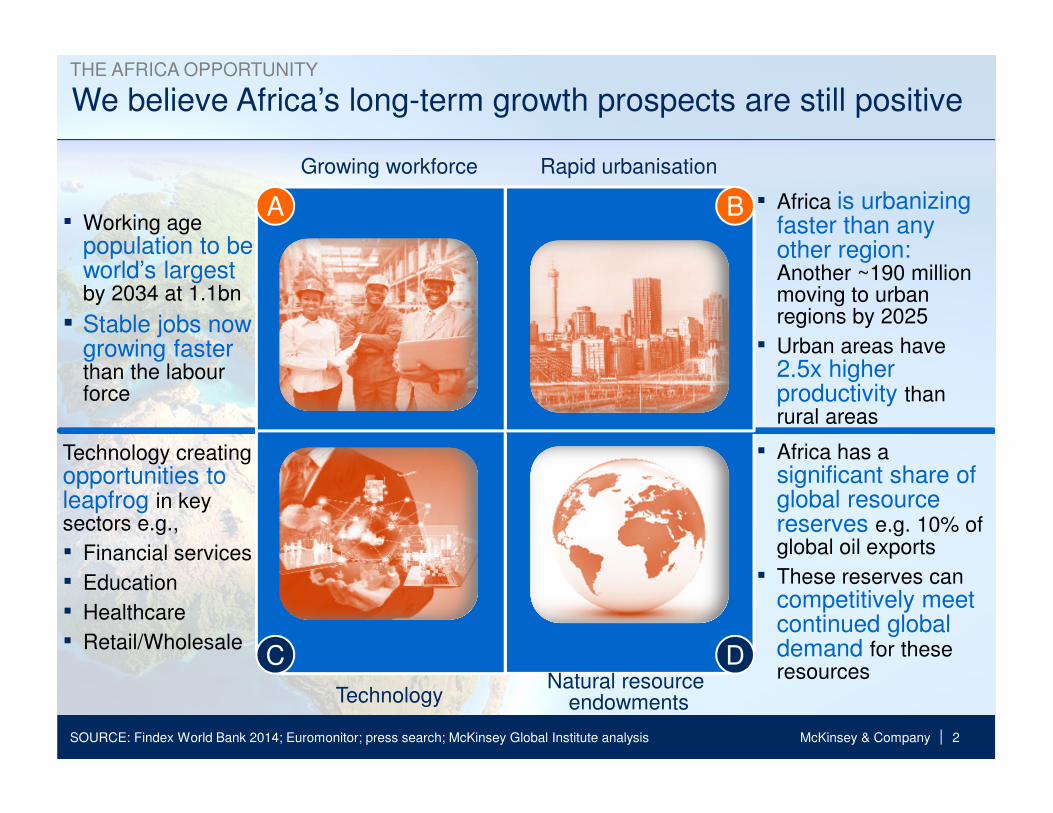
We believe Africa’s long-term growth prospects are still positive
SOURCE: Findex World Bank 2014; Euromonitor; press search; McKinsey Global Institute analysis
▪ Working age population to be world’s largest by 2034 at 1.1bn
▪ Stable jobs now growing faster than the labourforce
▪ Africa is urbanizing faster than any other region: Another ~190 million moving to urban regions by 2025
▪ Urban areas have 2.5x higher productivity than rural areas
▪ Africa has a significant share of global resource reserves e.g. 10% of global oil exports
▪ These reserves can competitively meet continued global demand for these resources
Technology creating opportunities to leapfrog in key sectors e.g.,
▪ Financial services
▪ Education
▪ Healthcare
▪ Retail/Wholesale
Technology
A B
C D
Growing workforce Rapid urbanisation
Natural resource endowments
THE AFRICA OPPORTUNITY
McKinsey & Company | 3
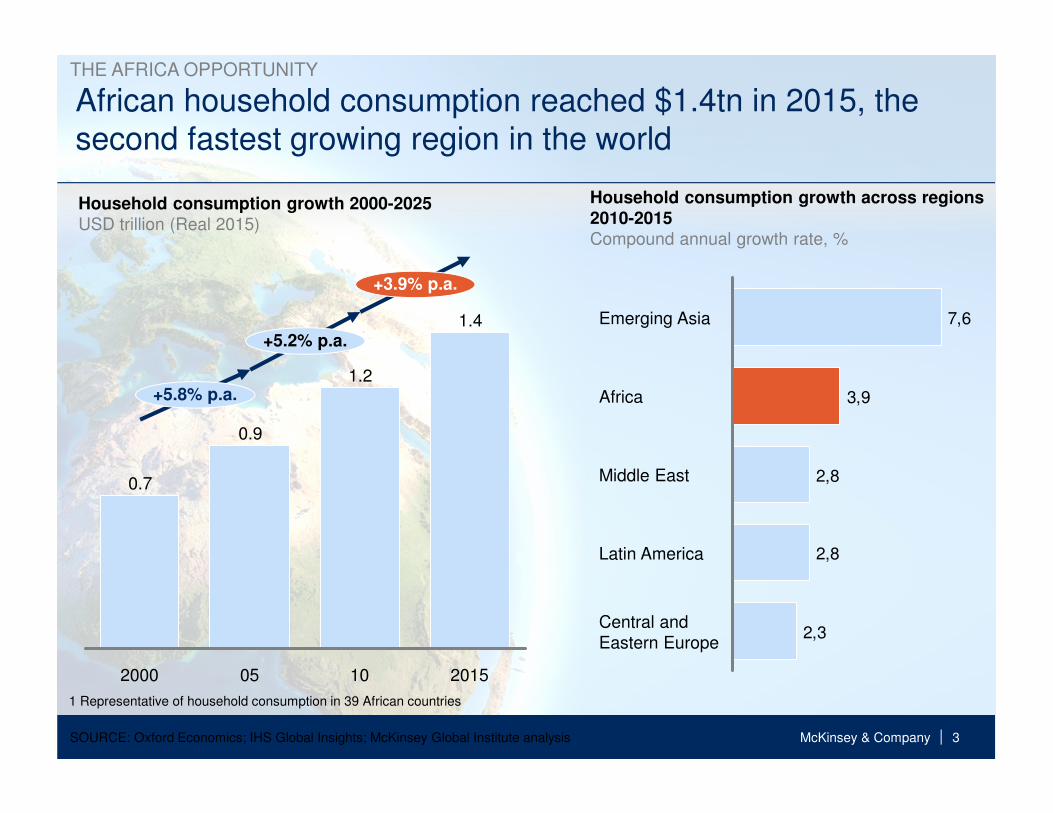
African household consumption reached $1.4tn in 2015, the second fastest growing region in the world
SOURCE: Oxford Economics; IHS Global Insights; McKinsey Global Institute analysis
+5.8% p.a.
+3.9% p.a.
+5.2% p.a.
0.9
1.4
1.2
1005 20152000
0.7
1 Representative of household consumption in 39 African countries
2,3
2,8
2,8
3,9
7,6
Central andEastern Europe
Middle East
Emerging Asia
Latin America
Africa
Household consumption growth across regions 2010-2015Compound annual growth rate, %
Household consumption growth 2000-2025USD trillion (Real 2015)
THE AFRICA OPPORTUNITY
McKinsey & Company | 4
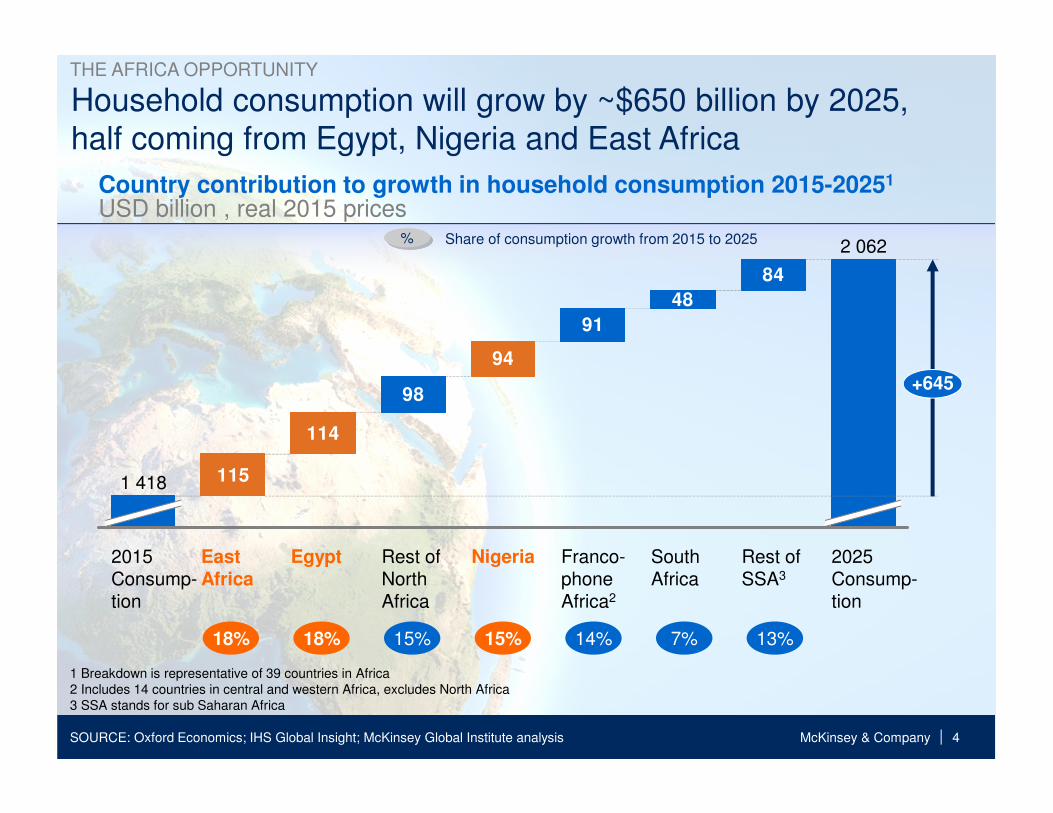
Country contribution to growth in household consumption 2015-20251
USD billion , real 2015 prices
Household consumption will grow by ~$650 billion by 2025, half coming from Egypt, Nigeria and East Africa
SOURCE: Oxford Economics; IHS Global Insight; McKinsey Global Institute analysis
115
98
94
91
48
84
114
+645
NigeriaRest of North Africa
2 062
Rest of SSA3
South Africa
Franco-phone Africa2
2025 Consump-tion
2015 Consump-tion
1 418
East Africa
Egypt
15%18%18% 15% 14% 7% 13%
1 Breakdown is representative of 39 countries in Africa2 Includes 14 countries in central and western Africa, excludes North Africa3 SSA stands for sub Saharan Africa
Share of consumption growth from 2015 to 2025%
THE AFRICA OPPORTUNITY
McKinsey & Company | 5
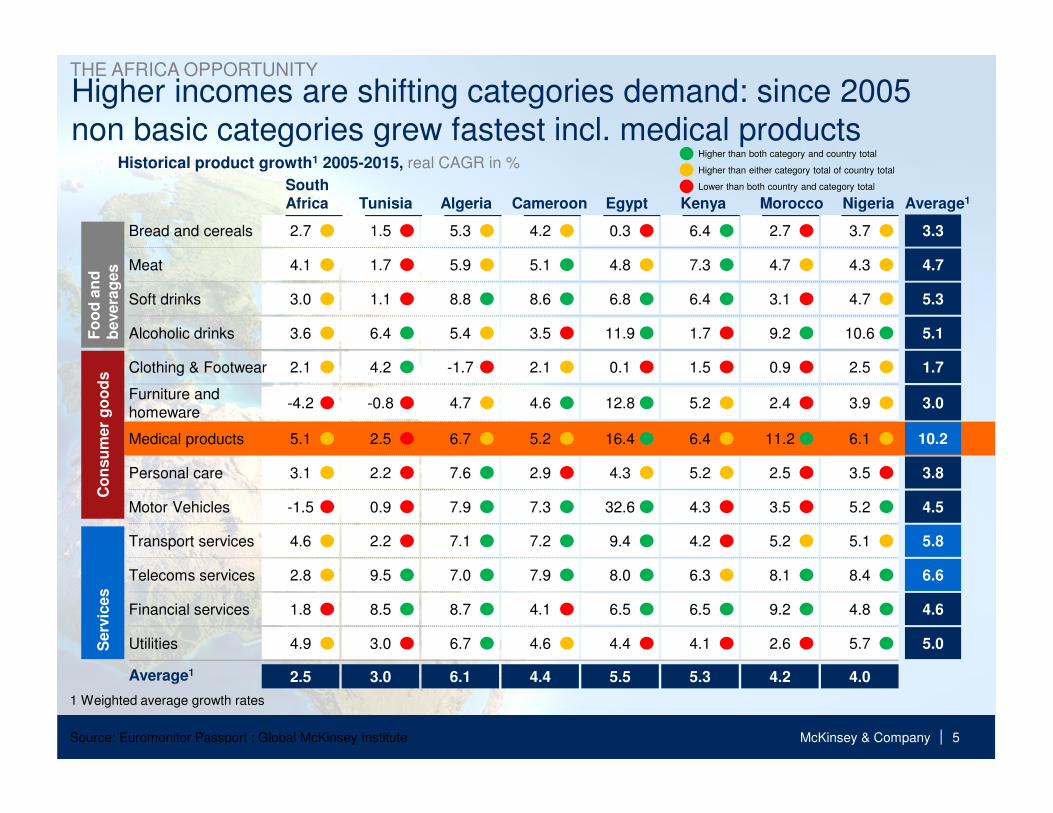
Higher incomes are shifting categories demand: since 2005 non basic categories grew fastest incl. medical products
Source: Euromonitor Passport ; Global McKinsey Institute
Historical product growth1 2005-2015, real CAGR in %
South Africa Tunisia Algeria Cameroon Egypt Kenya Morocco Average1
2.5 3.0 6.1 4.4 5.5 5.3 4.2 4.0
Nigeria
1.5 5.3 4.2 0.3 6.4 2.7 3.7 3.32.7Bread and cereals
1.7 5.9 5.1 4.8 7.3 4.7 4.3 4.74.1Meat
1.1 8.8 8.6 6.8 6.4 3.1 4.7 5.33.0Soft drinks
6.4 5.4 3.5 11.9 1.7 9.2 10.6 5.13.6Alcoholic drinks
4.2 -1.7 2.1 0.1 1.5 0.9 2.5 1.72.1Clothing & Footwear
-0.8 4.7 4.6 12.8 5.2 2.4 3.9 3.0-4.2Furniture and homeware
2.2 7.6 2.9 4.3 5.2 2.5 3.5 3.83.1Personal care
0.9 7.9 7.3 32.6 4.3 3.5 5.2 4.5-1.5Motor Vehicles
2.2 7.1 7.2 9.4 4.2 5.2 5.1 5.84.6Transport services
9.5 7.0 7.9 8.0 6.3 8.1 8.4 6.62.8Telecoms services
8.5 8.7 4.1 6.5 6.5 9.2 4.8 4.61.8Financial services
5.03.0 6.7 4.6 4.4 4.1 2.6 5.74.9Utilities
Average1
Fo
od
an
d
bevera
ges
Co
nsu
mer
go
od
s
1 Weighted average growth rates
Higher than either category total of country total
Higher than both category and country total
Lower than both country and category total
Serv
ices
2.5 6.7 5.2 16.4 6.4 11.2 6.1 10.25.1Medical products
THE AFRICA OPPORTUNITY
McKinsey & Company | 6
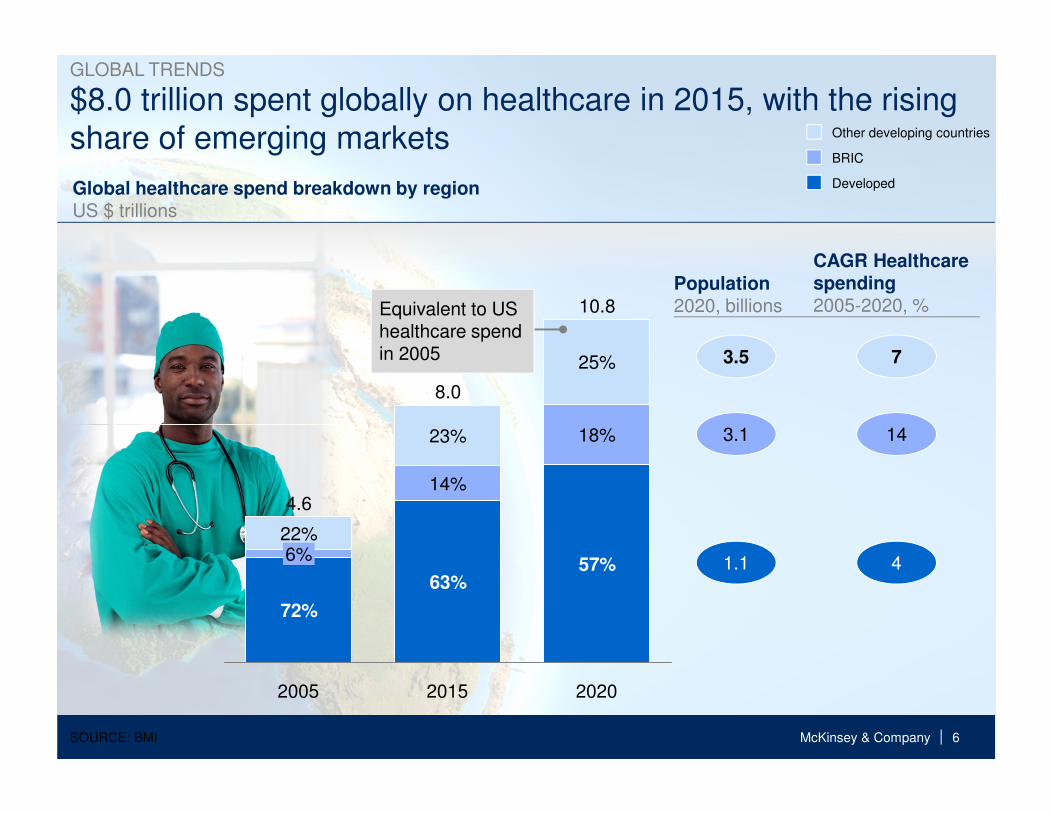
$8.0 trillion spent globally on healthcare in 2015, with the rising share of emerging markets
6%22%
10.8
18%
57%
25%
20202015
8.0
63%
14%
23%
2005
4.6
72%
Global healthcare spend breakdown by regionUS $ trillions
3.5
3.1
1.1
Other developing countries
Developed
BRIC
7
14
4
Population2020, billions
CAGR Healthcare spending2005-2020, %
SOURCE: BMI
GLOBAL TRENDS
Equivalent to US healthcare spend in 2005

McKinsey & Company | 7
+9% CAGR
The pharmaceutical and medical products market experienced strong growth in recent years
SOURCE: BMI; World Bank; McKinsey analysis
1 OTC, Patented, Generics split extrapolated from data available for 60% of pharmaceutical sales
29.4
20142010
20.6
African pharmaceutical and medical products marketUSD billions1
AFRICA OPPORTUNITY

McKinsey & Company | 8
2020Realistic
14.5
3.0
58.7
2020Optimistic
45.1
7.1
52.2
66.5
7.8
2020Base
37.6
2010
6.5
17.5
44.2
Fast growth expected for Africa in the next years
SOURCE: WHO; World Bank; IMF; African Development Bank; BMI; McKinsey Africa Pharma 2020 Model
17.4 35.4 41.8 53.3
Africa salesper capita
USD
Africa pharmaceutical market forecastUSD billions
14%
12%
9%
Top 151
1 South Africa, Egypt, Algeria, Nigeria, Morocco, Angola, Tunisia, Libya, Ethiopia, Sudan, Ghana, Kenya, Cameroon, Tanzania, Uganda
AFRICA OPPORTUNITY
McKinsey & Company | 9
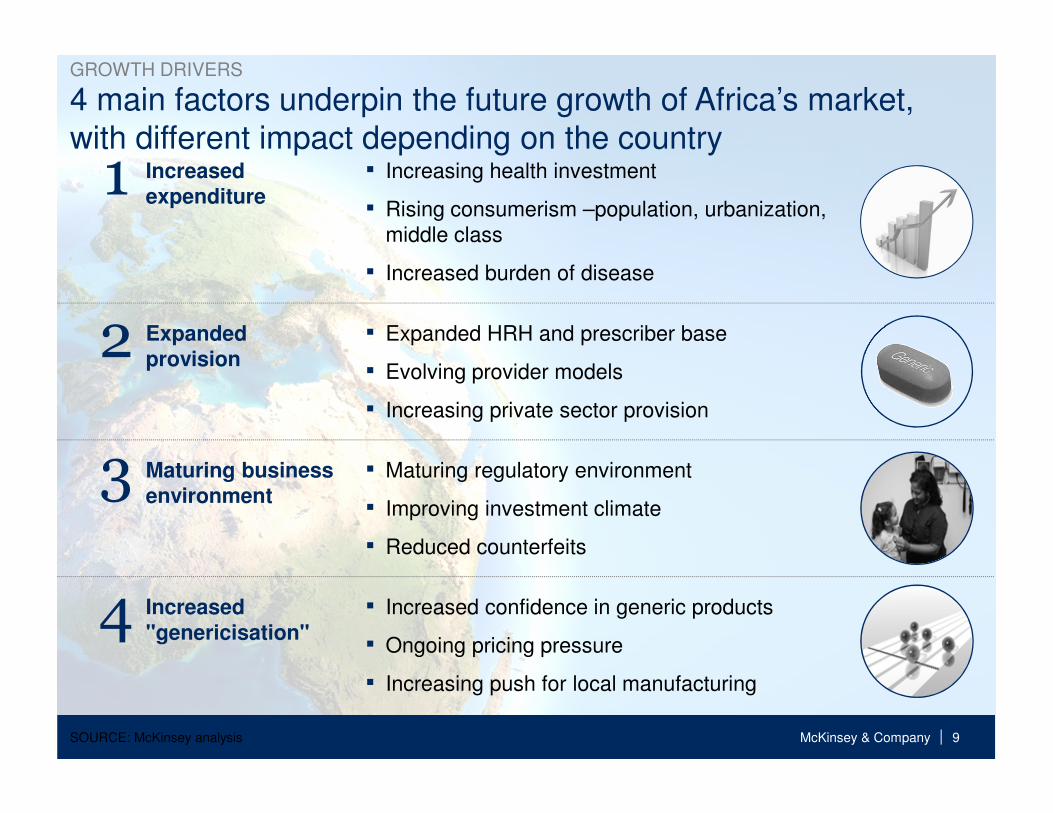
4 main factors underpin the future growth of Africa’s market, with different impact depending on the country
SOURCE: McKinsey analysis
Increased "genericisation"
2
3
4
1
GROWTH DRIVERS
Increased expenditure
▪ Increasing health investment
▪ Rising consumerism –population, urbanization, middle class
▪ Increased burden of disease
Expanded provision
▪ Expanded HRH and prescriber base
▪ Evolving provider models
▪ Increasing private sector provision
Maturing business environment
▪ Maturing regulatory environment
▪ Improving investment climate
▪ Reduced counterfeits
▪ Increased confidence in generic products
▪ Ongoing pricing pressure
▪ Increasing push for local manufacturing
McKinsey & Company | 10
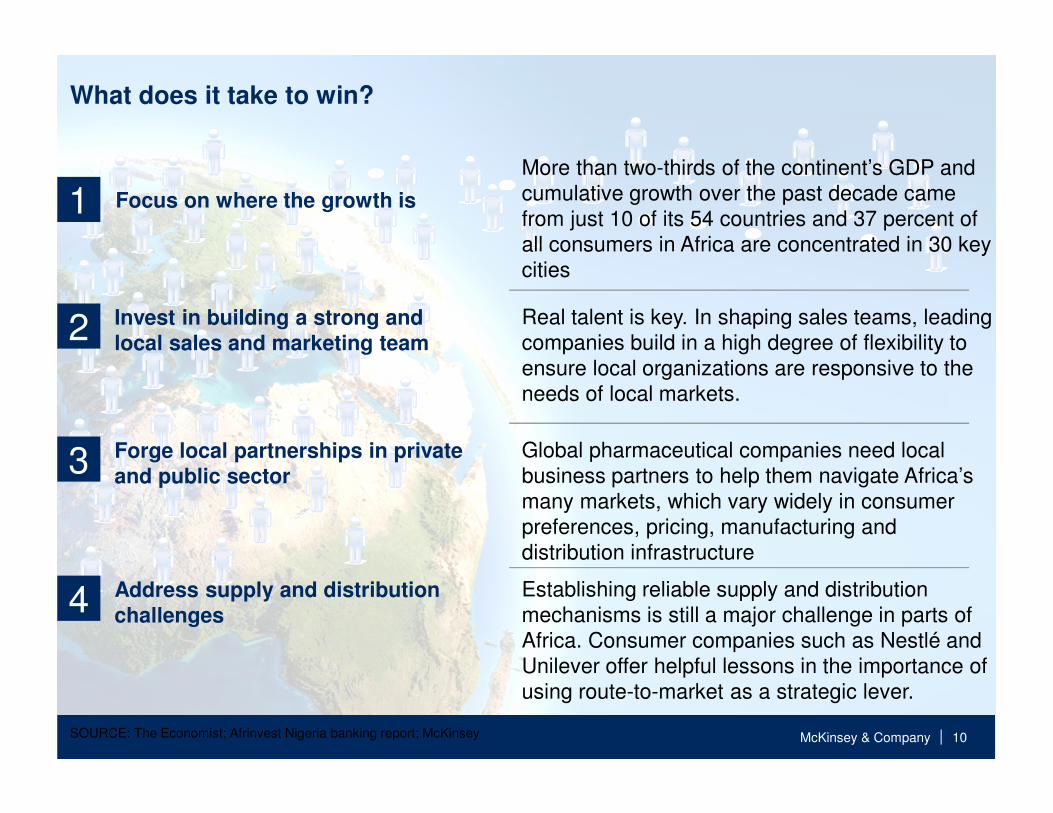
What does it take to win?
SOURCE: The Economist; Afrinvest Nigeria banking report; McKinsey
Focus on where the growth is1More than two-thirds of the continent’s GDP and cumulative growth over the past decade came from just 10 of its 54 countries and 37 percent of all consumers in Africa are concentrated in 30 key cities
Address supply and distribution challenges4 Establishing reliable supply and distribution
mechanisms is still a major challenge in parts of Africa. Consumer companies such as Nestlé and Unilever offer helpful lessons in the importance of using route-to-market as a strategic lever.
Global pharmaceutical companies need local business partners to help them navigate Africa’s many markets, which vary widely in consumer preferences, pricing, manufacturing and distribution infrastructure
Forge local partnerships in private and public sector3
2 Invest in building a strong and local sales and marketing team
Real talent is key. In shaping sales teams, leading companies build in a high degree of flexibility to ensure local organizations are responsive to the needs of local markets.

McKinsey & Company | 11
Nigeria Mozambique
Rwanda
SOURCE: McKinsey CityScope; team analysis
1 Only cities with more than 1 million inhabitants are shown on the maps
▪ Total population: 158m (2010) / 230m (2025)▪ Total number of households: 34m / 61m▪ Number of households > 7,5k income: 3.3m / 9.7m
▪ Total population: 23m (2010) / 32m (2025)▪ Total number of households: 6m / 10m▪ Number of households > 7,5k income: 0.4m / 1.6m
▪ Total population: 11m (2010) / 16m (2025)▪ Total number of households: 2m / 4m▪ Number of households > 7,5k income: 0.8m / 2.6m
Maputo: 72 / 279
Lagos: 735 /2.476 Port Harcourt: 160 / 496
Ibadan: 219 / 665
Benin City: 68 / 240
Abuja: 138 / 490
Kano: 88 / 314
Ogbomosho: 80 / 249
Kaduna: 56 / 205
Kigali: 77 / 269
Focus – Focusing on additional cities1 can be more powerful and rewarding than focusing on opening new countries
Number of households with an income superior to 7.5K USD, ‘000 City: XX / XX 2010 2025
Focus on cities: penetrate large countries (e.g., Nigeria) city-by-city and be clear on trade-off when entering smaller markets
1
McKinsey & Company | 12SOURCE: MGI City Scope
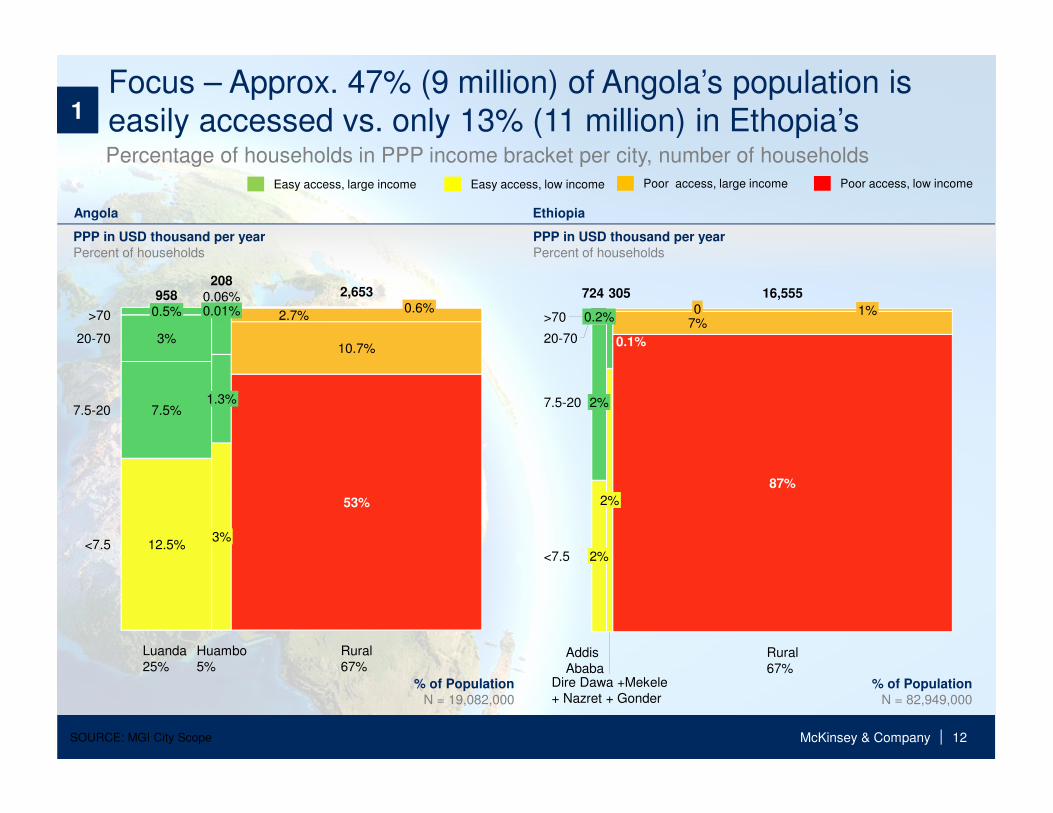
0.6%
20-70
53%
1.3%7.5-20
<7.5
958
Rural67%
>70
2,653
Huambo5%
208
3%
0.01%
Luanda 25%
0.06%
7.5%
3%
0.5% 2.7%
12.5%
10.7%
% of Population
N = 19,082,000
PPP in USD thousand per year
Percent of households
Easy access, large income Easy access, low income Poor access, large income Poor access, low income
20-70
87%
016,555
<7.5
>70
7.5-20
0.1%
AddisAbaba
Dire Dawa +Mekele+ Nazret + Gonder
305
2%
1%0.2%
2%
2%
724
Rural67%
7%
% of Population
N = 82,949,000
PPP in USD thousand per year
Percent of households
EthiopiaAngola
Percentage of households in PPP income bracket per city, number of households
Focus – Approx. 47% (9 million) of Angola’s population is easily accessed vs. only 13% (11 million) in Ethopia’s1
McKinsey & Company | 13SOURCE: International Labour Organization; United Nations World Population Prospects;
McKinsey Global Institute analysis
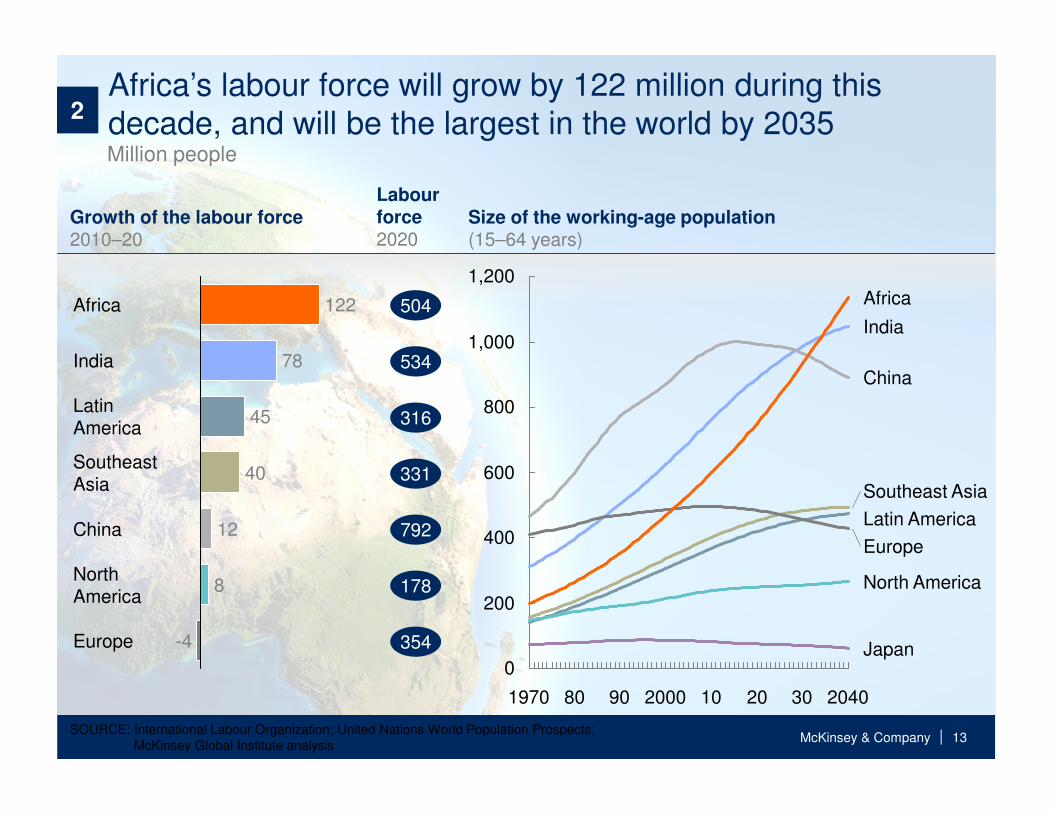
Africa’s labour force will grow by 122 million during this decade, and will be the largest in the world by 2035
8
SoutheastAsia
LatinAmerica
India
China
Europe -4
NorthAmerica
12
40
45
78
122Africa 504
354
178
792
331
316
534
1,200
1,000
800
0
600
400
200
Southeast Asia
Europe
Latin America
China
30
Japan
India
80
North America
101970 20
Africa
2040200090
Growth of the labour force2010–20
Size of the working-age population(15–64 years)
Million people
Labour force 2020
2
McKinsey & Company | 14
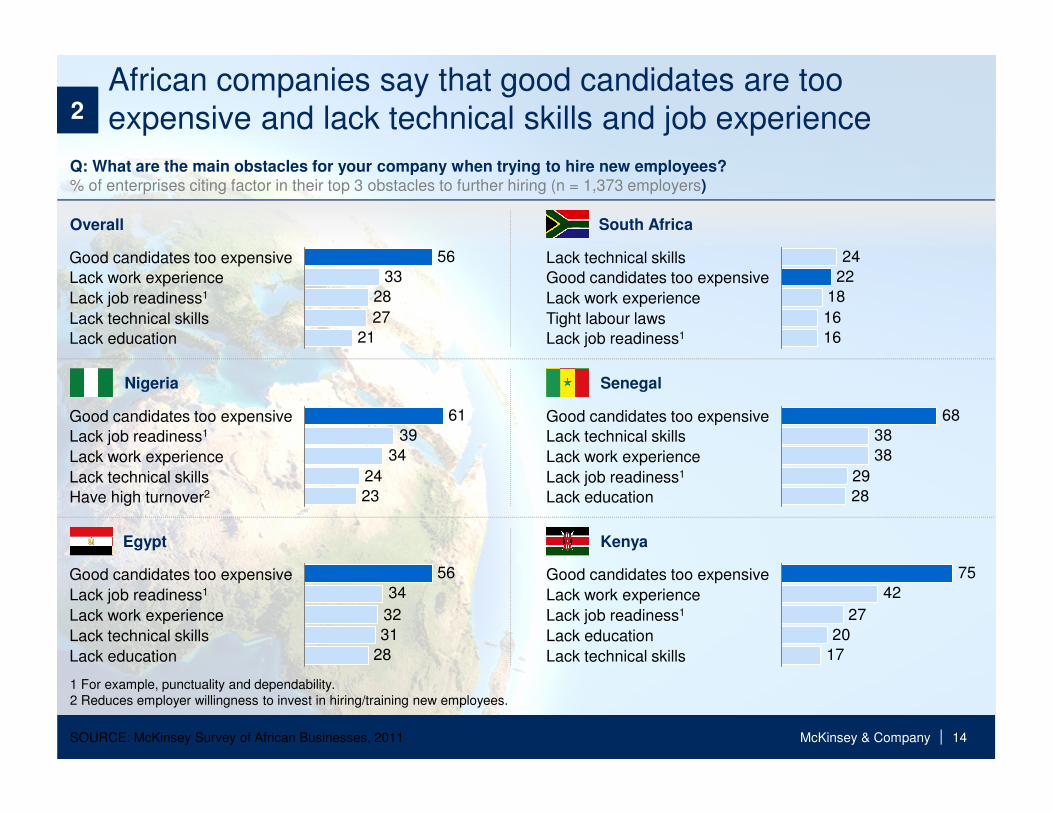
African companies say that good candidates are too expensive and lack technical skills and job experience
SOURCE: McKinsey Survey of African Businesses, 2011
Q: What are the main obstacles for your company when trying to hire new employees?% of enterprises citing factor in their top 3 obstacles to further hiring (n = 1,373 employers)
21
27
28
33
56
Lack technical skills
Lack education
Lack work experience
Good candidates too expensive
Lack job readiness1
1 For example, punctuality and dependability.2 Reduces employer willingness to invest in hiring/training new employees.
Overall South Africa
Nigeria Senegal
Egypt Kenya
16
16
18
22
24Lack technical skills
Lack work experience
Lack job readiness1
Good candidates too expensive
Tight labour laws
17
20
27
42
75
Lack job readiness1
Lack technical skills
Lack education
Lack work experience
Good candidates too expensive
23
24
34
39
61
Have high turnover2
Lack work experience
Lack job readiness1
Lack technical skills
Good candidates too expensive
28
31
32
34
56
Lack technical skills
Lack work experience
Lack job readiness1
Good candidates too expensive
Lack education
28
29
38
38
68
Lack work experience
Lack job readiness1
Good candidates too expensive
Lack education
Lack technical skills
2

McKinsey & Company | 15
Multiple barriers for NCDs at healthcare system level
Infrastructure gap ▪ Poor quantity and quality of diagnostic and treatment centers (e.g., no radiotherapy machines in Côte d’Ivoire)
Human resources scarcity
▪ Limited number of specialists (e.g., no medical oncologist in Nigeria)
Supply chain challenges
▪ Complex supply chain leading to high mark-ups, availability issues and poor cold chain quality assurance
Absence of data ▪ Limited epidemiology data: few registries for NCDs (e.g. no registries of cancer in Gabon)
Policy, regulation and stakeholders inefficiencies
▪ Limited knowledge of NCDs, hence low political priority given to them (e.g. policy development)
▪ Limited knowledge of regulation of Biologics
Funding issues ▪ Limited coverage of NCDs by public and private health insurance
NON-COMMUNICABLE DISEASES
SUB-SAHARAN AFRICA3

McKinsey & Company | 16
Unlock private sector through partnerships in funding and infrastructure
3 types of partnerships
Partnerships with private insurers
▪ Design Private Health insurance package to cover NCDs and related products (incl. innovative micro-insurance)
▪ Provide regional risk pooling through deals with Re-insurance companies (to improve economics)
Partnerships for infrastructure
▪ Develop centers of excellence with international hospital chains (to reduce medical tourism)
▪ Partner with medical device makers to bridge infrastructure gaps
Partnerships with banks for patient credit funding
▪ Develop innovative patient credit productswith banks
3

McKinsey & Company | 17SOURCE: McKinsey in-store visits
In >20% of the visits products were not available Always available1
Partly available
Not available
Product 4
Product 1
Product 2
Product 3
Product 5
Product 6
Product 7
Product 8
Product 9
DISGUISED CLIENT EXAMPLE
1 Available in all pharmacies visited in city2 No availability in at least 1 pharmacy3 No availability in any visited pharmacy
4
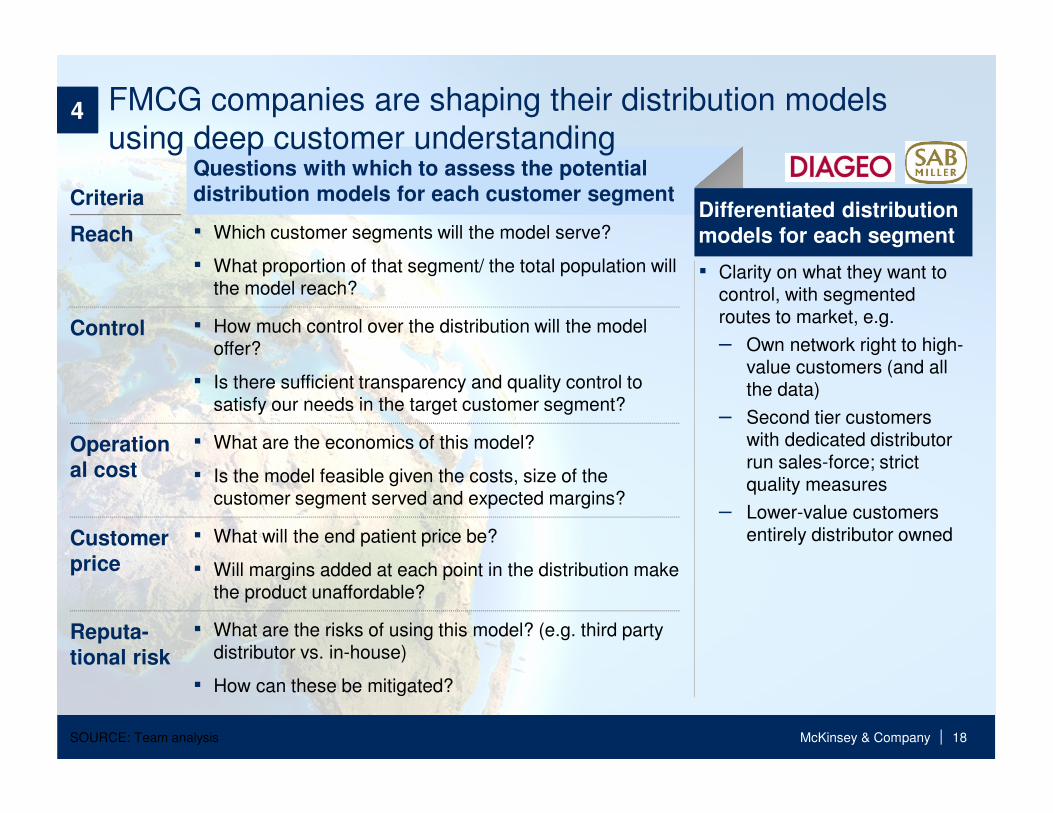
McKinsey & Company | 18SOURCE: Team analysis
Questions with which to assess the potential distribution models for each customer segment
Differentiated distribution models for each segment
▪ Clarity on what they want to control, with segmented routes to market, e.g.
– Own network right to high-value customers (and all the data)
– Second tier customers with dedicated distributor run sales-force; strict quality measures
– Lower-value customers entirely distributor owned
Criteria
▪ Which customer segments will the model serve?
▪ What proportion of that segment/ the total population will the model reach?
▪ How much control over the distribution will the model offer?
▪ Is there sufficient transparency and quality control to satisfy our needs in the target customer segment?
▪ What are the economics of this model?
▪ Is the model feasible given the costs, size of the customer segment served and expected margins?
▪ What will the end patient price be?
▪ Will margins added at each point in the distribution make the product unaffordable?
▪ What are the risks of using this model? (e.g. third party distributor vs. in-house)
▪ How can these be mitigated?
Reach
Control
Operational cost
Customer price
Reputa-tional risk
FMCG companies are shaping their distribution models using deep customer understanding
4