affirmative action employer offering equal education
TRANSCRIPT

Equal Opportunity / Affirmative Action Employer Offering Equal Education Opportunities

JEFFERSON COUNTY PUBLIC SCHOOLS
Board of Education of Jefferson County, Kentucky For the Fiscal Year Ended June 30, 2019
Table of Contents
Introductory Section Letter of Transmittal ................................................................................................................................................................................... iv Letter from Diane Porter, Chairwoman, Board of Education of Jefferson County, Kentucky ............................................................... xiv Board of Education ..................................................................................................................................................................................... xv Government Finance Officers Association Award for Excellence ........................................................................................................... xvi Organizational Chart .................................................................................................................................................................................. xvii Financial Section Independent Auditors’ Report ........................................................................................................................................................................... 1 Management’s Discussion and Analysis (Unaudited) ...................................................................................................................................... 4 Financial Statements: District-wide Financial Statements Statement of Net Position ................................................................................................................................................................................ 14 Statement of Activities ...................................................................................................................................................................................... 15 Fund Financial Statements Governmental Funds Balance Sheet ................................................................................................................................................................................................... 16 Statement of Revenues, Expenditures, and Changes in Fund Balances ......................................................................................................... 17 Proprietary Funds Statement of Net Position ............................................................................................................................................................................... 19 Statement of Revenues, Expenses, and Changes in Net Position ................................................................................................................... 20 Statement of Cash Flows .................................................................................................................................................................................. 21 Continued

Table of Contents--Continued
Jefferson County Public Education Foundation, a Major Component Unit of the Board of Education of Jefferson County, Kentucky Statement of Net Assets ................................................................................................................................................................................... 23 Statement of Revenues, Expenses, and Changes in Net Assets ...................................................................................................................... 23 Fiduciary Funds Statement of Fiduciary Net Position ................................................................................................................................................................ 24 Notes to Financial Statements – Integral to the Basic Financial Statements ................................................................................................ 25 Required Supplementary Information Schedule of Revenues and Expenditures – Budget and Actual General Fund ............................................................................................. 64 Schedule of Revenues and Expenditures – Budget and Actual Special Revenue Fund ............................................................................. 65 Schedule of the District’s Proportionate Share of the Net Pension Liability – County Employees Retirement System .............................. 67 Schedule of the District’s Proportionate Share of the Net Pension Liability – Kentucky Teachers Retirement System .............................. 68 Schedule of the District’s Proportionate Share of the Collective Net OPEB Liability – County Employees Retirement System ............... 69 Schedule of the District’s Proportionate Share of the Collective Net OPEB Liability – Kentucky Teachers Retirement System – Medical Insurance ....................................................................................................................................................................................... 70 Schedule of the District’s Proportionate Share of the Collective Net OPEB Liability – Kentucky Teachers Retirement System – Life Insurance ....................................................................................................................................................................................... 71 Schedule of District Contributions – County Employees Retirement System .............................................................................................. 72 Schedule of District Contributions – Kentucky Teachers Retirement System ............................................................................................... 73 Schedule of District Contributions – OPEB: County Employees Retirement System .................................................................................. 74 Schedule of District Contributions – OPEB: Kentucky Teachers Retirement System – Medical Insurance ................................................ 75 Schedule of District Contributions – OPEB: Kentucky Teachers Retirement System – Life Insurance ...................................................... 76 Other Supplementary Information Schedule of Revenues and Expenditures – Budget and Actual Construction Fund ....................................................................................... 77 Schedule of Revenues and Expenditures – Budget and Actual School Food Service Fund .......................................................................... 77 Schedule of Revenues and Expenditures – Budget and Actual-Nonmajor Funds SEEK Capital Outlay Fund ............................................ 78 Schedule of Revenues and Expenditures – Budget and Actual-Nonmajor Funds Building Tax Fund ........................................................ 78 Schedule of Revenues and Expenditures – Budget and Actual-Nonmajor Debt Service Fund .................................................................... 79 Schedule of Revenues and Expenditures – Budget and Actual-Nonmajor Daycare Operations Fund ......................................................... 79 Schedule of Revenues and Expenditures – Budget and Actual-Nonmajor Adult Education Fund .............................................................. 80 Schedule of Revenues and Expenditures – Budget and Actual-Nonmajor Tuition Preschool Fund ............................................................ 80 Schedule of Revenues and Expenditures – Budget and Actual-Nonmajor Enterprise Programs ................................................................. 81 Combining Balance Sheet – Nonmajor Governmental Funds .................................................................................................................... 82 Continued

Table of Contents--Continued
Combining Statement of Revenues, Expenditures and Changes in Fund Balance – Nonmajor Governmental Funds ......................................................................................................................... 83 Combining Statement of Net Position – Nonmajor Proprietary Funds ............................................................................................................... 84 Combining Statement of Revenues, Expenses and Changes in Net Position – Nonmajor Proprietary Funds ................................................................................................................................ 85 Combining Statement of Cash Flows – Nonmajor Proprietary Funds ................................................................................................................. 86 Combining Statement of Fiduciary Net Position and Statement of Changes in Assets and Liabilities – Fiduciary Funds ................................................................................................................ 87 Statistical Section Statement of Net Position—Total Primary Government .......................................................................................................................... 89 Statement of Activities—Governmental Activities ..................................................................................................................................... 91 Statement of Activities—Business-Type Activities .................................................................................................................................... 95 Statement of Activities—Total Primary Government ................................................................................................................................ 97 Balance Sheets—Governmental Activities ............................................................................................................................................... 101 Statement of Revenues, Expenditures, and Changes in Fund Balances—Governmental Activities ...................................................... 103 General Government Expenses by Function ........................................................................................................................................... 107 General Government Revenues by Type .................................................................................................................................................. 108 Property Tax Rates .................................................................................................................................................................................... 109 Real Estate and Personal Property Tax Revenues ................................................................................................................................... 110 Property Tax Assessments ......................................................................................................................................................................... 111 Property Taxes, as Assessed ....................................................................................................................................................................... 112 Principal Real Estate Taxpayers ............................................................................................................................................................... 113 Overlapping Tax Rates .............................................................................................................................................................................. 114 Principal Employers by Number of Employees ....................................................................................................................................... 117 Occupational Tax Revenues ...................................................................................................................................................................... 119 Total Bonded Debt by Responsible Party .................................................................................................................................................. 120 Detail of Bonds by Responsible Party ....................................................................................................................................................... 121 Overlapping/Direct Debt and Bond Analysis Ratios ................................................................................................................................ 122 Ratios of Debt Outstanding ....................................................................................................................................................................... 123 Jefferson County Demographics .............................................................................................................................................................. 124 Economic Statistics ................................................................................................................................................................................... 125 Number of Employees by Functional Duties ........................................................................................................................................... 126 Enrollment by Level .................................................................................................................................................................................. 127 School Building Capacity Data .................................................................................................................................................................. 128 Miscellaneous Statistics .............................................................................................................................................................................. 140

INTRODUCTORY SECTIONLETTER OF TRANSMITTAL
CURRENT INITIATIVES BOARD MEMBER DATA
ORGANIZATIONAL CHARTEVIDENCE OF SUCCESS

iv
Letter of Transmittal November 12, 2019 The Board of Education of Jefferson County, Kentucky Jefferson County Public School District Louisville, Kentucky
e hereby submit the Comprehensive Annual Financial Report (CAFR) for Jefferson County Public Schools (the “District”), a K-12 public school system, for the year ended June 30, 2019.
The completeness, accuracy, and clarity of these financial statements and data herein are the responsibility of the District’s Chief Financial Officer. This CAFR is presented in three distinct sections: Introductory, Financial, and Statistical. The Introductory Section includes this letter of transmittal, a list of our Board Members and an organizational chart. The reader may use this information to understand the District and our financial condition. Accordingly, we will discuss the Jefferson County economy and tax base, a brief history of the District and education in Kentucky, and our major accomplishments. The Financial Section contains the general purpose financial statements. Annual audits are required legally by Kentucky Revised Statute 156.265. These statements were audited by Strothman & Company PSC, an independent Certified Public Accounting firm. Their opinion is included on page 1 of the financial section. We would like to direct the reader to Management’s Discussion and Analysis on pages 4 – 13 of the financial section. This provides an introduction to the financial statements and some financial highlights.
The Statistical Section presents numerous unaudited tables designed to present more detail and trends apparent within the District and Jefferson County. The report has been prepared by the Finance Department following the requirements and guidelines prescribed by the Governmental Accounting Standards Board and recommended by the Government Financial Officers Association. We believe the data presented is accurate in all material respects and that it is presented in a manner designed to fairly reflect the financial position and results of operations of the District. All disclosures necessary to enable the reader to gain the maximum understanding of the District’s financial activity have been included.
Personalized and engaging learning experiences
Economic Outlook
s discussed further on page 13 of the Management’s Discussion and Analysis in the Financial Section, Jefferson County has a diverse and strong economy but is affected by national economic trends.
The District receives its revenue largely from two sources related to the economy: locally-assessed real estate and property taxes, and locally-
W
A
v
assessed occupational taxes. Additionally, the District receives state revenues derived from state income taxes, sales taxes and other taxes, but these state revenues are subject to many non-economic factors, such as political considerations and an allocation formula based on local revenue, student attendance, and transportation expenses. Beyond these sources, we also receive grant and general revenues from federal, state, local government, and private sources that are either unqualified gifts or grants based on non-tax determinants. Real estate and personal property, other than automobile, taxes are assessed by the Property Valuation Administrator (PVA) annually, and the value is set as of January 1. After taxpayers are afforded a period to dispute the assessment, bills are prepared by the Jefferson County Sheriff and sent to the taxpayers on November 1. Real estate taxes, the largest in this total, typically show an increase in both assessments and tax rate. With growth in parts of Jefferson County and typical housing appreciation, local real estate taxes are becoming a greater percent of our revenues each year as their growth outpaces other revenues. Motor vehicle taxes are assessed as of January 1 of each year. The PVA office uses standardized guides, provided by the Department of Revenue, to determine the value of a vehicle or boat. For years, the District has levied the statutory maximum motor vehicle tax rate, and increases are derived from assessment increases alone. See the Statistical Section for more details and trend analyses on these taxes. Locally assessed occupational taxes are levied upon Jefferson County residents who work within Jefferson County at a rate of .75% of salary. This tax tends to be an accurate barometer of the local workforce, and, in some ways, the strength of the local economy. In reviewing past years’ revenues, the reader may notice the correlation between occupational tax revenues and the greater United States economy. State revenues are based on a variety of state taxes and are allocated to the District based on a variety of factors. First, the Commonwealth of Kentucky is inherently a political entity, and the budget is allocated accordingly. Education continues to be a priority of the current government leaders, though funding levels lag behind many adjacent states. Funds are allocated to the various Kentucky school districts by a statutory formula introduced in
the Kentucky Educational Reform Act, which is discussed later in this section. Jefferson County has a long history as a central transportation hub, which fostered a manufacturing center for durable goods, including appliances, cars and trucks. In recent decades, the economy has diversified and is now the home of three Fortune 500 companies, including Yum! Brands, which includes KFC, Taco Bell, and Pizza Hut, Kindred Healthcare, and Humana Inc. Additionally, headquartered in Louisville are Papa John’s International Inc. pizza restaurants, and Brown-Forman, makers of numerous beverages such as Jack Daniels Tennessee Whiskey. Louisville is also home to the Churchill Downs, United Parcel Service’s (“UPS”) Worldport Facility, employing over 20,000, two Ford plants, and General Electric’s Appliance Park. Overall, the Jefferson County economy is strong.
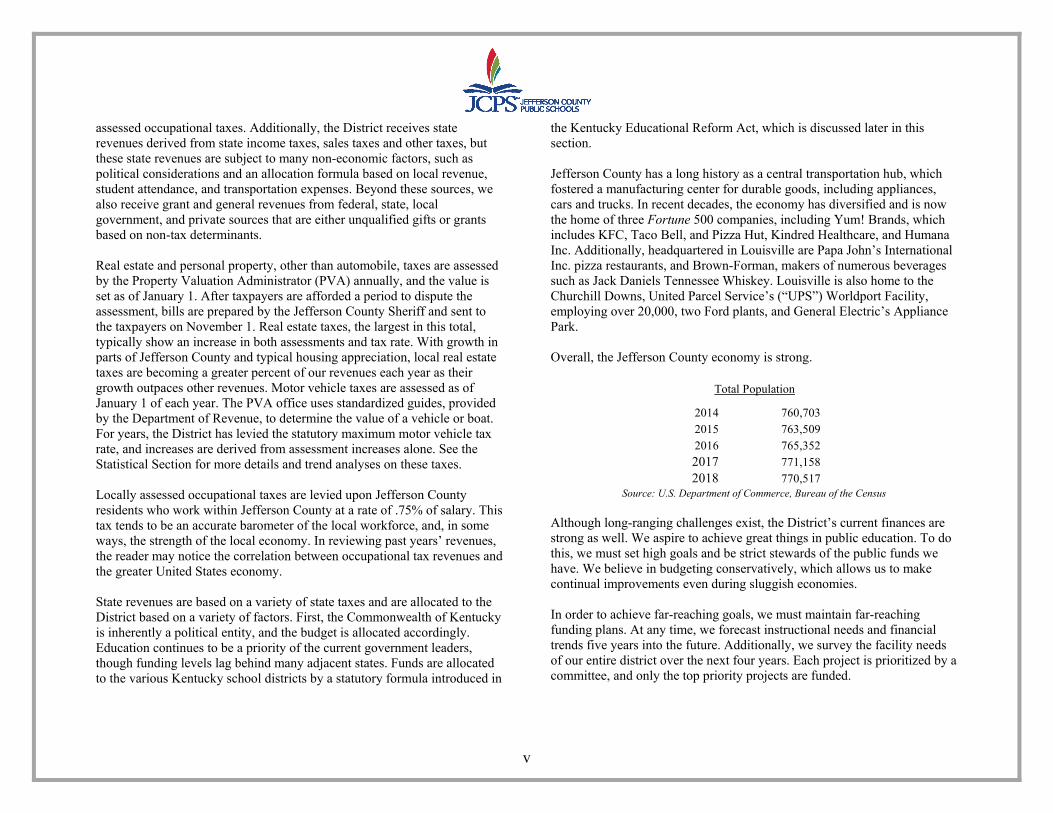
2014 760,703 2015 763,509 2016 765,352 2017 771,158 2018 770,517
Total Population
Source: U.S. Department of Commerce, Bureau of the Census
Although long-ranging challenges exist, the District’s current finances are strong as well. We aspire to achieve great things in public education. To do this, we must set high goals and be strict stewards of the public funds we have. We believe in budgeting conservatively, which allows us to make continual improvements even during sluggish economies. In order to achieve far-reaching goals, we must maintain far-reaching funding plans. At any time, we forecast instructional needs and financial trends five years into the future. Additionally, we survey the facility needs of our entire district over the next four years. Each project is prioritized by a committee, and only the top priority projects are funded.

vi
As described further in Notes F and H, the District is challenged by pervasively underfunded or underperforming pension plans in which our employees participate in as well as the related pension-provided other post-employment benefits. Although the District has made all required contributions at actuarially-determined rates, failure to do so by the Kentucky legislature and subpar investing performance has created a financial contingency to both the District and the state. This creates a significant level of financial uncertainty that may necessitate drastic corrections in future budget periods. The current initiatives discussed on pages xi and xii of this Introductory Section are major undertakings that may require dedication over many years. As a practice, we pair our recurrent revenue budget with our recurrent expense budget to eliminate liquidity concerns. In addition, all planning is done in concert with our research team to ensure that funds are allocated to programs that get results.
Prepared, empowered, and inspired!
We also place great emphasis on internal controls. School districts have inherent weaknesses in financial structure, with funds being collected at numerous locations and where optimal segregation of duties is not always practical. However, because the cost of internal control should not exceed the anticipated benefits, the objective of these controls is to provide reasonable, rather than absolute, assurance that District assets are protected and that our financial statements are free of material misstatement. To offset our inherent risks, the District is committed to strengthening its controls at the central office level, where 99% of revenues are received, and reviewing satellite offices and schools regularly. Central office uses positive pay for its disbursements and staff review bank information daily. Audits are performed using an enterprise-wide risk assessment. We maintain an anonymous fraud hotline to safeguard our assets. Currently, we are tightening segregation of duties and internal controls at satellite offices. Our Ethics Guidelines further solidify the District’s commitment to always act in the highest ethical manner to preserve the public trust. These guidelines reflect Vision 2020 and our core values especially relating to respect, diversity, and stewardship. History of Public Education in Jefferson County
n April 24, 1829, the City of Louisville established the first public schools for children under sixteen years of age and constructed the first school the following year. Although Louisville’s charter
specified that education would be free, a tuition of $1 for primary grades and $1.50 for other grades was assessed. By 1838, the City of Louisville had a full-service school system. Also in 1838, the remaining areas of Jefferson County outside of the City of Louisville incorporated the Common Schools of Jefferson County school district. In 1870, Louisville Public Schools established its first two schools for African American students, bringing its enrollment up to 13,502. By this time, the Common Schools of Jefferson County operated 68 schools,
O

vii
including 10 for African Americans. Both districts continued to grow consistently over the decades. In 1956, all public schools in Louisville and Jefferson County were desegregated at a time when the Louisville Public Schools were 26% African American and the Jefferson County Schools were 4% African American. By court order on April 1, 1975, the Louisville Public Schools and the Jefferson County Public Schools merged into the present Jefferson County Public Schools district in order to address the racial disparity. At that time, it was determined that all schools in the new district must maintain racial diversity with the minority population between 15% and 50%. In June 2007, the United States Supreme Court held that some aspects of our student assignment plan did not satisfy the Court’s “narrow tailoring” requirement. In May 2008, the District unanimously approved a revised student assignment plan which became effective for the 2009-2010 school year. The new plan uses socio-economic factors including educational attainment, household income, and race averages of a student’s geographic region as factors when assigning students to schools other than their home school. The Kentucky Education Reform Act (“KERA”) of 1990 formed the basis for massive change to the state’s educational system. One of the most comprehensive, statewide restructuring efforts ever attempted in the United States, KERA changed the formula by which Kentucky school districts receive state funding in an effort to achieve equity and educational adequacy regardless of each district’s local economic base. KERA created a Site-Based Decision-Making Council system. Each school would have such a council consisting of parents, teachers, and administrators of the school, who would oversee the financial and instructional decisions of the school and hire the Principal. KERA also established a state-wide accountability system that continues to evolve to meet student needs. Through the resulting emphasis on data-driven educational accountability, Kentucky has gained a reputation as a cutting edge educational system focusing on accountability. The District, as well, has many years of assessment data. We continuously review our curriculum and initiatives to
ensure Jefferson County children are being educated to the height of their ability.
Instruction that inspires!
Jefferson County Public School District Today
he current District is very different than our beginnings. We continue to strive for excellence in our educational and financial operations. As much as the world has changed, so too has District.
Financially, we adjust conservatively to confront economic challenges, and still have sufficient fund balances to continue our plans for the future. We have a policy of reviewing vacancies, especially central office vacancies, to continuously strive for efficiency. We have reviewed many of our purchasing and distribution systems and made efficiency improvements including moving many of our revenue collections to online card payment systems. Our aim is to efficiently and completely support those who provide services to our students.
T

viii
We have 97,856 students: High 28,358 Middle 21,233 Elementary 35,763 Kindergarten 7,183 Preschool 2,899 Special Schools 2,420
We have 167 schools and learning centers:
High 18Middle 22Elementary 90Multi-Level 3Pre-K Centers 5Special 15State Agency 14
We project that our enrollment is stable, with our 2019-2020 forecast of approximately 98,000 students. Our schools were founded based on the neighborhood schools concept. The majority of our schools are off the major thoroughfares back in neighborhoods, where traffic disruptions are minimized, and as many children can walk to school as possible. As Jefferson County has grown to its current size and complexity, the District has found the need to increase its educational and environmental offerings. While students have the opportunity to attend a school within their regional cluster and a regular school program, they have many additional choices of schools and programs to best fit their needs and wants. School Choice: A core philosophy within the District is that parents should be allowed to choose the program and the school their child attends. We feel this allows students and their parents the opportunity to meet certain educational needs based on the individual child. Our schools are also able to differentiate themselves if the Site-Based Decision Making Council and the elected Jefferson County Board of Education approves the change.
The district embraces many different schools and programs to meet students’ diverse needs, interests, and learning styles.
All schools are resourced and equipped to support student needs
Regular Program: Most schools offer a regular curriculum in a typical school setting. This program is the choice of the majority of our parents and gives the Site-Based Decision Making Council much educational latitude. Magnet and Optional Programs: The District believes that not all students have the same interests or learn in the same way. We offer choices that let elementary, middle, and high school students select a specialized learning environment or a program that focuses on a particular subject. Magnet Schools and Programs include traditional schools, Montessori schools, magnet programs, and magnet career academies. Traditional schools require uniforms, daily homework, and parent involvement. They teach at grade level in a structured classroom environment. The Montessori approach to learning is designed to encourage critical thinking, exploration, and self-directed education. Magnet programs offer specialized foci

ix
incorporated into the curriculum, such as performing arts, math & science, technology, early college, or International Baccalaureate. Magnet career academies offer high school students programs that focus on training for a specific career. There are more than a dozen magnet career academies, and most of them offer multiple career programs. Many of our magnet career academies have received national recognition in their program area. Fifteen of our high schools have Professional Career Theme Programs in such disciplines as Aerospace, Medicine, Engineering, Information Technology and the Environment. Optional Program is a small, specialized program within a school, such as Creative Arts and Global Communications Optional Program.
Advance Program is for academically gifted students. It stimulates talented young people to stretch their abilities and requires schools to be creative in providing a range of educational opportunities that promote excellence for each child.
Adults model integrity, respect, creativity, and accountability
Alternative Schools: Binet School: A center which provides successful learning experiences for those students with multiple disabilities who need a more structured and supportive environment.
Breckinridge Metro High: A high school whose students have been referred to the school by the office of student services, the department of juvenile justice and/or other state and county agencies because of code violations in the regular schools or are court ordered to attend.
Churchill Park School: This special school serves students with moderate to severe functional mental disabilities from ages five to twenty-one. While following state mandated core content, the program focuses on functional life skills, community-based instruction, and occupational work experience that will allow students to access and be successful in their immediate environment.
Jefferson County High School: An open-entry/open-exit program that provides an opportunity for students to obtain a high school diploma by attending classes on a flexible schedule. Paper-Pencil Curriculum: Students study a curriculum, which is individualized, self-paced and teacher-designed. Independent Study through Correspondence: Students are provided the opportunity to complete a traditional, textbook-based curriculum by correspondence from anywhere in the world. Online Curriculum: JCPSeSchool is an internet-based curriculum offered to students worldwide.
Minor Daniels Academy: Middle school and high school students with behavioral challenges may be assigned to Minor Daniels Academy. This school uses restorative pathways to create a supportive environment with the goal that students may return to their home schools.
The Phoenix School of Discovery: Established under the federal guidelines of No Child Left Behind, this school relies heavily on technology to prepare students in grades 6-12 to reach state proficiency levels.

x
Liberty High: A nontraditional, safety-net school that serves students who meet any of the following criteria:
One year of high school with fewer than five credits One to four years in high school and have fewer than 14 credits Frequently absent from school Failed four or more classes At least 16 years old Prefer hands-on, collaborative learning Prefer a flexible daily/yearly schedule Desire a work-based educational component Have diverse learning preferences and whose talents are not being
developed.
State Agency Schools: Thirteen unique residential and day treatment centers that work collaboratively with treatment partners to provide a therapeutic or rehabilitative school environment. Students are placed in the State Agency Children’s Program through court commitment, psychiatric hospitalization, or identified need for long term treatment of emotional or behavioral problems.
Georgia Chaffee Teenage Parent Program: A school designed to prevent school dropout due to teen pregnancy and parenting for middle and high school students. This award-winning program includes home-school coordinators and regular classroom instruction with a hospital-quality nursery.
Waller-Williams Environmental: A special school for students with severe and profound emotional and/or behavioral disabilities. Serving K-8th grade in a highly structured environment, this school utilizes a behavior management system where students earn tokens for good behavior and may use these tokens to purchase items in the school store.
Youth Performing Arts School (YPAS): One of only 100 schools of its kind in the nation. YPAS offers courses in dance, theater acting, musical theater,
vocal music, piano, concert band, concert orchestra, visual arts, design and production. Students take their academic classes at an adjacent JCPS high school.
Adult Education: Total Adult Education enrollment in Adult Basic Education/General Education Development (GED) Program was 3,804 earning 244 GED Certificates.
GED, Basic Skills & Family Ed: Free classes to prepare for the GED test and upgrade basic skills.
English as a Second Language: Free classes for adults to improve communications skills.
Louisville Learns: More than 250 online leisure-learning and career-enhancing classes.
A safe and welcoming learning community

xi
Current Initiatives
he District is moving forward with unparalleled momentum into a bright future by focusing on three main pillars: Positive Culture & Climate, the Backpack of Success Skills, and the JCPS Racial
Educational Equity Plan. These initiatives set JCPS apart as a model for many other districts nationwide to emulate in order to achieve success in every area of influence. In addition to academic achievement, education should also prepare a child to become a productive member of the workforce, to promote the common good in society, to become a responsible citizen, and to aide in reducing inequalities.
Adults model integrity, respect, and responsibility
Positive Climate and Culture: Empowered employees create confident students. The sense of trust that students need to excel in the classroom and in extracurricular activities must be honed with extraordinary care. In addition, students must have the individualized resources they require to be at their best. This includes mental health, suicide prevention, and bullying prevention. To provide these resources and let each student achieve their individual best, we have added mental health practitioners into every
school. All staff must come together to work with a passion for the students we are serving and focus on our mission and vision. This is the only way we can be confident in our success and convey that confidence to the parents entrusting us with their children. Backpack of Success Skills: The Backpack of Success Skills is an innovative initiative where students will show how they have become effective communicators, emerging innovators, prepared and resilient learners, globally and culturally competent citizens and productive collaborators. At the end of key transition points in their education (5th, 8th and 12th grades), students will have the opportunity to defend what they’ve learned thus far in their educational journey using the evidence in their virtual backpack. This endeavor is a critical component of the district’s Vision 2020, which includes a targeted focus on improving student literacy and increasing high school graduation rates. Engaging every student, every day, in meaningful learning is the goal. JCPS is excited to see the transformation in our classrooms as more students are prepared, empowered and inspired to reach their fullest potential. JCPS Racial Educational Equity Plan: The District’s Commitment to Racial Educational Equity policy, which was established to increase access for students of color, strengthen opportunities, and create a more diverse instructional staff in JCPS, was unanimously approved by the Jefferson County Board of Education in May 2018. This transformative policy is the first step toward building the academic programs and services that meet the needs of a diverse student population and eliminate achievement gaps. To create this organization-wide transformation, we are in our second year of a district-wide professional development initiative. Additionally, we have opened the W.E.B. Dubois Academy, a middle school for males of color that focuses on academic and behavioral excellence building confident students. The first year of this new school has been so successful that we are planning the Females of Color STEAM Academy to open in the fall of 2020.
T
xii
Evidence of Success
he District is seeing the results of its focus on Vision 2020. Outstanding performance within the District has been validated by several national, independent organizations and governmental
agencies and by the performance of our outstanding students.
Our Schools:
First place winner of the KY Junior BETA Convention (Farmer Elementary)
People’ Choice Award recipient in the Follett Challenge (J. Graham Brown School)
2019 Jefferson County All-Star Band named the Grand Champion of the 2019 Republic Bank Derby Festival Pegasus Parade
National School of Character recipient (Kenwood Elementary) Barret Middle was named a Blue Ribbon school
Our Students:
Award of Excellence in the PTA Reflections State contest for Visual Art
National Academy of Television Arts & Sciences Student Production Award winners
StAMINA (Student Alliance for Mental Health Innovation and Action) group was formed by a JCPS High School student
More than thirty-five JCPS students named 2019 National Merit Scholarship semifinalists
Three JCPS students honored with Frazier Museum’s Poe-Inspired Art Exhibition awards
Twelve JCPS students recognized as winners of the 2018 YMCA Youth Character Awards
JCPS student selected for the Student Technology Leadership Program
Top KY Youth Volunteer by Prudential Spirit of Community Award recipient
Sixteen JCPS Seniors recognized with the 2019 Vogt Educational & Leadership Scholarship
2019 VSA Playwright Discovery Competition winner Five Students with perfect attendance for their K-12 learning years Two JCPS schools recognized as Kentucky High School Athletic
Association football Champions for their divisions Our Teachers & Staff Members:
New Teacher of the Year recipient by the Association for Career and Technical Education
2018 KY Council for Social Studies Outstanding Social Studies Teacher of the Year
KY Art Education Association’s High School Art Teacher of the Year recipient
2018 Ann S. Booth mathematics Education Service & Achievement award honoree
T

xiii
Excellence in the Classroom & Educational Leadership (ExCEL) Award Winners
2019 KY Music Educators Association (KMEA) High School Teacher of the Year
KY High School Athletic Association Coach of the Year KCTE Middle School Teacher of the Year award winner 2019 Counselor Advocate of the Year Award recipient 435 National Board Certified Teachers 2 recipients of a Carnegie Medal by the Carnegie Hero Fund
Commission KY High School Teacher of the Year award IT Leader of the Year recipient Outstanding Mathematics Design Collaborative Teacher Award
recipient Two 2018 National School Public Relations Golden Achievement
Award winners
Acknowledgements
e would like to thank all of the staff who assisted with closing of the District’s financial records and preparing this report. In addition, we want to thank those at all levels of the District who
do their part to provide relevant, comprehensive, quality instruction in order to educate, prepare, and inspire our students to learn. Respectfully submitted,
Marty Pollio, Ed. D. Superintendent J. Cordelia Hardin Cordelia Hardin Chief Financial Officer / Treasurer
W

xiv
November 12, 2019 To the Citizens of Jefferson County, Kentucky: We, as the Jefferson County Board of Education, are proud to serve as the collective voice and representation for the students, parents, staff, community members, and taxpayers of this great County. We firmly believe in setting high standards and using data-driven accountability measures to reach our goals. Vision 2020 solidifies our commitment to those standards and gives clear direction for our bright future. JCPS Vision 2020: All Jefferson County Public Schools students graduate prepared, empowered, and inspired to reach their full potential and contribute as thoughtful, responsible citizens of our diverse, shared world. To achieve our Vision, we, in conjunction with Superintendent Marty Pollio, have established three pillars to support JCPS. The Backpack of Success Skills, our first pillar, will allow all JCPS students to develop key skills so they can be successful in all areas of influence: school, life and work. Students will fill their virtual backpacks with their school work and projects throughout their school career and must present a defense of their learning accomplishments at the end of fifth, eighth, and twelfth grades. Our second pillar is school culture and climate. For students to perform at their best, they must be educated in a supportive environment that not only delivers high-yield pedagogy, but also provides the students with individualized behavioral, social, and emotional supports. We have added mental health practitioners to all of our schools to address bullying and suicide prevention. We are ensuring that our curriculum stimulates our students while they are learning by investing in career and technical education through our Academies of Louisville programs with real world student apprenticeships.
The third pillar is our Racial Equity Plan. The Board passed a Racial Equity Policy to solidify our commitment to support educational excellence regardless of ethnicity, race, color, national origin, age, religion, marital or parental status, political affiliations or beliefs, sex, sexual orientation, gender identity, or gender expression. The Board recognizes that multicultural education is a continuous development that is necessary in transforming the educational process for our students. The Plan includes a significant professional development investment and additional academic supports and extracurricular programs. As part of this Plan, the Board voted to open W.E.B. Dubois Academy for the 2018-2019 school year. This is the first Males of Color Academy for JCPS. This inspiring new program demands excellence of its students and fills them with self-confidence and academic responsibility. The concept has been so successful in its first year that we will be opening a Females of Color STEAM Academy in the 2020-2021 school year. Within our governance responsibilities, we are ensuring that all budgetary decisions are directly linked to our Vision to make certain that all of JCPS maintains the laser-like focus our students deserve. We must maintain this level of accountability to reach Vision 2020. As your Board, we are motivated to see the continued positive improvement in our District due to a focused and forward-thinking leadership team. There are great things in store for our students and the future of our remarkable community. On behalf of the Jefferson County Board of Education, I am pleased to present this Comprehensive Annual Financial Report for the fiscal year ended June 30, 2019. Sincerely,
Diane Porter Chair

xv
Jefferson County Board of Education Members of the Board of Education
Diane Porter, Chairwoman,
District 1
Chris Kolb, District 2
James Craig, District 3
Chris Brady, District 7
Joe Marshall, District 4
Linda Duncan, District 5
Corrie Shull, District 6

xvi
This Certificate of Achievement for Excellence in Financial Reporting, awarded by the Government Finance Officers Association, is the highest form of recognition in the area of governmental accounting and financial reporting, and its attainment represents a significant accomplishment of the District. The District
has received this award each year from 2007 through the latest award period for the year ended June 30, 2018.
xvii
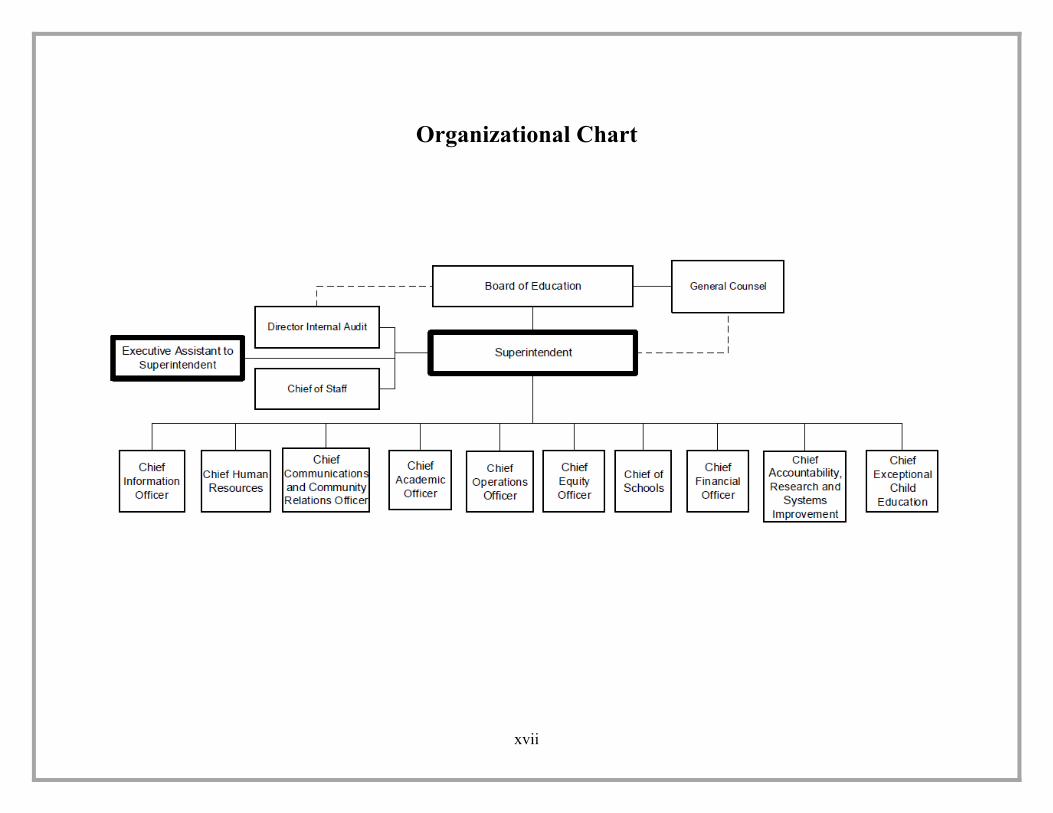
Organizational Chart

FINANCIAL SECTION
FOOTNOTES
FINANCIAL STATEMENTS
INDEPENDENT AUDITOR’S REPORTMANGEMENT DISCUSSION & ANALYSIS

Independent Auditors' Report Members of the Board Board of Education of Jefferson County, Kentucky Louisville, Kentucky Report on the Financial Statements We have audited the accompanying financial statements of the governmental activities, the business-type activities, each major fund, the component unit, and the aggregate remaining fund information of the Board of Education of Jefferson County, Kentucky (the "District") as of and for the year ended June 30, 2019, and the related notes to financial statements, which collectively comprise the District’s basic financial statements as listed in the accompanying table of contents. Management’s Responsibility for the Financial Statements Management is responsible for the preparation and fair presentation of these financial statements in accordance with accounting principles generally accepted in the United States of America; this includes the design, implementation, and maintenance of internal control relevant to the preparation and fair presentation of financial statements that are free from material misstatement, whether due to fraud or error. Auditors’ Responsibility Our responsibility is to express opinions on these financial statements based on our audit. We conducted our audit in accordance with auditing standards generally accepted in the United States of America; the standards applicable to financial audits contained in Government Auditing Standards, issued by the Comptroller General of the United States; and the Kentucky Public School Districts’ Audit Contract and Requirements prescribed by the Kentucky State Committee for School District Audits. Those standards require that we plan and perform the audit to obtain reasonable assurance about whether the financial statements are free from material misstatement. We did not audit the financial statements of the Jefferson County Public Education Foundation (the “Foundation”) a major component unit of the District. The Foundation represents 100% of the assets, net assets, revenues and expenses of the major component units. Those financial statements were audited by another auditor whose report has been furnished to us, and our opinion, insofar as it relates to the financial statements of the Foundation, is based solely on the report of the other auditor.

-2-
An audit involves performing procedures to obtain audit evidence about the amounts and disclosures in the financial statements. The procedures selected depend on the auditors’ judgment, including the assessment of the risks of material misstatement of the financial statements, whether due to fraud or error. In making those risk assessments, the auditors consider internal control relevant to the District’s preparation and fair presentation of the financial statements in order to design audit procedures that are appropriate in the circumstances, but not for the purpose of expressing an opinion on the effectiveness of the District’s internal control. Accordingly, we express no such opinion. An audit also includes evaluating the appropriateness of accounting policies used and the reasonableness of significant accounting estimates made by management, as well as evaluating the overall presentation of the financial statements. We believe that the audit evidence we have obtained is sufficient and appropriate to provide a basis for our audit opinions. Opinions In our opinion and based on the opinion of the other auditor, the financial statements referred to above present fairly, in all material respects, the respective financial position of the governmental activities, the business-type activities, each major fund, the component unit, and the aggregate remaining fund information of the District as of June 30, 2019, and the respective changes in financial position and cash flows of its proprietary funds for the year then ended in accordance with accounting principles generally accepted in the United States of America. Other Matters Required Supplementary Information Accounting principles generally accepted in the United States of America require that the Management’s Discussion and Analysis (Unaudited) on pages 4 through 13 and the budgetary comparison information on pages 64 and 65 and the pension and other post-employment benefit liability and contribution information on pages 67 through 76 be presented to supplement the basic financial statements. Such information, although not a part of the basic financial statements, is required by the Governmental Accounting Standards Board, who considers it to be an essential part of financial reporting for placing the basic financial statements in an appropriate operational, economic, or historical context. We have applied certain limited procedures to the required supplementary information in accordance with auditing standards generally accepted in the United States of America, which consisted of inquiries of management about the methods of preparing the information and comparing the information for consistency with management’s responses to our inquiries, the basic financial statements, and other knowledge we obtained during our audit of the basic financial statements. We do not express an opinion or provide any assurance on the information because the limited procedures do not provide us with sufficient evidence to express an opinion or provide any assurance. Other Information Our audit was conducted for the purpose of forming opinions on the financial statements that collectively comprise the District’s basic financial statements. The other supplementary information listed in the table of contents is presented for purposes of additional analysis and is not a required part of the basic financial statements. The other supplementary information is the responsibility of management and was derived from and relates directly to the underlying accounting and other records used to prepare the basic financial statements. Such information has been subjected to the auditing procedures applied in the audit of the basic financial statements and certain additional procedures, including comparing and reconciling such information directly to the underlying accounting and other records used to prepare the basic financial statements or to the basic financial statements themselves, and other additional procedures in accordance with auditing standards generally accepted in the United States of America. In our opinion, the information is fairly stated in all material aspects in relation to the basic financial statements as a whole.

-3-
The introductory and statistical sections have not been subjected to the auditing procedures applied in the audit of the basic financial statements and, accordingly, we do not express an opinion or provide any assurance on them. Other Reporting Required by Government Auditing Standards In accordance with Government Auditing Standards, we have also issued a report dated November 12, 2019, on our consideration of the District’s internal control over financial reporting and on our tests of its compliance with certain provisions of laws, regulations, contracts, and grant agreements and other matters. The purpose of that report is to describe the scope of our testing of internal control over financial reporting and compliance and the results of that testing, and not to provide an opinion on the effectiveness of the District’s internal control over financial reporting or on compliance. That report is an integral part of an audit performed in accordance with Government Auditing Standards in considering the District's internal control over financial reporting and compliance. Louisville, Kentucky November 12, 2019

Management’s Discussion and Analysis For the Year Ended June 30, 2019
4
Introduction
Our discussion and analysis of the Board of Education of Jefferson County, Kentucky (the “District”) financial performance provides an overview of the District’s financial activities for the fiscal year ended June 30, 2019. The intent of this Management’s Discussion and Analysis (“MD&A”) is to look at the District’s financial performance as a whole. It should be read in conjunction with the District’s financial statements. Financial Highlights Serving nearly 100,000 students, the District is the largest in Kentucky and the 30th largest in the United States. We maintain 167 schools and education centers: 90 elementary, 22 middle, 18 high, 3 multi-level, 5 pre-K, 15 special, and 14 state agency schools. The financial position of the District remains strong and stable with an operating budget of $1.7 billion. The District maintains its focus on student achievement. Our students and teachers continue to win awards and reach new goals in numerous academic areas. The student-teacher ratio was 15 to 1.
2018-19 2017-18 2016-17 Change 2018-19 2017-18 2016-17 Change
College scholarships earned $168 million $187 million $183 million -10.2% Number of teachers 6,896 6,864 6,835 0.5%Students taking AP tests 6,643 6,804 6,928 -2.4% Teachers with Master's Degree or higher 83% 85% 84% -2.4%Number of tests taken 10,949 11,245 11,123 -2.6% National Board Certified Teachers 435 432 359 0.7%AP scores earning college credit 48.9% 47.3% 49.7% 3.4% Student daily attendance rate 93.2% 93.2% 93.6% 0.0% On the District-wide financial statements, the net position of the District was $403.9 million. The District’s total net position decreased by $75.1 million for the fiscal year ended June 30, 2019. The District’s governmental funds financial statements reported combined ending fund balance of $246.0 million. Of this total, $74.1 million is unassigned in the general fund. However, due to economic uncertainty, along with the needs of specific instructional priorities, it is necessary to maintain adequate fund balance to support these initiatives. Overview of the Financial Statements The annual report contains:
Management’s Discussion and Analysis (“MD&A”) District-wide financial statements and fund financial statements Notes to Financial Statements Other required supplementary information, including statements for nonmajor governmental and fiduciary funds
This annual report consists of a series of financial statements. The District-wide statements, the Statement of Net Position and the Statement of Activities, provide an overview of the District’s finances. The fund financial statements and governmental activities statements tell how these services were financed in the short term, as well as, what remains for future spending. The fund financial statements also report the District’s operations in more detail than the District-wide financial statements by providing information about the District’s most significant funds. The remaining statements provide financial information about activities for which the District acts solely as a trustee or agent for the benefit of those outside of the District.
Management’s Discussion and Analysis For the Year Ended June 30, 2019
5
Reporting the District as a Whole The Statement of Net Position and the Statement of Activities Our analysis of the District as a whole begins with the District-wide financial statements. One of the most important questions raised about the District’s finances is whether the District as a whole is better off or worse off as a result of the year’s activities. The Statement of Net Position and the Statement of Activities report information about the District as a whole and about its activities in a way that helps answer this question. These statements include all assets and liabilities using the accrual basis of accounting, which is similar to the accounting used by most private-sector organizations. All of the current year’s revenues and expenses are taken into account regardless of when cash is received or paid. These two statements report the District’s net position and changes in them. The District’s net position, the difference between assets and liabilities, are one way to measure its financial health. Increases or decreases in the District’s net position are one indicator of whether its financial health is improving or deteriorating. To evaluate the District’s overall health, review other non-financial factors, such as changes in the District’s property tax base and the condition of the District’s school buildings and other physical assets. The District-wide financial statements are divided into two categories:
Governmental activities: Most of the District’s basic services are reported here, including instruction, student support services, instructional staff support services, administrative support services, school administrative support services, business support services, transportation, and plant operations and maintenance. Property taxes, occupational taxes, the Commonwealth’s Support Education Excellence in Kentucky (“SEEK”), other Commonwealth support, and state and federal grants finance most of these activities.
Business-type activities: School Food Services, Adult Education Lifelong Learning Courses, Tuition-based Pre-School, fee-based Day Care, and the Challenger Center
Flight Simulator Enterprise Program are considered as business-type activities of the District. A fee is charged for these activities to assist the District in covering the cost of these services; therefore, they are classified as business-type activities.
Reporting the District’s Most Significant Funds Fund Financial Statements Our analysis of the District’s major funds provides detailed information about the most significant funds—not the District as a whole. Some funds are required to be established by State law and bond covenants. However, other funds are established as needed to help control and manage money for particular purposes or to show that it is meeting legal responsibilities for using certain taxes, grants, and other money (for example, grants received from the federal and state governments). The District’s two kinds of funds, governmental and proprietary, use different accounting approaches. The District also uses fiduciary funds, which are separate funds from the governmental and proprietary funds described above. These funds are not included in the District-wide financial statements, but are described below. Notes to the Financial Statements The notes provide additional information that is essential to a full understanding of the data provided in the District-wide and fund financial statements.

Management’s Discussion and Analysis For the Year Ended June 30, 2019
6
Governmental funds: Most of the District’s basic activities are reported in governmental funds, which focus on how money flows into and out of those funds and the balances left at year-end that are available for spending. These funds are reported using accounting methods called modified accrual accounting, which measures cash and all other financial assets that can readily be converted to cash. The governmental fund statements provide a detailed short-term view of the District’s general government operations and the services it provides. Governmental fund information helps you determine whether there are more or fewer financial resources that can be spent in the near future to finance the District’s programs. We describe the relationship (or differences) between the governmental activities (reported in the District-wide Statement of Net Position and Statement of Activities) and governmental funds in a reconciliation following the fund financial statements. Proprietary funds: When the District charges students or parents for the services it provides, these services are generally reported in proprietary funds. Proprietary funds are reported in the same way that all activities are reported in the District-wide Statement of Net Position and Statement of Activities. In fact, the District’s proprietary funds are the same as the business-type activities we reported in the District-wide financial statements but provide more detail and additional information, such as cash flows, for proprietary funds. Fiduciary funds: Fiduciary funds are used to account for resources held for the benefit of parties outside the District. These funds are not reflected in the District-wide financial statements because the resources of these funds are not available to support the District’s own activities or programs. The basis of accounting for fiduciary funds is similar to that of proprietary funds. The District as a Whole The following is a summary of the District’s net position:
2019 2018 2019 2018 2019 2018
382,160,107$ 349,071,526$ 6,779,346$ 7,846,874$ 388,939,453$ 356,918,400$
and co ns truc tio n in pro gres s 725,390,294 748,453,250 19,426,763 19,727,711 744,817,057 768,180,961
To ta l A s s e ts 1,107,550,401 1,097,524,776 26,206,109 27,574,585 1,133,756,510 1,125,099,361
D e fe rre d Outf lo ws 122,233,765 166,496,598 12,860,724 18,042,165 135,094,489 184,538,763
169,734,819 174,373,711 685,783 1,531,605 170,420,602 175,905,316 1,347,717,574 1,304,627,935 90,165,542 93,664,072 1,437,883,116 1,398,292,007
To ta l Lia bilit ie s 1,517,452,393 1,479,001,646 90,851,325 95,195,677 1,608,303,718 1,574,197,323
D e fe rre d Inf lo ws 58,551,149 58,273,623 5,853,869 5,927,243 64,405,018 64,200,866
Ne t P o s itio n Net inves tment in capita l as s e ts 334,282,855 348,872,266 19,426,763 18,613,750 353,709,618 367,486,016
174,959,788 73,324,431 174,959,788 73,324,431 (855,462,019) (695,450,592) (77,065,124) (74,119,920) (932,527,143) (769,570,512)
To ta l N e t P o s it io n (346,219,376)$ (273,253,895)$ (57,638,361)$ (55,506,170)$ (403,857,737)$ (328,760,065)$
Go vernmenta l Activities Bus ines s -type Activities To ta l
Current and o ther as s e tsCapita l as s e ts , ne t o f deprec ia tio n,
Sho rt-te rm liabilitiesOther liabilities
Res tric ted Unres tric ted

Management’s Discussion and Analysis For the Year Ended June 30, 2019
7
The following is a summary of the District’s changes in net position:
2019 2018 2019 2018 2019 2018
508,252$ 479,270$ 4,013,863$ 4,172,392$ 4,522,115$ 4,651,662$
83,432,587 113,989,660 63,395,302 64,335,594 146,827,889 178,325,254 Capita l grants & co ntributio ns 10,982,285 10,808,651
702,496,727 672,944,841 702,496,727 672,944,841 712,404,151 769,690,285 712,404,151 769,690,285 28,574,670 19,747,696 175,970 104,007 28,750,640 19,851,703
To ta l R e v e nue s 1,538,398,672 1,587,660,403 67,585,135 68,611,993 1,595,001,522 1,645,463,745
1,592,189,588 1,597,931,462 1,592,189,588 1,597,931,462 72,200,866 76,915,589 72,200,866 76,915,589
584,296 1,660,142 584,296 1,660,142 16,106,729 17,204,330 - 16,106,729 17,204,330
To ta l Expe ns e s 1,608,296,317 1,615,135,792 72,785,162 78,575,731 1,681,081,479 1,693,711,523
Tra ns fe rs , N e t (3,067,836) (3,054,027) 3,067,836 3,054,027 - -
(72,965,481) (41,338,067) (2,132,191) (6,909,711) (86,079,957) (48,247,778)
(346,219,376)$ (273,253,895)$ (57,638,361)$ (55,506,170)$ (403,857,737)$ (328,760,065)$
Go vernmenta l Ac tivitie s Bus ines s -type Activities To ta l
Revenues P ro gram revenues Charges fo r s e rvice Opera ting grants & co ntributio ns
Genera l revenues Lo ca l taxes S ta te s o urces Other
Expens es
N e t P o s it io n , End o f Ye a r
Scho o l o pera tio n & adminis tra tio n Scho o l fo o d s ervices Other bus ines s -type ac tivities Interes t o n debt s ervice
C ha ng e in N e t P o s it io n
Governmental Activities The revenues in the governmental funds decreased by $38.5 million. Most of this decrease was due to other state revenues as their portion of postemployment employee benefits liabilities decreased compared to previous years.
Management’s Discussion and Analysis For the Year Ended June 30, 2019
8
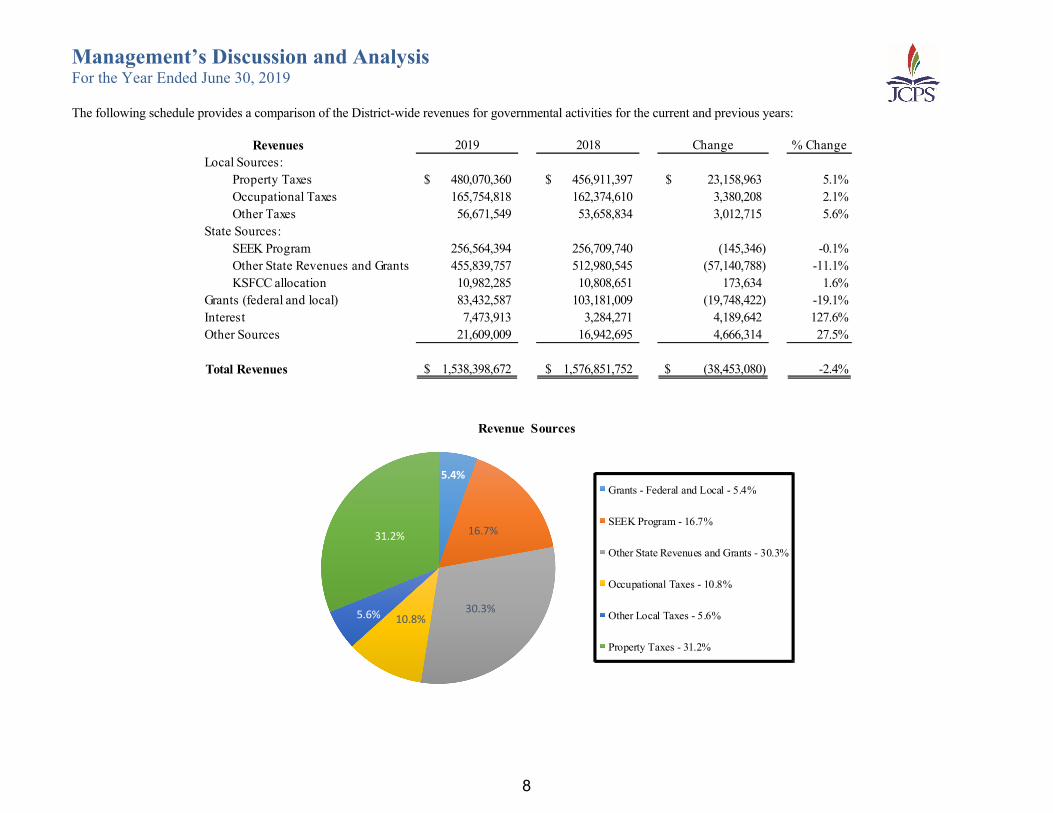
The following schedule provides a comparison of the District-wide revenues for governmental activities for the current and previous years:
Revenues 2019 2018 Change % ChangeLocal Sources:
Property Taxes 480,070,360$ 456,911,397$ 23,158,963$ 5.1%Occupational Taxes 165,754,818 162,374,610 3,380,208 2.1%Other Taxes 56,671,549 53,658,834 3,012,715 5.6%
State Sources:SEEK Program 256,564,394 256,709,740 (145,346) -0.1%Other State Revenues and Grants 455,839,757 512,980,545 (57,140,788) -11.1%KSFCC allocation 10,982,285 10,808,651 173,634 1.6%
Grants (federal and local) 83,432,587 103,181,009 (19,748,422) -19.1%Interest 7,473,913 3,284,271 4,189,642 127.6%Other Sources 21,609,009 16,942,695 4,666,314 27.5%
Total Revenues 1,538,398,672$ 1,576,851,752$ (38,453,080)$ -2.4%
5.4%
16.7%
30.3%10.8%5.6%
31.2%
Revenue Sources
Grants - Federal and Local - 5.4%
SEEK Program - 16.7%
Other State Revenues and Grants - 30.3%
Occupational Taxes - 10.8%
Other Local Taxes - 5.6%
Property Taxes - 31.2%

Management’s Discussion and Analysis For the Year Ended June 30, 2019
9
The following schedule provides a comparison of the District-wide expenses for governmental activities:
2019 2018 Change ChangeExpenses
Instruction 864,509,475$ 848,894,722$ 15,614,753$ 1.8% Student support services 69,122,283 66,627,124 2,495,159 3.7% Instructional staff support services 184,473,830 191,939,436 (7,465,606) -3.9% District administrative support services 9,417,079 8,792,408 624,671 7.1% School administrative support services 127,163,050 108,309,775 18,853,275 17.4% Business support services 65,847,780 70,521,907 (4,674,127) -6.6% Plant operations and maintenance 118,239,225 118,322,852 (83,627) -0.1% Transportation 124,412,708 158,063,796 (33,651,088) -21.3% Community services 28,399,457 26,377,760 2,021,697 7.7% Other instructional support services 64,987 60,065 4,922 8.2% Miscellaneous 539,714 21,617 518,097 2396.7% Interest 16,106,729 17,204,330 (1,097,601) -6.4%
Total Expenditures 1,608,296,317$ 1,615,135,792$ (6,839,475)$ -0.4%
53.8%23.7%
0.6%4.1%
7.4%7.7%
2.8% Expense Categories
Instruction - 53.8%
School-based support - 23.7%
District administration - 0.6%
Business services - 4.1%
Plant operations and maintenance - 7.4%
Transportation - 7.7%
Miscellaneous - 2.8%

Management’s Discussion and Analysis For the Year Ended June 30, 2019
10
Business-type Activities Net Position of the District’s business-type activities decreased $2.1 million. Most of this occurred due to accounting for other postemployment benefits as discussed further in Note H. School Food Service net position decreased $3.2 million. Daycare Operations expenses increased $.7 million and tuition preschool’s operating expenses increased $.3 million due to a change in their allocation percentage of the same postemployment benefits.
General Fund Budgetary Highlights and Future Budgetary Implications The District’s Draft Budget is presented to the members of the Board of Education by January 31 each year, followed by a Tentative (Original) Budget by May 30, and, once the members of the Board of Education approve tax rates in September, the Working (Final) Budget is submitted to the Kentucky Department of Education by September 30. General Fund expenditures were $104.3 million under budget. Approximately half of this amount was due to $53.2 million of ending fund balance budgeted but not spent in the Contingency category. Other categories such as instruction, instructional staff support services, and plant operations and maintenance came in less than budget due to staff temporary vacancies, conservative budgeting, and large construction projects still in progress. As a whole, our General Fund decreased fund balance by $9.8 million. As discussed further in the Local Economic Outlook section on page 13, the local economy is in a period of steady growth. For the Special Revenue Fund, the fund balance decreased by $1.0 million due to a $7.8 million decrease of Grants from local agencies and donors due to completed grants. Also the Grants from the United States government decreased $12.0 million because of the end of the Head Start grant as the District focused on the core K-12 mission. Overall, expenses decreased by $23.6 million for many of the same reasons that revenue also decreased, reduced funding and eliminated programs. Our Construction Fund experienced a $50.8 million increase during the year, as we funded numerous large projects with a bond sold in June 2019. The Building Fund decreased $5.3 million during the year as funds were utilized for priority renovation projects during the year. On whole, our Construction Fund and Building Fund are well structured for future capital needs. We anticipate our revenue stream remaining stable for routine activities into the future. In accordance with the requirements of Governmental Accounting Standards Board Statement number 68, Accounting and Reporting for Pensions and Government Accounting Standards Board Statement number 75, Accounting and Financial Reporting for Postemployment Benefits Other Than Pensions, the District has recorded its proportionate share of certain financial factors of the pensions in which its employees participate. These factors include certain inflows and outflows of funds which will be amortized over future years and net pension and net other postemployment benefits liabilities. The very nature of the net pension and net other postemployment benefits liabilities indicates that these pensions have not been fully funded, whether by employee contributions, employer contributions, or investment earnings. Although the District has always paid its entire contribution based on rates determined by each pension and much of the responsibility falls on the state, the need to shore up these pensions may become a factor in future employer match rates or state funding.

Management’s Discussion and Analysis For the Year Ended June 30, 2019
11
Capital Assets and Debt Administration Capital Assets At the end of June 30, 2019, the District’s investment in capital assets for its governmental and business-type activities was $744.8 million, representing a decrease of $23.4 million (net of depreciation), as shown in the following tables:
June 30, 2019 June 30, 2018 Percent Change
Governmental activities:Land 29,245,165$ 29,245,165$ 0.0%Land improvements 44,330,825 42,258,624 4.9%Buildings and improvements 1,303,932,636 1,295,133,281 0.7%Technology 93,186,199 95,956,210 -2.9%Buses and vehicles 104,897,126 106,903,884 -1.9%Furniture, fixtures and other 63,255,127 59,626,325 6.1%Construction in progress 25,900,633 25,855,619 0.2%
Total 1,664,747,711 1,654,979,108 0.6%Less: accumulated depreciation 939,357,417 906,525,858 3.6%
Governmental assets net of depreciation 725,390,294$ 748,453,250$ -3.1%
The District has prioritized renovating its schools in recent years. During the 2018-19 year, fewer of the District’s building renovations were put into service compared to the amount depreciated. However, we have maintained a facilities renovation budget, in addition to ongoing maintenance funding, of $65 million in an effort to remain on a 20-year upgrade cycle.
Management’s Discussion and Analysis For the Year Ended June 30, 2019
12
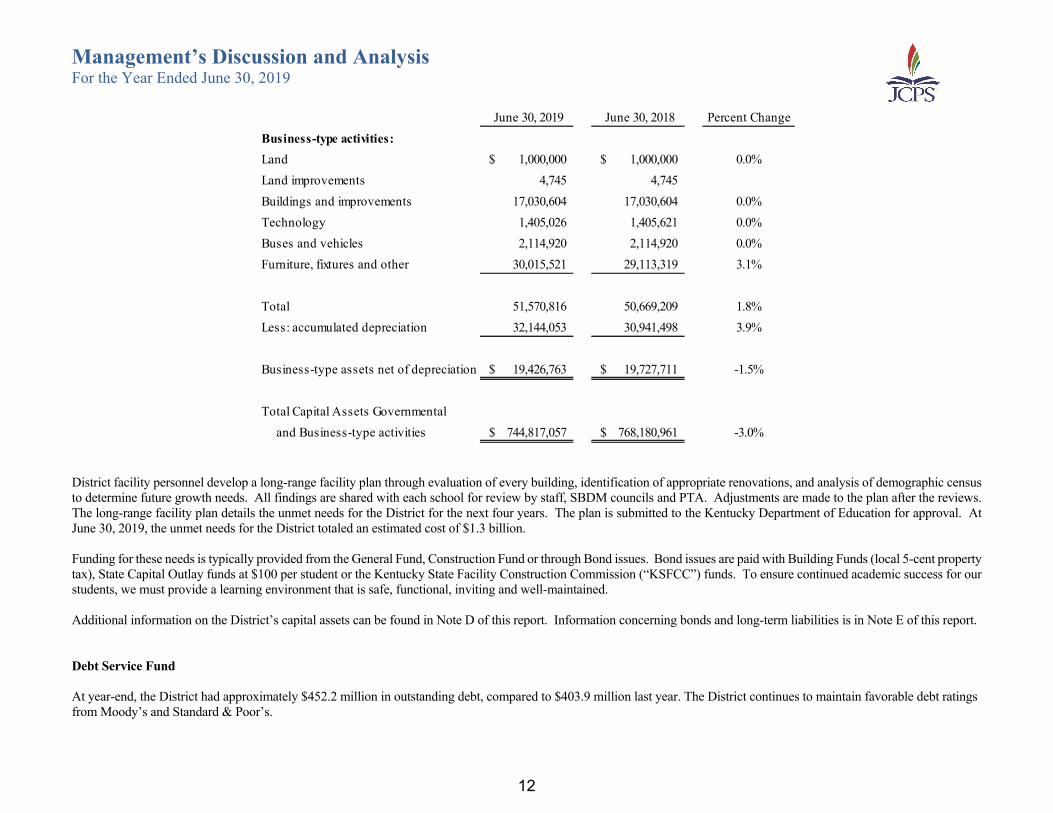
June 30, 2019 June 30, 2018 Percent ChangeBusiness-type activities:Land 1,000,000$ 1,000,000$ 0.0%Land improvements 4,745 4,745 Buildings and improvements 17,030,604 17,030,604 0.0%Technology 1,405,026 1,405,621 0.0%Buses and vehicles 2,114,920 2,114,920 0.0%Furniture, fixtures and other 30,015,521 29,113,319 3.1%
Total 51,570,816 50,669,209 1.8%Less: accumulated depreciation 32,144,053 30,941,498 3.9%
Business-type assets net of depreciation 19,426,763$ 19,727,711$ -1.5%
Total Capital Assets Governmental and Business-type activities 744,817,057$ 768,180,961$ -3.0%
District facility personnel develop a long-range facility plan through evaluation of every building, identification of appropriate renovations, and analysis of demographic census to determine future growth needs. All findings are shared with each school for review by staff, SBDM councils and PTA. Adjustments are made to the plan after the reviews. The long-range facility plan details the unmet needs for the District for the next four years. The plan is submitted to the Kentucky Department of Education for approval. At June 30, 2019, the unmet needs for the District totaled an estimated cost of $1.3 billion. Funding for these needs is typically provided from the General Fund, Construction Fund or through Bond issues. Bond issues are paid with Building Funds (local 5-cent property tax), State Capital Outlay funds at $100 per student or the Kentucky State Facility Construction Commission (“KSFCC”) funds. To ensure continued academic success for our students, we must provide a learning environment that is safe, functional, inviting and well-maintained. Additional information on the District’s capital assets can be found in Note D of this report. Information concerning bonds and long-term liabilities is in Note E of this report. Debt Service Fund At year-end, the District had approximately $452.2 million in outstanding debt, compared to $403.9 million last year. The District continues to maintain favorable debt ratings from Moody’s and Standard & Poor’s.

Management’s Discussion and Analysis For the Year Ended June 30, 2019
13
Local Economic Outlook The District is enjoying a period of growth in our economy-driven revenues, such as a 2.1% increase in occupational license taxes which are based on net profits and salaries paid within our jurisdiction. This marks the ninth consecutive year occupational license taxes have increased. Additionally, Jefferson County property valuation assessments have shown 4.7% growth for the 2019-2020 school year, continuing to grow for the ninth consecutive year as well. Louisville maintains some resiliency by being a regional hub of many companies or industries. Inherent strength can be found in the balance among the educational, health and social services, manufacturing, professional services, retail trade, tourism, insurance, and transportation sectors. Additional growth has followed the completion of two additional Ohio River bridges in 2015 and 2016, the new Omni Louisville Hotel downtown in 2018, and the completed major renovation of the Kentucky International Convention Center in 2018. This diversified growth positions Jefferson County well and is one reason why our unemployment rate is at 4.3% according to the Bureau of Labor Statistics. Jefferson County’s central location, extensive transportation network and quality of life are factors in attracting and maintaining a healthy business community. Recently, Louisville Metro was named the top region for manufacturing in the U. S. by Forbes. Louisville has been called one of the best cities for theatre by Paste Magazine, and cited as one of the best food cities in the world by National Geographic, The Culture Trip, Thrillist, and World Food Traveler. Trulia.com has named Louisville the third most affordable place to live in the United States, and Bankrate ranks Louisville in the top ten for homeownership. Overall, with many local and national businesses expanding their footprint in Jefferson County and excellent quality of life, Jefferson County’s economy has the stability necessary to minimize the impact of economic downturns. Contacting the Jefferson County Board of Education Management This financial report is designed to provide a general overview of the finances of the Jefferson County Board of Education and to show management’s accountability for these funds. If you have questions about this report or need additional information, contact the Chief Financial Officer/Treasurer of the Jefferson County Board of Education, P. O. Box 34020, Louisville, Kentucky 40232-4020.

14
Statement of Net PositionBoard of Education of Jefferson County, Kentucky
Governmental Business-Type Activities Activities Total
AssetsCash and cash equivalents $ 208,902,675 $ 10,132,473 $ 219,035,148 Investments 113,067,630 113,067,630 Accounts receivable 41,476,385 7,640,630 49,117,015 Prepaid expenses 2,423,932 2,423,932 Inventories 3,036,668 2,259,060 5,295,728 Internal balances 13,252,817 (13,252,817) Land and other nondepreciable assets 55,145,798 1,000,000 56,145,798 Capital assets, net of depreciation 670,244,496 18,426,763 688,671,259
Total Assets 1,107,550,401 26,206,109 1,133,756,510
Deferred O utflows of ResourcesDifference between actual and expected experience 13,918,509 1,464,424 15,382,933 Changes in assumptions 70,751,825 7,444,095 78,195,920 Deferred pension contributions after measurement date 37,563,431 3,952,205 41,515,636
Total Deferred O utflows 122,233,765 12,860,724 135,094,489
LiabilitiesAccrued liabilit ies 132,569,149 685,783 133,254,932 Accrued interest payable 3,394,438 3,394,438 Current maturities of
worker's compensation claims 1,719,670 1,719,670 accrued vacation pay 1,251,541 1,251,541 accrued sick leave 595,021 595,021 school building revenue bonds 30,205,000 30,205,000
Long-term maturities ofworker's compensation claims 25,527,347 25,527,347 accrued vacation pay 6,196,903 6,196,903 accrued sick leave 37,069,800 37,069,800 school building bonds 421,952,133 421,952,133
Net pension liability 426,723,043 44,897,314 471,620,357 Net post-employment benefits liabilities 430,248,348 45,268,228 475,516,576
Total Liabilities 1,517,452,393 90,851,325 1,608,303,718
Deferred Inflows of ResourcesDifference between projected and actual earnings on plan investments 14,930,171 1,570,865 16,501,036 Change in proportionate share 4,011,144 422,029 4,433,173 Difference between actual and expected experience 36,408,916 3,830,734 40,239,650 Changes in assumptions 287,417 30,241 317,658 Deferred savings from refunding bonds 2,913,501 2,913,501
Total Deferred Inflows 58,551,149 5,853,869 64,405,018
Net PositionNet investment in capital assets 334,282,855 19,426,763 353,709,618 Restricted for
Capital projects and construction 165,768,075 165,768,075 Grants and Awards 9,191,713 9,191,713
Unrestricted (Deficit) (855,462,019) (77,065,124) (932,527,143)
Total Net Position $ (346,219,376) $ (57,638,361) $ (403,857,737)
See Notes to Financial Statements
June 30, 2019

15
Statement of Activit iesBoard of Education of Jefferson County, Kentucky Year Ended June 30, 2019
Functions/ProgramsGovernmental activities
Instruction $ 864,509,475 $ 508,252 $ 83,432,587 $ (780,568,636) Student support services 69,122,283 (69,122,283) Instructional staff support services 184,473,830 (184,473,830) District administrative support services 9,417,079 (9,417,079) School administrative support services 127,163,050 (127,163,050) Business support services 65,847,780 (65,847,780) Plant operations and maintenance 118,239,225 $ 10,982,285 (107,256,940) Transportation 124,412,708 (124,412,708) Community services 28,399,457 (28,399,457) Other instructional support services 64,987 (64,987) Other 539,714 (539,714) Interest 16,106,729 (16,106,729)
Total governmental activit ies 1,608,296,317 508,252 83,432,587 10,982,285 (1,513,373,193)
Business-type activitiesSchool food services 72,200,866 3,023,797 62,846,921 (6,330,148) Adult education 171,152 183,017 31,525 43,390 Enterprise Programs 141,308 57,976 3,521 (79,811) Tuition-based pre-school 707,730 742,039 219,651 253,960 Day care operations (435,894) 7,034 293,684 736,612
Total business-type activities 72,785,162 4,013,863 63,395,302 (5,375,997)
Total Activities $ 1,681,081,479 $ 4,522,115 $ 146,827,889 $ 10,982,285 $ (1,518,749,190)
Changes in net positionNet Expense $ (1,513,373,193) $ (5,375,997) $ (1,518,749,190)
General revenuesTaxes
Property taxes 480,070,360 480,070,360 Occupational taxes 165,754,818 165,754,818 Other taxes 56,671,549 56,671,549
State sourcesSEEK program 256,564,394 256,564,394 Other state revenues and grants 455,839,757 455,839,757
Interest and investment earnings 7,473,913 175,970 7,649,883 Miscellaneous 21,100,757 21,100,757
Total general revenues 1,443,475,548 175,970 1,443,651,518
Transfers, net (3,067,836) 3,067,836
Change in net posit ion (72,965,481) (2,132,191) (75,097,672)
Net position, beginning of year (273,253,895) (55,506,170) (328,760,065)
Net position, end of year $ (346,219,376) $ (57,638,361) $ (403,857,737)
See Notes to Financial Statements
TotalDistrict-wide
Expenses
Total
Net (Expense) Revenue
Operating Grantsand Contributions
Capital Grantsand Contributions
Program Revenues
GovernmentActivities
Business-TypeActivities
Charges forServices

16
Balance Sheet - Governmental FundsBoard of Education of Jefferson County, Kentucky
Assets Cash and cash equivalents $ 138,282,822 $ 70,619,853 $ 208,902,675 Investments 113,067,630 113,067,630 Accounts and grants receivable 28,873,485 $ 12,550,533 $ 52,367 41,476,385 Prepaid expenditures 2,423,932 2,423,932 Inventories 3,036,668 3,036,668 Due from other funds 46,947,221 11,932,894 53,808,928 7,613,496 120,302,539
Total Assets $ 332,631,758 $ 24,483,427 $ 124,428,781 $ 7,665,863 $ 489,209,829
LiabilitiesAccrued liabilities $ 126,421,493 $ 1,454,106 $ 8,011,738 $ 248,042 $ 136,135,379 Due to other funds 74,419,536 13,837,608 18,792,578 107,049,722
Total Liabilities 200,841,029 15,291,714 26,804,316 248,042 243,185,101
Fund BalancesNonspendable 5,460,600 5,460,600 Restricted 9,191,713 97,624,465 7,417,821 114,233,999 Committed 36,000,000 36,000,000 Assigned 16,244,256 16,244,256 Unassigned 74,085,873 74,085,873
Total Fund Balances 131,790,729 9,191,713 97,624,465 7,417,821 246,024,728
Total Liabilities andFund Balances $ 332,631,758 $ 24,483,427 $ 124,428,781 $ 7,665,863 $ 489,209,829
Reconciliation of Total Governmental Fund Balance to Net Position of Governmental Activities
Total Governmental Fund Balances $ 246,024,728 Amounts reported for governmental activities in the statement of net assets are different because: Capital assets are not financial resources and are not reported in the fund financial statements. 725,390,294 Bonds are noncurrent liabilities and are excluded from the fund financial statements. (452,157,133) Savings from refunding bonds are not current and are not reported in the fund financial statements. (2,913,501) Long-term workers compensation liability is noncurrent and is excluded from the fund financial statements. (25,527,347) Long-term vacation pay liability is noncurrent and is excluded from the fund financial statements. (6,196,903) Long-term sick leave liability is noncurrent and is excluded from the fund financial statements. (37,069,800) Bond interest payable is a noncurrent liability and is excluded from the fund financial statements. (3,394,438) Net pension liability is noncurrent and is excluded from the fund financial statements. (426,723,043) Deferred outflows related to employee pension plans are excluded from the fund financial statements. 103,829,639 Deferred inflows related to pension plans are excluded from the fund statements. (33,416,960) Net other post-employment benefits liability is noncurrent and is excluded from the fund funancial statements. (430,248,348) Deferred outflows related to other post-retirement employee benefits are excluded from the fund financial statements. 38,247,066 Deferred inflows related to other post-retirement employee benefits are excluded from the fund financial statements. (42,063,630)
Net Position of Governmental Activities $ (346,219,376)
See Notes to Financial Statements
TotalGovernmental
FundsGeneral
Fund
Total NonmajorGovernmental
Funds
June 30, 2019Special
RevenueFund
ConstructionFund

17
S ta te me nt of Re ve nue s , Expe nditure s a nd Cha nge s in Fund Ba la nc e s - Gove rnme nta l Funds
Board of Education of Jefferson County, Kentucky Ye a r Ende d June 30, 2019
Re ve n u e s
Loc a l sourc e s
P rope rty ta xe s $ 442,127,249 $ 37,943,111 $ 480,070,360
Oc c upa tiona l ta xe s 165,754,818 165,754,818
Othe r ta xe s 56,671,549 56,671,549
Gra nts from loc a l a ge nc ie s a nd donors $ 4,216,634 4,216,634
S ta te sourc e s
S EEK progra m 247,934,805 8 ,629,589 256,564,394
Othe r s ta te re ve nue s 304,164,747 31,675,825 335,840,572
KS FCC a lloc a tion 10,982,285 10,982,285
Gra nts from the Unite d S ta te s gove rnme nt 79,215,953 79,215,953
Inte re s t 7 ,371,642 30,934 $ 71,337 7,473,913
Othe r sourc e s 10,936,241 24,482 7,076,189 18,036,912
To ta l Re ve n u e s 1,234,961,051 115,163,828 71,337 64,631,174 1,414,827,390
Exp e n d itu re s
Ins truc tion 696,775,984 63,236,081 3,629,301 763,641,366
S tude nt support se rvic e s 64,333,903 3 ,827,636 68,161,539
Ins truc tiona l s ta ff support se rvic e s 104,439,256 36,402,816 140,842,072
Dis tric t a dminis tra tive support se rvic e s 6,651,351 162,874 6,814,225
S c hool a dminis tra tive support se rvic e s 114,442,496 584,676 115,027,172
Bus ine ss support se rvic e s 45,181,438 640,797 45,822,235
P la nt ope ra tions a nd ma inte na nc e 116,359,814 1,010,374 68,179 117,438,367
Tra nsporta tion 87,360,599 1,831,490 89,192,089
Community se rvic e s 2,954,223 8 ,129,613 11,083,836
Othe r ins truc tiona l support se rvic e s 47,026 17,961 64,987
Building re nova tions 1,159,222 53,010,838 54,170,060
Othe r 23,904 2 ,264,215 497,067 2 ,785,186
De bt se rvic e
P rinc ipa l 35,151,226 35,151,226
In te re s t 16,569,151 16,569,151
To ta l Exp e n d itu re s 1,239,729,216 118,108,533 53,507,905 55,417,857 1,466,763,511
Continue d
Ge ne ra l
Fund
S pe c ia l
Re ve nue
Fund
Tota l
Gove rnme nta l
Funds
Tota l Nonma jor
Gove rnme nta l
Funds
Construc tion
Fund

18
S ta te me nt of Re ve nue s , Expe nditure s a nd Cha nge s in Fund Ba la nc e s - Gove rnme nta l Funds- - Continue d
Board of Education of Jefferson County, Kentucky Ye a r Ende d June 30, 2019
Re ve n u e s in Exc e s s o f
(Le s s Th a n ) Exp e n d itu re s (4 ,768,165) (2 ,944,705) (53,436,568) 9 ,213,317 (51,936,121)
O th e r Fin a n c in g S o u rc e s (Us e s )
P roc e e ds of sc hool building re ve nue bonds 84,485,000 84,485,000
P re miums on bonds sold 5,877,974 5 ,877,974
Tra nsfe rs to P roprie ta ry Funds (3,072,836) 5,000 (3,067,836)
Tra nsfe rs in 150,241 2,065,995 16,609,998 38,116,196 56,942,430
Tra nsfe rs out (2,065,995) (150,241) (2,772,114) (51,954,080) (56,942,430)
To ta l O th e r Fin a n c in g
S o u rc e s (Us e s ) (4,988,590) 1,920,754 104,200,858 (13,837,884) 87,295,138
Ne t Ch a n g e in Fu n d B a la n c e s (9,756,755) (1,023,951) 50,764,290 (4,624,567) 35,359,017
Fu n d B a la n c e s , B e g in n in g
o f Ye a r 141,547,484 10,215,664 46,860,175 12,042,388 210,665,711
Fu n d B a la n c e s , En d o f Ye a r $ 131,790,729 $ 9,191,713 $ 97,624,465 $ 7,417,821 $ 246,024,728
Re c o n c ilia tio n o f th e S ta te me n t o f Re ve n u e s , Exp e n d itu re s a n d Ch a n g e s in Fu n d B a la n c e s
o f G o ve rn me n ta l Fu n d s to th e S ta te me n t o f Ac tivitie s
Ne t Cha nge in Fund Ba la nc e s - Tota l Gove rnme nta l Funds $ 35,359,017
Amounts re porte d for gove rnme ntal ac tivitie s in the s tate me nt of ac tivitie s are diffe re nt be c ause
Additions to c a pita l a sse ts c a pita lize d on dis tric t- wide s ta te me nt of ne t pos ition. 96,827,272
Dispos itions of c a pita l a sse ts a re re fle c te d on the s ta te me nt of a c tivitie s . (66,320,628)
Ca pita l a sse t use is e xpe nse d a s de pre c ia tion on the s ta te me nt of a c tivitie s . (53,569,600)
Bond princ ipa l pa yme nts a re re c orde d a s a re duc tion of a lia bility on the s ta te me nt of ne t pos ition. 35,151,226
Bonds issue d a re c a pita lize d on the s ta te me nt of ne t pos ition. (84,514,358)
Ca pita lize d sa vings from bond re fundings must be a mortize d ove r the re ma ining life of the bonds . 662,375
Bond inte re s t pa ya ble is re fle c te d on the full a c c rua l ba s is on the s ta te me nt of ne t pos ition. 462,422
Long- te rm worke rs c ompe nsa tion lia bility inc re a se d on the dis tric t- wide fina nc ia l s ta te me nts . (146,468)
Long- te rm va c a tion pa ya ble inc re a se d on the dis tric t- wide fina nc ia l s ta te me nts . 171,386
Long- te rm s ic k le a ve pa ya ble de c re a se d on the dis tric t- wide fina nc ia l s ta te me nts . 775,545
P e ns ion e xpe nse re pre se nts the c os t of providing long- te rm be ne fits on the s ta te me nt of a c tivitie s . (17,511,503)
Cha nge s in de fe rre d outflows re la te d to pe ns ion pla ns a re long- te rm in na ture a nd a re on the dis tric t- wide s ta te me nt of a c tivitie s . (25,213,287)
Cha nge s in de fe rre d inflows re la te d to pe ns ion pla ns a re long- te rm in na ture a nd a re on the dis tric t- wide s ta te me nt of a c tivitie s . 9 ,875,722
Cha nge s in de fe rre d outflows re la te d to othe r pos t- re tire me nt e mploye e be ne fits a nd a re on the dis tric t- wide s ta te me nt of a c tivitie s . 793,384
Cha nge s in de fe rre d inflows re la te d to othe r pos t- re tire me nt e mploye e be ne fits a nd a re on the dis tric t- wide s ta te me nt of a c tivitie s . (30,658,557)
Expe nse s re la te d to othe r pos t- re tire me nt e mploye e be ne fits re pre se nts long- te rm e mployme nt c os ts on the s ta te me nt of a c tivitie s . 24,890,571
Ch a n g e in Ne t P o s itio n o f Go ve rn me n ta l Ac tivitie s $ (72,965,481)
S e e Note s to the Fina nc ia l S ta te me nts
Cons truc tion
Fund
Tota l Nonma jor
Gove rnme nta l
Funds
Tota l
Gove rnme nta l
Funds
Ge ne ra l
Fund
S pe c ia l
Re ve nue
Fund

19
Statement of Net Position - Proprietary FundsBoard of Education of Jefferson County, Kentucky
School Food Total NonmajorServices Total
AssetsCurrent Assets
Cash and cash equivalents $ 9,805,398 $ 327,075 $ 10,132,473 Accounts receivable 7,640,630 7,640,630 Inventories 2,259,060 2,259,060 Due from other funds 1,064,218 1,064,218
Total Current Assets 19,705,088 1,391,293 21,096,381
Capital Assets, net of accumulated depreciation 19,426,763 19,426,763
Total Assets 39,131,851 1,391,293 40,523,144
Deferred Outflows of ResourcesDifference between actual and expected experience 1,439,375 25,049 1,464,424Difference between projected and
actual earnings on plan investments 2,052,047 35,712 2,087,759Changes in assumptions 7,316,761 127,334 7,444,095Pension contributions after measurement date 3,884,601 67,604 3,952,205
Total Deferred Outflows of Resources 14,692,784 255,699 14,948,483
LiabilitiesCurrent Liabilities
Accrued liabilities 684,900 883 685,783 Due to other funds 14,210,903 106,132 14,317,035
Total Current Liabilities 14,895,803 107,015 15,002,818
Noncurrent LiabilitiesUnfunded pension liabilities 44,129,328 767,986 44,897,314 Unfunded post-employment benefits liabilitites 44,493,896 774,332 45,268,228
Total Liabilities 103,519,027 1,649,333 105,168,360
Deferred Inflows of ResourcesDifferences between projected and
actual earnings on plan investments 3,596,042 62,582 3,658,624 Differences between actual and expected experience 3,765,208 65,526 3,830,734 Changes in assumptions 29,723 518 30,241 Change in proportionate share 414,810 7,219 422,029
Total Deferred Inflows of Resources 7,805,783 135,845 7,941,628
Net Position
Net investment in capital assets 19,426,763 19,426,763 Unrestricted (76,926,938) (138,186) (77,065,124)
Total Net Position $ (57,500,175) $ (138,186) $ (57,638,361)
See Notes to Financial Statements
Enterprise Funds
Enterprise Funds
June 30, 2019
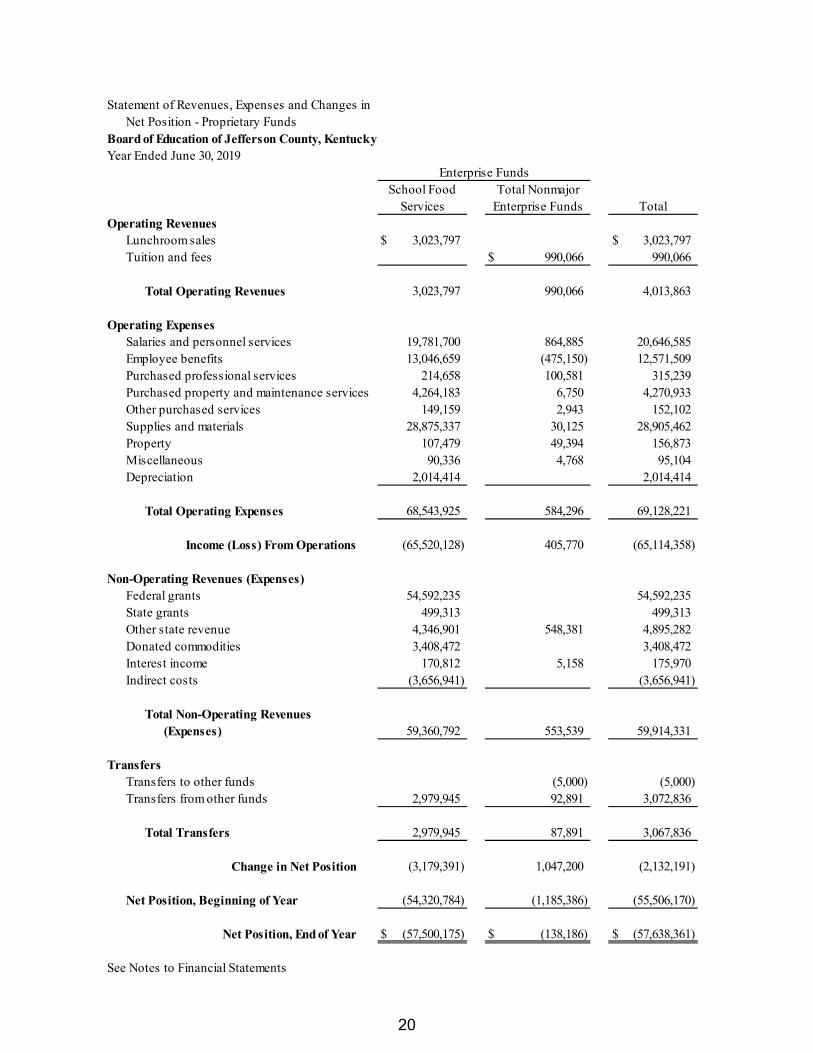
20
Statement of Revenues, Expenses and Changes in Net Position - Proprietary Funds
Board of Education of Jefferson County, KentuckyYear Ended June 30, 2019
Operating RevenuesLunchroom sales $ 3,023,797 $ 3,023,797Tuition and fees $ 990,066 990,066
Total Operating Revenues 3,023,797 990,066 4,013,863
Operating ExpensesSalaries and personnel services 19,781,700 864,885 20,646,585Employee benefits 13,046,659 (475,150) 12,571,509Purchased professional services 214,658 100,581 315,239Purchased property and maintenance services 4,264,183 6,750 4,270,933Other purchased services 149,159 2,943 152,102Supplies and materials 28,875,337 30,125 28,905,462Property 107,479 49,394 156,873Miscellaneous 90,336 4,768 95,104Depreciation 2,014,414 2,014,414
Total Operating Expenses 68,543,925 584,296 69,128,221
Income (Loss) From Operations (65,520,128) 405,770 (65,114,358)
Non-Operating Revenues (Expenses)Federal grants 54,592,235 54,592,235State grants 499,313 499,313Other state revenue 4,346,901 548,381 4,895,282Donated commodities 3,408,472 3,408,472Interest income 170,812 5,158 175,970Indirect costs (3,656,941) (3,656,941)
Total Non-Operating Revenues(Expenses) 59,360,792 553,539 59,914,331
TransfersTransfers to other funds (5,000) (5,000)Transfers from other funds 2,979,945 92,891 3,072,836
Total Transfers 2,979,945 87,891 3,067,836
Change in Net Position (3,179,391) 1,047,200 (2,132,191)
Net Position, Beginning of Year (54,320,784) (1,185,386) (55,506,170)
Net Position, End of Year $ (57,500,175) $ (138,186) $ (57,638,361)
See Notes to Financial Statements
Total
Enterprise FundsSchool Food
ServicesTotal Nonmajor
Enterprise Funds

21
Statement of Cash Flows - Proprietary FundsBoard of Education of Jefferson County, KentuckyYear Ended June 30, 2019
Cash Flows From Operating ActivitiesCash received from customers $ 3,023,797 $ 917,235 $ 3,941,032 Cash paid to suppliers (17,846,086) 14,286 (17,831,800) Cash paid to employees (30,333,627) (1,274,930) (31,608,557) Cash paid for other expenses (304,994) (105,349) (410,343)
Net Cash Used in Operating Activities (45,460,910) (448,758) (45,909,668)
Cash Flows From Investing ActivitiesInterest income 170,812 5,158 175,970
Net Cash Provided By Investing Activities 170,812 5,158 175,970
Cash Flows From Capital and Related Financing ActivitiesAdditions to capital assets (1,713,466) (1,713,466) Disposals of capital assets (13,663) (13,663) Payments of school building revenue bonds (1,113,962) (1,113,962)
Net Cash Used in Capital and Related Financing Activities (2,841,091) (2,841,091)
Cash Flows from Noncapital Financing ActivitiesCash used for operational grant required match (3,643,278) (5,000) (3,648,278) Cash received for operational grants 52,260,675 548,381 52,809,056
48,617,397 543,381 49,160,778
Increase in Cash and Cash Equivalents 486,208 99,781 585,989
Cash and Cash Equivalents, Beginning of Year 9,319,190 227,294 9,546,484
Cash and Cash Equivalents, End of Year $ 9,805,398 $ 327,075 $ 10,132,473
Continued
Totals
Net Cash Provided by Noncapital Financing Activities
Enterprise FundsSchool Food
ServicesTotal Nonmajor
Enterprise Funds

22
Statement of Cash Flows - Proprietary Funds--ContinuedBoard of Education of Jefferson County, KentuckyYear Ended June 30, 2019
Reconciliation of Loss from Operations to Net CashProvided by (Used in) Operating Activities
Income (Loss) from operations $ (65,520,128) $ 405,770 $ (65,114,358) Adjustments to reconcile loss from operations to cash
provided by (used in) operating activities:Depreciation 2,014,414 2,014,414 Donated commodities 3,408,472 3,408,472 Transfers 2,979,945 92,891 3,072,836 Change in operational accounts receivable 8,319 8,319 Change in amounts due from other funds (174,041) (174,041) Change in inventories 224,454 224,454 Change in deferred outflows 2,838,823 254,859 3,093,682 Change in amounts due to other funds 8,666,427 106,132 8,772,559 Change in accrued liabilities 270,774 (2,634) 268,140 Change in deferred inflows 2,046,269 (31,884) 2,014,385 Change in unfunded postemployment benefits liabili (3,430,903) (621,306) (4,052,209) Change in unfunded pension liability 1,040,543 (486,864) 553,679
Net Cash Used in Operating Activities $ (45,460,910) $ (448,758) $ (45,909,668)
Summary of Noncash Financing Activity
Donated commodities from the US Dept of Agricultu 3,408,472$ District facilities support -- rent forgiven on cafeteria 2,979,945$ Depreciation 2,014,414$
See Notes to the Financial Statements
Totals
Enterprise FundsSchool Food Total Nonmajor
Services Enterprise Funds

23
Statement of Net AssetsJefferson County Public Education Foundation, a Major Component Unit of
the Board of Education of Jefferson County, Kentucky
TotalAssets
Cash and cash equivalents $ 1,022,756Investments 1,309,094
Total Assets $ 2,331,850
Net AssetsWithout donor restrictions $ 60,072With donor restrictions 2,271,778
Total Net Assets $ 2,331,850
Statement of Revenues, Expenses and Changes in Net AssetsYear Ended June 30, 2019
Without Donor With DonorRestrictions Restrictions Total
Operating RevenuesContributions $ 60,904 $ 633,050 $ 693,954Net investment income 106 111,569 111,675Net assets released from restriction 704,397 (704,397)
Total Operating Revenues 765,407 40,222 805,629
Operating ExpensesProgram services 701,568 701,568Management and general 52,147 52,147Fundraising 5,000 5,000
Total Operating Expenses 758,715 758,715
Change in Net Assets 6,692 40,222 46,914
Net Assets, Beginning of Year 53,380 2,231,556 2,284,936
Net Assets, End of Year $ 60,072 $ 2,271,778 $ 2,331,850
See Notes to Financial Statements
June 30, 2019

24
Statement of Fiduciary Net PositionBoard of Education of Jefferson County, Kentucky
FundsAssets
Cash and cash equivalents $ 5,139,673Investments 681,367Accounts receivable 761,541Inventories 287,518
Total Assets $ 6,870,099
LiabilitiesAccrued liabilities $ 111,015Due to student groups 6,759,084
Total Liabilities $ 6,870,099
See Notes to Financial Statements
TotalAgency
June 30, 2019

Notes to the Financial Statements For the Year Ended June 30, 2019
25
Note A— Summary of Significant Accounting Policies Reporting Entity--The Board of Education of Jefferson County, Kentucky (the “District”) is established under and governed by the Kentucky School Laws and maintains a system of schools primarily for kindergarten through twelfth grade, but also including pre-school, vocational and adult education. The District is a school district of the Commonwealth of Kentucky having boundaries coterminous with the boundaries of Jefferson County, excluding the City of Anchorage. The accompanying financial statements include all funds and activities of the District, including the Jefferson County School Board Finance Corporation (the “Corporation”), a non-stock, not-for-profit Corporation. The Corporation is a blended component unit and was created to act as an agency in the acquisition and financing of any capital project which may be undertaken by the District. Accounts of the Corporation are included in the financial statements as a capital projects fund. The District is not includable as a component unit within another reporting entity. Board members are elected by the public and have decision-making authority, the power to designate management, the responsibility to develop policies which may influence operations and primary accountability for fiscal matters. Accounting Standards--The financial statements of the District have been prepared in conformity with generally accepted accounting principles (“GAAP”) as applied to government units. The Governmental Accounting Standards Board (“GASB”) is the accepted standard-setting body for establishing governmental accounting and financial reporting principles. District-wide and Fund Financial Statements--The District-wide financial statements (the Statement of Net Position and the Statement of Activities) display information about the reporting government as a whole. These statements report information on all the activities of the District, except for the fiduciary funds. The doubling-up effect of interfund activity has been removed from these statements. Governmental activities, which normally are supported by tax revenues, are reported separately from business-type activities, which rely significantly on fees and charges for support. The Statement of Activities demonstrates the degree to which the direct expenses of a given function or segment are offset by program revenues. Direct expenses are those that are clearly identifiable with a specific function or segment. Program revenues include: 1) charges to students or parents who purchase, use, or directly benefit from goods, services, or privileges provided by a given function or program; and 2) grants and contributions that are restricted to meeting the operational or capital requirements of a particular function or program. Taxes and other items not properly included among program revenues are reported instead as general revenues. The District allocates certain indirect costs to be included in the program expense reported for individual functions and activities in the District-wide Statement of Activities. Separate financial statements are provided for governmental funds, proprietary funds and fiduciary funds, even though fiduciary funds are excluded from the District-wide financial statements. Major individual governmental funds are reported as separate columns in the fund financial statements. Measurement Focus and Basis of Accounting--The District-wide financial statements are reported using the economic resources measurement focus and the accrual basis of accounting, as are the proprietary fund financial statements. The fiduciary fund financial statements are reported using the accrual basis of accounting. Revenues are recorded when earned and expenses are recorded when a liability is incurred, regardless of the timing of related cash flows. Property taxes are recognized as revenues in the year for which they are levied. Grants and similar items are recognized as revenue as soon as all eligibility requirements imposed by the provider have been met. Continued

Notes to the Financial Statements For the Year Ended June 30, 2019
26
Note A—Summary of Significant Accounting Policies--Continued Governmental fund financial statements are reported using the current financial resources measurement focus and the modified accrual basis of accounting. Each fund is a separate accounting entity with a self-balancing set of accounts. Revenues are recognized as soon as they are both measurable and available. Revenues are considered to be available when they are collectible during the current period or soon enough thereafter to pay liabilities of the current period. For this purpose, the District considers revenues to be available if they are collected within 60 days of the end of the current fiscal year. Expenditures generally are recorded when a liability is incurred, as under accrual accounting. However, debt service expenditures, as well as expenditures related to compensated absences and workers’ compensation claims, are recorded only when payment is due. Revenues susceptible to accrual are property taxes, interest revenue and charges for services. Occupational tax revenues are not susceptible to accrual because generally they are not measurable until received in cash. Funds are classified into three categories: governmental, proprietary and fiduciary. The District reports the following major governmental funds:
The General Fund is the District’s primary operating fund, which accounts for all of the activities of the general government not required to be accounted for in another fund. Local taxes account for 53% of the General Fund revenues, while the Support Education Excellence in Kentucky (“SEEK”) program accounts for 20.7% of General Fund revenues. SEEK is a program that began in 1990 as the result of the Kentucky Education Reform Act (“KERA”), and is the basic state funding spent by the District. Other state revenues are 25% of General Fund revenues and are principally health insurance for all employees and teachers pension match paid by the state on the District’s behalf, as discussed further on page 30 of Note A.
The Special Revenue Fund is a special revenue fund which accounts for the activities of specific education related programs in accordance with restrictions established by the various grantors (primarily the United States Government and state and local governments). This includes certain KERA grants which carry grantor restrictions related to expenditures. The Construction Fund accounts for funds from three sources. First, funds generated by sales of bond issues are used for various construction projects at educational facilities. Second, proceeds from the sale of properties and equipment owned by the District are to be used at the discretion of the District for future construction projects. Last, any funds remaining in the Capital Outlay and Building Funds at the end of the year are escrowed to pay for categorical priorities listed in the Long-Range Facility Plan, discussed on page 13 of the MD&A.
Proprietary Funds distinguish operating revenues and expenses from non-operating items. Operating revenues and expenses generally result from providing services or producing and delivering goods in connection with a proprietary fund’s principal ongoing operations. Operating expenses include the cost of sales and services, administrative expenses, and depreciation of capital assets. All revenues and expenses not meeting this definition are reported as non-operating revenues and expenses. The District reports as a major proprietary fund the School and Community Nutrition Services (“Food Service”) Program which provides certain food preparation at the Nutrition Center and serves breakfast and lunch at schools throughout Jefferson County.
Fiduciary Funds are used to account for assets held on behalf of outside parties or on behalf of other funds within the District. This fund consists of agency funds for various scholarship programs administered by the District on behalf of the third-party donors, and agency funds held on behalf of student organizations and segregated among elementary schools, middle schools and high schools. Since fiduciary funds are held on behalf of others, these funds are excluded from the District-wide financial statements on pages 14-15.
Continued

Notes to the Financial Statements For the Year Ended June 30, 2019
27
Note A—Summary of Significant Accounting Policies—Continued Component Unit--The Jefferson County Public Education Foundation (JCPEF) is a 501(c)(3) public charity whose predominate mission is to support Jefferson County Public Schools, its students, and its staff. It maintains separate accounting records with full financial authority and a completely independent Board. As the only component unit, it qualifies as major and is reported as a separate financial statement of major component units. JCPEF maintains its financial records using the modified cash basis. These records have been audited separately and a copy of their financial statements can be obtained at Jefferson County Public Education Foundation, VanHoose Education Center, 3332 Newburg Road, Louisville, KY, 40218. JCPEF reports net assets and revenues, expenses, gains, and losses based on the existence or absence of donor-imposed restrictions. Accordingly, net assets of JCPEF and changes therein are classified and reported as follows: Without donor restriction – The portion of expendable funds available for support in the operation of JCPEF. With donor restrictions – Net assets subject to donor-imposed stipulations. These net assets include those that may or will be met either by actions of JCPEF and/or the passage of time and also include $1,216,488 permanent endowment funds. JCPEF maintains cash in a bank account insured by FDIC insured account. When balances exceeded FDIC limits, excess amounts exposed to credit risk were secured by United States Treasury repurchase agreements. Investments remain subject to custodial credit risk, interest rate risk, and concentration of credit risk as outlined in Note B. All investments have been measured and reported at fair value according to the hierarchy explained in Note B:
Quoted Prices in Acitve Significant Other Significant OtherComponent Unit Investments Markets for Identical Observable Unobservable by Fair Value Level 6/30/2019 Assets - Level 1 Inputs - Level 2 Inputs - Level 3
Treasury notes 70,602$ 70,602$ Corporate bonds 284,221 284,221 Mutual funds - fixed 23,157 23,157$ Equities 609,378 609,378 Mutual funds - equity 111,138 111,138 Exchange traded funds 210,598 210,598
Total Investments 1,309,094$ 954,271$ 354,823$
Cash and Cash Equivalents--The District considers demand deposits, money market funds, and other investments with an original maturity of 90 days or less, to be cash equivalents. Continued

Notes to the Financial Statements For the Year Ended June 30, 2019
28
Note A—Summary of Significant Accounting Policies—Continued Inventories--Inventories are valued at the lower of cost, using the first in, first out method, or market. Generally, the only inventory items marked to market are diesel, gasoline, and items determined to be obsolete with no current market value. The Food Service Fund’s inventories consist of food and supplies valued at cost and U. S. Government commodities whose value is determined by the U. S. Department of Agriculture. In the governmental funds balance sheet, reported inventories in the general fund are equally offset by a fund balance reserve which indicates that they do not constitute “available spendable resources” even though they are a component of total assets. Capital Assets--Capital assets include land, buildings, vehicles, office equipment, school equipment, and food service equipment, and are reported in the applicable governmental or business-type activities column in the District-wide Statement of Net Position. The District maintains a record of its capital assets, and those with a cost of $1,000 or more are capitalized. All computers, regardless of cost, are capitalized. Additions to capital assets are recorded at cost and depreciated using the straight-line method. The District has elected not to capitalize interest on debt used to finance buildings. Capital assets are depreciated over estimated useful lives as determined by the Kentucky Department of Education, as follows: Estimates--The preparation of financial statements in conformity with generally accepted accounting principles requires management to make estimates and assumptions that affect reported amounts of assets and liabilities, and disclosure of contingent assets and liabilities at the date of the financial statements, and the reported amounts of revenues and expenses during the reporting period. Actual results could differ from those estimates. Continued
Estimated life (years) Land improvements 20 Buildings 50 Building improvements 25 Carpet/tile 7 Technology equipment 5 School buses 10 Other vehicles 5 Rolling stock 15 Food service equipment 12 Furniture and fixtures 20 Audio-visual equipment 15 Other general equipment 10 Musical Instrument 10
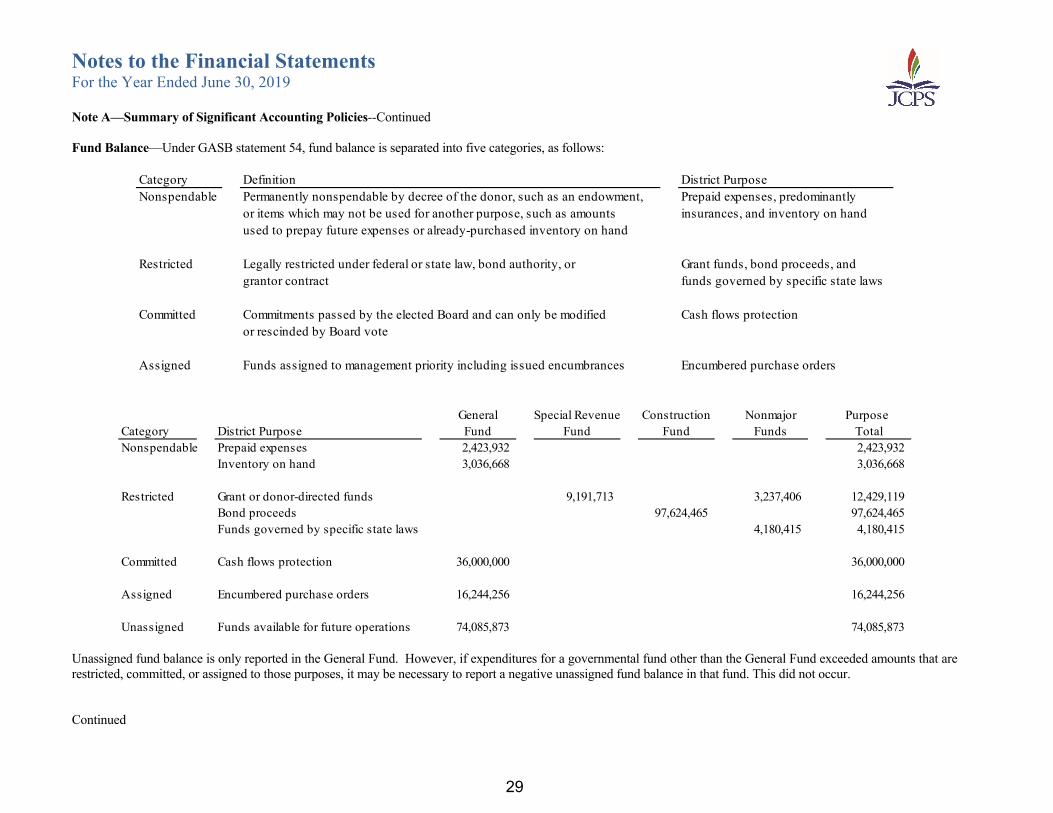
Notes to the Financial Statements For the Year Ended June 30, 2019
29
Note A—Summary of Significant Accounting Policies--Continued Fund Balance—Under GASB statement 54, fund balance is separated into five categories, as follows:
Category Definition District PurposeNonspendable Permanently nonspendable by decree of the donor, such as an endowment, Prepaid expenses, predominantly
or items which may not be used for another purpose, such as amounts insurances, and inventory on handused to prepay future expenses or already-purchased inventory on hand
Restricted Legally restricted under federal or state law, bond authority, or Grant funds, bond proceeds, and grantor contract funds governed by specific state laws
Committed Commitments passed by the elected Board and can only be modified Cash flows protectionor rescinded by Board vote
Assigned Funds assigned to management priority including issued encumbrances Encumbered purchase orders
General Special Revenue Construction Nonmajor Purpose Category District Purpose Fund Fund Fund Funds TotalNonspendable Prepaid expenses 2,423,932 2,423,932
Inventory on hand 3,036,668 3,036,668
Restricted Grant or donor-directed funds 9,191,713 3,237,406 12,429,119 Bond proceeds 97,624,465 97,624,465 Funds governed by specific state laws 4,180,415 4,180,415
Committed Cash flows protection 36,000,000 36,000,000
Assigned Encumbered purchase orders 16,244,256 16,244,256
Unassigned Funds available for future operations 74,085,873 74,085,873
Unassigned fund balance is only reported in the General Fund. However, if expenditures for a governmental fund other than the General Fund exceeded amounts that are restricted, committed, or assigned to those purposes, it may be necessary to report a negative unassigned fund balance in that fund. This did not occur. Continued

Notes to the Financial Statements For the Year Ended June 30, 2019
30
Note A—Summary of Significant Accounting Policies—Continued It is the District’s practice to liquidate funds when conditions have been met releasing these funds from legal, contractual, District, or managerial obligations, using restricted funds first, followed by committed funds, assigned funds, then unassigned funds. Encumbrances are not liabilities and, therefore, are not recorded as expenditures until receipt of material or service. Encumbrances remaining open at the end of the fiscal year are automatically re-budgeted in the following fiscal year. Encumbrances are considered a managerial assignment of fund balance in the governmental funds balance sheet. Board policy 04.31 grants this authority to the Superintendent or the Superintendent’s designee. The Superintendent has granted fund balance assignment authority to the Director of Purchasing. Statutorily, the Kentucky Department of Education may assume financial control over any school district whose fund balance drops below 2% of the total expenditures of certain funds. To maintain balances above this level, they recommend reserving at least 5%. The elected Jefferson County Board of Education committed funds to ensure fund balance remains above these levels. While these funds have been properly committed and not budgeted for future years’ expenditures, there is no mandate on how the committed funds would be used if the District fell below the 2% floor. Property Tax Revenues--Property taxes are levied each November on the assessed value listed as of the prior January 1 for all real and personal property in Jefferson County. The billings are considered due upon receipt by the taxpayer; however, the actual due date is based on a period ending 30 days after the tax bill mailing. On-Behalf Payments--The Commonwealth of Kentucky pays certain expenses on behalf of the District. In the financial statements, these payments are recorded as an expense and other state revenue. These expenses include the following:
2018-19 2017-18Health insurance 111,075,625$ 110,876,771$ KTRS employer match 194,936,251 192,083,132 HRA, dental, vision, and life insurance 4,800,009 5,003,501 State administration fee 1,455,173 1,460,528 Reimbursement from federal programs (5,958,434) (6,957,275) State facility construction support 10,982,285 10,808,651 Technology systems 670,374 648,952
317,961,283$ 313,924,260$
Budgetary Principles--The Superintendent must submit the proposed budget for all funds other than school-based activity funds (agency funds) to members of the Board each year. The Board Members will then discuss and, where so desired, amend the proposed budget and will adopt a final budget by September 30 of each fiscal year. Any adjustments to the adopted budget must be approved by the Board. Continued

Notes to the Financial Statements For the Year Ended June 30, 2019
31
Note A—Summary of Significant Accounting Policies--Continued Budget information is presented for the General Fund and other funds with a legally-adopted budget. This budgetary data is prepared on the modified accrual basis of accounting, in accordance with generally accepted accounting principles. Budgetary revenues represent original estimates modified for any adjustments authorized by the Board during the fiscal year. Budgetary expenditures represent original appropriations adjusted for budget transfers and additional appropriations approved during the fiscal year. Although budgets are prepared on a line-item basis by cost center for each department, expenditures may legally exceed budget in these areas but may not exceed the budget in total. Interfund Receivables and Payables--Each fund is a separate fiscal and accounting entity, and thus interfund transactions are recorded in each fund affected by a transaction. Interfund receivables and payables for the District arise generally from two types of transactions: 1) all funds are initially received into the General Fund, thus a payable and receivable are established in the appropriate funds; and 2) payments are from the General Fund checking account, which may not have the legal liability for the expenditure, thus a payable from the fund having the legal liability is established at such time. Typically, interfund receivables and liabilities are resolved monthly, and all of these balances should be resolved within a year. All interfund receivables and payables have been eliminated on the District-wide Statement of Net Position.
Special Revenue Fund $ 13,837,608 $ 11,932,894 Construction Fund 18,792,578 53,808,928 Nonmajor Governmental Funds 7,613,496 Food Service Fund 14,210,903 Nonmajor Enterprise Funds 106,132 1,064,218
$ 46,947,221 $ 74,419,536
Due from other Due to otherFunds Reportedin General Fund
Funds Reportedin General Fund
Continued
Notes to the Financial Statements For the Year Ended June 30, 2019
32
Note A—Summary of Significant Accounting Policies--Continued Transfers to Other Funds--Although each fund is its own distinct reporting entity, periodically, funds have cause to transfer their revenues to other funds. The most common reasons necessitating interfund transfers are for debt service payments and grant matching funds. Debt service payments may be paid from revenues in the Capital Outlay Fund, Building Fund, Construction Fund, Food Service Fund, or one grant within the Grants & Awards Fund, but the expenditures are recorded in the Debt Service Fund with transfers recorded to keep the funds in balance. At times, the District receives grants which require an amount of matching funds. Usually, General Fund supplies this match offset by transfers to the Grants & Awards Fund. The following is a schedule of the District’s transfers during the year:
General Fund $ 150,241 $ 5,138,831 Special Revenue Fund 2,070,995 150,241 Construction Fund 16,609,998 2,772,114 Nonmajor Governmental Funds 38,116,196 51,954,080 Food Service Fund 2,979,945 Nonmajor Enterprise Funds 92,891 5,000
$ 60,020,266 $ 60,020,266
Transfers fromother funds
Transfers toother funds
Pensions--For the purposes of measuring the net pension liability, deferred outflows of resources and deferred inflows of resources related to pensions, pension expense, information about the fiduciary net position of the Kentucky Teachers Retirement System and the County Employees Retirement System and additions to/deductions from these pensions’ fiduciary net position have been determined on the same basis as they are reported by those pensions. For this purpose, benefit payments (including refunds of employee contributions) are recognized when due and payable in accordance with the benefit terms. Investments are reported at fair value. Postemployment Benefits Other than Pensions (OPEB)--For purposes of measuring the net OPEB liability, deferred outflows of resources and deferred inflows of resources related to OPEB, and OPEB expense, information about the fiduciary net position of the Kentucky Teachers Retirement System and the County Employees Retirement System and additions to/deductions from the Plan’s fiduciary net position have been determined on the same basis as they are reported by the respective Systems. For this purpose, the Systems recognize benefit payments when due and payable, in accordance with the benefit terms. Investments are reported at fair value, except for money market investments and participating interest-earning investment contracts that have a maturity at the time of purchase of one year or less, which are reported at cost. Note B—Cash, Cash Equivalents and Investments The District's deposits are maintained in six designated financial institutions. Deposits at all these financial institutions are entirely insured by federal depository insurance or by collateral held by the financial institutions in the District’s name, as is required by the District’s investment policy though custodial credit risk is not specifically mentioned in this policy. During the year, the District invests excess cash into short-term United States Government obligations or bank certificates of deposit collateralized by U.S. Government securities. These investments are either insured or securities are held by the pledging financial institution’s trust department in the District's name. Continued

Notes to the Financial Statements For the Year Ended June 30, 2019
33
Note B—Cash, Cash Equivalents and Investments--Continued
In compliance with Kentucky Statutes, the District’s investment policy 04.6 specifies that the District’s investment objectives, in order of priority are the following: a. Legality b. Safety of principal
b. Liquidity to enable the District to meet all operating requirements c. Return on Investment The complete investment policy 04.6 is available at https://www.jefferson.kyschools.us/books/046-investments. 0H Investments consist of certificates of deposit and U.S. Government agency securities. The certificates of deposit are held by various schools’ activity funds in the Fiduciary Funds at several financial institutes located in Jefferson County, Kentucky, and have various rates of interest and maturity dates greater than ninety days. Such investments are stated at fair value as of June 30. These investments are covered by depositor insurance or by collateral held by the financial institutions in the District’s name. The U.S. Government Securities also have maturities greater than ninety days and their value has been adjusted to the fair value. As of June 30, 2019, the District had the following investments:
Moody's Weighted AverageFund Type Investment Type Fair Value Rating Maturity in Years
Governmental U.S. Treasuries 50,015,439$ Aaa 0.16Federal Agencies 63,052,191 Aaa 1.99
Agency Certificates of Deposit 681,367 0.99
113,748,997$ GASB No 40, Deposits and Investment Risk Disclosures, requires the District to address the following risks related to its investments:
Credit Risk--Credit risk is the risk that an issuer of an investment will not fulfill its obligation to the holder of the investment. In an effort to minimize the likelihood that an issuer will default, the District has limited the number of permissible investments under its investment policy to certain highly rated investments. In accordance with this policy, the District is authorized to invest in the following: a. Obligations of the United States and of its agencies, national corporations, and instrumentalities, including repurchase agreements b. Certificates of deposit issued by banks or savings and loan institutions c. Bonds or certificates of indebtedness of the Commonwealth of Kentucky and of its agencies and municipalities
d. Securities issued by a state or local government, or any instrumentality of agency thereof, in the United States, but only if fully defeased by direct obligations of or guaranteed by the United States of America
e. Interest bearing deposits in national and state banks chartered in Kentucky and insured by an agency of the United States up to the amount so insured, and in larger amounts providing such bank shall pledge as security obligations having a current quoted market value at least equal to any uninsured deposits.
Continued

Notes to the Financial Statements For the Year Ended June 30, 2019
34
Note B—Cash, Cash Equivalents and Investments--Continued Custodial Credit Risk--Custodial credit risk is the risk that, in the event of the failure of the counterparty, the District will not be able to recover the value of its investments or collateral securities that are in the possession of an outside party. All investments held by the District are insured or collateralized with securities held in the District’s name. The securities held as collateral are maintained either by the Federal Reserve or in the trust area of major national banks. Interest Rate Risk--Interest rate risk is the risk that changes in market interest rates will adversely affect the fair value of an investment. The District manages its exposure to declines in fair value by purchasing a combination of cash holdings, shorter-term, and longer-term investments. The District’s investments in federal agency securities are callable instruments and particularly carry this form of risk. The District has no formal policies relating to interest rate risk. Concentration of Credit Risk--The District’s investment policy places no limit on the amount the District may invest with any one issuer; however, all holdings must be collateralized with securities held in the District’s name. As of June 30, 2019, the District had $1,500,000 of deposits insured by the Federal Depositors Insurance Corporation and $226,365,023 of deposits that were uninsured but collateralized by securities held in the District’s name and $67,840 that were uninsured and uncollateralized. Fair Value Measurement – The District’s investments are measured and reported at fair value are classified accordingly to the following hierarchy:
Level 1 – Investments reflect prices quoted in active markets. Level 2 – Investments reflect prices that are based on a similar observable asset either directly or indirectly, which may include inputs in markets that are not
considered to be active. Level 3 – Investments reflect prices based upon unobservable sources.
The categorization of investments within the hierarchy is based upon the pricing transparency of the instrument and should not be perceived as the particular investment’s risk. Debt securities classified in Level 1 of the fair value hierarchy are valued directly from a predetermined primary external pricing vendor. Assets classified in Level 2 are subject pricing by an alternative pricing source due to lack of information available by the primary vendor.
Fair Value Measurements Using
Quoted Prices in Acitve Significant Other Significant OtherMarkets for Identical Observable Unobservable
Investments by Fair Value Level 6/30/2019 Assets - Level 1 Inputs - Level 2 Inputs - Level 3Debt Securities
Certificates of Deposit 681,367$ 681,367$ U.S Treasuries 50,015,439 50,015,439$ U.S. Agency Obligations 63,052,191 63,052,191
Total Debt Securities 113,748,997$ 113,067,630$ 681,367$

Notes to the Financial Statements For the Year Ended June 30, 2019
35
Note C—Receivables The District recognizes revenues as receivable when they are measurable and receipt is certain. Concentration of credit risk with respect to the receivables from federal and state governments is limited due to the historical stability of those institutions. While the District receives revenues from many different outside sources throughout the year, the accounts and grants receivable from outside sources may be grouped into the following categories:
Governmental Proprietary
Accounts and grants receivable Funds Funds Totalfrom outside sources
Accounts receivable 5,621,319$ 7,640,630$ 13,261,949$ Taxes receivable 23,304,533 23,304,533 Grants receivable 12,550,533 12,550,533
41,476,385$ 7,640,630$ 49,117,015$
Federal and state grants to be used or expended as specified by the grantor are recognized as revenue and recorded as receivables as qualifying expenditures are made. The following is the District’s property tax calendar: Date Event
January 1, year of levy Assessment date October 1, year of levy Taxes levied November 30, year of levy 2% discount allowed December 31, year of levy 1% discount allowed January 31, following year Gross amount due February 1, following year Delinquent date, 1½ % interest added per month April 1, following year 10% penalty added
Unpaid property taxes attach as an enforceable lien on real property as of the delinquent date. The Jefferson County Clerk’s Office collects personal property tax on vehicles when registered. The Jefferson County Sheriff’s Office bills and collects all property taxes on real estate and other personal property on behalf of the District. District property tax revenues are recognized when levied to the extent that they result in current receivables. Although the District has taxes receivable from a variety of constituents, a substantial portion of the debtors’ ability to honor this debt is dependent upon the widely diverse economic environment of the Commonwealth of Kentucky and the local area.
Notes to the Financial Statements For the Year Ended June 30, 2019
36
Note D—Capital Assets Activity in capital assets during the year ended June 30, 2019 consisted of the following:
Balance BalanceJune 30, 2018 Additions Dispositions June 30, 2019
Governmental ActivitiesLand 29,245,165$ 29,245,165$ Construction in progress 25,855,619 66,464,743$ 66,419,729$ 25,900,633
55,100,784$ 66,464,743$ 66,419,729$ 55,145,798$
Land improvements 42,258,624$ 2,154,572$ 82,371$ 44,330,825$ Buildings & building improvements 1,295,133,281 9,022,340 222,985 1,303,932,636 Technology equipment 95,956,210 10,660,868 13,430,879 93,186,199 Vehicles 106,903,884 3,419,227 5,425,985 104,897,126 General equipment 59,626,325 5,105,522 1,476,720 63,255,127
1,599,878,324 30,362,529 20,638,940 1,609,601,913
Less Accumulated DepreciationLand improvements 27,622,716 1,444,420 56,244 29,010,892 Buildings & building improvements 693,591,021 33,086,046 920,006 725,757,061 Technology equipment 73,388,510 9,255,093 13,171,144 69,472,459 Vehicles 77,962,939 6,183,906 5,387,174 78,759,671 General equipment 33,960,672 3,600,135 1,203,473 36,357,334
906,525,858 53,569,600 20,738,041 939,357,417
748,453,250$ 43,257,672$ 66,320,628$ 725,390,294$
Included in this table is current construction in progress. Items are not depreciated until placed into service. Accordingly, these items have no accumulated depreciation. Please note that minor adjustments or corrections are included in the dispositions column above and may cause small variances. Continued
Notes to the Financial Statements For the Year Ended June 30, 2019
37
Note D—Capital Assets—Continued Balance Balance
June 30, 2018 Additions Dispositions June 30, 2019Business-type Activities
Land 1,000,000$ 1,000,000$
Land improvements 4,745$ 4,745 Buildings & building improvements 17,030,604 17,030,604 Technology equipment 1,405,621 107,250$ 107,845$ 1,405,026 Vehicles 2,114,920 2,114,920 General equipment 29,113,319 1,653,081 750,879 30,015,521
50,669,209 1,760,331 858,724 51,570,816
Less Accumulated DepreciationLand improvements 1,047 237 1,284 Buildings & building improvements 6,473,698 341,441 6,815,139 Technology equipment 1,026,841 128,122 107,845 1,047,118 Vehicles 1,661,281 152,967 1,814,248 General equipment 21,778,631 1,391,647 704,014 22,466,264
30,941,498 2,014,414 811,859 32,144,053
19,727,711$ (254,083)$ 46,865$ 19,426,763$
Please note that minor adjustments or corrections are included in the dispositions column above and may cause small variances. Continued

Notes to the Financial Statements For the Year Ended June 30, 2019
38
Note D—Capital Assets—Continued Depreciation expense for business-type activities was entirely incurred in the operation of the District’s school food services program. Depreciation for governmental activities is included in the following functional categories:
Instruction $ 43,795,384Student Support Services 1,362Staff Support Services 2,458District Administrative Support Services 2,520,140Business Support Services 17,056Plant Operation and Maintenance 811,283Student Transportation 6,343,316Community Service Operations 78,601
$ 53,569,600
Net Investment in Capital Assets--On the District-wide Statement of Net Position, capital assets from Note D and Long-term Debt represent material portions of the District’s net position. This calculation is as follows:
Governmental Business-type
Capital assets, net of related depreciation 725,390,294$ 19,426,763$
Less: School building revenue bonds (452,157,133) Less: Deferred savings from refunding bonds (2,913,501) Add: Bond proceeds not yet spent on capital projects 63,963,195
334,282,855$ 19,426,763$

Notes to the Financial Statements For the Year Ended June 30, 2019
39
Note E—Long-Term Liabilities School Building Revenue Bonds
Original Outstanding2002 Series A, interest rates set at 5.5%, principal and interest
payable semiannually on January 1 and July 1, with maturities through 2022 35,095,000 11,815,000
2008 Series B QZAB, non-interest bearing and full bond liability due at maturity in December 2022 5,200,000 5,200,000
2010 Series A, interest rates ranging from 3.25% to 3.5%, principal and interest payablesemiannually on October 1 and April 1, with maturities through 2021 13,705,000 4,290,000
2010 Series B, interest rates ranging from 2.25% to 2.5%, principal and interest payablesemiannually on June 1 and December 1, with maturities through 2022 16,170,000 9,500,000
2010 Series C QSCB, interest rate 5.125%, principal and interest payable semiannuallyon May 1 and November 1, with maturities through November 2029 27,483,000 11,183,936
2011 Series A QSCB, interest rate 4.650%, principal and interest payable semiannuallyon June 1 and December 1, with maturities through June 2026 30,352,000 4,243,197
2012 Series A, interest rates ranging from 2.0% to 3.375% and interest payable semiannually on March 1 and September 1, with maturities through March 2032 13,850,000 9,740,000
2012 Series B, interest rates ranging from 2.0% to 2.6% and interest payable semiannually on July 1 and January 1, with maturities through January 2024 20,510,000 10,460,000
2012 Series C, interest rate 1.9%, principal and interest payable semiannuallyon March 1 and September 1, with maturities through September 2024 18,730,000 11,155,000
2012 Series D, interest rates ranging from 2% to 3.125% principal and interest payablesemiannually on October 1 and April 1, with maturities through October 2032 27,235,000 26,235,000
Continued

Notes to the Financial Statements For the Year Ended June 30, 2019
40
Note E—Long-Term Liabilities--Continued Original Outstanding
2013 Series A, interest rates ranging from 2% to 2.375% principal and interest payablesemiannually on June 1 and December 1, with maturities through June 2025 22,860,000 20,750,000
2013 Series B, interest rates ranging from 2% to 4% principal and interest payablesemiannually on July 1 and January 1, with maturities through July 2026 35,550,000 28,855,000
2013 Series C, interest rates ranging from 3% to 5% principal and interest payablesemiannually on November 1 and May 1, with maturities through November 2033 33,005,000 29,565,000
2014 Series A, interest rates ranging from 3% to 5% principal and interest payablesemiannually on November 1 and May 1, with maturities through May 2034 42,890,000 41,170,000
2014 Series B, interest rates ranging from 2% to 5% principal and interest payablesemiannually on October 1 and April 1, with maturities through October 2020 21,630,000 6,510,000
2015 Series A, interest rates ranging from 3% to 5% principal and interest payablesemiannually on October 1 and April 1, with maturities through April 2035 16,465,000 14,275,000
2015 Series B, interest rates set at 4% with principal and interest payablesemiannually on December 1 and June 1, with maturities through December 2026 36,285,000 32,860,000
2015 Series C, interest rates ranging from 3% to 5% principal and interest payablesemiannually on December 1 and June 1, with maturities through December 2035 15,160,000 14,505,000
2016 Series A, interest rates ranging from 2% to 4% principal and interest payablesemiannually on July 1 and January 1, with maturities through July 2036 39,855,000 38,080,000
2016 Series B, interest rates set at 2% with principal and interest payablesemiannually on April 1 and October 1, with maturities through October 2028 7,120,000 6,015,000
2017 Series A, interest rates set at 5% with principal and interest payablesemiannually on August 1 and February 1, with maturities through August 2029 31,270,000 31,265,000
Continued
Notes to the Financial Statements For the Year Ended June 30, 2019
41
Note E—Long-Term Liabilities—Continued Original Outstanding
2018 Series A, interest rates ranging from 3% to 5% with principal and interest payablesemiannually on April 1 and October 1, with maturities through October 2038 29,625,000 29,625,000
2019 Series A, interest rates ranging from 3% to 5% with principal and interest payablesemiannually on December 1 and June 1, with maturities through June 2037 54,860,000 54,860,000
594,905,000 452,157,133
Bonds outstanding as of June 30, 2019, are reported in the accompanying District-wide Statement of Net Position as follows:
Current Long-Term Total
Governmental activities 30,205,000$ 421,952,133$ 452,157,133$
The School Building Revenue Bonds listed below are subject to redemption prior to their stated maturity dates at the option of the Board. The redemption prices include a premium of 1% to 3% of the outstanding principal amounts. The earliest allowable redemption dates for each Series are as follows:
2002 Series A January 2022 2012 Series B June 2024 2014 Series A May 2024 2016 Series B October 20282010 Series A April 2021 2012 Series C September 2024 2014 Series B October 2020 2017 Series A February 20272010 Series B June 2022 2012 Series D October 2022 2015 Series A April 2025 2018 Series A October 20262010 Series C November 2020 2013 Series A June 2023 2015 Series B December 2026 2019 Series A June 20262011 Series A June 2021 2013 Series B July 2023 2015 Series C December 20252012 Series A June 2022 2013 Series C November 2023 2016 Series A July 2026
Bondholders are protected against default by a mechanism whereby the Commonwealth of Kentucky would withhold state SEEK payments and remit required debt service payments directly to the debt service paying agent. In connection with most of the above listed bond issues, the District has entered into participation agreements with the Kentucky School Facilities Construction Commission (the “Commission”) which provides that the Commission will remit a stated amount of bond principal and interest payments annually, subject to biennial approval by the Kentucky General Assembly. Should approval not be received in future periods, the District remains obligated for the full amount of the bond principal and interest payments. Continued

Notes to the Financial Statements For the Year Ended June 30, 2019
42
Note E—Long-Term Liabilities--Continued Assuming no issues are called prior to scheduled maturity and continued Commission participation, the minimum obligations of the District at June 30, 2019 for debt service is as follows:
Less:Year Ending Total Commission Net
June 30 Principal Interest Repayments Participation Repayments
2020 30,205,000 15,302,095 45,507,095 10,257,913 35,249,182 2021 30,695,000 14,433,515 45,128,515 9,878,203 35,250,312 2022 32,535,000 13,432,785 45,967,785 8,862,645 37,105,140 2023 33,940,000 12,292,475 46,232,475 8,863,756 37,368,719 2024 30,120,000 11,285,789 41,405,789 8,864,670 32,541,119
2025-2029 143,118,197 39,768,309 182,886,506 32,333,828 150,552,678 2030-2034 121,678,936 16,593,088 138,272,024 24,284,582 113,987,442 2035-2039 29,865,000 1,983,130 31,848,130 9,681,143 22,166,987
TOTAL 452,157,133$ 125,091,186$ 577,248,319$ 113,026,740$ 464,221,579$
All bonds issued by the District were revenue bonds or refunding bonds of revenue bonds, and the proceeds were used to construct or renovate schools and other facilities. The bonds payable are collateralized by the educational facilities constructed by the District with bond proceeds. Bonds are repaid principally from state revenues in the Capital Outlay Fund and local revenues in the Building Fund. General Fund revenues are available to pay for debt service but have not been needed for this purpose. Although defeased, the funded debt will not be actually retired until the call dates have come due or until maturity if they are not callable issues. As of June 30, 2019, the outstanding principal amount of indebtedness that is considered to be extinguished under “in substance defeasance” and therefore excluded from the District-wide financial statements was $42,437,225. Qualified School Construction Bonds--The District has issued two taxable Qualified School Construction Bonds with direct payment to issuer. As part of this program, the District pays interest to the purchaser at taxable interest rates and receives a refund from the US Department of Treasury for our interest payments. The accompanying official bond statements specify that the District will make payments, which will be held in trust for the sole purpose of redeeming the bonds held by the bondholders at maturity. Accordingly, as principal payments are made, both the cash held in trust and the payments made into the trust will be excluded from the District’s assets and liabilities, respectively. Qualified Zone Academy Bonds--On December 23, 2008, the District issued $5,200,000 in Special Obligations School Financing Bond Series 2008B as a QZAB to finance capital projects at Cane Run and Shacklette Elementary Schools. On December 23, 2009, the District began making annual payments of $371,429 to an escrow account at a local bank. Such payments are being held in trust and invested at an interest rate of 6.0% in accordance with the funding agreement. The final annual payment is due December 23, 2022, at which time the QZAB will mature and the principal will be paid in full from the escrow account. Continued

Notes to the Financial Statements For the Year Ended June 30, 2019
43
Note E—Long-Term Liabilities—Continued Estimated Liability for Workers' Compensation Benefits--The estimated liability for workers' compensation benefits consists of claim settlements for reported and outstanding claims and estimated claim settlements for incurred but not reported claims (based upon historical experience and an actuarial study). Estimated claim settlements for incurred but not reported claims are discounted at 6% over the anticipated payment periods to reflect the time value of money. This liability, along with certain related assets and liabilities, is accounted for within the Workers' Compensation Trust Fund, which is a self-insurance fund administered by the District for the purpose of providing workers' compensation insurance to employees of the District. The District maintained reinsurance covering that portion of risks in excess of $1,000,000 for any one occurrence with a $500,000 deductible for the year ended June 30, 2019. The limit is subject to audit by the District's insurer. The District remains liable to the extent that claims are less than the amount of reinsurance coverage or if the reinsuring company is unable to pay its portion of claims. Workers’ Compensation liability is charged against the same fund from which each employee’s salary is paid. The majority of these payments are charged to General Fund, Special Revenue Fund, and School Food Services Fund. Accrued Vacation Pay and Sick Leave--In accordance with generally accepted governmental accounting principles, the District has recorded accrued vacation pay and accrued sick leave as long-term liabilities in the District-wide Statement of Net Position. Accrued vacation pay, which may be accumulated for a period of up to two years, is payable upon termination of employment. Accrued sick leave, which has no maximum accumulation, is payable upon retirement at 30% of the value of accumulated sick leave. Both accrued sick leave and accrued vacation pay liabilities are charged against the same fund from which each employee’s salary is paid. The majority of these payments are charged to General Fund, Special Revenue Fund, and School Food Services Fund. Activity in long-term liabilities during the year ended June 30, 2019 consisted of the following:
Amounts
Balance Balance Due WithinJune 30, 2018 Additions Deductions June 30, 2019 One Year
Governmental Activities:
School building revenue bonds 402,794,001$ 84,485,000$ 35,121,868$ 452,157,133$ 30,205,000$ Estimated liability for
workers' compensation benefits 26,128,563 7,867,637 6,749,183 27,247,017 1,719,670 Accrued vacation pay 7,506,479 5,338,833 5,396,868 7,448,444 1,251,541 Accrued sick leave 38,254,770 8,588,829 9,178,778 37,664,821 595,021
474,683,813$ 106,280,299$ 56,446,697$ 524,517,415$ 33,771,232$
Business-type Activities:School building revenue bonds 1,113,962$ 1,113,962$
Continued

Notes to the Financial Statements For the Year Ended June 30, 2019
44
Note E—Long-Term Liabilities—Continued On the Statement of Net Position, long-term liabilities are split between the current maturities, which are expected to be paid within one year, and the long-term maturities, which are expected to be paid beyond one year later. Note F—Retirement Plans The District’s employees are provided with two pension plans, based on each position’s college degree requirement. The County Employees Retirement System covers employees whose position does not require a college degree or teaching certification. The Kentucky Teachers Retirement System covers positions requiring teaching certification or otherwise requiring a college degree. Both plans use the entry age normal actuarial funding method and the accrual basis of accounting. Each plan’s fiduciary net position has been determined on the same basis as used by the plan. General information about the County Employees Retirement System Non-Hazardous (“CERS”) Plan description—Employees whose positions do not require a degree beyond a high school diploma are covered by the CERS, a cost-sharing multiple-employer defined benefit pension plan administered by the Kentucky Retirement System, an agency of the State of Kentucky. Under the provisions of the Kentucky Revised Statute (“KRS”) Section 61.645, the Board of Trustees of the Kentucky Retirement System administers CERS and has the authority to establish and amend benefit provisions. The Kentucky Retirement System issues a publicly available financial report that includes financial statements and required supplementary information for CERS. That report may be obtained from http://kyret.ky.gov/. Benefits provided—CERS provides retirement and other postemployment benefits, which are described further in Note H. Employees are vested in the plan after five years’ service. For retirement purposes, employees are grouped into three tiers, based on hire date:
Tier 1 Participation date Before September 1, 2008Unreduced retirement 27 years service or 65 years oldReduced retirement At least 5 years service and 55 years old
At least 25 years service and any age
Tier 2 Participation date September 1, 2008 - December 31, 2013Unreduced retirement At least 5 years service and 65 years old
Or age 57+ and sum of service years plus age equal 87Reduced retirement At least 10 years service and 60 years old
Tier 3 Participation date After December 31, 2013Unreduced retirement At least 5 years service and 65 years old
Or age 57+ and sum of service years plus age equal 87Reduced retirement Not available
Continued

Notes to the Financial Statements For the Year Ended June 30, 2019
45
Note F—Retirement Plans--Continued Cost of living adjustments are provided at the discretion of the General Assembly. Retirement is based on a factor of the number of years’ service and hire date multiplied by the average of the highest five years’ earnings. Reduced benefits are based on factors of both of these components. Contributions—Required contributions by the employee are based on the tier:
Required contributionTier 1 5%Tier 2 5% + 1% for insuranceTier 3 5% + 1% for insurance
General information about the Teachers’ Retirement System of the State of Kentucky (“KTRS”) Plan description—Teaching certified employees of the District and other employees whose positions require at least a college degree are provided pensions through the Teachers’ Retirement System of the State of Kentucky (KTRS)—a cost-sharing multiple-employer defined benefit pension plan with a special funding situation established to provide retirement annuity plan coverage for local school districts and other public educational agencies in the State. KTRS was created by the 1938 General Assembly and is governed by Chapter 161 Section 220 through Chapter 161 Section 990 of the KRS. KTRS is a blended component unit of the State of Kentucky and therefore is included in the State’s financial statements. KTRS issues a publicly available financial report that can be obtained at https://trs.ky.gov/employers/information/gasb-65-67/. Benefits provided—For employees who have established an account in a retirement system administered by the State prior to July 1, 2008, employees become vested when they complete five (5) years of credited service. To qualify for monthly retirement benefits, payable for life, employees must either:
1.) Attain age fifty-five (55) and complete five (5) years of Kentucky service, or 2.) Complete 27 years of Kentucky service.
Employees who` retire before age 60 with less than 27 years of service receive reduced retirement benefits. Non-university employees with an account established prior to July 1, 2002 receive monthly payments equal to two (2) percent (service prior to July 1, 1983) and two and one-half (2.5) percent (service after July 1, 1983) of their final average salaries for each year of credited service. New employees (including second retirement accounts) after July 1, 2002 will receive monthly benefits equal to 2% of their final average salary for each year of service if, upon retirement, their total service less than ten years. New employees after July 1, 2002 who retire with ten or more years of total service will receive monthly benefits equal to 2.5% of their final average salary for each year of service, including the first ten years. In addition, employees who retire July 1, 2004 and later with more than 30 years of service will have their multiplier increased for all years over 30 from 2.5% to 3.0% to be used in their benefit calculation. Employees hired on or after July 1, 2008, will receive monthly benefits equal to the average of their top three salary years multiplied by a sliding scale rate from 1.7% up to 2.5% based on years of service up to 30 years. Beyond 30 years of service, the rate increases to 3.0%. Continued

Notes to the Financial Statements For the Year Ended June 30, 2019
46
Note F—Retirement Plans--Continued Final average salary is defined as the member’s five (5) highest annual salaries for those with less than 27 years of service. Employees at least age 55 with 27 or more years of service may use their three (3) highest annual salaries to compute the final average salary. KTRS also provides disability benefits for vested employees at the rate of sixty (60) percent of the final average salary. A life insurance benefit, payable upon the death of a member, is $2,000 for active contributing employees and $5,000 for retired or disabled employees. Cost of living increases are one and one-half (1.5) percent annually. Additional ad hoc increases and any other benefit amendments must be authorized by the General Assembly. Contributions—Contribution rates are established by KRS. Employees are required to contribute 12.855% of their salaries to the System. The State of Kentucky, as a non-employer contributing entity, pays matching contributions at the rate of 13.105% of salaries for local school district and regional cooperative employees hired before July 1, 2008 and 14.105% for those hired after July 1, 2008. For local school district and regional cooperative employees whose salaries are federally funded, the employer contributes 15.355% of salaries. If an employee leaves covered employment before accumulating five (5) years of credited service, accumulated employee pension contributions plus interest are refunded to the employee upon the member’s request. Pension Liabilities, Pension Expense, and Deferred Outflows of Resources and Deferred Inflows of Resources Related to Pensions At June 30, 2019, the District reported a liability for its proportionate share of the net pension liability for CERS. The District did not report a liability for the District’s proportionate share of the net pension liability for KTRS because the State of Kentucky provides the pension support directly to KTRS on behalf of the District. The amount recognized by the District as its proportionate share of the net pension liability, the related State support, and the total portion of the net pension liability that was associated with the District were as follows:
District's proportionate share of the CERS net pension liability 471,620,358$
Commonwealth’s proportionate share of the KTRS net pension liability associated with the District 2,481,543,345
2,953,163,703$
The net pension liability for each plan was measured as of June 30, 2018, and the total pension liability used to calculate the net pension liability was determined by an actuarial valuation as of that date. Continued

Notes to the Financial Statements For the Year Ended June 30, 2019
47
Note F—Retirement Plans--Continued The District’s proportion of the net pension liability for CERS was based on the actual liability of the employees and former employees relative to the total liability of the System as determined by the actuary. At June 30, 2018, the District’s proportion was 7.743789% percent. For the year ended June 30, 2019, the District recognized pension expense of $71,577,444 related to CERS and $299,805,957 related to KTRS, of which $179,806,772 was recognized on the fund financial statements as it represented amounts paid on the District’s behalf during the year. The District also recognized revenue of $299,805,957 for KTRS support provided by the State. As of the June 30, 2018 measurement date, the District reported deferred outflows of resources and deferred inflows of resources related to pensions from the following sources:
Deferred Outflows of Resources
Deferred Inflows of Resources
Differences between expected and actualexperience 15,382,933$ 6,903,522$
Changes of assumptions 46,091,026 Net difference between projected and actual
earnings on pension plan investments 5,654,990 Changes in proportion and differences
between District contributions and proportionateshare of contrbutions 2,443,686
District contributions subsequent to themeasurement date 31,349,330
Total 92,823,289$ 15,002,198$
$31,349,330 reported as deferred outflows of resources related to pensions resulting from District contributions subsequent to the measurement date will be recognized as a reduction of the net pension liability in the year ended June 30, 2020. Other amounts reported as deferred outflows of resources and deferred inflows related to pensions will be recognized in pension expense as follows:
2020 36,060,123$ 2021 18,440,572 2022 (5,497,666) 2023 (2,531,268) 2024 -
Thereafter -
Year ended June 30:
Continued

Notes to the Financial Statements For the Year Ended June 30, 2019
48
Note F—Retirement Plans--Continued Actuarial assumptions—Total pension liability in the June 30, 2017 actuarial valuation was determined using the following actuarial assumptions, applied to all periods included in the measurement:
CERS KTRSInflation 3.25% 3.00%Projected salary increases 4.00% 3.5-7.3%Investment rate of return, net of
investment expense & inflation 7.50% 7.50%
For CERS, the mortality table used for active members is RP-2000 Combined Mortality Table projected with Scale BB to 2013 (multiplied by 50% for males and 30% for females). There is some margin in the current mortality tables for possible future improvement in mortality rates and that margin will be reviewed again when the next experience investigation is conducted. For KTRS, Mortality rates were based on the RP-2000 Combined Mortality Table for Males or Females, as appropriate, with adjustments for mortality improvements based on a projection of Scale BB to 2025, set forward two years for males and one year for females. For CERS, the long-term expected return on plan assets is reviewed as part of the regular experience studies prepared every five years. The most recent analysis, performed for the period covering fiscal years 2005 through 2013, is outlined in a report dated August 30, 2014. Several factors are considered in evaluating the long-term rate of return assumption including long-term historical data, estimates inherent in current market data, and a log-normal distribution analysis in which best-estimate ranges of expected future real rates of return (expected return, net of investment expense and inflation) were developed by the investment consultant for each major asset class. These ranges were combined to produce the long-term expected rate of return by weighting the expected future real rates of return by the target asset allocation percentage and then adding expected inflation. The capital market assumptions developed by the investment consultant are intended for use over a 10-year horizon and may not be useful in setting the long-term rate of return for funding pension plans which covers a longer timeframe. The assumption is intended to be a long-term assumption and is not expected to change absent a significant change in the asset allocation, a change in the inflation assumption, or a fundamental change in the market that alters expected returns in future years. For KTRS, the long-term expected rate of return on pension plan investments was determined using a log-normal distribution analysis in which best-estimate ranges of expected future real rates of return (expected returns, net of pension plan investment expense and inflation) are developed for each major asset class. These ranges are combined to produce the long-term expected rate of return by weighting the expected future real rates of return by the target asset allocation percentage and by adding expected inflation. The target allocation and best estimates of arithmetic real rates of return for each major asset class, as provided by KTRS’s investment consultant, are summarized in the following table: Continued

Notes to the Financial Statements For the Year Ended June 30, 2019
49
Note F—Retirement Plans--Continued
Asset ClassTarget
AllocationLong-Term Expected Real
Rate of Return
U.S. Equity 40% 4.2%International Equity 22% 5.2%Fixed Income 15% 1.2%Additional Categories 8% 3.3%Real Estate 6% 3.8%Private Equity 7% 6.3%Cash 2% 0.9%
Total 100%
Discount rate—For CERS, the discount rate used to measure the total pension liability was 6.25%. The projection of cash flows used to determine the discount rate assumed that contributions from plan employees and employers will be made at statutory contribution rates. Projected inflows from investment earnings were calculated using the long-term assumed investment return of 7.50%. The long-term investment rate of return was applied to all periods of projected benefit payments to determine the total pension liability. For KTRS, the discount rate used to measure the total pension liability was 7.50%. The projection of cash flows used to determine the discount rate assumed that plan member contributions will be made at the current contribution rates and the employer contributions will be made by the state at statutorily required rates. Based on those assumptions, the pension plan’s fiduciary net position was projected to be available to make all projected future benefit payments of current plan employees until the 2036 plan year. Therefore, the long-term expected rate of return on pension plan investments was applied to all periods of projected benefit payments through 2035 and a municipal bond index rate of 3.89% was applied to all periods of projected benefit payments after 2035. The Single Equivalent Interest Rate (SEIR) that discounts the entire projected benefit stream to the same amount as the sum of the present values of the two separate benefit payments streams was used to determine the total pension liability. Sensitivity of CERS and KTRS proportionate share of net pension liability to changes in the discount rate—The following table presents the net pension liability of the District, calculated using the discount rates selected by each pension system, as well as what the District’s net pension liability would be if it were calculated using a discount rate that is 1 percentage point lower or 1 percentage point higher than the current rate: Continued

Notes to the Financial Statements For the Year Ended June 30, 2019
50
Note F—Retirement Plans—Continued
1% Decrease Current Discount Rate 1% Increase
CERS 5.25% 6.25% 7.25%District's proportionate share
of net pension liability 593,721,180$ 471,620,358$ 369,321,212$
KTRS 6.50% 7.50% 8.50%District's proportionate share
of net pension liability - - -
Pension plan fiduciary net position—Detailed information about the pension plan’s fiduciary net position is available in the separately issued financial reports of both CERS and KTRS.
Retirement Plan--The District makes available various 401(k) and 403(b) defined contribution pension plans for all employees. These Plans are administered by independent third party administrators. Employees are allowed to contribute any amount to the Plans up to the Internal Revenue Code maximum allowable amount. The District does not contribute to the Plans, but the District retains authority to amend or terminate these plans. During the fiscal year ended June 30, 2019, employees of the District contributed $1,825,992 to 401(k) plans and $8,039,469 to 403(b) plans. Note G—Deferred Compensation The District offers its employees a deferred compensation plan created in accordance with Internal Revenue Code Section 457. The Plan, available to all employees, permits them to defer a portion of their salary until future years. This deferred compensation is not available to employees until termination, retirement, death or unforeseeable emergency. GASB Statement No. 32, Accounting and Financial Reporting for Internal Revenue Code Section 457 Deferred Compensation Plans, allows entities with little or no administrative involvement and who do not perform the investing function for these plans to omit plan assets and related liabilities from their financial statements. The District therefore does not show these assets and liabilities on its financial statements. The District does not contribute to these plans, and employees of the District contributed $2,131,541 to these plans during the fiscal year ended June 30, 2019.
Notes to the Financial Statements For the Year Ended June 30, 2019
51
Note H—Postemployment Benefits Retired District employees may receive postemployment benefits other than pensions (OPEB) through the same fiduciary pension system to which they contributed during their employment. In accordance with Kentucky Revised Statutes, these benefits are provided and advanced-funded on an actuarially determined basis through the CERS and the KTRS plans. Required schedules of funding progress immediately follow these notes to the financial statements and present multi-year trend information about funding levels. The KTRS maintains two separate OPEB plans for its retirees. These pensions, their administrative structure, and how to access their financial and actuarial reports are discussed further in Note F. CERS CERS provides health insurance, disability insurance and death benefits to Plan employees and beneficiaries. As discussed in Note F, pension benefits are grouped into three tiers based on participation date with benefits adjusted based on tier. OPEB are not adjusted by tier other than the determination of retirement eligibility. Benefits provided—Participating employees become eligible to receive the health insurance benefit after at least 180 months of service. If a participating employee suffers a work-related death, CERS will provide a lump sum payment of $10,000 plus a lifetime monthly payment of 75% of the member’s monthly average until the spouse’s death or remarriage. If a participating employee dies prior to retirement and the death is not work-related, the beneficiary may choose from a selection of actuarial calculated lump sum or annuity payments. Five years’ service is required for non-service-related disability benefits, and the disabled employee must be determined as disabled by KRS Medical Review Physicians panel. Contributions—CERS employer contributions are split between the pension fund (approximately 75%) and the OPEB (approximately 25%). Employee contributions are 5% of their salary. Employees of tiers 2 and 3 contribute an additional 1% of their salary before retirement to fund OPEB. OPEB Liabilities, OPEB Expense, and Deferred Outflows of Resources and Deferred Inflows of Resources Related to OPEBs At June 30, 2019, the District reported a liability of $137,485,575 for its proportionate share of the collective net OPEB liability that reflected a reduction for state OPEB support provided to the District. The collective net OPEB liability was measured as of June 30, 2018, and the total OPEB liability used to calculate the collective net OPEB liability was based on a projection of the District’s long-term share of contributions to the OPEB plan relative to the projected contributions of all participating employers, actuarially determined. At June 30, 2018, the District’s proportion was 7.744%. The District recognized $137,485,575 as its proportionate share of net OPEB liability associated with its employees participating in CERS as of June 30, 2019. Continued

Notes to the Financial Statements For the Year Ended June 30, 2019
52
Note H—Postemployment Benefits—Continued For the year ended June 30, 2019, the District recognized OPEB expense of $17,539,945. At June 30, 2019, the District reported deferred outflows of resources and deferred inflows of resources related to OPEBs from the following sources:
Deferred Outflows Deferred Inflowsof Resources of Resources
Change of assumptions 27,457,893$ 317,657$ Contributions after measurement date 10,166,306 Difference between expected and actual experience 16,022,127 Difference between projected and actual earnings
on OPEB plan investments 9,470,045 Change in proportionate share 894,487
Of the total amount reported as deferred outflows of resources related to OPEB, deferred outflows resulting from District contributions subsequent to the measurement date and before the end of the fiscal year will be included as a reduction of the collective net OPEB liability in the year ended June 30, 2020. Other amounts reported as deferred outflows of resources and deferred inflows of resources related to OPEB will be recognized over a closed period of either five years for investments-related deferrals or the estimated remaining service life for active participants in CERS for other deferred items. As of June 30, 2018 plan year, the estimated remaining service life was 6.30 years. These items will be recognized in the District’s OPEB expense as follows:
Year ended June 30
2020 307,392$ 2021 307,392 2022 307,392 2023 2,146,639 2024 (1,376,122)
Thereafter (939,101)$ Continued

Notes to the Financial Statements For the Year Ended June 30, 2019
53
Note H—Postemployment Benefits—Continued Actuarial assumptions – The total OPEB liability in the June 30, 2017 actuarial valuation was determined using the following actuarial assumptions, applied to all periods included in the measurement:
Investment rate of returnProjected salary increasesInflation rateActuarial cost method
Mortality Healthcare cost trend rates:
Under 65
Ages 65 and olderMunicipal bond index rateMunicipal bond index
4.00%7.50%
3.62%Fidelity 20-Year Municipal GO AA Index
Initial trend starting at 7.50% and gradually decreasing to an ultimate trend rate of 5.00%
over a period of 5 yearsInitial trend starting at 5.50% and gradually
decreasing to an ultimate trend rate of 5.00% over a period of two years
RP-2000 Combined Mortality Table, projected to 2013 with Scale BB (set back 1
year for females)
Entry age normal3.25%
The long-term expected rate of return on OPEB plan investments was determined using an asset valuation method where 20% of the difference between the market value of assets and the expected actuarial value of assets is recognized. Discount rate - The discount rate used to measure the total OPEB liability was 5.85%. The projection of cash flows used to determine the discount rate assumed that plan member contributions will be made at the current contribution rates and the employer contributions will be made at statutorily required rates. Based on those assumptions, the OPEB plan’s fiduciary net position was projected to be available to make all projected future benefit payments of current plan members. Therefore, the long-term expected rate of return on OPEB plan investments was applied to all periods of projected benefit payments to determine the total OPEB liability. Continued

Notes to the Financial Statements For the Year Ended June 30, 2019
54
Note H—Postemployment Benefits—Continued The following table presents the District’s proportionate share of the collective net OPEB liability of the System, calculated using the discount rate of 5.85%, as well as what the District’s proportionate share of the collective net OPEB liability would be if it were calculated using a discount rate that is 1-percentage-point lower (4.85%) or 1-percentage-point higher (6.85%) than the current rate:
1% Decrease Current Discount 1% Increase
CERS discount rate 4.85% 5.85% 6.85%Net OPEB Liability 178,571,730$ 137,485,575$ 102,487,691$
Sensitivity of the District’s proportionate share of the collective net OPEB liability to changes in the healthcare cost trend rates – The following presents the District’s proportionate share of the collective net OPEB liability, as well as what the District’s proportionate share of the collective net OPEB liability would be if it were calculated using healthcare cost trend rates that were 1-percentage-point lower or 1-percentage-point higher than the current healthcare cost trend rates:
1% Decrease 1% Increase
Net OPEB Liability 178,571,730$ 137,485,575$ 102,487,691$
Current Health Care Trend Rate
OPEB plan fiduciary net position – Detailed information about the OPEB plan’s fiduciary net position is available in the separately issued KTRS financial report. KTRS Medical Insurance Plan Benefits provided—To be eligible for medical benefits, the member must have either retired from service or due to disability. The KTRS Medical Insurance Fund offers coverage to members under the age of 65 through the Kentucky Employees Health Plan administered by the Kentucky Department of Employee Insurance. KTRS retired members are given a supplement to be used for payment of their health insurance premium. The amount of the member’s supplement is based on a contribution supplement table approved by the KTRS Board of Trustees. The retired member pays premiums in excess of the monthly supplement. Once retired members and eligible spouses attain age 65 and are Medicare eligible, coverage is obtained through the KTRS Medicare Eligible Health Plan. Contributions—In order to fund the post-retirement healthcare benefit, six and three quarters percent (6.75%) of the gross annual payroll of employees before July 1, 2008 is contributed. Three percent (3%) is paid by member contributions, three quarters percent (.75%) from State appropriation and three percent (3%) from the employer. Also, the premiums collected from retirees as described in the plan description and investment interest help meet the medical expenses of the plan. Continued

Notes to the Financial Statements For the Year Ended June 30, 2019
55
Note H—Postemployment Benefits—Continued OPEB Liabilities, OPEB Expense, and Deferred Outflows of Resources and Deferred Inflows of Resources Related to OPEBs At June 30, 2019, the District reported a liability of $338,031,000 for its proportionate share of the collective net OPEB liability that reflected a reduction for state OPEB support provided to the District. The collective net OPEB liability was measured as of June 30, 2018, and the total OPEB liability used to calculate the collective net OPEB liability was based on a projection of the District’s long-term share of contributions to the OPEB plan relative to the projected contributions of all participating employers, actuarially determined. At June 30, 2018, the District’s proportion was 9.742%. The amount recognized by the District as its proportionate share of the OPEB liability, the related State support, and the total portion of the net OPEB liability that was associated with the District were as follows:
District's proportionate share of the net OPEB liability 338,031,000$ State's proportionate share of the District's net OPEB liability 291,312,000
Total 629,343,000$
For the year ended June 30, 2019, the District recognized OPEB expense of $17,356,000 and revenue of $20,316,000 for support provided by the State. At June 30, 2019, the District reported deferred inflows of resources related to OPEBs from the following sources:
Deferred Outflows Deferred Inflowsof Resources of Resources
Change of assumptions 4,647,000$ Difference between expected and actual experience 17,314,000$ Difference between projected and actual earnings
on OPEB plan investments 1,376,000 Change in proportionate share 1,095,000
Continued
Notes to the Financial Statements For the Year Ended June 30, 2019
56
Note H—Postemployment Benefits—Continued The collective amounts reported as deferred outflows of resources and deferred inflows of resources related to OPEBs will be recognized in OPEB expense as follows:
Year ended June 302020 3,033,000$ 2021 3,033,000 2022 3,033,000 2023 2,417,000 2024 2,535,000
Thereafter 1,087,000$ Actuarial assumptions – The total OPEB liability in the June 30, 2017 actuarial valuation was determined using the following actuarial assumptions, applied to all periods included in the measurement:
Projected salary increasesInflation rateReal Wage GrowthWage InflationHealthcare cost trend rates:
Municipal Bond Index RateDiscount RateSingle Equivalent Interest Rate 8.00%, net of OPEB plan investment expense,
including inflation
Medicare Part B Premiums 0.00% for FY2018 with an ultimate rate of 5.00% by FY2030
3.89%8.00%
Under 65 7.75% for FY2018 decreasing to an ultimate rate of 5.00% by FY2024
Ages 65 and Older 5.75% for FY2018 decreasing to an ultimate rate of 5.00% by FY2021
Investment rate of return 8.00%, net of OPEB Plan Investment Expense, including Inflation
3.00%3.50% - 7.20%
0.50%3.50%
Mortality rates were based on the RP-2000 Combined Mortality Table projected to 2025 with projection scale BB and set forward two years for males and one year for females is used for the period after service retirement and for dependent beneficiaries. The RP-2000 Disabled Mortality Table set forward two years for males and seven years for females is used for the period after disability retirement. Continued

Notes to the Financial Statements For the Year Ended June 30, 2019
57
Note H—Postemployment Benefits—Continued The remaining actuarial assumptions (e.g. initial per capita costs, health care cost trends, rate of plan participation, rates of plan election, etc.) used in the June 30, 2017 valuation were based on a review of recent plan experience done concurrently with the June 30, 2017 valuation. The long-term expected rate of return on OPEB plan investments was determined using a log-normal distribution analysis in which best-estimate ranges of expected future real rates of return (expected returns, net of OPEB plan investment expense and inflation) are developed for each major asset class. These ranges are combined to produce the long-term expected rate of return by weighting the expected future real rates of return by the target asset allocation percentage and by adding expected inflation. The target allocation and best estimates of arithmetic real rates of return for each major asset class, as provided by KTRS’s investment consultant, are summarized in the following table:
Asset ClassDomestic and International Equities 58.0%
Fixed Income 9.0%Real Estate 5.5%
Private Equity 6.5%Other Additional Categories 20.0%
Cash 1.0%Total 100.0%
% of Assets in Category
Discount rate - The discount rate used to measure the total OPEB liability was 8.00%. The projection of cash flows used to determine the discount rate assumed that plan member contributions will be made at the current contribution rates and the employer contributions will be made at statutorily required rates. Based on those assumptions, the OPEB plan’s fiduciary net position was projected to be available to make all projected future benefit payments of current plan members. Therefore, the long-term expected rate of return on OPEB plan investments was applied to all periods of projected benefit payments to determine the total OPEB liability. Continued
Notes to the Financial Statements For the Year Ended June 30, 2019
58
Note H—Postemployment Benefits—Continued The following table presents the District’s proportionate share of the collective net OPEB liability of the System, calculated using the discount rate of 8.00%, as well as what the District’s proportionate share of the collective net OPEB liability would be if it were calculated using a discount rate that is 1-percentage-point lower (7.00%) or 1-percentage-point higher (9.00%) than the current rate:
386,321,143$ 338,031,000$ 300,472,000$
Current Discount Rate (8.00% )
1% Increase (9.00% )
1% Decrease (7.00% )
Sensitivity of the District’s proportionate share of the collective net OPEB liability to changes in the healthcare cost trend rates – The following presents the District’s proportionate share of the collective net OPEB liability, as well as what the District’s proportionate share of the collective net OPEB liability would be if it were calculated using healthcare cost trend rates that were 1-percentage-point lower or 1-percentage-point higher than the current healthcare cost trend rates:
1% Decrease Current Trend Rate 1% Increase280,303,783$ 338,031,000$ 409,267,791$
OPEB plan fiduciary net position – Detailed information about the OPEB plan’s fiduciary net position is available in the separately issued KTRS financial report. KTRS Life Insurance Plan As provided by Kentucky Revised Statute 161.655, KTRS administers the Life Insurance Plan for eligible active and retired members. The KTRS Life Insurance Plan is a cost-sharing multiple employer defined benefit plan with a special funding situation. Changes to the Plan may be made by the KTRS Board of Trustees and the General Assembly. Benefit provided—The KTRS Life Insurance Plan provides a life insurance benefit of $5,000 payable for members who retire based on service or disability. Active members may receive a $2,000 lump sum payable. The benefit is payable to the member’s estate or to a party designated by the member. Contributions—In order to fund the post-retirement life insurance benefit, three hundredths of one percent (.03%) of the gross payroll of members is contributed by the state. Continued

Notes to the Financial Statements For the Year Ended June 30, 2019
59
Note H—Postemployment Benefits—Continued OPEB Liabilities, OPEB Expense, and Deferred Outflows of Resources and Deferred Inflows of Resources Related to OPEBs At June 30, 2019, the District did not report a liability for its proportionate share of the collective net OPEB liability for life insurance benefits because the State of Kentucky provides the OPEB support directly to KTRS on behalf of the District. The amount recognized by the District as its proportionate share of the OPEB liability, the related State support, and the total portion of the net OPEB liability that was associated with the District were as follows:
5,001,000$ District's proportionate share of the net OPEB liability -
Total 5,001,000$
State's proportionate share of the District's net OPEB liability
For the year ended June 30, 2019, the District recognized revenue of $843,000 for support provided by the State. At June 30, 2019, the District did not have any deferred outflows of resources or deferred inflows of resources related to the collective net OPEB liability for life insurance benefits. Actuarial assumptions – The total OPEB liability in the June 30, 2017 actuarial valuation was determined using the following actuarial assumptions, applied to all periods included in the measurement:
Projected salary increasesInflation rateReal Wage GrowthWage InflationMunicipal Bond Index RateDiscount RateSingle Equivalent Interest Rate 7.50%, net of OPEB plan investment expense,
including inflation
3.00%0.50%3.50%3.89%7.50%
Investment rate of return 7.50%, net of OPEB Plan Investment Expense, including inflation
3.50 - 7.20%, including inflation
Mortality rates were based on the RP-2000 Combined Mortality Table projected to 2025 with projection scale BB and set forward two years for males and one year for females is used for the period after service retirement and for dependent beneficiaries. The RP-2000 Disabled Mortality Table set forward two years for males and seven years for females is used for the period after disability retirement. The remaining actuarial assumptions (e.g. initial per capita costs, rate of plan participation, rates of plan election, etc.) used in the June 30, 2017 valuation were based on a review of recent plan experience done concurrently with the June 30, 2017 valuation. Continued
Notes to the Financial Statements For the Year Ended June 30, 2019
60
Note H—Postemployment Benefits—Continued The long-term expected rate of return on OPEB plan investments was determined using a log-normal distribution analysis in which best-estimate ranges of expected future real rates of return (expected returns, net of OPEB plan investment expense and inflation) are developed for each major asset class. These ranges are combined to produce the long-term expected rate of return by weighting the expected future real rates of return by the target asset allocation percentage and by adding expected inflation. The target allocation and best estimates of arithmetic real rates of return for each major asset class, as provided by KTRS’s investment consultant, are summarized in the following table:
Asset ClassU.S. & International Equity 63.0%
Fixed Income 18.0%Real Estate 6.0%
Private Equity 5.0%Other Additional Categories 6.0%
Cash 2.0%Total 100.0%
% of Assets in Category
Discount rate - The discount rate used to measure the state’s total OPEB liability for life insurance was 7.50%. The projection of cash flows used to determine the discount rate assumed that the employer contributions will be made at statutorily required rates. Based on those assumptions, the OPEB plan’s fiduciary net position was projected to be available to make all projected future benefit payments of current plan members. Therefore, the long-term expected rate of return on OPEB plan investments was applied to all periods of projected benefit payments to determine the total OPEB liability. OPEB plan fiduciary net position – Detailed information about the OPEB plan’s fiduciary net position is available in the separately issued KTRS financial report. Note I—Commitments On June 30, 2019, the District had outstanding commitments for construction of $83,991,587.

Notes to the Financial Statements For the Year Ended June 30, 2019
61
Note J—Contingencies The District is subject to legal actions in various stages of litigation. Based on the advice of counsel, management of the District does not anticipate that there will be any material effect on the financial position of the District as a result of the litigation presently in progress beyond the settlements recorded as liabilities as of June 30, 2019. In the normal course of operations, the District receives funding from federal, state, and local government agencies and private contributions. These funds are to be used for designated purposes only. For government agency grants, if the grantor’s review indicates that the funds have not been used for the intended purpose, the grantor may request a refund of monies advanced or refuse to reimburse the District for its expenditures. The amount of such future refunds and unreimbursed expenditures, if any, is not expected to be significant. Continuation of the District’s grant programs is predicated upon the grantor’s satisfaction that the funds provided are being spent as intended and the grantors’ intent to continue their programs. In addition, the District operates in a heavily regulated environment. The operations of the District are subject to the administrative directives, rules and regulations of federal and state regulatory agencies, including, but not limited to, the U.S. Department of Education and the Kentucky Department of Education. Such administrative directives, rules and regulations are subject to change by an act of Congress or the Kentucky Legislature or an administrative change mandated by the Kentucky Department of Education. Such changes may occur with little or inadequate funding to pay for the related cost, including the additional administrative burden to comply with a change. Currently, the District has budgeted for such unfunded and underfunded mandates as Early Childhood ($28.9 million), student transportation ($45.7 million), English as a Second Language ($18.3 million), the State Agency Children’s Program ($9.3 million), Special Education ($74.7 million), and a new employer contribution to one of the pensions that District employees participate in ($17.4 million), among others. Note K—Insurance and Risk Financing Related Activities The District is exposed to various forms of loss of assets associated with the risks of fire, personal liability, theft, vehicle accidents, errors and omissions, fiduciary responsibility, etc. Each of these risk areas is covered through the purchase of commercial insurance. To further reduce financial risk to the District, additional policies are purchased to address the risk that claims could exceed the insurance coverage limits. Over the past three years, the District has not had claims that exceeded its insurance policies and excess policies. Since claims are entirely managed through commercial insurance, the District has no claims liability as of June 30, 2019.

Notes to the Financial Statements For the Year Ended June 30, 2019
62
Note L—Encumbrances The District classifies encumbrances as Assigned Fund Balance in the General Fund and as Restricted Fund Balance in other funds on its Balance Sheet – Governmental Funds in accordance with a directive from the Kentucky Department of Education. Issuing and controlling purchase orders is traditionally a management function, and encumbering and releasing the encumbrance of fund balance is a function of the District’s management with approval of members of our Board of Education. As of June 30, 2019, encumbrances were included in our Fund Balances as follows:
General Fund Assigned Fund Balance 16,244,256$ Grants & Awards Fund Restricted Fund Balance 1,700,988Construction Fund Restricted Fund Balance 36,036,021Nonmajor governmental funds 191,063
Total Encumbrances 54,172,328$
Note M—Recent GASB Pronouncements Statement No. 83, Certain Asset Retirement Obligations, this statement addresses accounting and financial reporting for certain asset retirement obligations (“ARO”s). This statement was adopted during the current year. It did not have a significant impact on the financial statements. Statement No. 88, Certain Disclosures Related to Debt, including Direct Borrowings and Direct Placements, the objective of this Statement is to improve the information that is disclosed in the notes to the financial statements relating to debt. This statement was adopted during the current year. It did not have a significant impact on the financial statements. The GASB has issued several reporting standards that will become effective for fiscal 2020 and later years’ financial statements.
Statement No. 84, Fiduciary Activities, establishes criteria for identifying fiduciary activities of all state and local governments. Statement No. 85, Omnibus 2017, addresses practice issue that have been identified during implementation and application of certain GASB statements. Statement No. 87, Leases, the objective of which is to better meet the information needs of financial statement users by improving accounting and financial
reporting for leases by governments. Statement No. 89, Accounting for Interest Cost Incurred before the End of a Construction Period, this Statement requires that interest cost incurred before the
end of a construction period be recognized as an expense in the period in which the cost is incurred for financial statements prepared using the economic resources measurement focus. Thus, interest cost incurred before the end of a construction period will not be included in the historical cost of a capital asset reported in a business-type activity or enterprise fund.
Statement No. 90, Majority Equity Interests, this statement addresses situations where a government acquires a majority interest in an equity interest in another organization.
Statement No. 91, Conduit Debt Obligations, the primary objective of this statement is to provide a single method of reporting conduit debt obligations by issuers and eliminate diversity in practice associated with related obligations, commitments, and footnote disclosures.
Continued

Notes to the Financial Statements For the Year Ended June 30, 2019
63
Note M—Recent GASB Pronouncements—Continued The District is currently evaluating the impact that will result from adopting these GASB standards and is therefore unable to disclose the impact that adopting these standards will have on the District’s financial position and the results of its operations when the standards are adopted. Note N – Deficit Fund Balance Nonmajor Enterprise Funds In addition to School Food Services major enterprise fund, Tuition Preschool has a deficit net position of $960,422. These funds are negative due to the unfunded pension and postemployment liabilities and related deferred inflows and outflows. Note O – Subsequent Events In preparing these financial statements, management of the District has evaluated events and transactions for potential recognition or disclosure through November 12, 2019, the date the financial statements were available to be issued.

Required Supplementary Information

64
S c he dule of Re ve nue s a nd Expe nditure s - Budge t a nd Ac tua l
Board of Education of Jefferson County, KentuckyYe a r Ende d June 30, 2019
Ge ne ra l Fund
Re ve n u e s
Loc a l sourc e s
P rope rty ta xe s $ 440,553,515 $ 440,553,515 $ 442,127,249 $ 1,573,734
Oc c upa tiona l ta xe s 170,493,750 170,493,750 165,754,818 (4 ,738,932)
Othe r ta xe s 55,574,828 55 ,574,828 56 ,671,549 1,096,721
S ta te sourc e s
S EEK progra m 242,117,316 242,117,316 247,934,805 5 ,817,489
Othe r s ta te re ve nue s 300,129,921 300,129,921 304,164,747 4 ,034,826
Inte re s t 3,015,000 3 ,015,000 7 ,371,642 4 ,356,642
Othe r sourc e s 10,308,697 10 ,308,697 11,086,482 777,785
To ta l Re ve n u e s 1,222,193,027 1,222,193,027 1,235,111,292 12,918,265
Exp e n d itu re s
Ins truc tion 721,209,211 712,545,185 696,775,984 15,769,201
S tude nt support se rvic e s 65,981,691 65,651,246 64 ,333,903 1,317,343
Ins truc tiona l s ta ff support se rvic e s 115,444,421 114,897,558 104,439,256 10 ,458,302
Dis tric t a dminis tra tion support se rvic e s 6 ,779,372 6 ,932,609 6 ,651,351 281,258
S c hool a dminis tra tion support se rvic e s 110,962,036 115,087,200 114,442,496 644,704
Busine ss support se rvic e s 49,197,387 50 ,750,638 45,181,438 5 ,569,200
P la nt ope ra tions a nd ma inte na nc e 132,005,324 133,173,376 116,359,814 16,813,562
S tude nt tra nsporta tion 82,942,899 90,187,795 87 ,360,599 2 ,827,196
Othe r 23,252 35 ,237 70,930 (35 ,693)
Food se rvic e ope ra tions 17,000 17 ,000 17 ,000
Community se rvic e s ope ra tions 3,189,171 3 ,326,278 2 ,954,223 372,055
Building re nova tions 1,146,140 1,327,468 1,159,222 168,246
Tra nsfe rs to P roprie ta ry Funds 3,072,836 (3 ,072,836)
Ope ra ting tra nsfe rs out 1,931,469 2 ,036,994 2 ,065,995 (29,001)
Continge nc y 59,698,654 53,188,406 53,188,406
To ta l Exp e n d itu re s 1,350,528,027 1,349,156,990 1,244,868,047 104,288,943
Re ve n u e s in Exc e s s o f
(Le s s Th a n ) Exp e n d itu re s (128,335,000) (126,963,963) (9 ,756,755) $ 117,207,208
Ne t P o s itio n , En d o f Ye a r $ 13,212,484 $ 14,583,521 $ 131,790,729
S e e p a g e 6 6 fo r e xp la n a tio n o f s ig n ific a n t b u d g e t va ria n c e s
S e e In d e p e n d e n t Au d ito rs ' Re p o rt
Fina l Budge t
P os itive (Ne ga tive )
Va ria nc e with
Working
Budge t
Fina l
Budge t Ac tua l

65
S c he dule of Re ve nue s a nd Expe nditure s - Budge t a nd Ac tua l
Board of Education of Jefferson County, KentuckyYe a r Ende d June 30, 2019
Re ve n u e s
Gra nts $ 117,159,567 $ 127,532,710 $ 115,108,412 $ (12,424,298)
In te re s t 1,669 39,327 30 ,934 (8 ,393)
Othe r S ourc e s 24,482 24 ,482
Tra nsfe rs from othe r funds 1,831,469 2 ,126,766 2 ,070,995 (55,771)
To ta l Re ve n u e s 118,992,705 129,698,803 117,234,823 (12,463,980)
Exp e n d itu re s
Ins truc tion 65,347,196 66,539,984 63,236,081 3 ,303,903
S tude nt support se rvic e s 3,615,659 4 ,758,035 3 ,827,636 930,399
Ins truc tiona l s ta ff support se rvic e s 34,300,980 34,706,599 36,402,816 (1,696,217)
Dis tric t a dminis tra tion support se rvic e s 165,529 74,261 162,874 (88,613)
S c hool a dminis tra tion support se rvic e s 874,436 600,805 584,676 16,129
Bus ine ss support se rvic e s 736,457 733,792 640,797 92 ,995
P la nt ope ra tions a nd ma inte na nc e 767,129 985,022 1,010,374 (25 ,352)
S tude nt tra nsporta tion 847,649 1,070,173 1,831,490 (761,317)
Community se rvic e ope ra tions 10,198,773 18,034,177 8 ,129,613 9 ,904,564
Building re nova tions
Othe r e xpe nditure s 2,138,897 2 ,195,955 2 ,264,215 (68 ,260)
Tra nsfe rs to o the r funds 150,241 (150,241)
To ta l Exp e n d itu re s 118,992,705 129,698,803 118,258,774 11,440,029
Re ve n u e s in Exc e s s o f
(Le s s Th a n ) Exp e n d itu re s (1,023,951) $ (1,023,951)
Ne t P o s itio n , En d o f Ye a r $ 10,215,664 $ 10,215,664 $ 9 ,191,713
S e e p a g e 6 6 fo r e xp la n a tio n o f s ig n ific a n t b u d g e t va ria n c e s
S e e In d e p e n d e n t Au d ito rs ' Re p o rt
S pe c ia l Re ve nue Fund
Working
Va ria nc e with
Ac tua l
Fina l Budge t
P os itive (Ne ga tive )Budge t
Fina l
Budge t

66
S c he dule of Re ve nue s a nd Expe nditure s - Budge t a nd Ac tua l
Board of Education of Jefferson County, KentuckyYe a r Ende d June 30, 2019
Exp la n a tio n o f s ig n ific a n t b u d g e t va ria n c e s :
Ge n e ra l Fu n d
S p e c ia l Re ve n u e Fu n d
S e e In d e p e n d e n t Au d ito rs ' Re p o rt
Ins truc tion e xpe nse s we re $15.8 million unde r budge t due to te mpora ry va c a nc ie s throughout the Dis tric t c a use d by le a ve or s ta ff move me nt. In a ddition, sc hools a re pe rmitte d to c a rryove r some unsupe nt budge t from one ye a r to the ne xt to a llow sc hools to pla n for la rge purc ha se s . P la nt ope ra tions a nd ma inte na nc e e xpe nse s we re $16.8 million unde r budge t. This re sulte d from s ta ff te mpora ry va c a nc ie s , c onse rva tive budge ting in ma ny utilitie s c a te gorie s , a nd c ons truc tion proje c ts tha t we re e nc umbe re d a t ye a r-e nd but a re sc he dule d to be c omple te d a nd e xpe nse d during the summe r of 2019. Ins truc tiona l S ta ff S upport S e rvic e s we re $10.5 million unde r budge t during a re orga niza tion whe re a dditiona l re sourc e s we re be ing a lloc a te d to support our te a c hing s ta ff. Additiona lly, c ontinge nc y is a c a te gory use d in Ke ntuc ky to de note a n a mount of fund ba la nc e not a lloc a te d to c urre nt e xpe nse s a nd e xpe c te d to re ma in be yond the c urre nt ye a r.
Gra nts re ve nue s , ins truc tion e xpe nditure s , a nd c ommunity se rvic e ope ra tions e xpe nditure s we re le ss tha n budge t due to the Dis tric t re linquishing the He a d S ta rt gra nt this ye a r. The Dis tric t c hose to re linquish this gra nt in a n e ffort to be more a lligne d to our K-12 miss ion.

67
Schedule of the District's Proportionate Share of the Net Pension Liability-- County Employees Retirement System Non-Hazardous
Board of Education of Jefferson County, KentuckyJune 30, 2019
2018-2019 2017-18 2016-17 2015-16 2014-15
District's proportion of the net pension liability 7.74380% 7.74870% 7.83330% 8.05481% 8.15008%
District's proportionate share of the net pension liability 471,620,358$ 453,555,175$ 385,681,594$ 346,318,819$ 264,419,000$
District's covered payroll 194,383,907$ 191,038,985$ 188,718,277$ 189,331,814$ 187,829,142$
District's proportionate share of the net pension liability 242.62% 237.41% 201.08% 183.51% 139.66%as a percentage of District's covered payroll
Plan fiduciary net position as a percentage of the total pension liability 53.540000% 55.300000% 55.500000% 59.968386% 66.801030%
** Schedule is intended to show information for ten years. Additional yearswill be displayed as they become available.
See Independent Auditors' Report
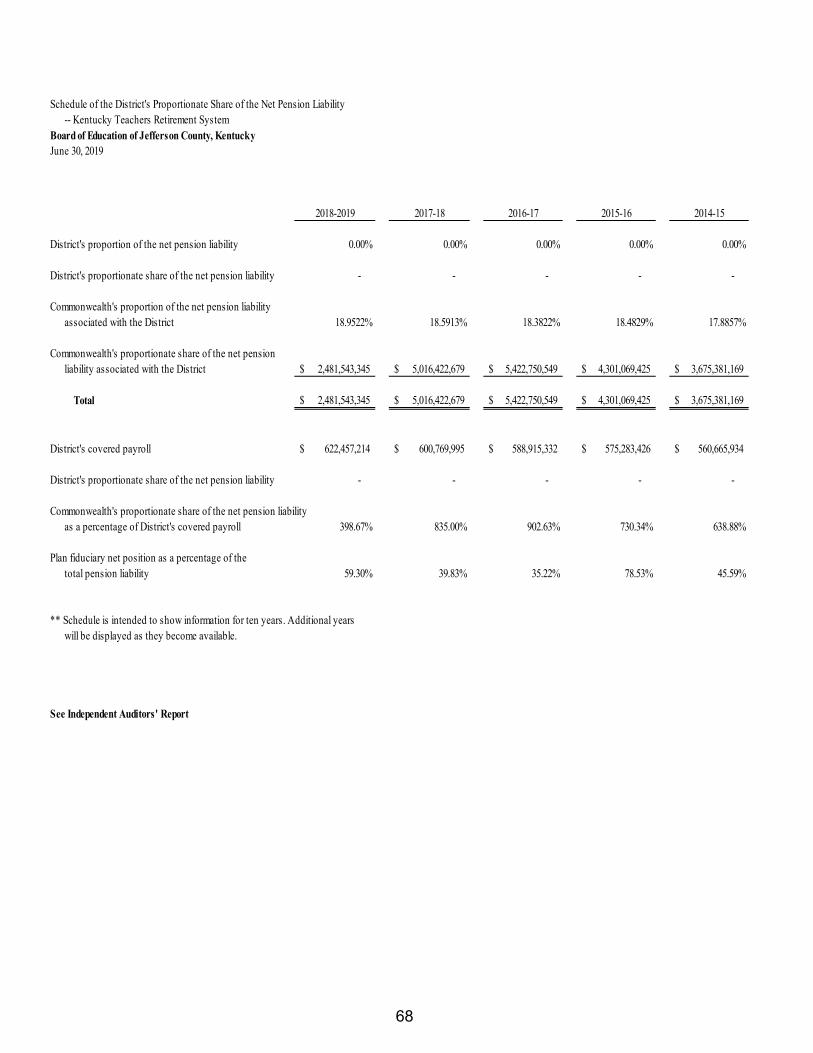
68
Schedule of the District's Proportionate Share of the Net Pension Liability-- Kentucky Teachers Retirement System
Board of Education of Jefferson County, KentuckyJune 30, 2019
2018-2019 2017-18 2016-17 2015-16 2014-15
District's proportion of the net pension liability 0.00% 0.00% 0.00% 0.00% 0.00%
District's proportionate share of the net pension liability - - - - -
Commonwealth's proportion of the net pension liabilityassociated with the District 18.9522% 18.5913% 18.3822% 18.4829% 17.8857%
Commonwealth's proportionate share of the net pension liability associated with the District 2,481,543,345$ 5,016,422,679$ 5,422,750,549$ 4,301,069,425$ 3,675,381,169$
Total 2,481,543,345$ 5,016,422,679$ 5,422,750,549$ 4,301,069,425$ 3,675,381,169$
District's covered payroll 622,457,214$ 600,769,995$ 588,915,332$ 575,283,426$ 560,665,934$
District's proportionate share of the net pension liability - - - - -
Commonwealth's proportionate share of the net pension liabilityas a percentage of District's covered payroll 398.67% 835.00% 902.63% 730.34% 638.88%
Plan fiduciary net position as a percentage of the total pension liability 59.30% 39.83% 35.22% 78.53% 45.59%
** Schedule is intended to show information for ten years. Additional yearswill be displayed as they become available.
See Independent Auditors' Report

69
Schedule of the District's Proportionate Share of the Collective Net OPEB Liability-- County Employees Retirement System Non-Hazardous
Board of Education of Jefferson County, KentuckyJune 30, 2019
2018-2019 2017-18 2016-17
District's proportion of the net OPEB liability 7.74380% 7.74870% N/A
District's proportionate share of the net OPEB liability 137,485,575$ 155,775,355$ 122,185,342$
District's covered-employee payroll 194,383,907$ 191,038,985$ 188,718,277$
District's proportionate share of the net OPEB liability 70.73% 81.54% 64.74%as a percentage of its covered-employee payroll
Plan fiduciary net position as a percentage of the total OPEB liability 57.620000% 52.400000% 52.4000%
** Schedule is intended to show information for ten years. Additional yearswill be displayed as they become available.
See Independent Auditors' Report

70
Schedule of the District's Proportionate Share of the Collective Net OPEB Liability-- Kentucky Teachers Retirement System - Medical Insurance
Board of Education of Jefferson County, KentuckyJune 30, 2019
2018-19 2017-18
District's proportion of the net OPEB liability 9.74% 9.78%
District's proportionate share of the net OPEB liability 338,031,000$ 348,684,000$
Commonwealth's proportion of the net pension liabilityassociated with the District 8.3960% 7.9877%
Commonwealth's proportionate share of the net pension liability associated with the District 291,312,000$ 284,824,000$
Total 629,343,000$ 633,508,000$
District's covered-employee payroll 622,457,214$ 600,769,995$
District's proportionate share of the net OPEB liability 54.31% 56.02%as a percentage of its covered-employee payroll
Plan fiduciary net position as a percentage of the total OPEB liability 25.5000% 21.1800%
** Schedule is intended to show information for ten years. Additional yearswill be displayed as they become available.
See Independent Auditors' Report

71
Schedule of the District's Proportionate Share of the Collective Net OPEB Liability-- Kentucky Teachers Retirement System - Life Insurance
Board of Education of Jefferson County, KentuckyJune 30, 2019
2018-19 2017-18
District's proportion of the net OPEB liability 0.00% 0.00%
District's proportionate share of the net OPEB liability -$ -$
Commonwealth's proportion of the net pension liabilityassociated with the District 17.7250% 17.3622%
Commonwealth's proportionate share of the net pension liability associated with the District 5,001,000$ 3,805,000$
Total 5,001,000$ 3,805,000$
District's covered-employee payroll 622,457,214$ 600,769,995$
District's proportionate share of the net OPEB liability 0.00% 0.00%as a percentage of its covered-employee payroll
Plan fiduciary net position as a percentage of the total OPEB liability 75.0000% 79.9900%
** Schedule is intended to show information for ten years. Additional yearswill be displayed as they become available.
See Independent Auditors' Report
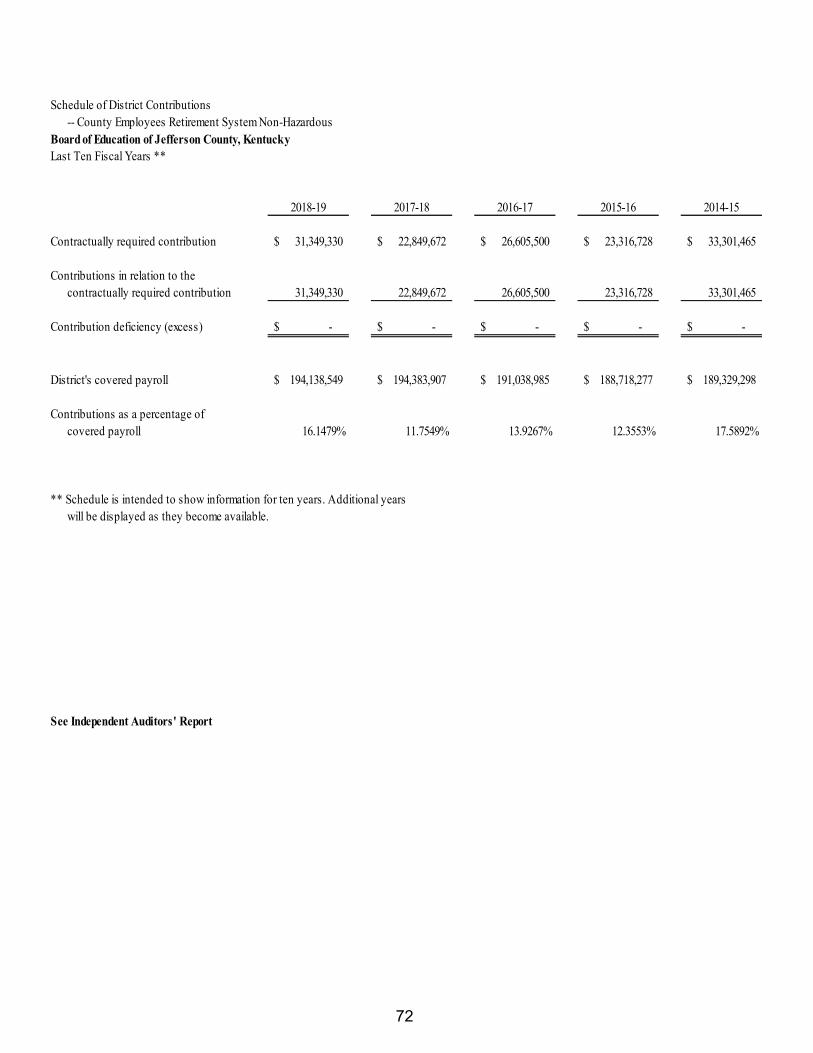
72
Schedule of District Contributions-- County Employees Retirement System Non-Hazardous
Board of Education of Jefferson County, KentuckyLast Ten Fiscal Years **
2018-19 2017-18 2016-17 2015-16 2014-15
Contractually required contribution 31,349,330$ 22,849,672$ 26,605,500$ 23,316,728$ 33,301,465$
Contributions in relation to the contractually required contribution 31,349,330 22,849,672 26,605,500 23,316,728 33,301,465
Contribution deficiency (excess) -$ -$ -$ -$ -$
District's covered payroll 194,138,549$ 194,383,907$ 191,038,985$ 188,718,277$ 189,329,298$
Contributions as a percentage ofcovered payroll 16.1479% 11.7549% 13.9267% 12.3553% 17.5892%
** Schedule is intended to show information for ten years. Additional yearswill be displayed as they become available.
See Independent Auditors' Report

73
Schedule of District Contributions-- Kentucky Teachers Retirement System
Board of Education of Jefferson County, KentuckyLast Ten Fiscal Years **
2018-19 2017-18 2016-17 2015-16 2014-15
Contractually required contribution -$ -$ -$ -$ -$
Contributions in relation to the contractually required contribution - - - - -
Contribution deficiency (excess) -$ -$ -$ -$ -$
District's covered payroll 639,689,235$ 622,457,214$ 600,769,995$ 588,915,332$ 575,283,426$
Contributions as a percentage ofcovered payroll 0.0000% 0.0000% 0.0000% 0.0000% 0.0000%
** Schedule is intended to show information for ten years. Additional yearswill be displayed as they become available.
See Independent Auditors' Report

74
Schedule of District Contributions-- OPEB: County Employees Retirement System Non-Hazardous
Board of Education of Jefferson County, KentuckyLast Ten Fiscal Years **
2018-19 2017-18 2016-17
Contractually required contribution 31,349,330$ 22,849,672$ 26,605,500$
Contributions in relation to the contractually required contribution 31,349,330 22,849,672 26,605,500
Contribution deficiency (excess) -$ -$ -$
District's covered-employee payroll 194,138,549$ 194,383,907$ 191,038,985$
Contributions as a percentage ofcovered-employee payroll 16.1479% 11.7549% 13.9267%
** Schedule is intended to show information for ten years. Additional yearswill be displayed as they become available.
See Independent Auditors' Report

75
Schedule of District Contributions-- OPEB: Kentucky Teachers Retirement System - Medical Insurance
Board of Education of Jefferson County, KentuckyLast Ten Fiscal Years **
2018-19 2017-18
Contractually required contribution 17,354,459$ 16,753,572$
Contributions in relation to the contractually required contribution 17,354,459 16,753,572
Contribution deficiency (excess) -$ -$
District's covered-employee payroll 639,689,235$ 622,457,214$
Contributions as a percentage ofcovered-employee payroll 2.7130% 2.6915%
** Schedule is intended to show information for ten years. Additional yearswill be displayed as they become available.
See Independent Auditors' Report

76
Schedule of District Contributions-- OPEB: Kentucky Teachers Retirement System - Life Insurance
Board of Education of Jefferson County, KentuckyLast Ten Fiscal Years **
2018-19 2017-18
Contractually required contribution -$ -$
Contributions in relation to the contractually required contribution - -
Contribution deficiency (excess) -$ -$
District's covered-employee payroll 639,689,235$ 622,457,214$
Contributions as a percentage ofcovered-employee payroll 0.0000% 0.0000%
** Schedule is intended to show information for ten years. Additional yearswill be displayed as they become available.
See Independent Auditors' Report

63
Other Supplementary Information

77
S c he dule of Re ve nue s a nd Expe nditure s - Budge t a nd Ac tua l
Board of Education of Jefferson County, KentuckyYe a r Ende d June 30, 2019
Va ria nc e with
Fina l Budge t
P os itive (Ne ga tive )
Re ve n u e s
Inte re s t $ 71,337 $ 71,337
P roc e e ds from the sa le of bonds $ 75,000,000 $ 98,428,050 84,485,000 (13,943,050)
Othe r inc ome 5,877,974 5 ,877,974
Tra nsfe rs from othe r funds 16,609,998 16,609,998
To ta l Re ve n u e s 75,000,000 98,428,050 107,044,309 8 ,616,259
Exp e n d itu re s
Building re nova tions 75,000,000 9 ,428,050 53,507,905 (44,079,855)
Tra nsfe rs to othe r funds 2,772,114 (2 ,772,114)
To ta l Exp e n d itu re s 75,000,000 9 ,428,050 56,280,019 (46,851,969)
Re ve n u e s in Exc e s s o f
(Le s s Th a n ) Exp e n d itu re s 50,764,290 $ (38,235,710)
Ne t P o s itio n , En d o f Ye a r $ 46,860,175 $ 46,860,175 $ 97,624,465
Va ria nc e with
Fina l Budge t
P os itive (Ne ga tive )
Re ve n u e s
Lunc hroom sa le s $ 4,500,000 $ 4,500,000 $ 3,023,797 $ (1,476,203)
Fe de ra l gra nts 64,267,040 70,972,222 54,592,235 (16,379,987)
S ta te re ve nue s 5,080,566 5 ,080,566 4 ,846,214 (234,352)
Dona te d c ommoditie s 3,408,472 3 ,408,472
Dis tric t support 2,979,945 2 ,979,945
Inte re s t 100,000 100,000 170,812 70,812
Misc e lla ne ous 45,000 81,943 (81,943)
To ta l Re ve n u e s 73,992,606 80,734,731 69,021,475 (11,713,256)
Exp e n s e s
Food se rvic e ope ra tion 100,477,126 95,466,235 68,543,925 26,922,310
Tra nsfe rs to othe r funds 3,360,000 6 ,924,529 3 ,656,941 3 ,267,588
To ta l Exp e n s e s 103,837,126 102,390,764 72,200,866 30,189,898
Re ve n u e s in Exc e s s o f
(Le s s Th a n ) Exp e n s e s (29,844,520) (21,656,033) (3 ,179,391) $ 18,476,642
Ne t P o s itio n , En d o f Ye a r $ (84,165,304) $ (75,976,817) $ (57,500,175)
B a s is o f b u d g e tin g - - The Boa rd a c c ounts for a nd budge ts oope ra tin a c c ording to the Ge rne ra lly Ac c e pte d Ac c outing P rinc iple s .
S e e p a g e 8 1 fo r e xp la n a tio n o f s ig n ific a n t b u d g e t va ria n c e s
S e e In d e p e n d e n t Au d ito rs ' Re p o rt
Construc tion Fund
Working Fina l
Budge t Budge t Ac tua l
S c hool Food S e rvic e s
Working
Budge t
Fina l
Budge t Ac tua l

78
S c he dule of Re ve nue s a nd Expe nditure s - Budge t a nd Ac tua l - Nonma jor Funds
Board of Education of Jefferson County, KentuckyYe a r Ende d June 30, 2019
Va ria nc e with
Fina l Budge t
P os itive (Ne ga tive )
Re ve n u e s
S ta te S EEK progra m $ 8,642,470 $ 8,642,470 $ 8,629,589 $ (12,881)
Exp e n d itu re s
Tra nsfe rs to o the r funds 8,642,470 8 ,642,470 8 ,629,589 12,881
To ta l Exp e n d itu re s 8,642,470 8 ,642,470 8 ,629,589 12,881
Re ve n u e s in Exc e s s o f
(Le s s Th a n ) Exp e n d itu re s $
Ne t P o s itio n , En d o f Ye a r $ $ $
Va ria nc e with
Fina l Budge t
P os itive (Ne ga tive )
Re ve n u e s
P rope rty ta xe s $ 39,318,221 $ 39,318,221 $ 37,943,111 $ (1,375,110)
Othe r sourc e s 200,000 200,000 102,096 (97 ,904)
To ta l Re ve n u e s 39,518,221 39 ,518,221 38,045,207 (1,473,014)
Exp e n d itu re s
Tra nsfe rs to o the r funds 39,518,221 39 ,518,221 43,324,491 (3 ,806,270)
To ta l Exp e n d itu re s 39,518,221 39 ,518,221 43,324,491 (3 ,806,270)
Re ve n u e s in Exc e s s o f
(Le s s Th a n ) Exp e n d itu re s (5 ,279,284) $ (5,279,284)
Ne t P o s itio n , En d o f Ye a r $ 9,459,699 $ 9,459,699 $ 4,180,415
S e e p a g e 8 1 fo r e xp la n a tio n o f s ig n ific a n t b u d g e t va ria n c e s
S e e In d e p e n d e n t Au d ito rs ' Re p o rt
Fina l
Budge t Budge t Ac tua l
S EEK Ca pita l Outla y Fund
Working Fina l
Budge t Budge t Ac tua l
Build ing Ta x Fund
Working

79
S c he dule of Re ve nue s a nd Expe nditure s - Budge t a nd Ac tua l - Nonma jor Funds
Board of Education of Jefferson County, KentuckyYe a r Ende d June 30, 2019
Va ria nc e with
Fina l Budge t
P os itive (Ne ga tive )
Re ve n u e s
KS FCC a lloc a tion $ 9,500,000 $ 9 ,500,000 $ 10,982,285 $ 1,482,285
Othe r sourc e s 2,600,000 2 ,600,000 2 ,621,896 21,896
Tra nsfe rs from othe r funds 48,160,691 48,160,691 38,116,196 (10,044,495)
To ta l Re ve n u e s 60,260,691 60,260,691 51,720,377 (8 ,540,314)
Exp e n d itu re s
De bt se rvic e 60,260,691 60,260,691 51,720,377 (8 ,540,314)
To ta l Exp e n d itu re s 60,260,691 60,260,691 51,720,377 (8,540,314)
Re ve n u e s in Exc e s s o f
(Le s s Th a n ) Exp e n d itu re s $
Ne t P o s itio n , En d o f Ye a r $ $ $
Va ria nc e with
Fina l Budge t
P os itive (Ne ga tive )
Re ve n u e s
Da y c a re fe e s $ 325 $ 7 ,034 $ 7,034
Othe r s ta te a nd fe de ra l re ve nue s 38,474 307,637 293,684 $ (13,953)
To ta l Re ve n u e s 38,799 314,671 300,718 (13 ,953)
Exp e n s e s
Da y c a re ope ra tions 454,467 730,339 (435,894) (1,166,233)
Re ve n u e s in Exc e s s o f
(Le s s Th a n ) Exp e n s e s (415,668) (415,668) 736,612 $ (1,180,186)
Ne t P o s itio n , En d o f Ye a r $ (662,859) $ (662,859) $ 489,421
S e e p a g e 8 1 fo r e xp la n a tio n o f s ig n ific a n t b u d g e t va ria n c e s
S e e In d e p e n d e n t Au d ito rs ' Re p o rt
Da y Ca re Ope ra tions
Working Fina l
Budge t Budge t Ac tua l
Working Fina l
Budge t Budge t Ac tua l
De bt S e rvic e Fund

80
S c he dule of Re ve nue s a nd Expe nditure s - Budge t a nd Ac tua l - Nonma jor Funds
Board of Education of Jefferson County, KentuckyYe a r Ende d June 30, 2019
Va ria nc e with
Fina l Budge t
P os itive (Ne ga tive )
Re ve n u e s
Adult e duc a tion tuition $ 218,620 $ 213,768 $ 183,017 $ (30,751)
In te re s t 306 5 ,158 5 ,158
Othe r s ta te re ve nue s 31,625 31,625 31,525 (100)
To ta l Re ve n u e s 250,551 250,551 219,700 (30,851)
Exp e n s e s
Ins truc tion 19,821 2 ,211 171,152 (168,941)
Ins truc tiona l s ta ff support se rvic e s 456,804 475,080 475,080
Tra nsfe rs to othe r funds 5,000 5 ,000 5 ,000
To ta l Exp e n s e s 481,625 482,291 176,152 306,139
Re ve n u e s in Exc e s s o f
(Le s s Th a n ) Exp e n s e s (231,074) (231,740) 43,548 $ 275,288
Ne t P o s itio n , En d o f Ye a r $ 331 $ (335) $ 274,953
Va ria nc e with
Fina l Budge t
P os itive (Ne ga tive )
Re ve n u e s
P re - S c hool Tuition $ 871,788 $ 885,286 $ 742,039 $ 143,247
Othe r s ta te re ve nue s 179,135 179,135 219,651 (40,516)
To ta l Re ve n u e s 1,050,923 1,064,421 961,690 102,731
Exp e n s e s
Ins truc tion 1,274,675 1,288,173 707,730 580,443
Re ve n u e s in Exc e s s o f
(Le s s Th a n ) Exp e n s e s (223,752) (223,752) 253,960 $ (477,712)
Ne t P o s itio n , En d o f Ye a r $ (1,438,134) $ (1,438,134) $ (960,422)
S e e p a g e 8 1 fo r e xp la n a tio n o f s ig n ific a n t b u d g e t va ria n c e s
S e e In d e p e n d e n t Au d ito rs ' Re p o rt
Adult Educ a tion
Working
Budge t
Fina l
Budge t Ac tua l
Tuition P re - S c hool
Working
Budge t
Fina l
Budge t Ac tua l

81
S c he dule of Re ve nue s a nd Expe nditure s - Budge t a nd Ac tua l - Nonma jor Funds
Board of Education of Jefferson County, KentuckyYe a r Ende d June 30, 2019
Va ria nc e with
Fina l Budge t
P os itive (Ne ga tive )
Re ve n u e s
P rogra m fe e s $ 23,510 $ 62,084 $ 57,976 $ 4 ,108
S ta te re ve nue s 4,936 4 ,936 3 ,521 1,415
Tra nsfe rs from othe r funds 95,000 96 ,925 92 ,891 4 ,034
To ta l Re ve n u e s 123,446 163,945 154,388 9 ,557
Exp e n s e s
Ins truc tion 107,850 113,162 141,308 (28,146)
Ins truc tiona l s ta ff support 32,442 65 ,704
Community se rvic e s 27,936 29 ,861
To ta l Exp e n s e s 168,228 208,727 141,308 (28,146)
Re ve n u e s in Exc e s s o f
(Le s s Th a n ) Exp e n s e s (44,782) (44,782) 13,080 $ 37,703
Ne t P o s itio n , En d o f Ye a r $ $ $ 57,862
S e e b e lo w fo r e xp la n a tio n o f s ig n ific a n t b u d g e t va ria n c e s
Exp la n a tio n o f s ig n ific a n t b u d g e t va ria n c e s :
Co n s tru c tio n Fu n d
S c h o o l Fo o d S e rvic e s
B u ild in g Fu n d
De b t S e rvic e Fu n d
S e e In d e p e n d e n t Au d ito rs ' Re p o rt
re fundings done during th is pe riod of low inte re s t ra te s . Re funding issue s c a pture d ne t inte re s t sa vings a nd ne ve r inc re a se d the te rm of e a c h bond.
Tra ns fe rs to othe r funds we re $3.8 million ove r budge t a s the Dis tric t c hose to utilize the se funds to pa y for re nova tion proje c ts us ing c a sh during the 2018- 19 fisc a l ye a r.
P roc e e ds from the sa le of bonds wa s le ss tha n budge t by $14 million a s the Dis tric t took a dva nta ge of the sus ta ine d low inte re s t ra te s to fina nc e ne c e ssa ry c a pita l re nova tion proje c ts on the long- ra nge fa c ilitie s p la n. The se proje c ts c a use d building re nova tion e xpe nditure s to e xc e e d budge t by $44.1 million a s the bond- funde d proje c ts a re ongoing. The va ria nc e s in ope ra ting tra ns fe rs in a nd out a re routine timing diffe re nc e s re la te d to ye a r e nd de bt se rvic e pa yme nts . The se timing diffe re nc e a djus tme nts a re not budge te d in the fund.
Food se rvic e ope ra tion is inte ntiona lly ove rbudge te d a s the fund's prior ye a r ne t pos ition is not inte nde d to be use d within one ye a r. This c a use d a $26.9 million unde ra ge .
Ente rprise P rogra ms
Working
Budge t
Fina l
Budge t Ac tua l

82
Combining Balance Sheet - Nonmajor Governmental FundsBoard of Education of Jefferson County, Kentucky
GovernmentalFund Funds
AssetsAccounts receivable $ 52,367 $ 52,367 Due from other funds $ 4,180,415 3,433,081 7,613,496
Total Assets 4,180,415 3,485,448 7,665,863
LiabilitiesAccrued liabilities 248,042 248,042
Fund Balances, Restricted 4,180,415 3,237,406 7,417,821
Total Liabilitiesand Fund Balances $ 4,180,415 $ 3,485,448 $ 7,665,863
S e e In d e p e n d e n t Au d ito rs ' Re p o rt
NonmajorTotal
BuildingTax
DistrictActivityFunds
June 30, 2019

83
Combining Statement of Revenues, Expenditures andChanges in Fund Balances - Nonmajor Governmental Funds
Board of Education of Jefferson County, KentuckyYear Ended June 30, 2019
RevenuesLocal sources
Property taxes $ 37,943,111 $ 37,943,111 State sources
SEEK program $ 8,629,589 8,629,589 KSFCC allocation $ 10,982,285 10,982,285
Other Sources 102,096 2,621,896 $ 4,352,197 7,076,189
Total Revenues 38,045,207 8,629,589 13,604,181 4,352,197 64,631,174
ExpendituresInstruction 3,629,301 3,629,301 Plant operations & maintenance 68,179 68,179 Debt service
Principal 35,151,226 35,151,226 Interest 16,569,151 16,569,151
Total Expenditures 51,720,377 3,697,480 55,417,857
Revenues in Excess of(Less Than) Expenditures 38,045,207 8,629,589 (38,116,196) 654,717 9,213,317
Other Financing Sources (Uses)Operating transfers in 38,116,196 38,116,196 Operating transfers out (43,324,491) (8,629,589) (51,954,080)
Total Other Financing Sources (Uses) (43,324,491) (8,629,589) 38,116,196 (13,837,884)
Net Change in Fund Balances (5,279,284) 654,717 (4,624,567)
Fund Balances, Beginning of Year 9,459,699 2,582,689 12,042,388
Fund Balances, End of Year $ 4,180,415 $ $ $ 3,237,406 $ 7,417,821
S e e In d e p e n d e n t Au d ito rs ' Re p o rt
FundsGovernmental
NonmajorTotal
FundDebt Service
FundsActivityDistrict
FundTax
Building
FundOutlay
SEEK Capital

84
Combining Statement of Net Position - Nonmajor Proprietary FundsBoard of Education of Jefferson County, Kentucky
Adult Enterprise Tuition DaycareEducation Programs Pre-School Operations
AssetsCurrent Assets
Cash and cash equivalents $ 327,075 $ 327,075 Due from other funds $ 111,896 $ 369,185 $ 583,137 1,064,218
Total Current Assets 327,075 111,896 369,185 583,137 1,391,293
Deferred Outflows of ResourcesDifference between actual and
expected experience 23,414 1,635 25,049Difference between projected and
actual earnings on plan investments 33,381 2,331 35,712Changes in Assumptions 119,022 8,312 127,334Pension contributions after
measurement date 63,191 4,413 67,604
Total Deferred Outflows of Resources 239,008 16,691 255,699
LiabilitiesCurrent Liabilities
Accrued liabilities 24 859 883 Due to other funds 52,098 54,034 106,132
Noncurrent LiabilitiesUnfunded pension liabilities 717,853 50,133 767,986Unfunded post-employment benefits liabilities 723,784 50,548 774,332
Total Liabilities 52,122 54,034 1,441,637 101,540 1,649,333
Deferred Inflows of ResourcesDifferences between projected and
actual earnings on plan investments 58,497 4,085 62,582Differences between actual and
expected experience 61,249 4,277 65,526Changes in Assumptions 484 34 518Changes in proportionate share 6,748 471 7,219
Total Deferred Inflows of Resources 126,978 8,867 135,845
Net PositionUnrestricted 274,953 57,862 (960,422) 489,421 (138,186)
Total Net Position $ 274,953 $ 57,862 $ (960,422) $ 489,421 $ (138,186)
S e e In d e p e n d e n t Au d ito rs ' Re p o rt
Enterprise FundsTotal Nonmajor
Enterprise Funds
June 30, 2019

85
Combining Statement of Revenues, Expenses and Changes in Net Position - Nonmajor Proprietary Funds
Board of Education of Jefferson County, KentuckyYear Ended June 30, 2019
Operating RevenuesTuition and fees $ 183,017 $ 57,976 $ 742,039 $ 7,034 $ 990,066
Operating ExpensesSalaries and personnel services 123,727 16,617 658,899 65,642 864,885Employee benefits 40,432 4,891 15,546 (536,019) (475,150)Purchased professional services 3,766 94,220 10 2,585 100,581Purchased property maintenance services 6,750 6,750Other purchased services 2,325 618 2,943Supplies and materials 803 6,879 9,824 12,619 30,125Property 18,083 16,701 14,610 49,394Miscellaneous 99 4,669 4,768
Total Operating Expenses 171,152 141,308 707,730 (435,894) 584,296
Loss From Operations 11,865 (83,332) 34,309 442,928 405,770
Non-Operating Revenues (Expenses)State revenues 31,525 3,521 219,651 293,684 548,381Transfers to other funds (5,000) (5,000)Transfers from other funds 92,891 92,891Interest income 5,158 5,158
Total Non-Operating Revenues(Expenses) 31,683 96,412 219,651 293,684 641,430
Change in Net Position 43,548 13,080 253,960 736,612 1,047,200
Net Position, Beginning of Year 231,405 44,782 (1,214,382) (247,191) (1,185,386)
Net Position, End of Year $ 274,953 $ 57,862 $ (960,422) $ 489,421 $ (138,186)
S e e In d e p e n d e n t Au d ito rs ' Re p o rt
Total NonmajorEnterprise Funds
DaycareOperations
Enterprise FundsAdult
EducationEnterprisePrograms
TuitionPre-School

86
Combining Statement of Cash Flows - Nonmajor Proprietary FundsBoard of Education of Jefferson County, KentuckyYear Ended June 30, 2019
Cash Flows From O perating ActivitiesCash received from customers $ 187,596 $ 83,753 $ 806,172 $ (160,286) $ 917,235 Cash paid to suppliers 48,861 28,454 (36,510) (26,519) 14,286 Cash paid to employees (164,494) (21,508) (989,303) (99,625) (1,274,930)
Cash paid for other expenses (3,865) (94,220) (10) (7,254) (105,349)
Net Cash Provided by (Used in) O perating Activities 68,098 (3,521) (219,651) (293,684) (448,758)
Cash Flows From Capital and Related Financing ActivitiesInterest earned 5,158 5,158
Net Cash Provided By (Used in) Capital and Related Financing Activities 5,158 5,158
Cash Flows from Noncapital Financing ActivitiesCash used for operational grant required match (5,000) (5,000) Cash received for operational grants 31,525 3,521 219,651 293,684 548,381
Net Cash Provided by Noncapital Financing Activities 26,525 3,521 219,651 293,684 543,381
Increase (Decrease) in Cash and Cash Equivalents 99,781 99,781
Cash and Cash Equivalents, Beginning of Year 227,294 227,294
Cash and Cash Equivalents, End of Year $ 327,075 $ $ $ $ 327,075
Reconciliation of (Income) Loss from O perations to Net CashProvided by (Used in) O perating Activities
Loss from operations $ 11,865 $ (83,332) $ 34,309 $ 442,928 $ 405,770 Adjustments to reconcile loss from operations to cash
provided by (used in) operating activities:T ransfers 92,891 92,891 Change in accounts receivable 8,319 8,319 Change in amounts due from other funds 4,579 (75,433) 64,133 (167,320) (174,041) Change in defered outflows 73 124,824 129,962 254,859 Change in amounts due to other funds 52,098 54,034 106,132 Change in accrued liabilit ies (109) (3,235) 710 (2,634) Change in deferred inflows (25) 7,452 (39,311) (31,884) Change in unfunded pension liabilit ies (181) (176,376) (310,307) (486,864) Change in unfunded postemployment benefits liabilit ies (202) (270,758) (350,346) (621,306)
Net Cash Used in O perating Activities $ 68,098 $ (3,521) $ (219,651) $ (293,684) $ (448,758)
S e e In d e p e n d e n t Au d ito rs ' Re p o rt
Total NonmajorEnterprise Funds
Enterprise FundsAdult
EducationEnterprisePrograms
TuitionPre-School
DaycareOperations

87
Combining S ta te me nt of Ne t P os ition - Fiduc ia ry Funds
Board of Education of Jefferson County, Kentucky
As s e ts
Ca sh a nd c a sh e quiva le nts $ 3,132,067 $ 959,031 $ 1,048,575 $ 5,139,673
Inve s tme nts 626,367 50,000 5,000 681,367
Ac c ounts re c e iva ble 45,121 2,746 3,174 $ 710,500 761,541
Inve ntory 112,527 149,887 25,104 287,518
To ta l As s e ts $ 3,916,082 $ 1,161,664 $ 1,081,853 $ 710,500 $ 6,870,099
Lia b ilitie s
Ac c rue d lia bilitie s $ 95,437 $ 5,832 $ 9,296 450 $ 111,015
Due to s tude nt groups 3,820,645 1,155,832 1,072,557 $ 710,050 6,759,084
To ta l Lia b ilitie s $ 3,916,082 $ 1,161,664 $ 1,081,853 $ 710,500 $ 6,870,099
S ta te me n t o f Ch a n g e s in As s e ts a n d Lia b ilitie s - Fid u c ia ry Fu n d s
As s e ts
Ca sh a nd c a sh e quiva le nts $ 3,206,297 $ 10,507,560 $ 10,581,790 $ 3 ,132,067
Inve s tme nts 676,367 50 ,000 626,367
Ac c ounts re c e iva ble 11,732 45,121 11,732 45,121
Inve ntory 150,853 112,527 150,853 112,527
To ta l As s e ts $ 4,045,249 10,665,208 10,794,375 $ 3,916,082
Lia b ilitie s
Ac c rue d lia bilitie s $ 65,172 $ 95,437 $ 65,172 $ 95,437
Due to s tude nt groups 3,980,077 3 ,820,645 3 ,980,077 3 ,820,645
To ta l Lia b ilitie s $ 4,045,249 $ 3,916,082 $ 4,045,249 $ 3,916,082
As s e ts
Ca sh a nd c a sh e quiva le nts $ 1,093,096 $ 4,181,968 $ 4,316,033 $ 959,031
Inve s tme nts 50,000 50,000
Ac c ounts re c e iva ble 943 2 ,746 943 2 ,746
Inve ntory 131,140 149,887 131,140 149,887
To ta l As s e ts $ 1,275,179 $ 4,334,601 $ 4,448,116 $ 1,161,664
Lia b ilitie s
Ac c rue d lia bilitie s $ 14,163 $ 5,832 $ 14,163 $ 5,832
Due to s tude nt groups 1,261,016 1,155,832 1,261,016 1,155,832
To ta l Lia b ilitie s $ 1,275,179 $ 1,161,664 $ 1,275,179 $ 1,161,664
Continue d
June 30, 2019
Age nc y Funds
High S c hool
Ac tivity
Fund
Middle S c hool
Ac tivity
Fund
Ele me nta ry
Fund
Ac tivity
S c hool Othe r
Age nc y
Funds
Tota l
Age nc y
Funds
High S c hool Ac tivity Fund
Additions De duc tions 20192018
Middle S c hool Ac tivity Fund
2018 Additions De duc tions 2019

88
S ta te me nt of Cha nge s in Asse ts a nd Lia bilitie s - Fiduc ia ry Funds- Continue d
Board of Education of Jefferson County, Kentucky
As s e ts
Ca sh a nd c a sh e quiva le nts $ 1,325,944 $ 4 ,286,618 $ 4,563,987 $ 1,048,575
Inve s tme nts 5,000 5 ,000
Ac c ounts re c e iva ble 1,851 3 ,174 1,851 3 ,174
Inve ntory 31,672 25,104 31,672 25,104
To ta l As s e ts $ 1,364,467 $ 4,314,896 $ 4,597,510 $ 1,081,853
Lia b ilitie s
Ac c rue d lia bilitie s $ 18,358 $ 9,296 $ 18,358 $ 9,296
Due to s tude nt groups 1,346,109 1,072,557 1,346,109 1,072,557
To ta l Lia b ilitie s $ 1,364,467 $ 1,081,853 $ 1,364,467 $ 1,081,853
As s e ts
Ac c ounts re c e iva ble $ 693,873 $ 710,500 $ 693,873 $ 710,500
To ta l As s e ts $ 686,942 $ 710,500 $ 693,873 $ 710,500
Lia b ilitie s
Ac c rue d lia bilitie s $ 450 $ 450
Due to s tude nt groups $ 693,873 710,050 $ 693,873 710,050
To ta l Lia b ilitie s $ 686,942 $ 710,050 $ 693,873 $ 710,050
As s e ts
Ca sh a nd c a sh e quiva le nts $ 5,625,337 $ 18,976,146 $ 19,461,810 $ 5,139,673
Inve s tme nts 731,367 50 ,000 681,367
Ac c ounts re c e iva ble 708,399 761,541 708,399 761,541
Inve ntory 313,665 287,518 313,665 287,518
To ta l As s e ts $ 7,378,768 $ 20,025,205 $ 20,533,874 $ 6,870,099
Lia b ilitie s
Ac c rue d Lia bilitie s $ 97,693 $ 111,015 $ 97,693 $ 111,015
Due to s tude nt groups 7,281,075 6 ,759,084 7 ,281,075 6 ,759,084
To ta l Lia b ilitie s $ 7,378,768 $ 6,870,099 $ 7,378,768 $ 6,870,099
S e e In d e p e n d e n t Au d ito rs ' Re p o rt
June 30, 2019
Ele me nta ry S c hool Ac tivity Fund
2018 Additions De duc tions 2019
Othe r Age nc y Funds
2018 Additions De duc tions 2019
Tota l All Age nc y Funds
2018 Additions De duc tions 2019

STATISTICAL SECTION
• Financial Trend Data – Financial management through multi‐year analytics
• Revenue Capacity Data – Our ability to support its activities with current revenues
• Debt Capacity Data – Debt burden and capacity for future bonding
• Demographic & Economic Information –Jefferson County residents and economy
• Operating Information – Quantitative information about our district
DEMOGRAPHIC & ECONOMIC INFORMATIONFINANCIAL TRENDS
REVENUE & DEBT CAPACITY
OPERATIONAL DATA

89
Board of Education of Jefferson County, Kentucky
Statement of Net Position
Ten Years' Trend Data
2019 2018 2017 2016 2015Net Position--Governmental
Net investmest in capital assets $ 334,282,855 $ 348,872,266 $ 273,951,321 $ 237,297,859 $ 255,725,319 Restricted 174,959,788 73,324,431 164,586,399 113,813,258 78,544,164 Unrestricted (855,462,019) (695,450,592) (670,453,548) (627,298,464) (595,108,111)
Total Net Postion--Governmental (346,219,376) (273,253,895) (231,915,828) (276,187,347) (260,838,628)
Net Position--ProprietarySchool Food Services (57,500,175) (54,320,784) (47,253,545) (25,759,539) (25,133,436) Adult Education 274,953 231,405 158,207 86,224 11,844 Enterprise Programs 57,862 44,782 40,672 27,140 16,073 Tuition Pre-School (960,422) (1,214,382) (1,185,588) (916,622) (916,622) Daycare Operations 489,421 (247,191) (356,205) (123,103) (256,925)
Total Net Position--Proprietary (57,638,361) (55,506,170) (48,596,459) (26,685,900) (26,279,066)
Net Position--Total Primary Government $ (403,857,737) $ (328,760,065) $ (280,512,287) $ (302,873,247) $ (287,117,694)
Continued
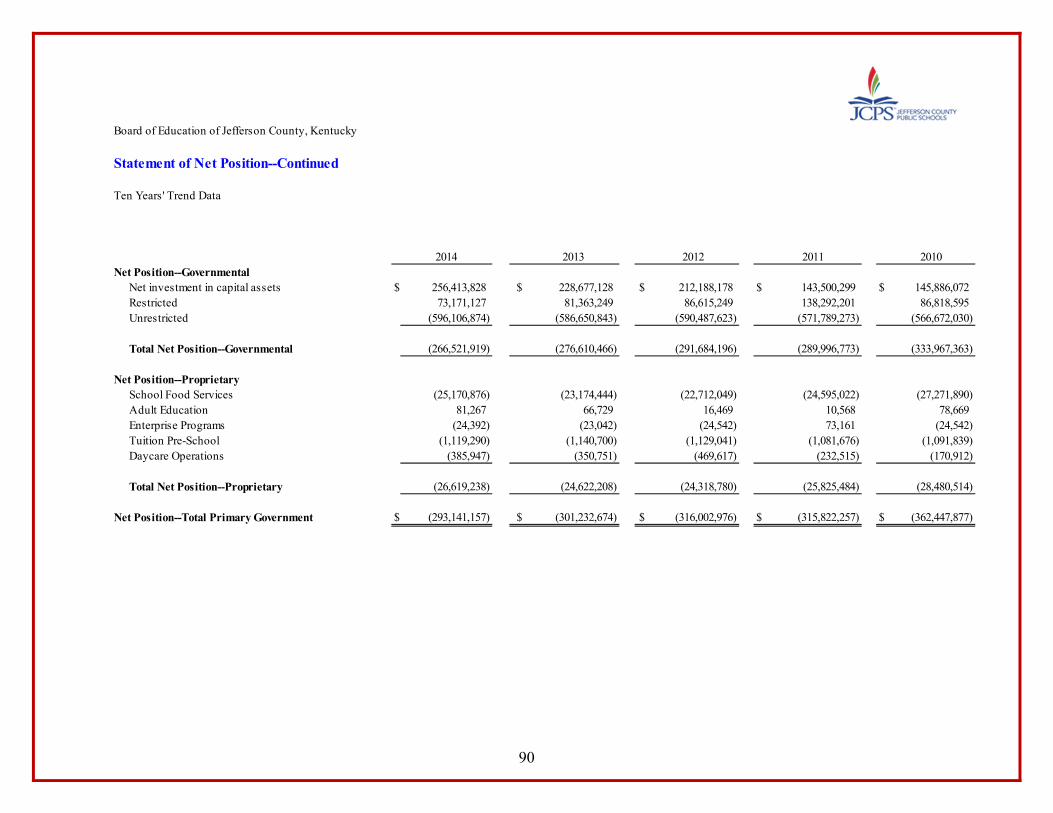
90
Board of Education of Jefferson County, Kentucky
Statement of Net Position--Continued
Ten Years' Trend Data
2014 2013 2012 2011 2010Net Position--Governmental
Net investment in capital assets $ 256,413,828 $ 228,677,128 $ 212,188,178 $ 143,500,299 $ 145,886,072 Restricted 73,171,127 81,363,249 86,615,249 138,292,201 86,818,595 Unrestricted (596,106,874) (586,650,843) (590,487,623) (571,789,273) (566,672,030)
Total Net Position--Governmental (266,521,919) (276,610,466) (291,684,196) (289,996,773) (333,967,363)
Net Position--ProprietarySchool Food Services (25,170,876) (23,174,444) (22,712,049) (24,595,022) (27,271,890) Adult Education 81,267 66,729 16,469 10,568 78,669 Enterprise Programs (24,392) (23,042) (24,542) 73,161 (24,542) Tuition Pre-School (1,119,290) (1,140,700) (1,129,041) (1,081,676) (1,091,839) Daycare Operations (385,947) (350,751) (469,617) (232,515) (170,912)
Total Net Position--Proprietary (26,619,238) (24,622,208) (24,318,780) (25,825,484) (28,480,514)
Net Position--Total Primary Government $ (293,141,157) $ (301,232,674) $ (316,002,976) $ (315,822,257) $ (362,447,877)

91
Board of Education of Jefferson County, Kentucky
Statement of Activities--Governmental Activities
Ten Years' Trend Data
2019 2018 2017 2016 2015Governmental activities
Instruction $ 864,509,475 $ 848,894,722 $ 781,439,409 $ 742,294,075 $ 729,319,975 Student support services 69,122,283 66,627,124 63,459,349 58,812,027 60,064,328 Instructional staff
support services 184,473,830 191,939,436 241,610,652 187,114,423 133,254,466 District administrative
support services 9,417,079 8,792,408 8,409,278 7,872,803 7,711,286 School administrative
support services 127,163,050 108,309,775 107,624,194 99,473,707 94,277,648 Business support services 65,847,780 70,521,907 90,097,373 81,828,482 33,236,652 Community services 118,239,225 26,377,760 33,835,506 25,466,326 16,012,870 Transportation 124,412,708 158,063,796 131,587,727 89,762,735 87,973,527 Plant operations and
maintenance 28,399,457 118,322,852 109,198,091 110,347,315 108,222,195 Other instructional
support services 64,987 60,065 32,859 31,660 34,945 Other Miscellaneous 539,714 21,617 282,916 349,122 466,078 Interest expense 16,106,729 17,204,330 16,139,220 16,116,139 16,244,178
Total governmental activities 1,608,296,317 1,615,135,792 1,583,716,574 1,419,468,814 1,286,818,148
Program RevenuesTuition 508,252 479,270 393,452 647,118 586,509 Operating grants 83,432,587 103,181,009 105,014,680 105,081,380 99,577,458 Facility grants 10,982,285 10,808,651 9,709,125 9,449,764 8,171,637
Total program revenues 94,923,124 114,468,930 115,117,257 115,178,262 108,335,604
Net Expense $ (1,513,373,193) $ (1,500,666,862) $ (1,468,599,317) $ (1,304,290,552) $ (1,178,482,544)
Continued

92
Board of Education of Jefferson County, Kentucky
Statement of Activities--Governmental Activities--Continued
Ten Years' Trend Data
2014 2013 2012 2011 2010Governmental activities
Instruction $ 633,177,394 $ 625,366,756 $ 623,418,868 $ 601,363,634 $ 586,940,824 Student support services 50,729,048 51,229,772 54,160,536 52,377,988 51,213,194 Instructional staff
support services 118,955,171 126,848,770 116,883,482 107,964,725 97,416,936 District administrative
support services 6,972,822 6,527,172 6,710,803 7,442,377 6,712,202 School administrative
support services 84,150,967 86,610,539 83,704,696 78,484,265 76,618,966 Business support services 38,844,491 43,593,985 41,172,767 35,599,686 37,261,343 Community services 9,134,416 11,083,387 8,791,352 9,727,125 9,332,818 Transportation 84,374,237 85,671,454 84,517,760 77,970,038 69,694,236 Plant operations and
maintenance 103,975,188 105,742,034 108,900,724 101,928,275 94,416,023 Other instructional
support services 10,000 54,928 334,291 272,702 252,475 OtherMiscellaneous 3,572,370 3,785,214 199,367 4,315,433 Interest expense 14,825,786 15,146,527 16,778,960 15,314,561 16,644,665
Total governmental activities 1,148,721,890 1,161,660,538 1,145,573,606 1,088,445,376 1,050,819,115
Program RevenuesTuition 902,489 1,100,286 1,738,713 1,197,658 952,947 Operating grants 104,010,029 130,277,504 150,396,249 164,772,564 145,154,703 Facility grants 7,638,789 7,908,035 6,999,453 7,216,749 9,804,218
Total program revenues 112,551,307 139,285,825 159,134,415 173,186,971 155,911,868
Net Expense $ (1,036,170,583) $ (1,022,374,713) $ (986,439,191) $ (915,258,405) $ (894,907,247)
Continued

93
Board of Education of Jefferson County, Kentucky
Statement of Activities--Governmental Activities--Continued
Ten Years' Trend Data
2019 2018 2017 2016 2015
Net Expense $ (1,513,373,193) $ (1,500,666,862) $ (1,468,599,317) $ (1,304,290,552) $ (1,178,482,544)
General revenuesTaxes
Property taxes 480,070,360 456,911,397 432,706,453 416,365,932 397,722,644 Occupational taxes 165,754,818 162,374,610 156,387,646 151,821,629 139,825,242 Other taxes 56,671,549 53,658,834 51,729,620 47,796,163 49,482,553
State sourcesSEEK program 256,564,394 256,709,740 269,121,859 274,943,838 277,043,057 Other state revenues 455,839,757 512,980,545 583,777,579 383,488,212 311,578,993
Interest and investment earnings 7,473,913 3,284,271 2,347,241 1,677,255 1,389,755
Miscellaneous 21,100,757 13,409,398 19,899,924 15,948,120 7,123,591
Total general revenues 1,443,475,548 1,459,328,795 1,515,970,322 1,292,041,149 1,184,165,835
Change in net position (72,965,481) (41,338,067) 44,271,519 (15,348,719) 5,683,291
Net position, beginning of year (273,253,895) (231,915,828) (276,187,347) (260,838,628) (266,521,919)
Net position, end of year $ (346,219,376) $ (273,253,895) $ (231,915,828) $ (276,187,347) $ (260,838,628)
Continued

94
Board of Education of Jefferson County, Kentucky
Statement of Activities--Governmental Activities--Continued
Ten Years' Trend Data
2014 2013 2012 2011 2010
Net Expense $ (1,036,170,583) $ (1,022,374,713) $ (986,439,191) $ (915,258,405) $ (894,907,247)
General revenuesTaxes
Property taxes 388,628,855 380,134,468 365,737,213 358,237,321 343,812,796 Occupational taxes 132,569,312 128,882,355 120,452,400 116,762,420 110,682,462 Other taxes 46,500,119 54,640,894 34,973,193 47,887,915 43,319,554
State sourcesSEEK program 270,658,773 272,230,951 273,991,724 252,901,298 241,750,526 Other state revenues 196,206,023 193,512,525 183,731,465 180,801,232 175,984,586
Interest and investment earnings 1,663,952 978,205 1,914,029 1,557,548 2,427,240
Miscellaneous 10,032,096 7,069,045 3,951,744 1,081,261 5,091,118
Total general revenues 1,046,259,130 1,037,448,443 984,751,768 959,228,995 923,068,282
Change in net position 10,088,547 15,073,730 (1,687,423) 43,970,590 28,161,035
Net position, beginning of year (276,610,466) (291,684,196) (289,996,773) (333,967,363) (362,128,398)
Net position, end of year $ (266,521,919) $ (276,610,466) $ (291,684,196) $ (289,996,773) $ (333,967,363)

95
Board of Education of Jefferson County, Kentucky
Statement of Activities--Business-Type Activities
Ten Years' Trend Data
2019 2018 2017 2016 2015Business-type activities
School food services $ 72,200,866 $ 76,915,589 $ 90,450,953 $ 68,262,191 $ 62,724,047 Adult education 171,152 168,158 193,589 260,184 568,257 Enterprise programs 141,308 157,129 142,516 156,576 97,329 Tuition-based pre-school 707,730 1,097,840 1,317,912 885,771 785,927 Day care operations (435,894) 237,015 652,491 428,715 480,892
Total business-type activities 72,785,162 78,575,731 92,757,461 69,993,437 64,656,452
Program RevenuesLunchroom sales 3,023,797 3,004,729 3,685,798 4,031,184 5,929,215 Tuition and fees 990,066 1,167,663 1,250,197 1,130,336 1,191,051 Grants 63,395,302 64,335,594 62,744,604 61,296,869 53,716,102
Total program revenues 67,409,165 68,507,986 67,680,599 66,458,389 60,836,368
Net Expense (5,375,997) (10,067,745) (25,076,862) (3,535,048) (3,820,084)
General revenuesInterest 175,970 104,007 66,817 28,898 15,502 Transfers In 3,067,836 3,054,027 3,099,486 3,099,316 3,116,640 Miscellaneous
Total general revenues 3,243,806 3,158,034 3,166,303 3,128,214 3,132,142
Change in net assets (2,132,191) (6,909,711) (21,910,559) (406,834) (687,942)
Net position, beginning of year (55,506,170) (48,596,459) (26,685,900) (26,279,066) (25,591,124)
Net position, end of year $ (57,638,361) $ (55,506,170) $ (48,596,459) $ (26,685,900) $ (26,279,066)
Continued

96
Board of Education of Jefferson County, Kentucky
Statement of Activities--Business-Type Activities--Continued
Ten Years' Trend Data
2014 2013 2012 2011 2010Business-type activities
School food services $ 57,940,891 $ 57,814,952 $ 53,687,809 $ 48,743,018 $ 46,664,227 Enterprise programs 479,264 457,769 652,770 886,965 818,928 Adult education 97,470 91,921 705,302 227,840 Tuition-based pre-school 721,285 898,025 1,027,844 1,076,500 1,747,773 Day care operations 712,447 703,320 1,314,653 1,354,524 985,099
Total business-type activities 59,951,357 59,965,987 57,388,378 52,288,847 50,216,027
Program RevenuesLunchroom sales 8,115,697 9,547,373 10,188,864 10,689,363 11,072,509 Tuition and fees 1,184,280 1,748,815 2,666,252 2,948,205 3,141,576 Grants 45,615,744 45,365,186 46,004,126 41,276,054 40,179,634
Total program revenues 54,915,721 56,661,374 58,859,242 54,913,622 54,393,719
Net Expense (5,035,636) (3,304,613) 1,470,864 2,624,775 4,177,692
General revenuesInterest 19,302 21,294 35,840 30,255 22,078 Transfers In 3,019,304 2,979,891 Miscellaneous (52,221)
Total general revenues 3,038,606 3,001,185 35,840 30,255 (30,143)
Change in net position (1,997,030) (303,428) 1,506,704 2,655,030 4,147,549
Net position, beginning of year (23,594,094) (23,290,666) (24,797,370) (27,452,400) (31,599,949)
Net position, end of year $ (25,591,124) $ (23,594,094) $ (23,290,666) $ (24,797,370) $ (27,452,400)

97
Board of Education of Jefferson County, Kentucky
Statement of Activities--Total Primary Government
Ten Years' Trend Data
2019 2018 2017 2016 2015Primary government activities
Instruction $ 864,509,475 $ 848,894,722 $ 781,439,409 $ 742,294,075 $ 729,319,975 Student support services 69,122,283 66,627,124 63,459,349 58,812,027 60,064,328 Instructional staff
support services 184,473,830 191,939,436 241,610,652 187,114,423 133,254,466 District administrative
support services 9,417,079 8,792,408 8,409,278 7,872,803 7,711,286 School administrative
support services 127,163,050 108,309,775 107,624,194 99,473,707 94,277,648 Business support services 65,847,780 70,521,907 89,888,820 81,828,482 33,236,652 Community services 28,399,457 26,377,760 33,835,506 25,466,326 16,012,870 Transportation 124,412,708 158,063,796 131,587,727 89,762,735 87,973,527 Plant operations and
maintenance 118,239,225 118,322,852 109,198,091 110,347,315 108,222,195 Other 604,701 81,682 315,775 380,782 501,023 School Food services 72,200,866 76,915,589 90,450,953 68,262,191 62,724,047 Adult education 171,152 168,158 193,589 260,184 568,257 Enterprise programs 141,308 157,129 142,516 156,576 97,329 Tuition-based pre-school 707,730 1,097,840 1,317,912 885,771 785,927 Day care operations (435,894) 237,015 652,491 428,715 480,892 Interest expense 16,106,729 17,204,330 16,139,220 16,116,139 16,244,178
Total primary activities 1,681,081,479 1,693,711,523 1,676,265,482 1,489,462,251 1,351,474,600
Program revenuesLunchroom sales 3,023,797 3,004,729 3,685,798 4,031,184 5,929,215 Tuition and fees 1,498,318 1,646,933 1,643,649 1,777,454 1,777,560 Grants 157,810,174 178,325,254 177,468,409 175,828,013 161,465,197
Total program revenues 162,332,289 182,976,916 182,797,856 181,636,651 169,171,972
Net Expense $ (1,518,749,190) $ (1,510,734,607) $ (1,493,467,626) $ (1,307,825,600) $ (1,182,302,628)
Continued

98
Board of Education of Jefferson County, Kentucky
Statement of Activities--Total Primary Government--Continued
Ten Years' Trend Data
2014 2013 2012 2011 2010Primary government activities
Instruction $ 633,177,394 $ 625,366,756 $ 623,418,868 $ 601,363,634 $ 586,940,824 Student support services 50,729,048 51,229,772 54,160,536 52,377,988 51,213,194 Instructional staff
support services 118,955,171 126,848,770 116,883,482 107,964,725 97,416,936 District administrative
support services 6,972,822 6,527,172 6,710,803 7,442,377 6,712,202 School administrative
support services 84,150,967 86,610,539 83,704,696 78,484,265 76,618,966 Business support services 38,844,491 43,593,985 41,172,767 35,599,686 37,261,343 Community services 9,134,416 11,083,387 8,791,352 9,727,125 9,332,818 Transportation 84,374,237 85,671,454 84,517,760 77,970,038 69,694,236 Plant operations and
maintenance 103,975,188 105,742,034 108,900,724 101,928,275 94,416,023 Other 3,582,370 3,840,142 533,658 272,702 4,567,908 School Food services 54,921,587 54,921,587 53,687,809 48,743,018 46,664,227 Adult education 479,264 457,769 652,770 886,965 Enterprise programs 97,470 91,921 705,302 227,840 818,928 Tuition-based pre-school 721,285 898,025 1,027,844 1,076,500 1,747,773 Day care operations 712,447 703,320 1,314,653 1,354,524 985,099 Interest expense 14,825,786 15,146,527 16,778,960 15,314,561 16,644,665
Total primary activities 1,205,653,943 1,218,733,160 1,202,961,984 1,140,734,223 1,101,035,142
Program revenuesLunchroom sales 8,115,697 9,547,373 10,188,864 10,689,363 11,072,509 Tuition and fees 2,086,769 2,849,101 4,404,965 4,145,863 4,094,523 Grants 157,264,562 183,550,725 203,399,828 213,265,367 195,138,555
Total program revenues 167,467,028 195,947,199 217,993,657 228,100,593 210,305,587
Net Expense $ (1,038,186,915) $ (1,022,785,961) $ (984,968,327) $ (912,633,630) $ (890,729,555)
Continued 98

99
Board of Education of Jefferson County, Kentucky
Statement of Activities--Total Primary Government--Continued
Ten Years' Trend Data
2019 2018 2017 2016 2015
Net Expense $ (1,518,749,190) $ (1,510,734,607) $ (1,493,676,179) $ (1,307,825,600) $ (1,182,302,628)
General revenuesTaxes
Property taxes 480,070,360 456,911,397 432,706,453 416,365,932 397,722,644 Occupational taxes 165,754,818 162,374,610 156,387,646 151,821,629 139,825,242 Other taxes 56,671,549 53,658,834 51,729,620 47,796,163 49,482,553
State sourcesSEEK program 256,564,394 256,709,740 269,121,859 274,943,838 277,043,057 Other state revenues 455,839,757 512,980,545 583,777,579 383,488,212 311,578,993
Interest and investment earnings 7,649,883 3,388,278 2,414,058 1,706,153 1,405,257
Miscellaneous 21,100,757 16,463,425 19,899,924 15,948,120 10,240,231
Total general revenues 1,443,651,518 1,462,486,829 1,516,037,139 1,292,070,047 1,187,297,977
Change in net position (75,097,672) (48,247,778) 22,360,960 (15,755,553) 4,995,349
Net position, beginning of year (328,760,065) (280,512,287) (302,873,247) (287,117,694) (292,113,043)
Net position, end of year $ (403,857,737) $ (328,760,065) $ (280,512,287) $ (302,873,247) $ (287,117,694)
Continued

100
Board of Education of Jefferson County, Kentucky
Statement of Activities--Total Primary Government--Continued
Ten Years' Trend Data
2014 2013 2012 2011 2010
Net Expense $ (1,038,186,915) $ (1,022,699,435) $ (984,968,327) $ (912,633,630) $ (890,729,555)
General revenuesTaxes
Property taxes 388,628,855 380,134,468 365,737,213 358,237,321 343,812,796 Occupational taxes 132,569,312 128,882,355 120,452,400 116,762,420 110,682,462 Other taxes 46,500,119 54,640,894 34,973,193 47,887,915 43,319,554
State sourcesSEEK program 270,658,773 272,230,951 273,991,724 252,901,298 241,750,526 Other state revenues 196,206,023 193,512,525 183,731,465 180,801,232 175,984,588
Interest 1,683,254 1,685,246 1,949,869 1,587,803 2,449,318 Miscellaneous 10,032,096 7,069,045 3,951,744 1,081,261 5,038,895
Total general revenues 1,046,278,432 1,037,469,737 984,787,608 959,259,250 923,038,139
Change in net position 8,091,517 14,770,302 (180,719) 46,625,620 32,308,584
Net position, beginning of year (300,204,560) (314,974,862) (314,794,143) (361,419,763) (393,728,347)
Net position, end of year $ (292,113,043) $ (300,204,560) $ (314,974,862) $ (314,794,143) $ (361,419,763)

101
Board of Education of Jefferson County, Kentucky
Balance Sheet--Governmental Activities
Ten Years' Trend Data2019 2018 2017 2016 2015
AssetsCash and investments $ 321,970,305 $ 303,166,679 $ 357,655,642 $ 278,554,703 $ 270,761,020
41,476,385 35,137,953 33,242,664 73,609,928 37,711,654 Prepaid expenditures 2,423,932 3,202,317 3,048,750 3,149,580 4,203,103 Inventories 3,036,668 2,910,278 2,933,918 3,175,468 3,704,679 Due from other funds 120,302,539 132,618,765 134,046,497 127,344,686 129,238,358
Total Assets $ 489,209,829 $ 477,035,992 $ 530,927,471 $ 485,834,365 $ 445,618,814
Liabilities$ 136,135,379 $ 138,405,815 $ 134,474,017 $ 114,282,923 $ 104,580,712
Due to other funds 107,049,722 127,964,466 129,600,827 123,038,113 124,267,169
Total Liabilities 243,185,101 266,370,281 264,074,844 237,321,036 228,847,881
Fund BalancesNonspendable, General Fund 5,460,600 6,113,779 5,982,668 6,325,049 7,907,782 Restricted
Capital Projects Fund 97,624,465 46,860,175 97,632,001 92,548,558 86,087,451 Special Revenue Funds 16,609,534 22,258,052 15,404,029 22,989,198 11,475,601
Assigned, General Fund 16,244,256 15,843,169 17,338,950 18,887,348 17,456,000 Committed, General Fund 36,000,000 36,000,000 36,000,000 36,000,000 36,000,000 Unassigned, General Fund 74,085,873 83,590,536 94,494,979 71,763,176 57,844,099
Total Fund Balances 246,024,728 210,665,711 266,852,627 248,513,329 216,770,933
Total Liabilities and Fund Balances $ 489,209,829 $ 477,035,992 $ 530,927,471 $ 485,834,365 $ 445,618,814
Continued
Accounts and grants receivable
Accrued liabilities
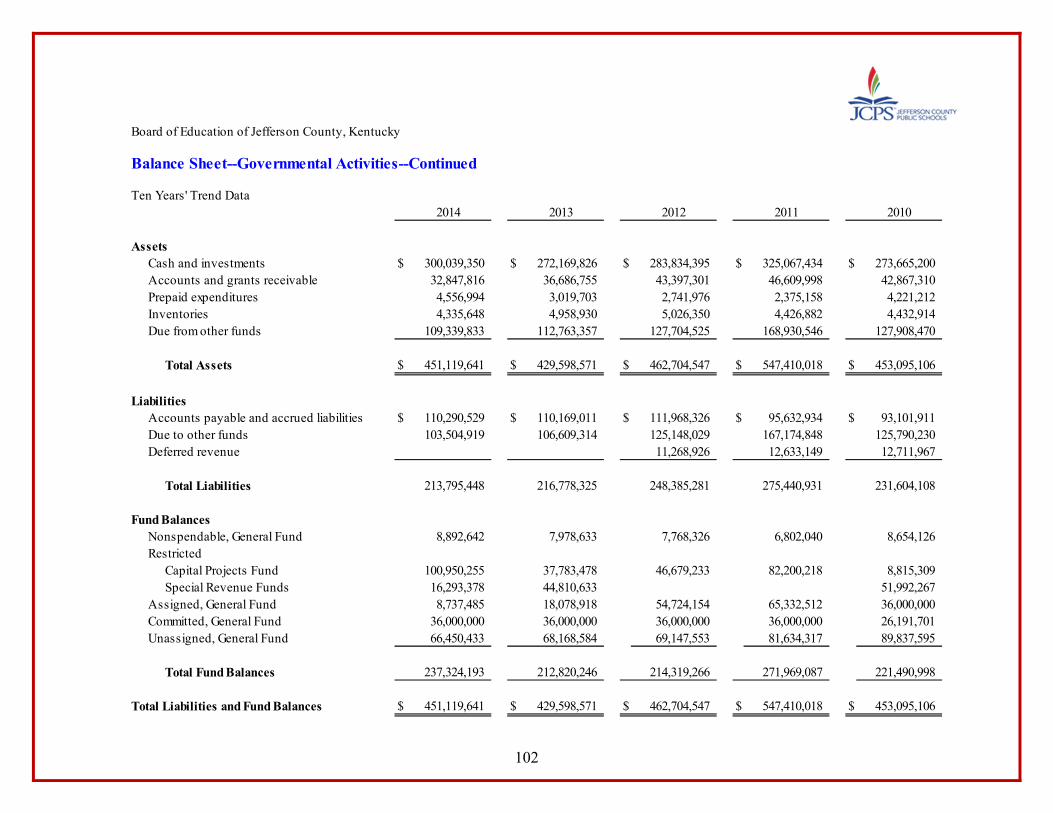
102
Board of Education of Jefferson County, Kentucky
Balance Sheet--Governmental Activities--Continued
Ten Years' Trend Data2014 2013 2012 2011 2010
AssetsCash and investments $ 300,039,350 $ 272,169,826 $ 283,834,395 $ 325,067,434 $ 273,665,200
32,847,816 36,686,755 43,397,301 46,609,998 42,867,310 Prepaid expenditures 4,556,994 3,019,703 2,741,976 2,375,158 4,221,212 Inventories 4,335,648 4,958,930 5,026,350 4,426,882 4,432,914 Due from other funds 109,339,833 112,763,357 127,704,525 168,930,546 127,908,470
Total Assets $ 451,119,641 $ 429,598,571 $ 462,704,547 $ 547,410,018 $ 453,095,106
Liabilities$ 110,290,529 $ 110,169,011 $ 111,968,326 $ 95,632,934 $ 93,101,911
Due to other funds 103,504,919 106,609,314 125,148,029 167,174,848 125,790,230 Deferred revenue 11,268,926 12,633,149 12,711,967
Total Liabilities 213,795,448 216,778,325 248,385,281 275,440,931 231,604,108
Fund BalancesNonspendable, General Fund 8,892,642 7,978,633 7,768,326 6,802,040 8,654,126 Restricted
Capital Projects Fund 100,950,255 37,783,478 46,679,233 82,200,218 8,815,309 Special Revenue Funds 16,293,378 44,810,633 51,992,267
Assigned, General Fund 8,737,485 18,078,918 54,724,154 65,332,512 36,000,000 Committed, General Fund 36,000,000 36,000,000 36,000,000 36,000,000 26,191,701 Unassigned, General Fund 66,450,433 68,168,584 69,147,553 81,634,317 89,837,595
Total Fund Balances 237,324,193 212,820,246 214,319,266 271,969,087 221,490,998
Total Liabilities and Fund Balances $ 451,119,641 $ 429,598,571 $ 462,704,547 $ 547,410,018 $ 453,095,106
Accounts payable and accrued liabilities
Accounts and grants receivable

103
Board of Education of Jefferson County, Kentucky
Statement of Revenues, Expenditures and Changes in Fund Balances--Governmental Activities
Ten Years' Trend Data
2019 2018 2017 2016 2015
RevenuesLocal sources
Property taxes $ 480,070,360 $ 456,911,397 $ 432,706,453 $ 416,365,932 $ 397,722,644 Occupational taxes 165,754,818 162,374,610 156,387,646 151,821,629 139,825,242 Other taxes 56,671,549 53,658,834 51,729,620 47,796,163 49,482,553 Grants from local agencies and donors 4,216,634 12,003,218 10,059,989 9,339,816 8,435,955
State sourcesSEEK program 256,564,394 256,709,740 269,121,859 274,943,838 277,043,057 Other state resources 346,822,857 344,927,246 240,938,705 237,803,654 229,841,535
Grants 79,215,953 91,177,791 94,954,691 95,633,844 91,141,503 Interest 7,473,913 3,284,271 2,347,241 1,677,255 1,389,755 Other sources 18,036,912 19,512,719 16,260,224 16,611,172 11,654,931
Total Revenues 1,414,827,390 1,400,559,826 1,274,506,428 1,251,993,303 1,206,537,175
ExpendituresInstruction 763,641,366 754,517,489 659,163,029 651,704,411 626,202,625 Student support services 68,161,539 66,023,129 59,507,080 56,468,739 53,898,592 Instructional staff support services 140,842,072 155,224,231 137,792,548 133,813,433 136,595,787 District administrative support services 6,814,225 5,881,645 5,205,114 4,621,076 4,074,121 School administrative support services 115,027,172 98,562,871 87,953,654 86,072,917 86,706,811 Business support services 45,822,235 49,830,447 43,508,006 41,900,407 40,124,691 Community Services 11,083,836 10,176,026 9,673,052 9,705,648 9,785,799 Transportation 89,192,089 89,313,077 80,102,175 76,843,087 80,815,562
Continued

104
Board of Education of Jefferson County, Kentucky
Statement of Revenues, Expenditures and Changes in Fund Balances--Governmental Activities--Continued
Ten Years' Trend Data
2019 2018 2017 2016 2015
Expenditures--ContinuedPlant operations and maintenance $ 117,438,367 $ 118,046,299 $ 108,680,821 $ 109,856,870 $ 107,834,439 Other instructional support services 64,987 60,065 32,859 31,660 27,404 Building renovations 54,170,060 52,752,999 49,013,775 54,066,235 47,130,013 Other 2,785,186 2,606,701 2,771,607 3,276,200 3,475,119 Debt service
Principal 35,151,226 34,001,290 31,116,591 30,255,122 29,914,485 Interest 16,569,151 16,696,446 16,323,732 16,461,930 16,034,197
Total Expenditures 1,466,763,511 1,453,692,715 1,290,844,043 1,275,077,735 1,242,619,645
Other Financing Sources (Uses)Bond proceeds net of discounts and refunding issues 90,362,974 37,776,399 57,926,144 18,645,850 Transfers in 56,942,430 43,815,290 55,738,987 41,506,086 53,480,763 Transfers out (60,010,266) (46,869,317) (58,838,473) (44,605,402) (56,597,403)
Total Other Financing Sources (Uses) 87,295,138 (3,054,027) 34,676,913 54,826,828 15,529,210
Net Change in Fund Balances 35,359,017 (56,186,916) 18,339,298 31,742,396 (20,553,260)
Fund Balances, Beginning of Year 210,665,711 266,852,627 248,513,329 216,770,933 237,324,193
Fund Balances, End of Year $ 246,024,728 $ 210,665,711 $ 266,852,627 $ 248,513,329 $ 216,770,933
Ratio of total debt service expenditures to total noncapital expenditures 0.038 0.040 0.039 0.041 0.040
Continued

105
Board of Education of Jefferson County, Kentucky
Statement of Revenues, Expenditures and Changes in Fund Balances--Governmental Activities--Continued
Ten Years' Trend Data
2014 2013 2012 2011 2010
RevenuesLocal sources
Property taxes $ 388,628,855 $ 380,134,468 $ 365,737,213 $ 358,237,321 $ 343,812,796 Occupational taxes 132,569,312 128,882,355 120,452,400 116,762,420 110,682,462 Other taxes 46,500,119 54,640,894 34,973,193 47,887,915 43,319,554 Grants from local agencies and donors 9,881,427 11,197,615 10,762,323 9,354,941 11,012,824
State sourcesSEEK program 270,658,773 272,230,951 273,991,724 252,901,298 241,750,526 Other state resources 203,844,812 201,420,560 190,730,918 188,017,981 185,788,804
Grants 94,128,602 119,079,889 139,633,926 155,417,623 134,141,879 Interest 1,663,952 978,205 1,914,029 1,557,548 2,427,240 Other sources 10,814,937 11,046,052 12,903,594 10,154,529 9,564,573
Total Revenues 1,158,690,789 1,179,610,989 1,151,099,320 1,140,291,576 1,082,500,658
ExpendituresInstruction 599,752,771 588,571,941 592,126,990 576,492,674 560,927,578 Student support services 50,904,421 51,190,099 54,328,820 52,611,443 51,321,439 Instructional staff support services 125,814,940 124,783,834 122,772,326 112,615,684 99,322,822 District administrative support services 3,643,083 3,097,758 3,409,083 4,546,755 4,227,127 School administrative support services 85,727,500 85,986,396 85,432,988 79,446,246 77,604,813 Business support services 42,730,714 42,920,067 43,684,780 37,497,739 37,661,780 Community Services 9,605,723 9,747,355 9,809,151 9,483,899 9,174,771 Transportation 85,953,279 79,557,078 87,314,648 77,350,835 68,806,202
Continued

106
Board of Education of Jefferson County, Kentucky
Statement of Revenues, Expenditures and Changes in Fund Balances--Governmental Activities--Continued
Ten Years' Trend Data
2014 2013 2012 2011 2010
Expenditures--ContinuedPlant operations and maintenance $ 103,957,976 $ 105,710,395 108,826,313 101,796,786 94,181,196 Other instructional support services 10,000 54,928 335,179 272,702 275,380 Capital outlay 48,640,389 60,142,086 63,027,554 47,050,306 39,087,629 Other 3,358,550 3,754,979 3,899,135 4,164,745 4,373,144 Debt service
Principal 34,623,248 34,170,699 27,060,652 25,155,984 26,651,664 Interest 15,265,077 16,023,720 17,058,154 15,655,119 17,281,673
Total Expenditures 1,209,987,671 1,205,711,335 1,219,085,773 1,144,140,917 1,090,897,218
Other Financing Sources (Uses)Bond proceeds net of discounts and refunding issues 78,820,133 27,581,217 13,383,020 57,327,491 531,824 Transfers in 77,555,249 112,371,790 64,712,448 134,838,548 109,483,200 Transfers out (80,574,553) (115,351,681) (67,758,836) (137,838,609) (112,559,785)
Total Other Financing Sources (Uses) 75,800,829 24,601,326 10,336,632 54,327,430 (2,544,761)
Net Change in Fund Balances 24,503,947 (1,499,020) (57,649,821) 50,478,089 (10,941,321)
Fund Balances, Beginning of Year 212,820,246 214,319,266 271,969,087 221,490,998 232,432,319
Fund Balances, End of Year $ 237,324,193 $ 212,820,246 $ 214,319,266 $ 271,969,087 $ 221,490,998
Ratio of total debt service expenditures to total noncapital expenditures 0.044 0.044 0.042 0.040 0.043

107
Board of Education of Jefferson County, Kentucky
General Government Expenses by Function1
Ten Years' Trend Data
Instruction
Student Support Services
Instructional Staff Support
Services3
District Administrative
Support Services
School Administrative
Support Services
Business Support Services2
Community Services2 Transportation
Plant Operations and Maintenance
2019 864,509,475$ 69,122,283$ 184,473,830$ 9,417,079$ 127,163,050$ 65,847,780$ 28,399,457$ 124,412,708$ 118,239,225$ 2018 848,894,722 66,627,124 191,939,436 8,792,408 108,309,775 70,521,907 26,377,760 158,063,796 118,322,852 2017 781,439,409 63,459,349 241,610,652 8,409,278 107,624,194 89,888,820 33,835,506 131,587,727 109,198,091 2016 742,294,075 58,812,027 187,114,423 7,872,803 99,473,707 81,828,482 25,466,326 89,762,735 110,347,315 2015 729,319,975 60,064,328 133,254,466 7,711,286 94,277,648 33,236,652 16,012,870 87,973,527 108,222,195 2014 633,177,394 50,729,048 118,955,171 6,972,822 84,150,967 38,844,491 9,134,416 84,374,237 103,975,188 2013 625,366,756 51,229,772 126,848,770 6,527,172 86,610,539 43,593,985 11,083,387 85,671,454 105,742,034 2012 623,418,868 54,160,536 116,883,482 6,710,803 83,704,696 41,172,767 8,791,352 84,517,760 108,900,724 2011 601,363,634 52,377,988 107,964,725 7,442,377 78,484,265 35,599,686 9,727,125 77,970,038 101,928,275 2010 586,940,824$ 51,213,194$ 97,416,936$ 6,712,202$ 76,618,966$ 37,261,343$ 9,332,818$ 69,694,236$ 94,416,023$
Other Other Interest School Food Adult Education2 Enterprise Tuition-based Daycare Total
2019 604,701$ 16,106,729$ 72,200,866$ 171,152$ 141,308$ 707,730$ (435,894)$ 1,681,081,479$ 2018 81,682 17,204,330 76,915,589 168,158 157,129 1,097,840 237,015 1,693,711,523 2017 315,775 16,139,220 90,450,953 193,589 142,516 1,317,912 652,491 1,676,265,482 2016 380,782 16,116,139 68,262,191 260,184 156,576 885,771 428,715 1,489,462,251 2015 501,023 16,224,178 62,724,047 568,257 97,329 785,927 480,892 1,351,474,600 2014 10,000$ 553,066 14,825,786 57,940,891 479,264 97,470 721,285 712,447 1,205,653,943 2013 3,840,142 15,146,527 54,921,587 457,769 91,921 898,025 703,320 1,218,733,160 2012 334,291 199,367 16,778,960 53,687,809 652,770 705,302 1,027,844 1,314,653 1,202,961,984 2011 272,702 15,314,561 48,743,018 886,965 227,840 1,076,500 1,354,524 1,140,734,223 2010 252,475$ 4,315,433$ 16,644,665$ 46,664,227$ 818,928$ 1,747,773$ 985,099$ 1,101,035,142$
1 General government includes all governmental and enterprise funds.2 Due to functional data reclassifications, Community Services and Adult Education expenses are now discreetly presented.
Also, Central Office Support Services were reclassified to either Business Support Services or Instructional Staff Support Services depending on the nature of the expense. Daycare Operations was segregated as a fund in 2007.

108
Board of Education of Jefferson County, Kentucky
General Government Revenues by Type1
Ten Years' Trend Data
Charges for Service
Grants & Contributions Property Taxes
Occupational Taxes Other Taxes
2019 4,522,115$ 157,810,174$ 480,070,360$ 165,754,818$ 56,671,549$ 2018 4,651,662 178,325,254 456,911,397 162,374,610 53,658,834 2017 5,329,447 177,468,409 432,706,453 156,387,646 51,729,620 2016 5,808,638 175,828,013 416,365,932 151,821,629 47,496,163 2015 7,706,775 161,465,197 397,722,644 139,825,242 49,482,553 2014 10,202,466 157,264,562 388,628,855 132,569,312 46,500,119 2013 12,396,474 183,550,725 380,134,468 128,882,355 54,640,894 2012 14,593,829 203,399,828 365,737,213 120,452,400 34,973,193 2011 14,835,226 213,265,367 358,237,321 116,762,420 47,887,915 2010 15,167,030$ 195,138,555$ 343,812,796$ 110,682,462$ 43,319,554$
SEEK State Revenues
Other State Revenues Interest Income Other Revenues Total
2019 256,564,394$ 455,839,757$ 7,649,883$ 21,100,757$ 1,605,983,807$ 2018 256,709,740 512,980,545 3,388,278 16,463,425 1,645,463,745 2017 269,121,859 583,777,579 2,414,058 19,884,479 1,698,819,550 2016 274,943,838 383,488,212 1,706,153 15,948,120 1,473,406,698 2015 277,043,057 311,578,993 1,389,755 10,240,231 1,356,454,447 2014 270,658,773 196,206,023 1,683,254 10,032,096 1,213,745,460 2013 272,230,951 193,512,525 999,499 7,069,045 1,233,416,936 2012 273,991,724 183,731,465 1,949,869 3,951,744 1,202,781,265 2011 252,901,298 180,801,232 1,587,803 1,081,261 1,187,359,843 2010 241,750,526$ 175,984,586$ 2,449,318$ 5,038,899$ 1,133,343,726$
1 General government includes all governmental and enterprise funds.

109
Board of Education of Jefferson County, Kentucky
Property Tax Rates
Ten Years' Trend Data
Real Estate1
Tangible Property1
Motor Vehicle1
Weighted Average
Tax Rates1
2019 72.5 72.5 58.5 71.52018 70.4 70.4 58.5 70.02017 70.8 71.0 58.5 69.92016 71.0 71.0 58.5 70.12015 71.0 71.0 58.5 69.22014 71.0 71.0 58.5 69.22013 70.0 70.0 58.5 69.22012 67.7 67.7 58.5 67.12011 67.6 67.6 58.5 67.02010 64.6 64.6 58.5 64.2
Real estate & personal property taxes are the District's largest revenuesource. Each year's tax rates are approved in September by vote of theelected Board of Education. Statutorily, rates may not be raised to anextent that total revenues are increased by 4% or the tax is subject toreferendum.
1 Cents per $100 assessment
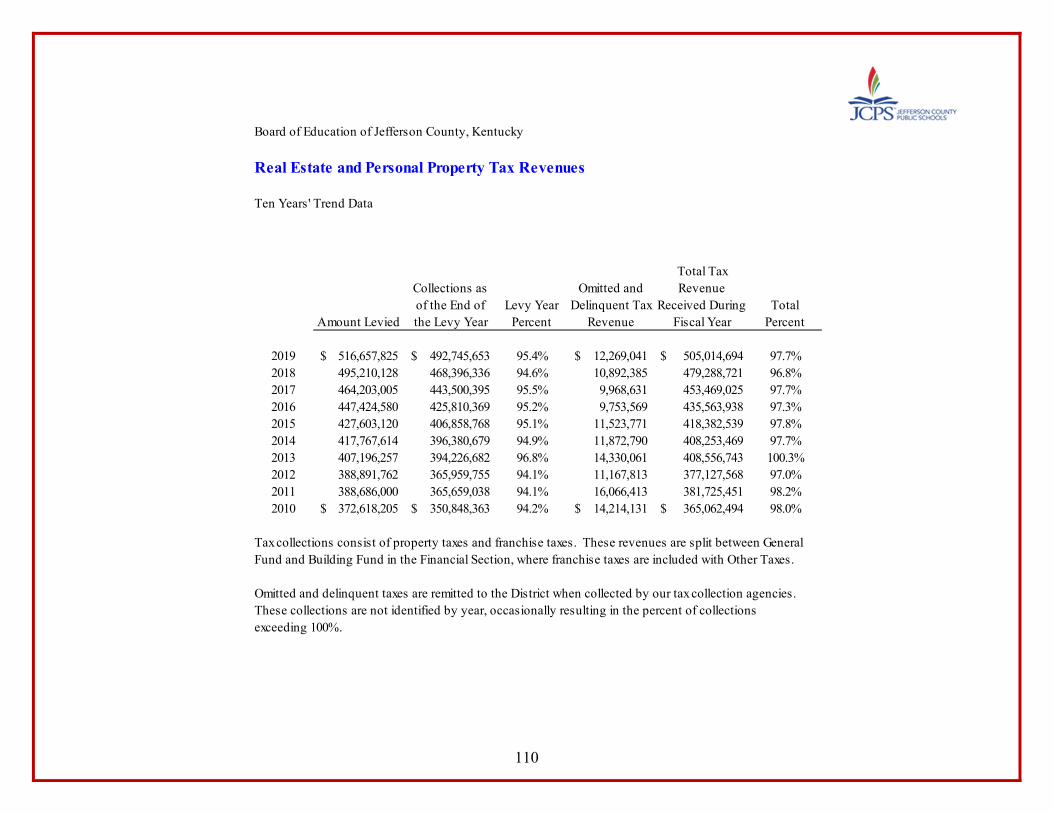
110
Board of Education of Jefferson County, Kentucky
Real Estate and Personal Property Tax Revenues
Ten Years' Trend Data
Amount Levied
Collections as of the End of the Levy Year
Levy Year Percent
Omitted and Delinquent Tax
Revenue
Total Tax Revenue
Received During Fiscal Year
Total Percent
2019 516,657,825$ 492,745,653$ 95.4% 12,269,041$ 505,014,694$ 97.7%2018 495,210,128 468,396,336 94.6% 10,892,385 479,288,721 96.8%2017 464,203,005 443,500,395 95.5% 9,968,631 453,469,025 97.7%2016 447,424,580 425,810,369 95.2% 9,753,569 435,563,938 97.3%2015 427,603,120 406,858,768 95.1% 11,523,771 418,382,539 97.8%2014 417,767,614 396,380,679 94.9% 11,872,790 408,253,469 97.7%2013 407,196,257 394,226,682 96.8% 14,330,061 408,556,743 100.3%2012 388,891,762 365,959,755 94.1% 11,167,813 377,127,568 97.0%2011 388,686,000 365,659,038 94.1% 16,066,413 381,725,451 98.2%2010 372,618,205$ 350,848,363$ 94.2% 14,214,131$ 365,062,494$ 98.0%
Tax collections consist of property taxes and franchise taxes. These revenues are split between GeneralFund and Building Fund in the Financial Section, where franchise taxes are included with Other Taxes.
Omitted and delinquent taxes are remitted to the District when collected by our tax collection agencies.These collections are not identified by year, occasionally resulting in the percent of collectionsexceeding 100%.
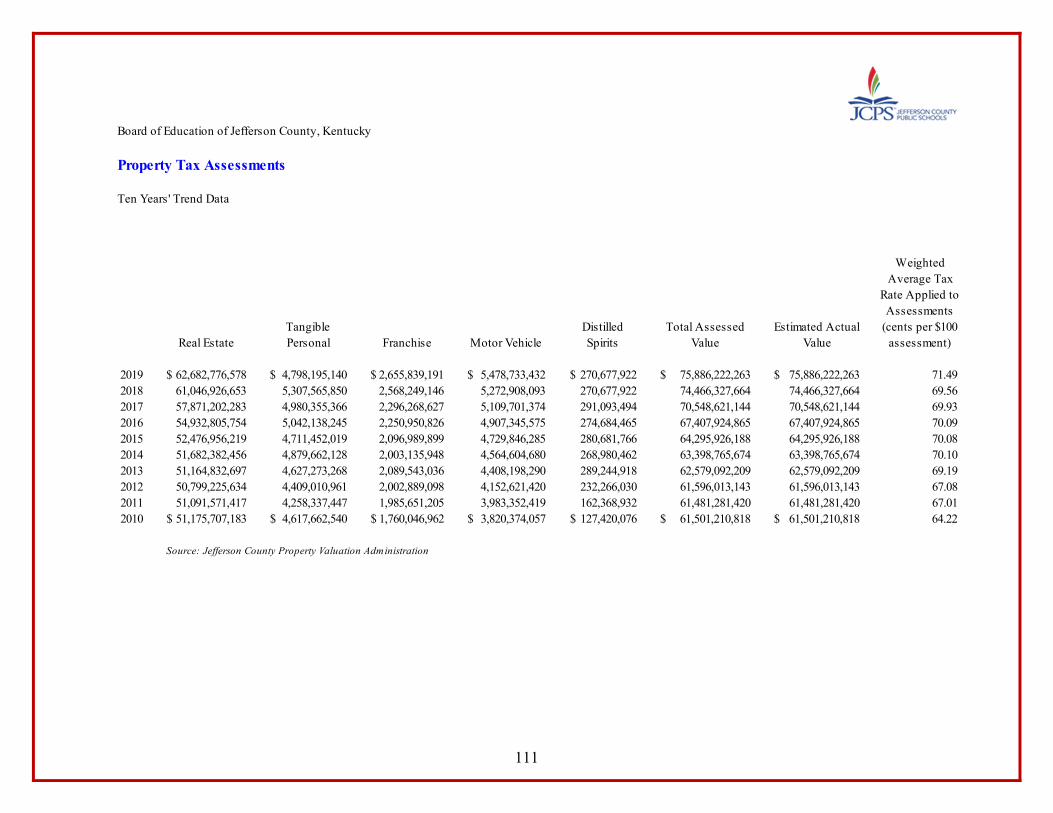
111
Board of Education of Jefferson County, Kentucky
Property Tax Assessments
Ten Years' Trend Data
Real EstateTangible Personal Franchise Motor Vehicle
Distilled Spirits
Total Assessed Value
Estimated Actual Value
Weighted Average Tax
Rate Applied to Assessments
(cents per $100 assessment)
2019 62,682,776,578$ 4,798,195,140$ 2,655,839,191$ 5,478,733,432$ 270,677,922$ 75,886,222,263$ 75,886,222,263$ 71.49 2018 61,046,926,653 5,307,565,850 2,568,249,146 5,272,908,093 270,677,922 74,466,327,664 74,466,327,664 69.56 2017 57,871,202,283 4,980,355,366 2,296,268,627 5,109,701,374 291,093,494 70,548,621,144 70,548,621,144 69.93 2016 54,932,805,754 5,042,138,245 2,250,950,826 4,907,345,575 274,684,465 67,407,924,865 67,407,924,865 70.09 2015 52,476,956,219 4,711,452,019 2,096,989,899 4,729,846,285 280,681,766 64,295,926,188 64,295,926,188 70.08 2014 51,682,382,456 4,879,662,128 2,003,135,948 4,564,604,680 268,980,462 63,398,765,674 63,398,765,674 70.10 2013 51,164,832,697 4,627,273,268 2,089,543,036 4,408,198,290 289,244,918 62,579,092,209 62,579,092,209 69.19 2012 50,799,225,634 4,409,010,961 2,002,889,098 4,152,621,420 232,266,030 61,596,013,143 61,596,013,143 67.08 2011 51,091,571,417 4,258,337,447 1,985,651,205 3,983,352,419 162,368,932 61,481,281,420 61,481,281,420 67.01 2010 51,175,707,183$ 4,617,662,540$ 1,760,046,962$ 3,820,374,057$ 127,420,076$ 61,501,210,818$ 61,501,210,818$ 64.22
Source: Jefferson County Property Valuation Administration

112
Board of Education of Jefferson County, Kentucky
Property Taxes, As Assessed
Ten Years' Trend Data
Real Estate Tangible Property Franchise Motor VehicleDistilled Spirits
Total Property Taxes as
AssessedEstimated Actual
Tax Value
2019 454,450,130$ 34,786,915$ 19,254,834$ 32,050,591$ 1,962,415$ 542,504,885$ 542,504,885$ 2018 432,212,241 37,683,718 18,234,569 30,846,512 1,921,813 520,898,853 520,898,853 2017 409,728,112 35,360,523 16,303,507 29,891,753 2,066,764 493,350,659 493,350,659 2016 390,022,921 35,799,182 15,981,751 28,707,972 1,950,260 472,462,085 472,462,085 2015 367,338,694 32,980,164 14,678,929 27,669,601 1,964,772 444,632,160 444,632,160 2014 361,776,677 34,157,635 14,021,952 26,702,937 1,882,863 438,542,064 438,542,064 2013 358,153,829 32,390,913 14,626,801 25,787,960 2,024,714 432,984,217 432,984,217 2012 343,910,758 29,849,004 13,559,559 24,292,835 1,572,441 413,184,597 413,184,597 2011 345,379,023 28,786,361 13,423,002 23,302,612 1,097,614 411,988,612 411,988,612 2010 330,595,068$ 29,830,100$ 11,369,903$ 22,349,188$ 823,134$ 394,967,394$ 394,967,394$
Source: Assessments from Jefferson County Property Valuation Administration multiplied by tax rates

113
Board of Education of Jefferson County, Kentucky
Principal Real Estate Taxpayers
For the fiscal year ended June 30, 2019
Company2018-19 School
Tax Paid
Percent of Total
Revenues 2017-18 2016-17 2015-16 2014-15 2013-14 2012-13 2011-12 2010-11 2009-10
Louisville Gas & Electric 12,246,131$ 2.5% 10,556,090$ 9,852,494$ 8,576,005$ 7,425,245$ ** 13,319,323$ ** 5,991,821$ 4,769,000$ AT&T 2,021,290 0.4% 4,040,910 1,018,524$ 1,317,004 1,379,343 ** ** 2,352,538$ 2,352,538 **Humana 1,778,260 0.4% 1,308,112 1,305,761 1,280,785 931,639 779,381$ 920,799 655,877 979,751 1,187,779 Walmart 1,468,730 0.3% ** ** ** ** 874,965 937,487 865,716 ** 714,471 United Parcel Service 1,406,678 0.3% 1,095,192 1,770,143 1,169,732 831,367 897,930 1,621,721 1,228,844 823,561 595,519 BT Property 1,396,092 0.3% 1,276,264 910,013 889,611 897,653 1,191,344 817,270 775,222 ** 590,411 Insight 1,260,698 0.3% 2,583,952 ** 1,294,204 1,270,617 ** ** 1,267,377 1,267,377 **Omni 1,087,258 0.2% ** ** ** ** ** ** ** ** **Brown-Forman 1,050,597 0.2% 828,514 754,799 ** ** ** ** ** ** **Galt House 1,018,268$ 0.2% 947,034 973,518 872,936 758,816 671,005 423,544 ** ** **
** For years marked, taxpayer was not one of the principal taxpayers to the Board.
Percent of total revenues is based on percent of total real estate and other property taxes as follows:
Property taxesOther taxes
Source: Jefferson County Sheriff
432,706,453$ 51,729,620
484,436,073$

114
Board of Education of Jefferson County, Kentucky
Overlapping Tax Rates
For Tax Year 2019
Real Estate1
Tangible Property1
Motor Vehicle1
Real Estate1
Tangible Property1
Motor Vehicle1
Jefferson County Board of Education - total direct rate of largest own source revenue (cents per $100 property assessment) 72.50 72.50 72.50Metro Louisville Government 12.35 16.60 16.60 Glenview 11.40 0.00 0.00Anchorage 36.60 36.60 36.60 Glenview Hills 11.00 0.00 0.00Audubon Park 28.20 0.00 28.20 Glenview Manor 13.45 0.00 0.00Bancroft 35.60 0.00 0.00 Goose Creek 13.70 0.00 0.00Barbourmeade 20.90 0.00 0.00 Graymoor-Devondale 20.00 0.00 0.00Beechwood Village 10.00 0.00 0.00 Green Spring 16.50 17.80 0.00Bellemeade 7.00 0.00 0.00 Heritage Creek 20.60 0.00 0.00Bellewood 19.00 0.00 0.00 Hickory Hill 24.70 0.00 0.00Blue Ridge Manor 20.00 0.00 0.00 Hills and Dales 21.50 0.00 0.00Briarwood 29.00 0.00 0.00 Hollow Creek 34.00 0.00 0.00Broeck Pointe 21.50 0.00 0.00 Houston Acres 17.70 0.00 0.00Brownsboro Farm 24.25 0.00 0.00 Hurstbourne 16.90 0.00 0.00Brownsboro Village 22.39 0.00 0.00 Hurstbourne Acres 14.00 0.00 0.00Cambridge 18.40 0.00 0.00 Indian Hills 20.00 0.00 0.00Coldstream 12.00 0.00 0.00 Jeffersontown 14.01 0.00 0.00Creekside 22.00 0.00 0.00 Kingsley 33.00 0.00 0.00Crossgate 22.50 0.00 0.00 Langdon Place 28.00 0.00 0.00Douglas Hills 13.10 0.00 0.00 Lincolnshire 22.00 0.00 0.00Druid Hills 10.20 0.00 0.00 Lyndon 11.00 0.00 0.00Fincastle 20.00 0.00 0.00 Lynnview 29.70 11.90 11.90Forest Hills 13.20 0.00 0.00 Manor Creek 30.00 0.00 0.00
1 Cents per $100 assessment
Continued

115
Board of Education of Jefferson County, Kentucky
Overlapping Tax Rates--Continued
For Tax Year 2019
Real Estate1
Tangible Property1
Motor Vehicle1
Real Estate1
Tangible Property1
Motor Vehicle1
Maryhill Estates 14.00 0.00 0.00 Saint Regis Park 11.70 0.00 0.00Meadow Vale 12.50 0.00 0.00 Seneca Gardens 21.31 0.00 0.00Meadowbrook Farm 7.30 0.00 0.00 Shively 33.90 36.30 36.30Meadowview Estates 11.30 0.00 0.00 Spring Mill 20.00 0.00 0.00Middletown 13.50 0.00 0.00 Spring Valley 17.00 0.00 0.00Mockingbird Valley 15.25 14.66 0.00 Strathmoor Manor 32.00 0.00 0.00Moorland 23.00 0.00 0.00 Strathmoor Village 24.00 0.00 0.00Murray Hill 17.80 0.00 0.00 Ten Broeck 8.88 0.00 0.00Norbourne Estates 16.80 0.00 0.00 Thornhill 12.00 0.00 0.00Nothfield 15.40 0.00 0.00 Watterson Park 8.20 6.50 7.50Norwood 18.10 0.00 0.00 Wellington 18.24 0.00 0.00Old Brownsboro Place 34.00 0.00 0.00 West Buechel 20.00 0.00 0.00Parkway Village 17.30 0.00 0.00 Westwood 14.30 0.00 0.00Plantation 29.00 0.00 0.00 Wildwood 16.10 0.00 0.00Prospect 21.25 0.00 0.00 Windy Hills 17.00 0.00 0.00Richlawn 12.50 0.00 0.00 Woodland Hills 12.00 0.00 0.00Riverwood 17.92 0.00 0.00 Woodlawn Park 16.60 0.00 0.00Rolling Fields 11.60 0.00 0.00 Worthington Hills 20.47 0.00 0.00Rolling Hills 18.51 0.00 0.00Saint Matthews 20.00 0.00 0.00
1 Cents per $100 assessment
Continued

116
Board of Education of Jefferson County, Kentucky
Overlapping Tax Rates--Continued
For Tax Year 2019
Real Estate1
Tangible Property1
Motor Vehicle1
Anchorage/Middletown Fire & EMS* 14.50 14.50 14.50Buechel Fire District 20.00 20.00 20.00Camp Taylor Fire District 10.00 10.00 10.00Eastwood Fire District 10.00 10.00 10.00Fairdale Fire District 10.00 10.00 10.00Fern Creek Fire District 10.00 10.00 10.00Harrods Creek Fire District 14.00 14.00 14.00Highview Fire District 10.00 10.00 10.00Jeffersontown/McMahan Fire District ** 15.00 15.00 15.00Lake Dreamland Fire District 10.00 10.00 10.00Louisville Downtown Management District 7.45 0.00 0.00Lynnview Garbage Fund 10.00 10.00 10.00Okolona Fire District 10.00 10.00 10.00Pleasure Ridge Park Fire District 15.00 15.00 15.00St Matthews/Lyndon Fire District *** 15.00 15.00 15.00Urban Services District/Louisville 35.38 56.60 0.00Worthington Fire District 10.00 10.00 10.00
1 Cents per $100 assessment
** : In 2018, Jeffersontown Fire District & McMahan Fire District #14 merged together to form Jeffersontown/McMahan Fire*** : In 2018, St. Mathews Fire District & Lyndon Fire District merged to form St. Mathews/Lyndon Fire
* : In 2018, Anchorage Ambulance District, Anchorage Fire District, & Middletown Fire District merged to form Anchorage/Middletown Fire & EMS

117
Board of Education of Jefferson County, Kentucky
Principal Employers by Number of Employees
December 31, 2018 and Nine Comparison YearsPercent ofJeffersonCounty's
2018 Employees 2017 2016 2015
United Parcel Service 21,233 6.1% 22,354 22,080 22,189Jefferson County Public Schools 14,476 4.0% 14,553 14,739 14,719Ford Motor Co. 12,600 3.5% 12,600 12,990 9,028Norton Healthcare Inc. 12,247 3.3% 11,944 11,389 10,739Humana Inc. 12,000 3.4% 12,500 12,500 12,900University of Louisville 6,933 1.9% 7,065 6,375 6,264Amazon.com 6,500 1.8% 6,500 6,500 6,000Louisville Metro Government 6,226 1.7% 6,192 6,095 5,584Baptist Healthcare System 6,159 1.9% 6,786 4,995 5,116GE Appliances 6,000 1.6% 6,000 6,000 6,000KentuckyOne Health Inc 6,000 1.6% 6,000 6,000 6,000The Kroger Co 3,079 0.8% 3,079 4,626 4,892Spectrum (Formerly Charter Communications) 2,400 0.7% 2,400 1,200Manna Inc. 2,300 0.7% 2,600 3,120 2,400Archdiocese of Louisville 2,252 0.7% 2,660 2,263 2,237LG&E and KU Energy LLC 2,162 0.6% 2,201 2,211 1,993ResCare Inc. 1,948 0.5% 1,948 2,435 1,312Robley Rex VA Medical Center 1,816 0.5% 1,800 1,900Bullitt County Public Schools 1,736 0.5% 1,718 1,739U.S. Postal Service 1,691 0.5% 1,896 2,401 2,546
Source: Business First magazine
Continued
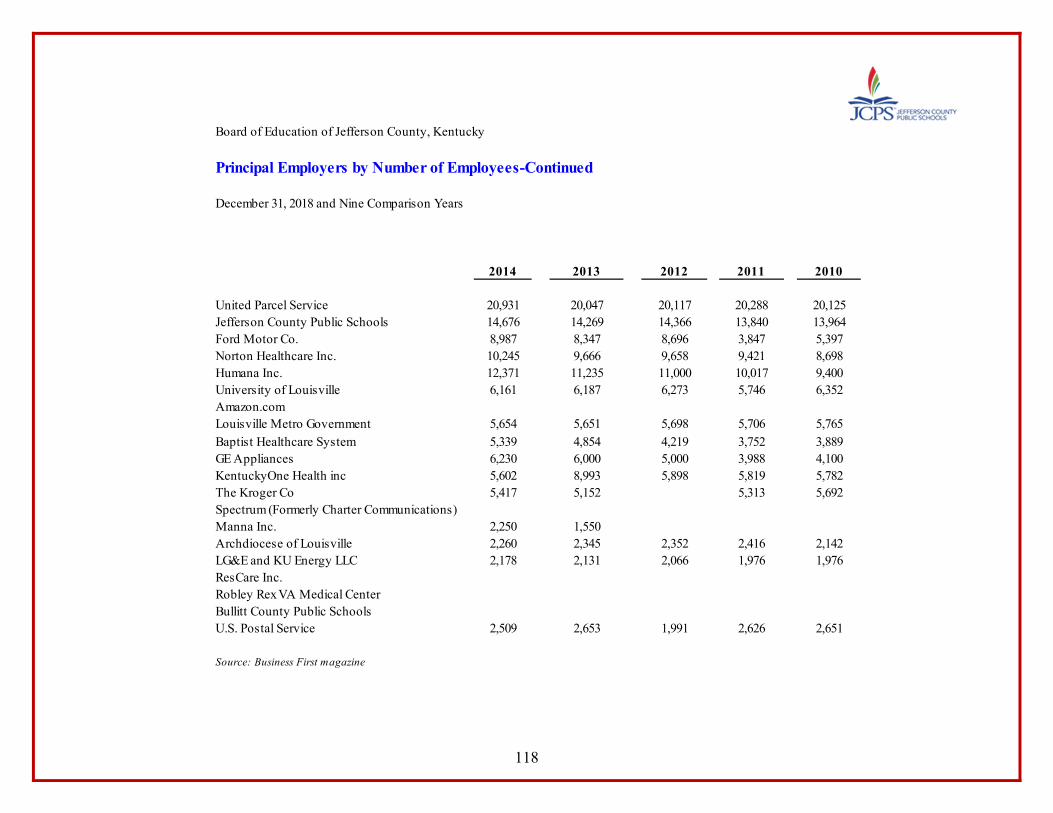
118
Board of Education of Jefferson County, Kentucky
Principal Employers by Number of Employees-Continued
December 31, 2018 and Nine Comparison Years
2014 2013 2012 2011 2010
United Parcel Service 20,931 20,047 20,117 20,288 20,125Jefferson County Public Schools 14,676 14,269 14,366 13,840 13,964Ford Motor Co. 8,987 8,347 8,696 3,847 5,397Norton Healthcare Inc. 10,245 9,666 9,658 9,421 8,698Humana Inc. 12,371 11,235 11,000 10,017 9,400University of Louisville 6,161 6,187 6,273 5,746 6,352Amazon.comLouisville Metro Government 5,654 5,651 5,698 5,706 5,765Baptist Healthcare System 5,339 4,854 4,219 3,752 3,889GE Appliances 6,230 6,000 5,000 3,988 4,100KentuckyOne Health inc 5,602 8,993 5,898 5,819 5,782The Kroger Co 5,417 5,152 5,313 5,692Spectrum (Formerly Charter Communications)Manna Inc. 2,250 1,550Archdiocese of Louisville 2,260 2,345 2,352 2,416 2,142LG&E and KU Energy LLC 2,178 2,131 2,066 1,976 1,976ResCare Inc.Robley Rex VA Medical CenterBullitt County Public SchoolsU.S. Postal Service 2,509 2,653 1,991 2,626 2,651
Source: Business First magazine
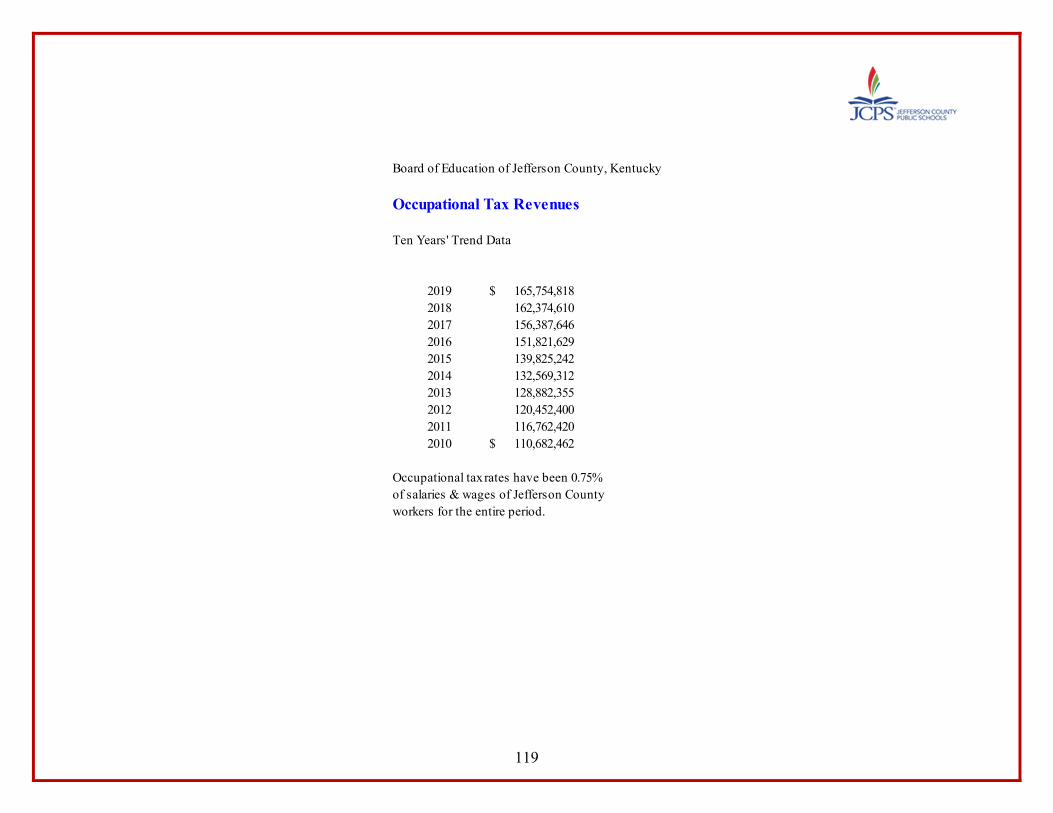
119
Board of Education of Jefferson County, Kentucky
Occupational Tax Revenues
Ten Years' Trend Data
2019 $ 165,754,8182018 162,374,6102017 156,387,6462016 151,821,6292015 139,825,2422014 132,569,3122013 128,882,3552012 120,452,4002011 116,762,4202010 $ 110,682,462
Occupational tax rates have been 0.75% of salaries & wages of Jefferson Countyworkers for the entire period.

120
Board of Education of Jefferson County, Kentucky
Total Bonded Debt by Responsible Party
Year Ending Year EndingJune 30, 2019 June 30, 2019
2020 $ 22,747,011 $ 12,399,176 $ 35,146,187 2020 $ 91,523 $ 11,472 $ 102,9952021 23,419,061 11,728,257 35,147,318 2021 93,581 9,413 102,9942022 26,081,175 10,920,971 37,002,146 2022 95,734 7,260 102,9942023 27,301,294 9,964,431 37,265,725 2023 97,935 5,058 102,9932024 23,272,918 9,165,205 32,438,123 2024 100,385 2,610 102,995
2025-2029 118,379,617 56,690,243 175,069,860 2025-2029 - 02030-2034 101,091,623 12,895,819 113,987,442 2030-2034 - 0.00 0.002035-2039 20,797,155 1,369,831.79 22,166,987 2035-2039 - 0.00 0.00
$ 363,089,854 $ 125,133,934 $ 488,223,788 $ 479,158 $ 35,813 $ 514,971
Year Ending Total Principal payments $ 452,157,133June 30, 2019 Total Interest payments 149,608,367
2020 $ 7,366,466 $ 2,891,447 $ 10,257,913 Total Repayments $ 601,765,5002021 7,182,358 2,695,845 9,878,2032022 6,358,091 2,504,554 8,862,6452023 6,540,771 2,322,985 8,863,756 These schedules present the total debt service payable over the life2024 6,746,697 2,117,973 8,864,670 of each bond issue. The Kentucky School Facilities Construction
2025-2029 24,738,580 7,595,248 32,333,828 Commission and the Metro Louisville government have pledged to 2030-2034 20,587,313 3,697,269 24,284,582 pay the debt service on certain issues as documented by a 2035-2039 9,067,845 613,298 9,681,143 Memorandum of Agreement or a legislative pronouncement; however,
all debt was issued in the Board's name and the full liability is reflected $ 88,588,121 $ 24,438,620 $ 113,026,741 in the Financial Section of this CAFR.
TotalPrincipal Interest Repayments
Presented for Life of Bonds
Jefferson County Board of Education
Kentucky School Facilities Construction Commission
Metro LouisvilleTotal Total
Principal Interest Repayments Principal Interest Repayments

121
Board of Education of Jefferson County, Kentucky
Detail of Bonds by Responsible Party
Presented for Life of Bonds
Bond Issue2002A $ 11,815,000 $ 11,815,000
2008B QZAB 5,200,000 5,200,0002010A 4,290,000 4,290,0002010B 9,500,000 9,500,000
2010C QSCB 11,183,936 11,183,9362011A QSCB 4,243,197 4,243,197
2012A $ 9,740,000 9,740,0002012B 1,340,892 8,639,950 $ 479,158 10,460,0002012C 11,155,000 11,155,0002012D 26,235,000 26,235,0002013A 20,585,978 164,022 20,750,0002013B 21,541,573 7,313,427 28,855,0002013C 29,565,000 29,565,0002014A 33,698,514 7,471,486 41,170,0002014B 4,193,442 2,316,558 6,510,0002015A 14,275,000 14,275,0002015B 32,860,000 32,860,0002015C 14,505,000 14,505,0002016A 18,967,520 19,112,480 38,080,0002016B 6,015,000 6,015,0002017A 31,265,000 31,265,00021018A 16,084,802 13,540,198 29,625,0002019A 54,860,000 54,860,000
$ 363,089,854 $ 88,588,121 $ 479,158 $ 452,157,133
Jefferson County Board of Education
Kentucky School Facilities Construction
Commission Metro
Louisville Total
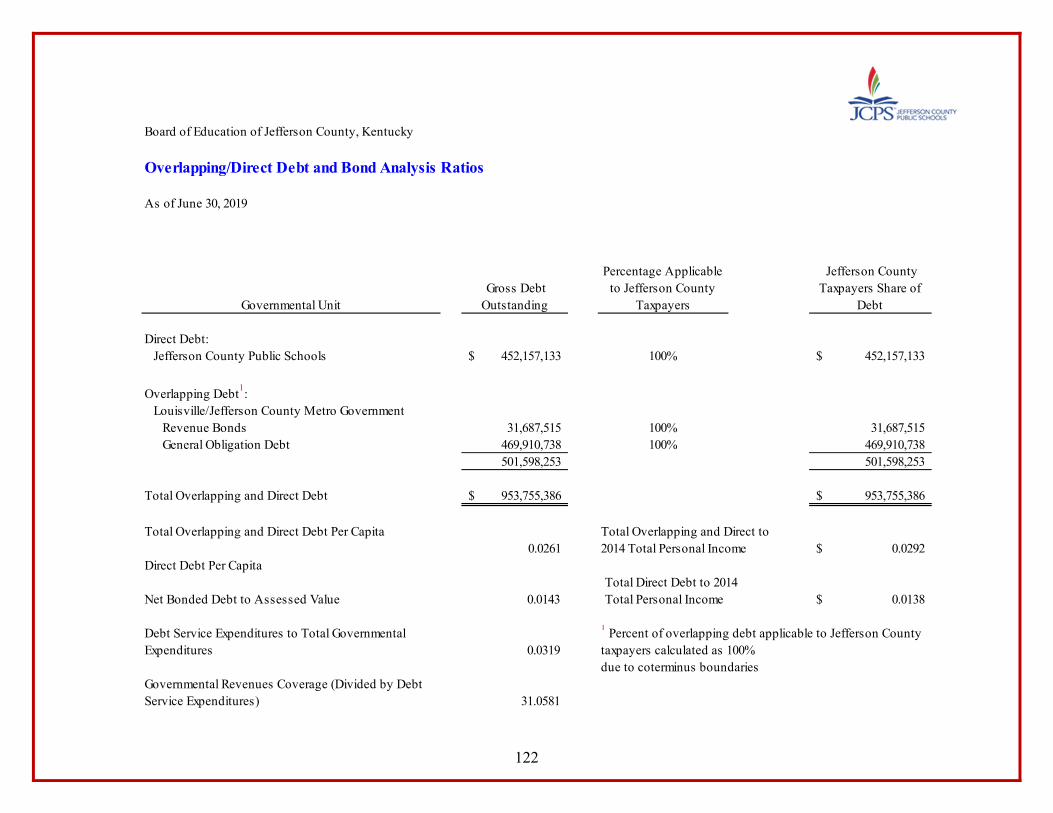
122
Board of Education of Jefferson County, Kentucky
Overlapping/Direct Debt and Bond Analysis Ratios
As of June 30, 2019
Governmental Unit Gross Debt Outstanding
Percentage Applicable to Jefferson County
Taxpayers
Jefferson County Taxpayers Share of
Debt
Direct Debt: Jefferson County Public Schools 452,157,133$ 100% 452,157,133$
Overlapping Debt1: Louisville/Jefferson County Metro Government Revenue Bonds 31,687,515 100% 31,687,515 General Obligation Debt 469,910,738 100% 469,910,738
501,598,253 501,598,253
Total Overlapping and Direct Debt 953,755,386$ 953,755,386$
Total Overlapping and Direct Debt Per Capita Total Overlapping and Direct to0.0261 2014 Total Personal Income 0.0292$
Direct Debt Per CapitaTotal Direct Debt to 2014
Net Bonded Debt to Assessed Value 0.0143 Total Personal Income 0.0138$
Debt Service Expenditures to Total Governmental Expenditures 0.0319
due to coterminus boundariesGovernmental Revenues Coverage (Divided by Debt Service Expenditures) 31.0581
1 Percent of overlapping debt applicable to Jefferson County taxpayers calculated as 100%

123
Board of Education of Jefferson County, Kentucky
Ratios of Debt Outstanding
Ten Year Trend
Fiscal Year
Debt Service Coverage1
Percent of Personal Income
2019 $ 363,089,854 $ - $ 88,588,121 $ 479,158 $ 452,157,133 1.15 1.24% $ 586 2018 359,092,880 1,113,962 83,177,234 568,886 443,952,962 1.17 1.36% 576 2017 380,821,200 2,237,862 91,111,285 753,653 474,924,000 1.19 1.45% 621 2016 371,614,934 3,339,736 97,532,246 932,084 473,419,000 1.17 1.45% 623 2015 358,747,835 4,378,081 83,443,649 1,104,435 447,674,000 1.14 1.37% 589 2014 383,549,548 5,383,481 73,011,023 1,270,948 463,215,000 1.02 1.42% 609 2013 343,630,627 6,360,349 69,473,540 1,430,484 420,895,000 1.69 1.35% 558 2012 336,440,411 7,308,117 73,618,593 1,587,879 418,955,000 1.11 1.33% 565 2011 357,242,036 8,229,578 62,180,845 1,601,188 429,253,647 2.36 1.37% 595 2010 $ 318,244,418 $ 9,130,889 $ 66,850,414 $ 1,730,221 $ 395,955,942 1.70 1.35% $ 549
1 Statutorily, revenues in two funds are used for debt service, with any remainder paid by General Fund. Coverage ratio is the total revenuesin Capital Outlay and Building Fund divided by debt service expenses for the year.
Debt Per Capita
Jefferson Co. Board of Education
Government
Jefferson Co. Board of Education
Proprietary
Kentucky School
Facilities Construction Commission
School Based Neighborhood Places funded
by Metro Louisville Total
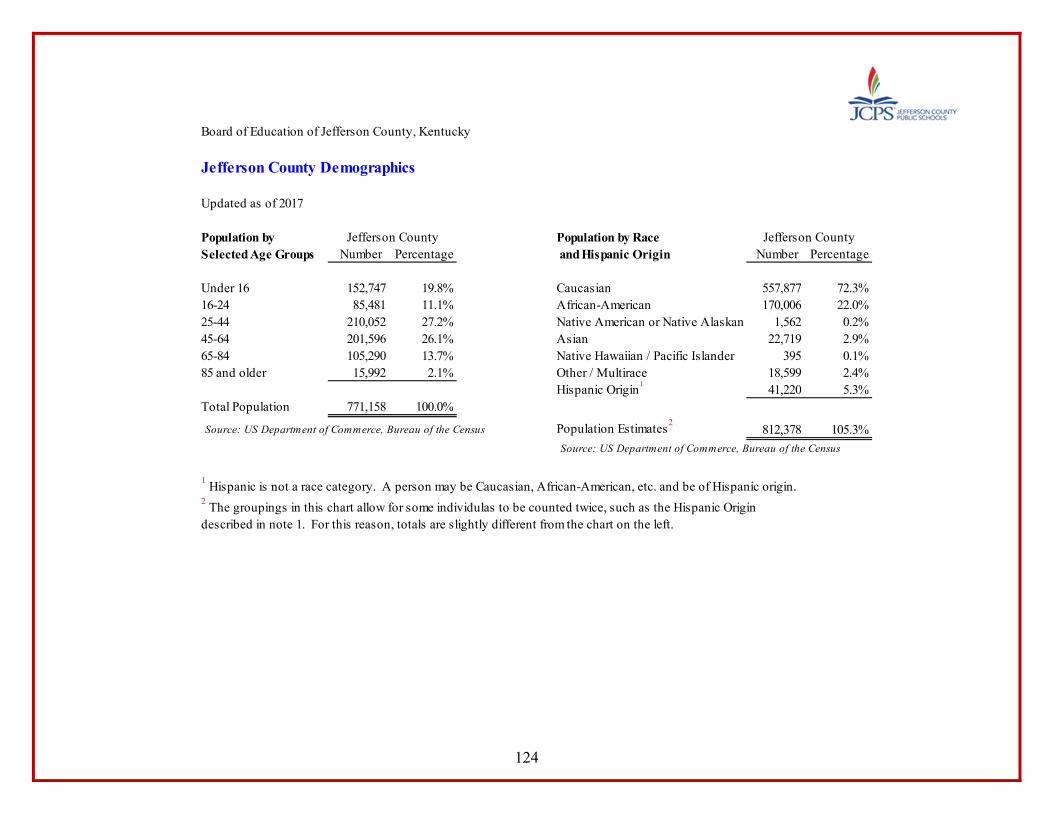
124
Board of Education of Jefferson County, Kentucky
Jefferson County Demographics
Updated as of 2017
Population by Population by RaceSelected Age Groups Number Percentage and Hispanic Origin Number Percentage
Under 16 152,747 19.8% Caucasian 557,877 72.3%16-24 85,481 11.1% African-American 170,006 22.0%25-44 210,052 27.2% Native American or Native Alaskan 1,562 0.2%45-64 201,596 26.1% Asian 22,719 2.9%65-84 105,290 13.7% Native Hawaiian / Pacific Islander 395 0.1%85 and older 15,992 2.1% Other / Multirace 18,599 2.4%
Hispanic Origin1 41,220 5.3%Total Population 771,158 100.0%
Source: US Department of Commerce, Bureau of the Census Population Estimates2812,378 105.3%
Source: US Department of Commerce, Bureau of the Census
1 Hispanic is not a race category. A person may be Caucasian, African-American, etc. and be of Hispanic origin.2 The groupings in this chart allow for some individulas to be counted twice, such as the Hispanic Origindescribed in note 1. For this reason, totals are slightly different from the chart on the left.
Jefferson County Jefferson County
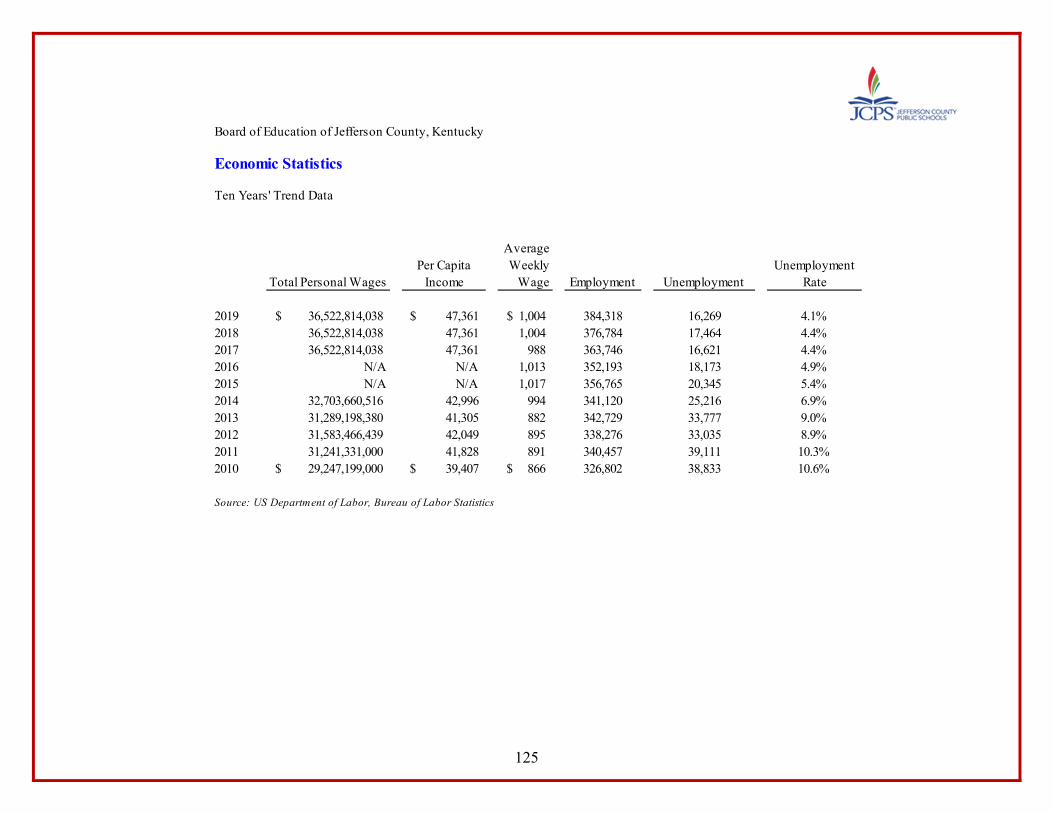
125
Board of Education of Jefferson County, Kentucky
Economic Statistics
Ten Years' Trend Data
Total Personal WagesPer Capita
Income
Average Weekly
Wage Employment UnemploymentUnemployment
Rate
2019 36,522,814,038$ 47,361$ 1,004$ 384,318 16,269 4.1%2018 36,522,814,038 47,361 1,004 376,784 17,464 4.4%2017 36,522,814,038 47,361 988 363,746 16,621 4.4%2016 N/A N/A 1,013 352,193 18,173 4.9%2015 N/A N/A 1,017 356,765 20,345 5.4%2014 32,703,660,516 42,996 994 341,120 25,216 6.9%2013 31,289,198,380 41,305 882 342,729 33,777 9.0%2012 31,583,466,439 42,049 895 338,276 33,035 8.9%2011 31,241,331,000 41,828 891 340,457 39,111 10.3%2010 29,247,199,000$ 39,407$ 866$ 326,802 38,833 10.6%
Source: US Department of Labor, Bureau of Labor Statistics

126
Board of Education of Jefferson County, Kentucky
Number of Employees by Functional Duties
June 30, 2019
Function 2019 2018 2017 2016 2015
Instruction 4,918 5,234 5,353 5,458 5,465 Home and Hospital Instruction 8 8 8 8 8 Other Instructional Programs 3,248 3,080 2,880 2,756 2,754 Student Support Services 568 543 528 506 520 Instructional Staff Support Services 1,125 1,220 1,133 1,148 1,167 District Administrative Support Services 38 29 29 28 25 School Administrative Support Services 1,171 1,041 1,025 1,022 1,015 Business Support Services 297 299 296 281 265 Plant Operations and Maintenance 1,114 1,101 1,099 1,082 1,099 Student Transportation 1,245 1,226 1,173 1,176 1,313 Food Service Operations 939 949 956 906 846 Day Care Operations 1 4 5 6 6 Community Service Operations 122 111 112 112 108 Architectural and Engineering Services 7 8 8 7 6
14,801 14,853 14,605 14,496 14,597

127
Board of Education of Jefferson County, Kentucky
Enrollment by Level
Ten Years' Trend Data
Elementary Middle High Kindergarten E.C.E. PreschoolTotal
Enrollment
2019 35,763 21,233 28,358 7,183 2,420 2,899 97,8562018 37,428 20,717 28,757 6,294 2,316 3,386 98,8982017 37,660 20,599 28,689 7,431 2,297 3,203 99,8792016 37,740 20,703 28,603 7,480 2,305 3,864 100,6952015 37,514 21,093 28,331 7,659 2,315 3,590 100,5022014 37,242 21,413 27,840 7,828 2,352 4,020 100,6952013 36,897 21,310 27,965 7,953 2,432 4,281 100,8382012 36,540 21,039 27,980 7,608 2,443 4,810 100,4202011 36,672 20,527 26,714 7,326 2,528 5,328 99,0952010 36,824 20,318 27,423 7,201 2,735 4,462 98,963
Reflects First Month Enrollment

128
Board of Education of Jefferson County, Kentucky
School Building Capacity Data
Ten Years' T rend Data
School NameSquare
FootageProgram Capacity
Student Enrollment
1st Pupil Month
Program Capacity
Student Enrollment
1st Pupil Month
Program Capacity
Student Enrollment
1st Pupil Month
Program Capacity
Student Enrollment
1st Pupil Month
Program Capacity
Student Enrollment
1st Pupil Month
Alex R. Kennedy Elementary (New 15-16) 45,627 350 353 350 335 450 316 450 277Atherton High 204,019 1490 1,462 1490 1,471 1490 1,473 1,350 1,365 1,350 1,353Atkinson Elementary 73,902 720 360 720 444 720 461 720 461 720 436Auburndale Elementary 59,966 624 617 624 609 624 606 620 603 620 624Audubon Tradit ional Elem. 51,227 628 622 628 618 628 622 612 621 612 616Ballard High 278,137 2050 1,920 2050 1,895 2050 1,943 2,050 1,958 2,050 1,978Barret T radit ional Middle 107,195 654 641 654 645 654 647 654 645 654 646Bates Elementary 48,508 571 560 571 553 571 541 609 553 609 550Blake Elementary 60,916 548 506 548 526 548 515 548 506 548 496Bloom Elementary 61,676 560 556 535 549 535 548 535 532 535 521Blue Lick Elementary 55,333 560 530 560 513 560 522 560 513 560 706Bowen Elementary 63,960 752 729 752 712 752 726 752 727 752 706Brandeis Elementary 55,400 594 547 594 561 594 578 570 599 570 586Breckinridge Metropolitan High1 61,737 149 124 149 110 149 137 106 140 106 124Breckinridge/Franklin Elementary 78,293 578 470 578 467 578 483 578 479 578 493Brown School 157,340 860 731 720 720 720 701 720 700 720 692Buechel Metropolitan High 53,221 181 153Butler Traditional High 210,238 1680 1,681 1680 1,686 1680 1,688 1,650 1,680 1,650 1,695Byck Elementary 72,698 640 383 640 489 640 532 624 568 624 579Camp Taylor Elementary 58,936 568 398 568 441 568 447 598 449 598 482Cane Run Elementary 60,107 536 455 536 412 536 437 574 424 574 406Carrithers Middle 92,976 800 691 800 712 800 680 800 703 800 559Carter Elementary 96,030 612 600 612 593 612 608 612 617 612 596
Continued
2014-152016-172017-182018-19 2015-16

129
Board of Education of Jefferson County, Kentucky
School Building Capacity Data--Continued
Ten Years' T rend Data
School NameSquare
FootageProgram Capacity
Student Enrollment
1st Pupil Month
Program Capacity
Student Enrollment
1st Pupil Month
Program Capacity
Student Enrollment
1st Pupil Month
Program Capacity
Student Enrollment
1st Pupil Month
Program Capacity
Student Enrollment
1st Pupil Month
Alex R. Kennedy Elementary 45,627Atherton High 194,044 1,350 1,266 1,350 1,269 1,250 1,269 1,250 1,171 1,250 1,159Atkinson Elementary 67,912 720 428 720 418 720 385 755 407 755 413Auburndale Elementary 52,820 620 627 620 624 620 621 640 609 640 559Audubon Tradit ional Elem. 51,615 612 618 612 621 612 622 612 624 612 622Ballard High 251,954 2,050 2,003 2,050 1,953 1,980 1,975 1,800 1,863 1,800 1,771Barret T radit ional Middle 107,695 654 639 654 638 654 641 654 641 654 642Bates Elementary 48,374 609 563 609 563 609 542 605 548 605 547Blake Elementary 57,416 548 506 548 472 548 427 548 461 548 472Bloom Elementary 67,415 535 535 535 533 535 532 466 535 466 532Blue Lick Elementary 45,356 560 454 560 481 560 491 560 489 560 498Bowen Elementary 57,010 752 722 752 720 752 730 763 709 763 746Brandeis Elementary 55,400 570 599 570 561 570 565 526 569 526 556Breckinridge Metropolitan High1 63,612 106 117 122 106 122 122Breckinridge/Franklin Elementary 78,404 578 479 578 437 578 398 578 382 578 342Brown School 249,716 720 739 718 729 605 726 605 679 605 635Buechel Metropolitan High1 46,759 181 127 213 181 213 213Butler Traditional High 219,238 1,650 1,693 1,650 1,677 1,635 1,673 1,630 1,672 1,630 1,662Byck Elementary 67,558 624 621 614 593 608 613 583 615 583 572Camp Taylor Elementary 59,199 598 470 568 470 568 483 568 488 568 469Cane Run Elementary 59,840 574 400 574 427 574 464 574 487 574 458Carrithers Middle 92,976 800 558 800 598 800 546 800 549 800 508Carter Elementary 164,775 612 591 612 599 612 597 596 599 596 592
Continued
2012-13 2011-12 2010-11 2009-102013-14

130
Board of Education of Jefferson County, Kentucky
School Building Capacity Data--Continued
Ten Years' T rend Data
School NameSquare
FootageProgram Capacity
Student Enrollment
1st Pupil Month
Program Capacity
Student Enrollment
1st Pupil Month
Program Capacity
Student Enrollment
1st Pupil Month
Program Capacity
Student Enrollment
1st Pupil Month
Program Capacity
Student Enrollment
1st Pupil Month
Central High 233,564 1,400 1,259 1,400 1,183 1,400 1,110 1,400 1,120 1,400 1,107Chancey Elementary 76,000 750 624 750 653 750 665 765 730 765 710Chenoweth Elementary 55,842 640 525 640 556 640 543 640 513 640 514Churchill Park School1 82,200 120 120 80 151 80 136 89 138 89 159Cochran Elementary 56,645 514 324 514 408 514 368 514 267 514 347Cochrane Elementary 61,325 520 476 520 456 520 430 520 438 520 373Coleridge Taylor Elementary 73,437 750 517 750 615 750 649 750 619 750 644Conway Middle 101,137 950 814 950 816 950 833 950 840 950 889Coral Ridge Elementary 53,751 562 548 562 553 562 527 562 524 562 502Crosby Middle 98,894 1,290 1,090 1,290 1,131 1,290 1,296 1,405 1,315 1,405 1,417Crums Lane Elementary 61,350 542 432 542 465 542 481 550 529 550 503Dixie Elementary 44,573 500 436 500 451 500 471 480 469 480 444Doss High 237,309 1,600 1,013 1,600 1,102 1,600 1,072 1,600 1,087 1,600 1,049Dunn Elementary 51,816 615 534 615 528 615 570 610 563 610 580DuPont Maunal High 249,048 1,920 1,921 1,880 1,919 1,880 1,901 1,850 1,896 1,850 1,896Eastern High 299,962 2,090 2,065 2,090 2,088 2,090 2,024 2,090 2,073 2,090 2,069Eisenhower Elementary 59,511 672 582 672 572 672 602 584 612 584 617Engelhard Elementary 56,137 500 377 500 366 500 409 530 435 530 435ESL Newcomer Academy (New 16-17) 395 480 517Fairdale Elementary 64,726 669 578 669 569 669 606 669 621 669 603Fairdale High Magnet Career Academy 270,295 1,600 1,279 1,600 1,204 1,600 1,173 1,600 1,164 1,600 1,139Farmer Elementary (New 07-08) 79,550 790 769 760 747 760 765 788 760 788 751Farnsley Middle (Formerly Williams Middle) 129,979 1,150 1,095 1,150 1,059 1,150 1,048 1,150 1,067 1,150 1,108Fern Creek Elementary 62,617 727 634 727 594 727 644 788 669 788 728Fern Creek Traditional High 247,769 1,775 1,778 1,650 1,685 1,650 1,599 1,575 1,595 1,575 1,548Field Elementary 55,945 446 407 446 413 446 405 446 414 446 410Foster Tradit ional Academy 79,800 660 525 660 584 660 592 650 655 650 649
Continued
2018-19 2014-152015-162016-172017-18
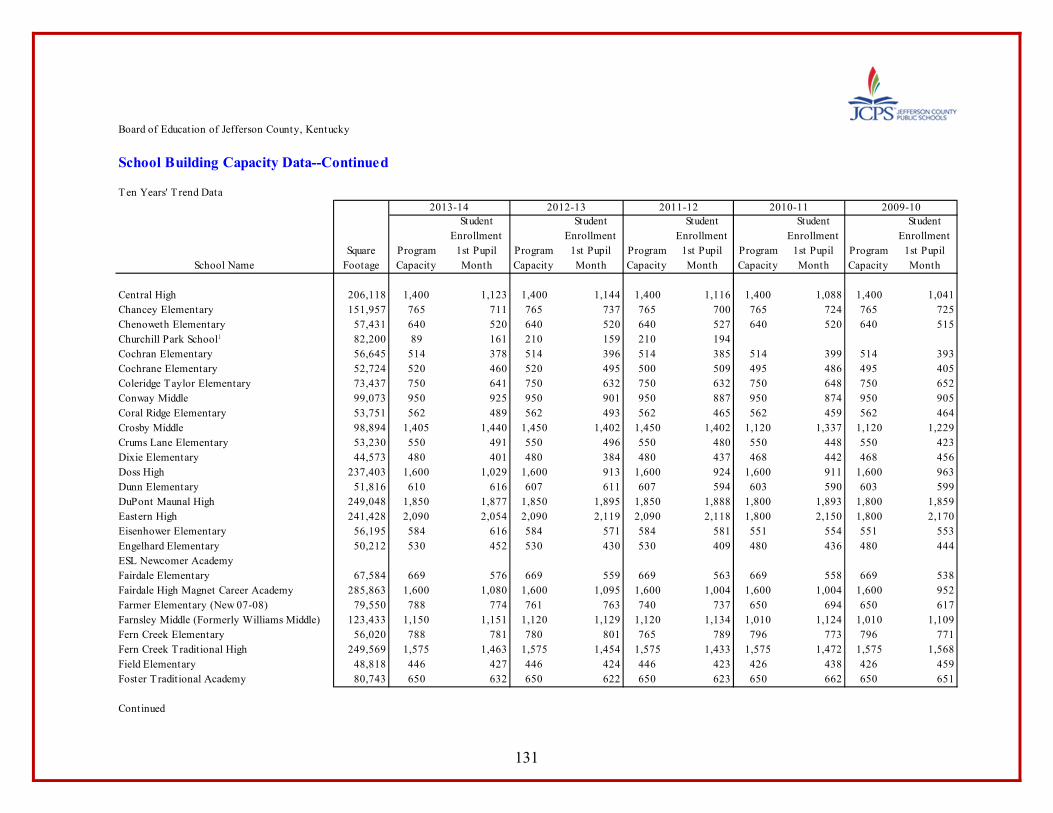
131
Board of Education of Jefferson County, Kentucky
School Building Capacity Data--Continued
Ten Years' T rend Data
School NameSquare
FootageProgram Capacity
Student Enrollment
1st Pupil Month
Program Capacity
Student Enrollment
1st Pupil Month
Program Capacity
Student Enrollment
1st Pupil Month
Program Capacity
Student Enrollment
1st Pupil Month
Program Capacity
Student Enrollment
1st Pupil Month
Central High 206,118 1,400 1,123 1,400 1,144 1,400 1,116 1,400 1,088 1,400 1,041Chancey Elementary 151,957 765 711 765 737 765 700 765 724 765 725Chenoweth Elementary 57,431 640 520 640 520 640 527 640 520 640 515Churchill Park School1 82,200 89 161 210 159 210 194Cochran Elementary 56,645 514 378 514 396 514 385 514 399 514 393Cochrane Elementary 52,724 520 460 520 495 500 509 495 486 495 405Coleridge Taylor Elementary 73,437 750 641 750 632 750 632 750 648 750 652Conway Middle 99,073 950 925 950 901 950 887 950 874 950 905Coral Ridge Elementary 53,751 562 489 562 493 562 465 562 459 562 464Crosby Middle 98,894 1,405 1,440 1,450 1,402 1,450 1,402 1,120 1,337 1,120 1,229Crums Lane Elementary 53,230 550 491 550 496 550 480 550 448 550 423Dixie Elementary 44,573 480 401 480 384 480 437 468 442 468 456Doss High 237,403 1,600 1,029 1,600 913 1,600 924 1,600 911 1,600 963Dunn Elementary 51,816 610 616 607 611 607 594 603 590 603 599DuPont Maunal High 249,048 1,850 1,877 1,850 1,895 1,850 1,888 1,800 1,893 1,800 1,859Eastern High 241,428 2,090 2,054 2,090 2,119 2,090 2,118 1,800 2,150 1,800 2,170Eisenhower Elementary 56,195 584 616 584 571 584 581 551 554 551 553Engelhard Elementary 50,212 530 452 530 430 530 409 480 436 480 444ESL Newcomer AcademyFairdale Elementary 67,584 669 576 669 559 669 563 669 558 669 538Fairdale High Magnet Career Academy 285,863 1,600 1,080 1,600 1,095 1,600 1,004 1,600 1,004 1,600 952Farmer Elementary (New 07-08) 79,550 788 774 761 763 740 737 650 694 650 617Farnsley Middle (Formerly Williams Middle) 123,433 1,150 1,151 1,120 1,129 1,120 1,134 1,010 1,124 1,010 1,109Fern Creek Elementary 56,020 788 781 780 801 765 789 796 773 796 771Fern Creek Traditional High 249,569 1,575 1,463 1,575 1,454 1,575 1,433 1,575 1,472 1,575 1,568Field Elementary 48,818 446 427 446 424 446 423 426 438 426 459Foster Tradit ional Academy 80,743 650 632 650 622 650 623 650 662 650 651
Continued
2009-102011-12 2010-112013-14 2012-13
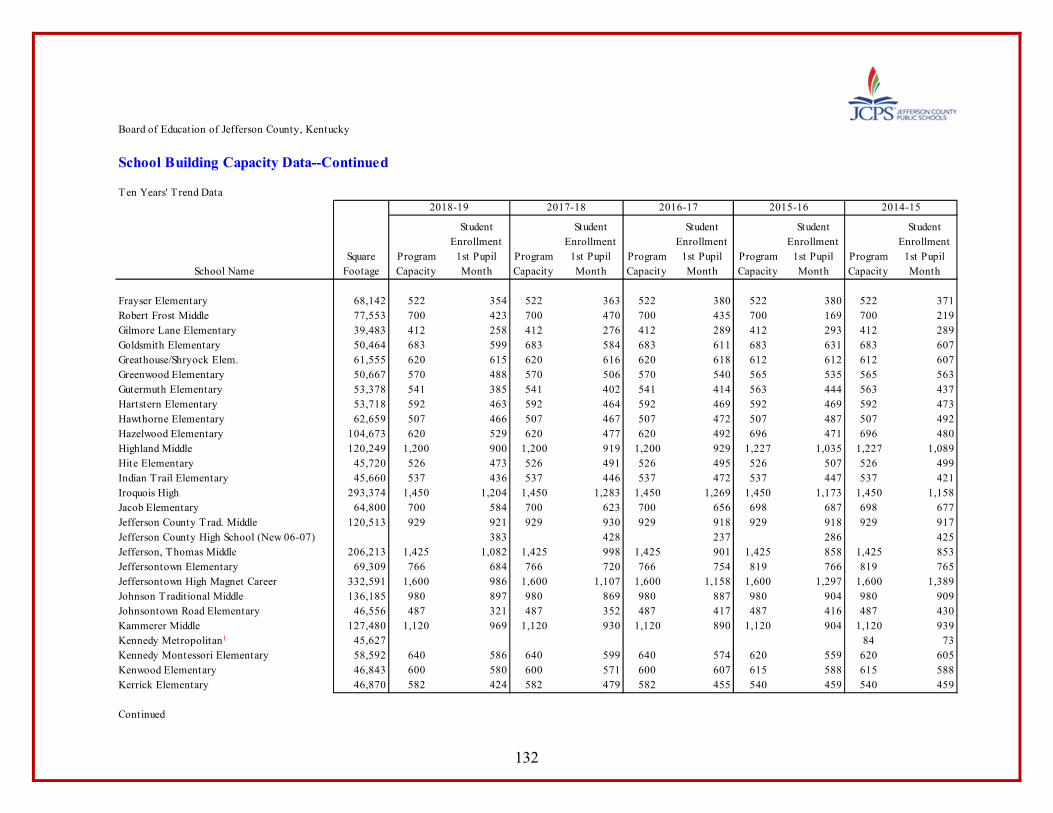
132
Board of Education of Jefferson County, Kentucky
School Building Capacity Data--Continued
Ten Years' T rend Data
School NameSquare
FootageProgram Capacity
Student Enrollment
1st Pupil Month
Program Capacity
Student Enrollment
1st Pupil Month
Program Capacity
Student Enrollment
1st Pupil Month
Program Capacity
Student Enrollment
1st Pupil Month
Program Capacity
Student Enrollment
1st Pupil Month
Frayser Elementary 68,142 522 354 522 363 522 380 522 380 522 371Robert Frost Middle 77,553 700 423 700 470 700 435 700 169 700 219Gilmore Lane Elementary 39,483 412 258 412 276 412 289 412 293 412 289Goldsmith Elementary 50,464 683 599 683 584 683 611 683 631 683 607Greathouse/Shryock Elem. 61,555 620 615 620 616 620 618 612 612 612 607Greenwood Elementary 50,667 570 488 570 506 570 540 565 535 565 563Gutermuth Elementary 53,378 541 385 541 402 541 414 563 444 563 437Hartstern Elementary 53,718 592 463 592 464 592 469 592 469 592 473Hawthorne Elementary 62,659 507 466 507 467 507 472 507 487 507 492Hazelwood Elementary 104,673 620 529 620 477 620 492 696 471 696 480Highland Middle 120,249 1,200 900 1,200 919 1,200 929 1,227 1,035 1,227 1,089Hite Elementary 45,720 526 473 526 491 526 495 526 507 526 499Indian Trail Elementary 45,660 537 436 537 446 537 472 537 447 537 421Iroquois High 293,374 1,450 1,204 1,450 1,283 1,450 1,269 1,450 1,173 1,450 1,158Jacob Elementary 64,800 700 584 700 623 700 656 698 687 698 677Jefferson County Trad. Middle 120,513 929 921 929 930 929 918 929 918 929 917Jefferson County High School (New 06-07) 383 428 237 286 425Jefferson, Thomas Middle 206,213 1,425 1,082 1,425 998 1,425 901 1,425 858 1,425 853Jeffersontown Elementary 69,309 766 684 766 720 766 754 819 766 819 765Jeffersontown High Magnet Career 332,591 1,600 986 1,600 1,107 1,600 1,158 1,600 1,297 1,600 1,389Johnson Tradit ional Middle 136,185 980 897 980 869 980 887 980 904 980 909Johnsontown Road Elementary 46,556 487 321 487 352 487 417 487 416 487 430Kammerer Middle 127,480 1,120 969 1,120 930 1,120 890 1,120 904 1,120 939Kennedy Metropolitan1 45,627 84 73Kennedy Montessori Elementary 58,592 640 586 640 599 640 574 620 559 620 605Kenwood Elementary 46,843 600 580 600 571 600 607 615 588 615 588Kerrick Elementary 46,870 582 424 582 479 582 455 540 459 540 459
Continued
2014-152016-172018-19 2017-18 2015-16

133
Board of Education of Jefferson County, Kentucky
School Building Capacity Data--Continued
Ten Years' T rend Data
School NameSquare
FootageProgram Capacity
Student Enrollment
1st Pupil Month
Program Capacity
Student Enrollment
1st Pupil Month
Program Capacity
Student Enrollment
1st Pupil Month
Program Capacity
Student Enrollment
1st Pupil Month
Program Capacity
Student Enrollment
1st Pupil Month
Frayser Elementary 71,730 522 352 522 373 522 375 522 406 522 371Frost Middle 76,851 700 494 700 529 700 423 700 473 700 459Gilmore Lane Elementary 39,483 412 312 412 373 412 367 407 361 407 399Goldsmith Elementary 42,994 683 619 683 678 672 690 650 674 650 665Greathouse/Shryock Elem. 51,054 612 609 612 610 612 612 612 610 612 611Greenwood Elementary 42,848 565 564 565 561 562 562 556 565 556 547Gutermuth Elementary 53,378 563 410 563 443 563 447 563 483 563 478Hartstern Elementary 52,655 592 470 592 448 592 442 592 499 592 477Hawthorne Elementary 42,510 507 496 507 477 487 490 484 484 484 436Hazelwood Elementary 83,381 696 460 696 435 696 444 696 443 696 413Highland Middle 123,574 1,227 1,156 1,227 1,189 1,200 1,195 1,025 1,118 1,025 1,077Hite Elementary 45,720 526 500 526 530 523 517 513 521 513 498Indian Trail Elementary 40,225 537 453 537 498 537 481 537 510 537 474Iroquois High 296,110 1,450 1,100 1,450 1,193 1,450 1,174 1,450 1,104 1,450 1,182Jacob Elementary 61,250 698 707 698 688 690 697 675 668 675 625Jefferson County Trad. Middle 120,513 929 922 929 925 929 895 929 908 929 906Jefferson County High School (New 06-07) 485 439 338 276 291Jefferson, Thomas Middle 224,413 1,425 896 1,425 898 1,425 966 1,425 1,002 1,425 908Jeffersontown Elementary 69,305 819 780 819 794 819 794 778 767 778 776Jeffersontown High Magnet Career 298,488 1,600 1,434 1,600 1,471 1,600 1,366 1,600 1,224 1,600 1,160Johnson Tradit ional Middle 136,185 980 912 980 932 980 940 959 951 959 966Johnsontown Road Elementary 47,096 487 404 487 429 487 455 471 465 471 452Kammerer Middle 112,682 1,120 1,064 1,100 1,074 1,050 1,033 1,050 936 1,050 904Kennedy Metropolitan1 36,765 84 71 77 86 77 82Kennedy Montessori Elementary 58,592 620 619 620 622 620 586 600 598 600 597Kenwood Elementary 47,319 615 584 615 590 615 595 600 592 600 577Kerrick Elementary 49,808 540 444 540 480 540 482 540 492 540 483
Continued
2012-13 2009-102011-12 2010-112013-14

134
Board of Education of Jefferson County, Kentucky
School Building Capacity Data--Continued
Ten Years' T rend Data
School NameSquare
FootageProgram Capacity
Student Enrollment
1st Pupil Month
Program Capacity
Student Enrollment
1st Pupil Month
Program Capacity
Student Enrollment
1st Pupil Month
Program Capacity
Student Enrollment
1st Pupil Month
Program Capacity
Student Enrollment
1st Pupil Month
King Elementary 67,295 550 394 550 400 550 423 550 470 550 456Klondike Lane Elementary 57,300 650 418 650 438 650 476 732 516 732 569Knight Middle 101,218 700 438 700 419 700 406 700 407 700 411Lassiter Middle 103,834 1,100 1,071 950 1,002 950 900 900 913 900 925Laukhuf Elementary 61,426 600 484 600 457 600 443 600 446 600 455Layne Elementary 50,740 518 355 518 417 518 447 541 463 541 469Liberty High 100,329 281 280 222 269 222 275 270 404 270 385Lincoln Elementary Performing Arts 96,825 560 569 566 564 566 562 500 556 500 544Louisville Male High 187,678 2,050 1,958 1,915 1,961 1,915 1,891 1,763 1,806 1,763 1,781Lowe Elementary 59,560 620 584 620 600 620 602 620 606 620 606Luhr Elementary 46,943 524 478 524 503 524 482 524 483 524 477Maupin Elementary 74,000 675 328 675 313 675 367 675 473 675 485McFerran Preparatory Academy 160,000 1,020 909 1,020 907 1,020 901 1,020 971 1,020 874Medora Elementary 39,537 463 454 463 459 463 454 463 455 463 442Meyzeek Middle 134,645 1,200 1,112 1,200 1,107 1,200 1,138 1,200 1,101 1,200 1,123Middletown Elementary 58,553 645 562 645 562 645 595 645 611 645 598Mill Creek Elementary 48,611 564 486 564 503 564 508 564 490 564 484Minor Daniels (New 15-16) 46,759 188 212 167 165Minors Lane Elementary 51,721 529 395 529 431 529 454 600 447 600 446Moore Middle/High 263,686 2,300 2,300 2,190 2,142 2,190 2,014 2,190 2,004 2,070 1,984Myers Middle 97,164 1,010 129 1,010 324Newburg Middle 119,000 1,100 1,040 1,100 1,077 1,100 1,040 1,112 1,061 1,112 1,020Noe Middle 151,960 1,350 1,351 1,350 1,336 1,350 1,360 1,332 1,327 1,332 1,331Norton Commons Elementary (New 16-17) 60,724 784 552 784 488 784 404Norton Elementary 60,724 768 710 768 722 768 724 768 736 768 732Okolona Elementary 50,950 501 326 501 324 501 313 501 310 501 346
Continued
2014-152015-162016-172018-19 2017-18
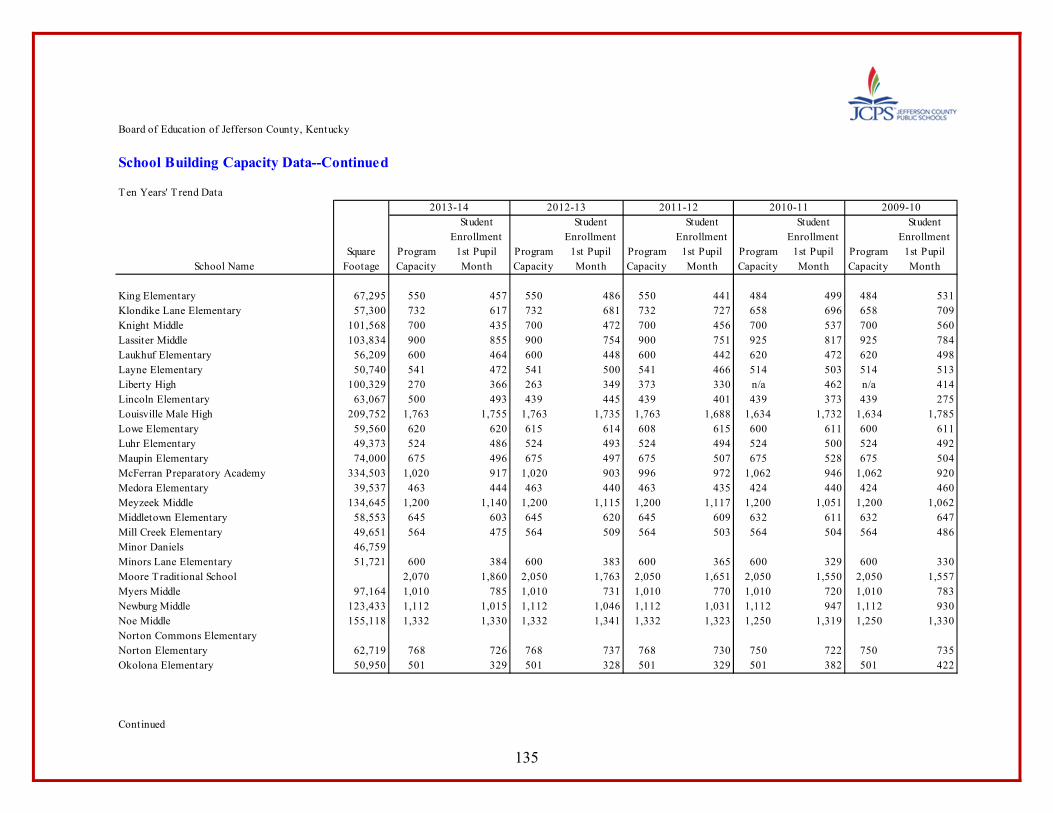
135
Board of Education of Jefferson County, Kentucky
School Building Capacity Data--Continued
Ten Years' T rend Data
School NameSquare
FootageProgram Capacity
Student Enrollment
1st Pupil Month
Program Capacity
Student Enrollment
1st Pupil Month
Program Capacity
Student Enrollment
1st Pupil Month
Program Capacity
Student Enrollment
1st Pupil Month
Program Capacity
Student Enrollment
1st Pupil Month
King Elementary 67,295 550 457 550 486 550 441 484 499 484 531Klondike Lane Elementary 57,300 732 617 732 681 732 727 658 696 658 709Knight Middle 101,568 700 435 700 472 700 456 700 537 700 560Lassiter Middle 103,834 900 855 900 754 900 751 925 817 925 784Laukhuf Elementary 56,209 600 464 600 448 600 442 620 472 620 498Layne Elementary 50,740 541 472 541 500 541 466 514 503 514 513Liberty High 100,329 270 366 263 349 373 330 n/a 462 n/a 414Lincoln Elementary 63,067 500 493 439 445 439 401 439 373 439 275Louisville Male High 209,752 1,763 1,755 1,763 1,735 1,763 1,688 1,634 1,732 1,634 1,785Lowe Elementary 59,560 620 620 615 614 608 615 600 611 600 611Luhr Elementary 49,373 524 486 524 493 524 494 524 500 524 492Maupin Elementary 74,000 675 496 675 497 675 507 675 528 675 504McFerran Preparatory Academy 334,503 1,020 917 1,020 903 996 972 1,062 946 1,062 920Medora Elementary 39,537 463 444 463 440 463 435 424 440 424 460Meyzeek Middle 134,645 1,200 1,140 1,200 1,115 1,200 1,117 1,200 1,051 1,200 1,062Middletown Elementary 58,553 645 603 645 620 645 609 632 611 632 647Mill Creek Elementary 49,651 564 475 564 509 564 503 564 504 564 486Minor Daniels 46,759Minors Lane Elementary 51,721 600 384 600 383 600 365 600 329 600 330Moore Traditional School 2,070 1,860 2,050 1,763 2,050 1,651 2,050 1,550 2,050 1,557Myers Middle 97,164 1,010 785 1,010 731 1,010 770 1,010 720 1,010 783Newburg Middle 123,433 1,112 1,015 1,112 1,046 1,112 1,031 1,112 947 1,112 930Noe Middle 155,118 1,332 1,330 1,332 1,341 1,332 1,323 1,250 1,319 1,250 1,330Norton Commons ElementaryNorton Elementary 62,719 768 726 768 737 768 730 750 722 750 735Okolona Elementary 50,950 501 329 501 328 501 329 501 382 501 422
Continued
2011-12 2009-102012-13 2010-112013-14
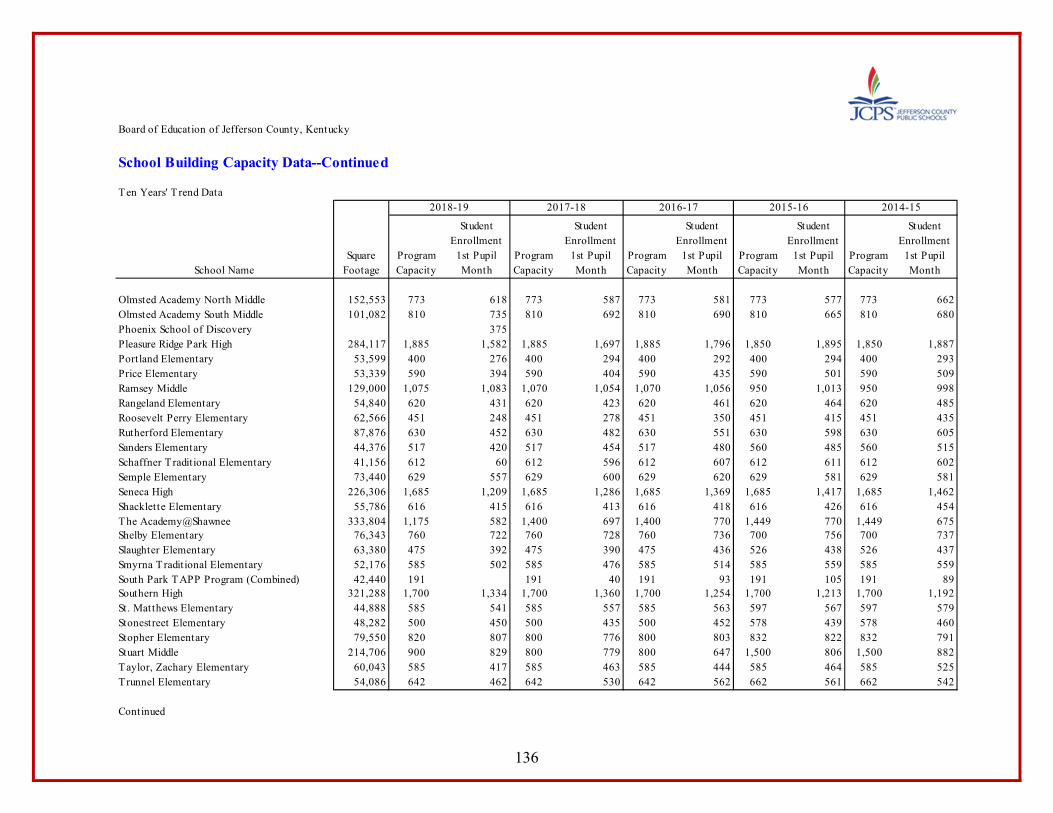
136
Board of Education of Jefferson County, Kentucky
School Building Capacity Data--Continued
Ten Years' T rend Data
School NameSquare
FootageProgram Capacity
Student Enrollment
1st Pupil Month
Program Capacity
Student Enrollment
1st Pupil Month
Program Capacity
Student Enrollment
1st Pupil Month
Program Capacity
Student Enrollment
1st Pupil Month
Program Capacity
Student Enrollment
1st Pupil Month
Olmsted Academy North Middle 152,553 773 618 773 587 773 581 773 577 773 662Olmsted Academy South Middle 101,082 810 735 810 692 810 690 810 665 810 680Phoenix School of Discovery 375Pleasure Ridge Park High 284,117 1,885 1,582 1,885 1,697 1,885 1,796 1,850 1,895 1,850 1,887Portland Elementary 53,599 400 276 400 294 400 292 400 294 400 293Price Elementary 53,339 590 394 590 404 590 435 590 501 590 509Ramsey Middle 129,000 1,075 1,083 1,070 1,054 1,070 1,056 950 1,013 950 998Rangeland Elementary 54,840 620 431 620 423 620 461 620 464 620 485Roosevelt Perry Elementary 62,566 451 248 451 278 451 350 451 415 451 435Rutherford Elementary 87,876 630 452 630 482 630 551 630 598 630 605Sanders Elementary 44,376 517 420 517 454 517 480 560 485 560 515Schaffner Traditional Elementary 41,156 612 60 612 596 612 607 612 611 612 602Semple Elementary 73,440 629 557 629 600 629 620 629 581 629 581Seneca High 226,306 1,685 1,209 1,685 1,286 1,685 1,369 1,685 1,417 1,685 1,462Shacklette Elementary 55,786 616 415 616 413 616 418 616 426 616 454The Academy@Shawnee 333,804 1,175 582 1,400 697 1,400 770 1,449 770 1,449 675Shelby Elementary 76,343 760 722 760 728 760 736 700 756 700 737Slaughter Elementary 63,380 475 392 475 390 475 436 526 438 526 437Smyrna Tradit ional Elementary 52,176 585 502 585 476 585 514 585 559 585 559South Park TAPP Program (Combined) 42,440 191 191 40 191 93 191 105 191 89Southern High 321,288 1,700 1,334 1,700 1,360 1,700 1,254 1,700 1,213 1,700 1,192St. Matthews Elementary 44,888 585 541 585 557 585 563 597 567 597 579Stonestreet Elementary 48,282 500 450 500 435 500 452 578 439 578 460Stopher Elementary 79,550 820 807 800 776 800 803 832 822 832 791Stuart Middle 214,706 900 829 800 779 800 647 1,500 806 1,500 882Taylor, Zachary Elementary 60,043 585 417 585 463 585 444 585 464 585 525Trunnel Elementary 54,086 642 462 642 530 642 562 662 561 662 542
Continued
2014-152015-162016-172018-19 2017-18

137
Board of Education of Jefferson County, Kentucky
School Building Capacity Data--Continued
Ten Years' T rend Data
School NameSquare
FootageProgram Capacity
Student Enrollment
1st Pupil Month
Program Capacity
Student Enrollment
1st Pupil Month
Program Capacity
Student Enrollment
1st Pupil Month
Program Capacity
Student Enrollment
1st Pupil Month
Program Capacity
Student Enrollment
1st Pupil Month
Olmsted Academy North Middle 152,553 773 653 850 665 1,050 768 1,050 782 1,050 786Olmsted Academy South Middle 101,510 810 721 895 771 895 814 895 771 895 776Phoenix School of DiscoveryPleasure Ridge Park High 284,117 1,850 1,837 1,850 1,861 1,850 1,859 1,820 1,891 1,820 1,938Portland Elementary 52,661 400 288 450 268 450 256 472 259 472 270Price Elementary 53,339 590 544 590 588 590 582 547 578 547 539Ramsey Middle 129,000 950 947 950 877 950 821 950 727 950 657Rangeland Elementary 46,210 620 529 580 580 560 545 520 520 520 492Roosevelt Perry Elementary 50,185 451 413 451 397 451 381 451 379 451 307Rutherford Elementary 83,296 630 608 630 606 630 595 600 598 600 547Sanders Elementary 44,376 560 501 560 498 560 504 503 493 503 528Schaffner Tradit ional Elementary 41,156 612 610 612 608 612 608 612 604 612 611Semple Elementary 65,447 629 535 629 543 629 542 629 552 629 581Seneca High 236,142 1,685 1,502 1,685 1,482 1,685 1,379 1,685 1,494 1,685 1,519Shacklette Elementary 47,409 616 437 616 433 616 450 708 472 708 493The Academy@Shawnee 333,804 1,449 595 1,400 553 1,400 587 1,400 563 1,400 549Shelby ElementarySlaughter Elementary 50,578 526 439 526 415 526 442 508 516 508 483Smyrna Tradit ional Elementary 42,827 585 562 575 571 575 546 623 513 623 574South Park TAPP Program (Combined) 42,152 191 157 216 211 216 212Southern High 329,983 1,700 1,124 1,700 1,199 1,700 1,240 1,700 1,274 1,700 1,292St. Matthews Elementary 46,228 597 568 597 589 597 593 550 588 550 600Stonestreet Elementary 49,169 578 482 578 515 578 488 578 497 578 515Stopher Elementary 79,550 832 803 820 811 784 809 650 763 650 754Stuart Middle 214,706 1,500 829 1,500 1,058 1,500 1,020 1,500 1,082 1,500 1,085Taylor, Zachary Elementary 45,067 585 430 585 517 585 491 585 498 585 534Trunnel Elementary 55,097 662 485 662 632 662 609 670 606 670 636
Continued
2011-12 2010-11 2009-102012-132013-14

138
Board of Education of Jefferson County, Kentucky
School Building Capacity Data--Continued
Ten Years' T rend Data
School NameSquare
FootageProgram Capacity
Student Enrollment
1st Pupil Month
Program Capacity
Student Enrollment
1st Pupil Month
Program Capacity
Student Enrollment
1st Pupil Month
Program Capacity
Student Enrollment
1st Pupil Month
Program Capacity
Student Enrollment
1st Pupil Month
Tully Elementary 105,648 828 758 828 747 828 733 828 708 828 706Valley Tradit ional High 275,670 1,600 1,011 1,600 1,038 1,600 1,271 1,600 1,481 827 1,481Waggener High 185,446 1,300 918 1,300 908 1,300 868 1,300 827 1,300 763Waller Williams Environmental1 54,619 123 123 98 98 98 87 98 94 98 86Watson Lane Elementary 68,925 661 303 661 315 661 364 661 364 661 395Watterson Elementary 52,105 600 499 600 532 600 564 615 555 615 593W.E.B. Dubois Academy (New 2018-19) 153Wellington Tradit ional Elem. 56,924 547 425 547 484 547 484 547 492 547 457Western High 202,622 1,300 683 1,300 731 1,300 789 1,300 825 1,300 806Western Middle 133,525 825 616 825 629 825 603 825 575 825 555Georgia Chaffe TAPP Program (combined 18-1 78,043 148 74 148 76 148 76 148 147 148 158Westport T raditional Middle 169,768 1,310 1281 1,300 1251 1,300 1244 1,300 1205 1,300 1124Wheatley Elementary 61,244 500 321 500 387 500 387 550 414 550 390Wheeler Elementary 53,443 688 644 688 660 688 667 680 679 680 681Wilder Elementary 49,424 613 532 613 563 613 548 613 544 613 572Wilkerson Traditional Elem. 43,795 534 474 534 468 534 470 534 448 534 479Wilt Elementary 50,481 566 511 566 519 566 507 566 498 566 485Young Elementary 73,437 650 397 650 514 650 525 650 553 650 535
Enrollment presented is as of the end of the first pupil month. This is not typically our highest enrollment month during the school year, but this is when the program budget is set and students are assigned to each school within program capacity guidelines.
Continued
2014-152016-17 2015-162018-19 2017-18
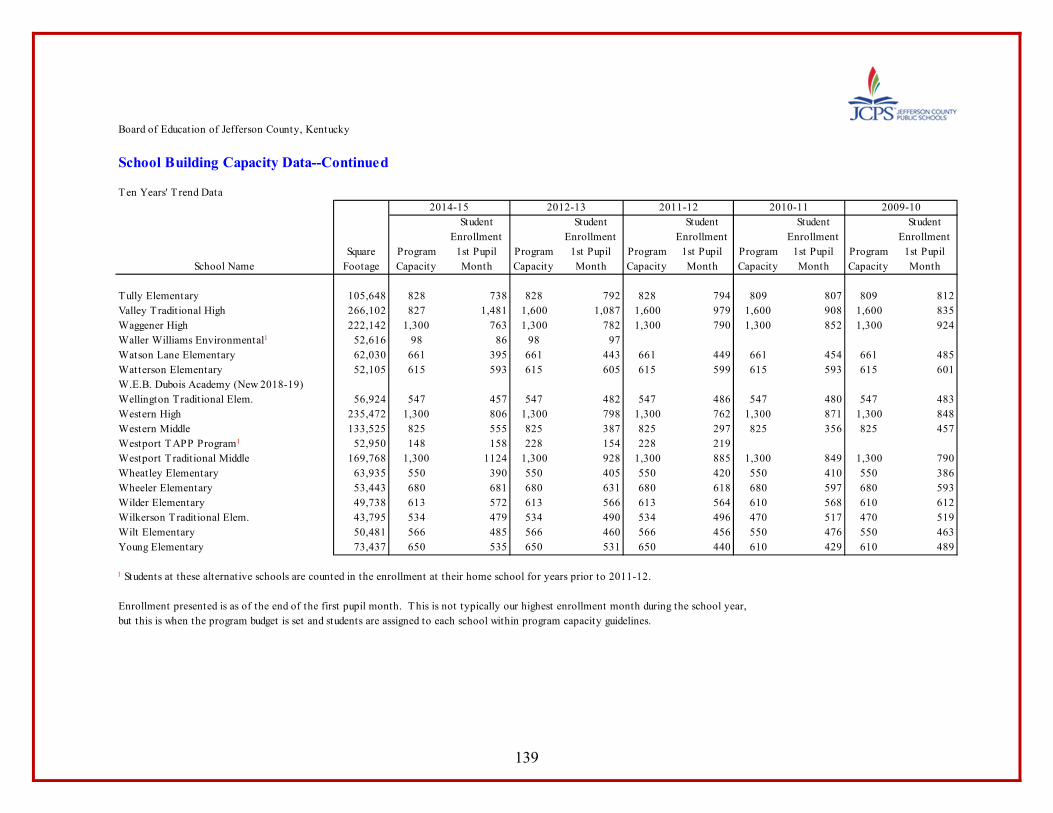
139
Board of Education of Jefferson County, Kentucky
School Building Capacity Data--Continued
Ten Years' T rend Data
School NameSquare
FootageProgram Capacity
Student Enrollment
1st Pupil Month
Program Capacity
Student Enrollment
1st Pupil Month
Program Capacity
Student Enrollment
1st Pupil Month
Program Capacity
Student Enrollment
1st Pupil Month
Program Capacity
Student Enrollment
1st Pupil Month
Tully Elementary 105,648 828 738 828 792 828 794 809 807 809 812Valley Tradit ional High 266,102 827 1,481 1,600 1,087 1,600 979 1,600 908 1,600 835Waggener High 222,142 1,300 763 1,300 782 1,300 790 1,300 852 1,300 924Waller Williams Environmental1 52,616 98 86 98 97Watson Lane Elementary 62,030 661 395 661 443 661 449 661 454 661 485Watterson Elementary 52,105 615 593 615 605 615 599 615 593 615 601W.E.B. Dubois Academy (New 2018-19)Wellington Tradit ional Elem. 56,924 547 457 547 482 547 486 547 480 547 483Western High 235,472 1,300 806 1,300 798 1,300 762 1,300 871 1,300 848Western Middle 133,525 825 555 825 387 825 297 825 356 825 457Westport TAPP Program1 52,950 148 158 228 154 228 219Westport T raditional Middle 169,768 1,300 1124 1,300 928 1,300 885 1,300 849 1,300 790Wheatley Elementary 63,935 550 390 550 405 550 420 550 410 550 386Wheeler Elementary 53,443 680 681 680 631 680 618 680 597 680 593Wilder Elementary 49,738 613 572 613 566 613 564 610 568 610 612Wilkerson Traditional Elem. 43,795 534 479 534 490 534 496 470 517 470 519Wilt Elementary 50,481 566 485 566 460 566 456 550 476 550 463Young Elementary 73,437 650 535 650 531 650 440 610 429 610 489
1 Students at these alternative schools are counted in the enrollment at their home school for years prior to 2011-12.
Enrollment presented is as of the end of the first pupil month. This is not typically our highest enrollment month during the school year, but this is when the program budget is set and students are assigned to each school within program capacity guidelines.
2011-12 2010-11 2009-102012-132014-15

140
Board of Education of Jefferson County, Kentucky
Miscellaneous Statistics
For the Year Ended June 30, 2019
Number of Students
English as a Second Language 8,378Different Languages 148Special Needs 12,767Free and Reduced Price Lunch 68%Advanced Placement Tests Taken 10,949
Student Transportation
Number of Buses 904 Number of Bus Compounds 13 Miles Driven per Day (Average) 100,269 Number of Students Transported Daily 67,223
3%
72%
25%
Funding Allocation
Central Office
Schools
Systemwide SchoolCenters
9%
12%
36%
43%
Student Demographics
Other
Hispanic/Latino
African American
Caucasian