affecting consumer behaviour to increase the willingness...
TRANSCRIPT

Master Thesis Spring 2008
Affecting Consumer Behaviour to
Increase the Willingness to Purchase More Fruit
A study about how sales and consumer behaviour is affected by a
change in layout in the fruit section
Advisors: Authors: Ulf Johansson Linda Arvidsson Karin Alm Therese Palmgren Sarah Rowland

- Arvidsson - Palmgren - Rowland -
2
- Abstract - We would like to thank ICA Frukt och Grönt especially Linda Roce, Maria Wieloch, Marianne Johansson from ICA Maxi in Malmö and Jimmy Nilsson at ICA Kvantum in Landskrona. Also a special thanks to our supervisors Ulf Johansson and Karin Elm for their help and support and to Jens Nordfält for his great advice. Title: Affecting Consumer Behaviour to Increase the
Willingness to Purchase More Fruit Date of the Seminar: June 3rd, 2008 Course: BUSM08, Master Thesis in International Marketing Authors: Linda Arvidsson, Therese Palmgren, Sarah Rowland Advisors: Ulf Johansson, Karin Alm Key words: Consumer behaviour, impulse purchases, store layout,
fruit sales, ICA Thesis purpose: The purpose of this study is to examine the change in
consumer behaviour regarding the intention towards buying fruit when the layout of the fruit section has been altered. We want to increase the probability of making impulse purchases by altering the layout.
Methodology: In our study we have combined structured quantitative
observations with structured quantitative as well as qualitative interviews, with secondary data in the form of sales data from two selected ICA-stores. We chose to use this triangulated approach in order to cross-examine our findings and overcome the limitations of one method by the use of another. Further, the Latin square design was used for the observations as a means to acknowledge the calendar effect during the experiment.

- Arvidsson - Palmgren - Rowland -
3
Theoretical perspective: The theories this study is based upon are within consumer behaviour and in-store marketing. The theoretical framework demonstrates how consumer behaviour is constructed and influenced through decision making, the type of purchases and the overall store environment.
The included theories and models are the decision making model, the theory of planned behaviour, impulse purchases, layout and store design and the Mehrabian-Russell environmental psychology model.
Empirical data: Findings from 640 structured quantitative observations,
120 structured quantitative interviews, 4 qualitative interviews and sales data from the two weeks of experiment from the two selected ICA-stores.
Conclusion: Moving the position of the bananas from the front to the
back of the fruit section does result in a loss of sales for bananas but there is an increase in the sales of apples, pears and citrus fruits, however, this could be a short term effect. The customer’s route around the store is not affected by the change in layout. Tendency towards impulse buying is increased from altering the layout, although the mood of the customers often changes from positive to confused and negative.

- Arvidsson - Palmgren - Rowland -
4
- Table of contents - 1. Introduction.................................................................................................................. 6 1.1 Previous Research........................................................................................................ 6 1.2 Problem Discussion………………………………………………………………...... 7 1.3 Research Question…………………………………………………………................ 8 1.4 Purpose of the Study………………………………………………………………..... 8 1.5 Disposition of the Thesis……………………………………………………………... 8 2. Methodology………………………………………………………………………..... 10 2.1 Research Approach………………………………………………………………….. 10 2.2 ICA AB………………………………………………………………………............. 11 2.3 The Two Selected ICA-Stores……………………………………………………….. 12 2.4 Research Design……………………………………………………………............... 12
2.4.1 Experimental Design………………………………………………............. 12 2.4.2 Triangulation………………………………………………………………. 12 2.4.3 Latin Square Design……………………………………………….............. 13
2.5 Research Strategy……………………………………………………………………. 14 2.5.1 Quantitative Data Collection……………………………………………….. 14
2.5.1.1 Sampling…………………………………………………………. 14 2.5.1.2 Observations………………………………………………........... 15 2.5.1.3 Structured Quantitative Interviews……………………………..... 16 2.5.1.4 Secondary Data………………………………………………....... 17
2.5.2 Qualitative Data Collection………………………………………………... 17 2.5.2.1 Structured Qualitative Interviews………………………………... 17
2.6 Data Analysis………………………………………………………………………... 18 2.7 Reliability and Validity…………………………………………………………….... 18 3. Theoretical Framework……………………………………………………….......... 20 3.1 Relevance of Theories…………………………………………………………......... 20 3.2 Consumer Behaviour………………………………………………………………... 21 3.3 Decision Making Model…………………………………………………………… ... 21 3.4 The Theory of Planned Behaviour………………………………………………….. 22 3.5 Impulse Purchases…………….………………………………………………............ 22 3.6 Four Atmospheric Dimensions.................................................................................... 23
3.6.1 Layout and Store Design…………………………………………………... 23 3.6.2 Consumer Route…………………………………………………………... 24
3.7 The Mehrabian-Russell (M-R) Environmental Psychology Model……………… .... 25 4. Results……………………………………………………………………………….. 26 4.1 Quantitative Data Collection…………………………………………….................. 26 4.1.1 Overall Observation Results……………………………………………..... 26 4.1.2 Further Observation Findings........................................................................ 27 4.1.3 Quantitative Interview Results…………………………………………...... 28
4.1.3.1 The perceived quality of the fruit section from the viewpoint of the customer……………………………………………...... 28
4.1.3.2 The first fruit noticed upon entering the fruit section…….........… 29 4.1.3.3 If consumers picked the first fruit they store after entering the fruit section………................................................................. 31

- Arvidsson - Palmgren - Rowland -
5
4.1.3.4 If customers picked any other fruit other than the first item they saw upon entering the fruit section……………........................ 32 4.1.3.5 If consumers thought their chance of partaking in impulse purchases increased if they were reminded of or saw different fruit….. ... 33
4.1.4 Further Comments from the Quantitative Interviews……………………... 34 4.2 Qualitative Interview Results……………………………………………………….... 34 4.3 Store Data Results……………………………………………………………….....… 35 4.3.1 Overall Results……………………………………………………….......… 35 4.3.2 ICA Maxi, Malmö………………………………………………………….. 35 4.3.3 ICA Kvantum, Landskrona…………………………………………........… 36 5. Analysis……………………………………………………………………..........…… 37 5.1 Changes in Consumer Behaviour................................................................................. 37 5.2 Impulse Purchases........................................................................................................ 39 5.3 Layout........................................................................................................................... 40 6. Conclusion………………………………………………………….........................… 42 7. Further Research…………………………………………………………………..… 45 8. References………………………………………………………………………….… 47 8.1 Books………………………………………………………………………………… 47 8.2 Research Articles……………………………………………………………………. 47 8.3 Electronic Sources…………………………………………………………………... 49 8.4 Reports………………………………………………………………………………. 49 8.5 Other Sources………………………………………………………………………………….. 49 APPENDIX APPENDIX A – Observation Schedule............................................................................. 50 APPENDIX B – Quantitative Interview Questions........................................................... 51 APPENDIX C – Qualitative Interview Questions............................................................ 53 APPENDIX D – Maps to Show the Layout of Both Stores............................................. 54 APPENDIX E – Photo of the Fruit Section at ICA Kvantum, Landskrona...................... 55 APPENDIX F – Photo of the Fruit Section at ICA Maxi, Malmö................................... 56

- Arvidsson - Palmgren - Rowland -
6
-1-
Introduction In this chapter we present previous research within our field of study and argue for the relevance of our research problem in order to captivate the interest of the reader. The research question is then introduced, followed by the purpose of the study. Finally, the chapter ends with a disposition to give the reader an overview of the thesis. Today healthy food is high on consumers’ agenda (Marketing Week, 2007). In a study presented in the magazine “Marketing Week” 82% of the responding consumers said they try to eat healthy food, and more than 60% said that the healthiness of the food was the most important criteria when deciding what to buy (Marketing Week, 2007). However, research has shown that consumers’ attitude towards healthy food consumption does not correspond with the consumers’ actual eating behaviour (Reid et al., 2005). For instance, even though the proposition that fruit and vegetables are important components of a healthy diet is well established, intakes of these foods in most Western countries are well below the recommended five servings a day (Baker & Wardle, 2003, Reid et al., 2005, Lindström et al., 2001). The difference in consumer attitude and behaviour is a practical problem that is of great interest to investigate. According to Baker and Wardle (2003) nutritional knowledge has an influence on consumption intake and shows strong associations between knowledge and behaviour (Baker and Wardle, 2003). Consumers argue that retailers and manufactures should take the lead with regard to healthier food and provide the consumers with the information they need to make a well-informed decision (Marketing Week, 2007). Focusing on fruit, this could be achieved in the form of a quick checklist with the key facts on what constitutes a “portion” of fruit, for instance an apple or a banana (Marketing Week, 2007). Retailers could also work with the atmosphere and layout to encourage people to buy more fruit. Fruit as well as other products need to be promoted in the right way to increase sales and since today it is difficult for retailers to create competitive advantages through traditional ways such as price, promotion and quality, the store environment, layout and atmosphere have become new important marketing tools for influencing the customers’ mood and decision making process (Baker et al., 1992, Sherman et al., 1997, Babin & Attaway, 2000). The notion that atmospherics influence consumer behaviour and create pleasant experiences in order to increase purchases is widely accepted in the marketing literature (Turley & Milliman, 2000). 1.1 Previous Research Many studies have investigated different stimuli and how they affect the consumers in the store (Turley & Milliman, 2000). According to Kotler, a store atmosphere is absorbed through a person’s sensory channels; therefore the four main atmospheric dimensions in a retail context are visual (sight), tactile (touch), aural (sound) and olfactory (smell) (Kotler, 1973 cited McGoldrick, 2002). According to McGoldrick (2002), Markin et al (1976) are other researchers that identified the importance of the retail store environment in influencing

- Arvidsson - Palmgren - Rowland -
7
consumer decision making and behaviour. The layout design as noted by Larson (2005) can increase the probability of impulse purchases, which is an important aspect for stores to understand. The store layout is an important factor within store atmospherics (McGoldrick, 2002). Store layout and design involves the fittings, shelves, display fixtures, floor space and product categorisation (Turley and Milliman, 2000) and has been observed by authors such as Peter et al (1999) and Spies et al (1997) to have an impact on consumer behaviour and the type and number of goods purchased. One article that has contributed to the overall understanding of retailing and in-store marketing concepts is “The Effects of Merchandising and Temporary Promotional Activities on the Sales of Fresh Fruits and Vegetables in Supermarkets”, by Curhan in 1974 (Nordfält, 2007). This article is important for our previous research as it conducts one of the first experiments comparing different promotions focusing on fruit and vegetables (Nordfält, 2007). The Curhan (1974) experiment involved testing various promotional activities, such as varying price and display position, on fruit and vegetable products to see if there was an impact on their sales volume. Display location, meaning if the product is easily seen by customers, was noted by Curhan (1974) to bring about a more positive increase in sales volume than price. The same was true for increasing the size of shelf space thus making the products more prominent within the display (Nordfält, 2007). Another positive factor that would increase sales of fruit and vegetables as noted by Curhan (1974) was if the customer thought the available selection was original, new or surprising. Price therefore out of all the tested variables was considered to be the least influential in terms of increasing sales. 1.2 Problem Discussion Several research studies show that through changing the layout and store design one can influence consumer decision making and behaviour (Turley and Milliman, 2000). The Curhan article from 1974 is the only article we have found that explicitly investigates the store layout in combination with fruit and vegetable sales, implying that there is a lack of relevant research to this particular subject area. Our research will be involved in moving one aspect of the fruit section to create an overall increase in fruit sales. It must be noted that although Curhan (1974) provides the most closely relevant article for our research, he observes a variety of categories for increasing fruit sales as opposed to our research where we are changing one layout aspect to generate an increase in fruit sales. There is no current research on increasing fruit sales through altering the layout, even though fruit is a product that is present in almost every supermarket. Product positioning has been discussed by several researchers (Turley & Milliman, 2000, Spies et al, 1997), although except for Curhan’s study in 1974, no research concerning fruit has been done within this area either. We therefore argue that there is a research gap within the field of layout and product positioning regarding the effects on fruit sales in a retail setting. This theoretical problem, in combination with the practical problem of consumer attitudes and indications of wanting to eat more healthy but not behaving that way, made us wonder how a change in layout can affect total sales and consumer behaviour. This study will aim to enhance previous research on in-store promotion and layout with emphasis on the fruit section, an area which is currently lacking in appropriate exposure. As Curhan’s (1974) article is the only relevant article, specifically concerning consumer behaviour and fruit sales (Nordfält 2007), we feel our investigation will increase the academic knowledge on the subject as well as offering a modern study within the field. There are also important differences which distinguish our research from Curhan (1974) and highlight a

- Arvidsson - Palmgren - Rowland -
8
research gap to be tested. Curhan (1974) makes lots of changes in the store environment, testing four fruit and vegetable categories and also making several alterations to the store layout to determine the variation in number of sales of the products. Our investigation only involves moving one popular fruit display, a tactic which has not been tested before, aiming to draw customers further into the fruit area, thus becoming aware of more fruit products and aiming to increase sales as a whole. The idea is to create one simple change in order to greatly increase overall fruit sales by also causing as little disruption as possible for the store and employees. A simple change also means that the methods used in this investigation are easy for a retailer to adopt; the investigation is therefore relevant on a practical level. 1.3 Research Question Based on the above discussion, our research question is the following:
To what extent could fruit sales and a consumer’s intention towards making impulse purchases be affected by changing the layout of the fruit section in a supermarket?
1.4 Purpose of the Study The purpose of this study is to examine the change in consumer behaviour regarding the intention towards buying fruit when the layout of the fruit section has been altered. We want to increase the probability of making impulse purchases by altering the layout. Key words: Consumer behaviour: refers to which fruit the customer picks up on the shopping trip. Intention to buy: refers to the items the customer picks up and places in their basket. We cannot follow the customer to the cash till, so all picked items we assume are intended to be bought. Impulse purchases: unplanned items that the customer chooses spontaneously on their shopping trip 1.5 Disposition of the Thesis Chapter 1 – Introduction In this chapter we present previous research within our field of study and argue for the relevance of our research problem to captivate the interest of the reader. The research question is then introduced, followed by the purpose of the study. Chapter 2 – Methodology In the methodology chapter we begin with presenting the research approach. A short presentation about ICA AB then follows as well as a short introduction of the two selected ICA-stores. Secondly, we present and argue for the appropriateness of our choice of research

- Arvidsson - Palmgren - Rowland -
9
design and data collection method. This part of the chapter gives a detailed description of how the data was collected and is followed by a discussion on the validity and reliability. Chapter 3 – Theoretical Framework In this chapter we present previous research on consumer behaviour and in-store marketing. The chapter is designed to offer understanding of the concepts of in-store marketing specifically relevant to our study. The different sections in the chapter will demonstrate how consumer behaviour is constructed and influenced through decision making, the type of purchases and the overall store environment. Emphasis is concentrated on theories and opinions that are relevant to test during data collection. Chapter 4 – Results This chapter will display the results from the data collection. The quantitative data results will be first presented followed by the qualitative interviews and the findings from the store sales data. Chapter 5 – Analysis In this chapter we will analyse the results linking together arguments and models discussed in the theoretical framework from chapter 3. The results will be explained and reasons as to why certain factors have occurred will be presented. Chapter 6 – Conclusion In the concluding chapter we will evaluate the key points discovered from this experiment and present a final discussion concerning the most appropriate way to increase fruit sales. Chapter 7 – Further Research This chapter will discuss the future research opportunities specific to expanding the knowledge on consumer behaviour and the fruit section in supermarkets. Due to the absence of previous research concerning the topic, further research into this area will be beneficial from both an academic and practical perspective.

- Arvidsson - Palmgren - Rowland -
10
-2-
Methodology In the methodology chapter we begin with presenting the research approach. A short introduction of ICA AB and the two selected ICA-stores then follows. Secondly, we present and argue for the appropriateness of our choice of research design and data collection method. This part of the chapter gives a detailed description of how the data was collected and is followed by a discussion on the validity, reliability and the limitations of the study. To investigate the extent that fruit sales and consumer behaviour is affected when changing the layout of the fruit section in a supermarket we needed a popular fruit to use in the experiment. Since research shows that the banana is the world’s most popular fruit (www.chiquita.com, the Fairtrade Foundation, 2000), we decided to use the banana in this investigation. The reason as to why the banana is the world’s most popular fruit might be that it is naturally fat-free, contains vitamins and fibre, taste good and is a great source of energy (www.chiquita.com). In 2003, Sweden had the European record for the highest per capita banana consumption of 20.4 kg (Loeillet, 2004), a fact that further convinced us that the banana would be the best choice of fruit. Additionally, according to a report by the Fairtrade Foundation (2000) the banana is the most valuable food product in supermarkets, only outsold by petrol and national lottery tickets. Jimmy Nilsson from ICA Kvantum also commented that the banana is the third most popular product in terms of sales out of all other merchandise within the store. These facts, showing that the banana is a very popular product, made us wonder if moving the bananas to the rear of the fruit section, thereby making the consumer walk past all the other fruit on her/his way to the bananas, could affect a store’s total fruit sales. As the banana was popular, we believed that people would buy bananas no matter where they were positioned in the fruit section. By drawing the customers further into the fruit section we hoped to increase awareness of other fruit products and thus increase the likelihood of purchases, thereby increasing the sale of fruit as a whole. The investigation is not directly concerned with the sale of bananas per se but is testing the effects of layout change on consumers’ perceptions and behaviour with regard to their fruit purchases. Moving bananas is one way in which these factors can be tested. 2.1 Research Approach Our research problem, to investigate how the display layout can affect consumers’ buying behaviour towards increasing fruit sales, was deduced from existing theories, which according to Bryman and Bell (2007) is referred to as a deductive methodological approach. The theoretical framework, which includes the relevant existing theories for this investigation, guided us in the process of gathering data and was then used to evaluate the assembled information (Bryman & Bell, 2007). Our research study was performed in two ICA stores in agreement with each store’s fruit and vegetable manager. After realising that there was a lack of existing information specifically concerning fruit sales, consumer behaviour and store layout, we were grateful to be able to work with ICA to test our theories. Coop and Hemköp are two other Swedish food retail companies that could have been used in this research study in addition to ICA. Using several different food retailing companies may have given us the

- Arvidsson - Palmgren - Rowland -
11
possibility to generalise our findings to a further extent, however as ICA has a 36.8 percent market share in Sweden, we thought the store was an appropriate representative for our study. 2.2 ICA AB The ICA Group (ICA AB) is one of the Nordic region’s leading retail companies with approximately 2,250 own and retailer-owned stores in Sweden, Norway and the Baltic states. ICA AB is a joint venture, in which 40 % is owned by Hakon Invest AB and 60 % by Royal Ahold N.V. of the Netherlands. The Group includes the retail companies ICA Sweden, ICA Norway and Rimi Baltic (www.ica.se). Together with the ICA retailers, who own and manage their own stores as independent businesses, ICA Sverige AB is Sweden’s leading food retail company with a 36.8 percent market share. In the ICA Group’s yearly report (2007) the importance of combining the advantage of economies of scale with local adaptation is stated. Thus, the Swedish ICA-retailers purchase approximately 70 percent of their total stock via ICA Sweden, while the remaining 30 percent, mainly fresh produce and bread, come directly from local suppliers and producers (ICA AB Yearly Report, 2007). With a vision to make every day a little easier and a mission to be the leading retailer with a focus on food and meals, the Swedish ICA stores are divided into four store concepts depending on their size, sales, product range and geographic location. The four store concepts are ICA Nära (compromising smaller, conveniently located food stores), ICA Supermarket, ICA Kvantum (compromising larger supermarkets) and Maxi ICA Stormarknad (compromising hypermarkets where customers will find everything they need at advantageous prices) (www.ica.se).
The pie chart above shows
market share in Sweden in 2007 (ICA AB Yearly Report, 2007)
In 2007 the ICA Group reported a turnover of 82,326 MSEK (67,395), an increase of 22 percent from 2006. The operating income was 2,602 MSEK (2,297), an increase of 13,3 percent. ICA Sweden’s share of the ICA Group’s turnover is 62,5 percent and in 2007 this share equalled a turnover of 51,438 MSEK. ICA Sweden’s operating income in 2007 was 2,372 MSEK (ICA AB Yearly Report, 2007).
The pie chart above shows the division of ICA AB (ICA AB Yearly Report, 2007)

- Arvidsson - Palmgren - Rowland -
12
2.3 The Two Selected ICA stores The two stores that were selected for our research study were chosen in collaboration with ICA Fruit and Vegetables in Helsingborg. We wanted two stores that were similar in size and that belonged to the same ICA store concept, for instance, two ICA Maxi or two ICA Kvantum. The stores also needed to have the bananas positioned at the front of the fruit section in order to be suitable for the investigation. Ideally, the stores should also have the same layout within the fruit section. Furthermore, the store managers also had to be willing to let us perform our experiment in their stores and to agree to not have any other fruit promotions running during the same time period. These criteria, in combination with a geographical constraint limited the selection of stores. Thus, the two stores that were finally picked out for our study, in cooperation with Maria Wieloch at ICA Fruit and Vegetables in Helsingborg, were of two different store concepts; ICA Maxi, situated on Cypressvägen 4 in Malmö, and ICA Kvantum, situated on Östervångsplan 10 in Landskrona. After visiting the two stores we investigated and analysed the two fruit sections, making sure it still would be possible to conduct a research study comparing the stores, and finally we decided to use them even though they were of two different store concepts. The fruit section at ICA Maxi in Malmö is somewhat larger than the one at ICA Kvantum in Landskrona and the layout in the two fruit sections is not identical (see pictures in the appendix). However, the two stores both have the bananas positioned as the first product that greets the customer when entering the fruit section. This was the most important factor for our investigation making it possible for us to proceed. 2.4 Research Design 2.4.1 Experimental Design Our research study was conducted through a quasi-experimental design, where the layout in two ICA-stores was changed for a week. A quasi-experiment is a study that has certain characteristics of an experimental design, but that does not fulfil all the internal validity requirements (Bryman & Bell, 2007). According to Bryman and Bell (2007), a classical experimental design needs to involve both a control group and an experimental group, where the control group remains a control group and is not treated with the experiment. In this research study this could have been conducted by finding two identical stores, only altering the layout in one of them and then comparing the different findings in the two stores. However, just like most writers on quasi-experimentation, we have not used a control group as a basis for comparison (Bryman & Bell, 2007). In our study the customers in both stores all received the experimental treatment (the change in layout) as well as the control treatment (no change in layout). Thus, instead of comparing two different groups of people we have compared two different situational contexts and used the “normal” setting as a control treatment to observe differences in customer response and behaviour. 2.4.2 Triangulation To develop and enhance the understanding of the complex phenomenon being consumer response and behaviour can be problematic. In order to cross-examine our findings and overcome the limitations of one method by the use of another, we have used a triangulated approach (Bryman & Bell, 2007). Bryman and Bell (2007) state that triangulation makes it possible to combine different methods to compare findings and therefore reach a high validity and reliability. In our study we have combined structured quantitative observations, structured quantitative as well as qualitative interviews with secondary information in the form of sales data from the two selected ICA-stores.

- Arvidsson - Palmgren - Rowland -
13
Figure 1: Diagram to show the concept of triangulation We chose to use structured quantitative and qualitative interviews along with the observations in order to increase the understanding and the knowledge of consumer behaviour with regard to fruit purchases. With the quantitative interviews we wanted to find out whether or not consumers actually plan their fruit purchases or if it is a spontaneous decision. We also wanted to know which fruit the consumers first noticed on arrival to the fruit section and if they bought this fruit as well as other fruit. The qualitative interviews were conducted with the fruit and vegetable manager in each store, as well as with one store employee to offer further opinions. Only one employee was asked to limit the disturbance in the store. The structured qualitative interviews were used to discover employee perceptions resulting from the investigation. This allowed a more continuous insight to consumer behaviour as employee observations ran throughout the two week time period whilst our observations were restricted to four days in total. Furthermore, sales data provided from the stores enabled us to look at differences in sales in the stores from one week to the other and compare specific fruits. This made it possible to see if any specific fruit sales increased substantially after having moved bananas to the rear and if consumers still bought bananas even though they were “hidden” in the back. A more detailed explanation of the three different parts will follow in later sections. 2.4.3 Latin Square Design A Latin square design was used when conducting the research study. The Latin squares are useful to use in observation experiments as each observation variable is rotated in the system, making results fair and reducing the possibility of bias (research.microsoft.com). This investigation used the Latin squares when observing the differences in fruit sales as a result of moving the bananas in the ICA store. Nordfält (2007) discusses that the Latin square is an appropriate model to use when conducting experiments in-store. The formation allows for the stores to be split into two groups and be observed over two different time periods (Nordfält, 2007).
Week 16 (Tuesday-Monday)
Malmö ICA Maxi: Bananas Front (BF)
Week 17 (Tuesday-Monday)
Malmö ICA Maxi: Bananas Back (BB)
Landskrona ICA Kvantum: Bananas
Back (BB)
Landskrona ICA Kvantum: Bananas
Front (BF)
Figure 2: Table to show the Latin Square formation used for this investigation
In week 16, Tuesday 15/4 – Monday 21/4, the first week of observations, ICA Maxi in Malmö had bananas displayed in the front of the fruit section whilst ICA Kvantum in
Sales data Interviews
Observations

- Arvidsson - Palmgren - Rowland -
14
Landskrona had the bananas displayed at the back of the fruit section. In week 17, Tuesday 22/4 – Monday 28/4, the situation was reversed. In accordance with Nordfält’s (2007) description of the Latin square, both stores had the same changes, but the changes occurred in different weeks. The Latin square was chosen as a means to acknowledge the calendar effect during the experiment. The calendar effect concerns outside factors influencing the results and therefore reducing the reliability of the investigation. The Latin square counteracts the calendar effects by rotating the variables evenly between the stores over a certain time period. The bananas, for example, should not be placed at the front of the store during the same week as there is the possibility that changes in the sales volume are due to other factors and not solely resulting from the changing position of bananas. A week with warm weather could, for example, increase the probability of fruit purchases irrespective of the changing variable in our investigation. For our research study it was important to use the Latin square design, especially since many workers received their salary the second week of our experiment, a factor we believe increased the total sales in the retail stores. 2.5 Research Strategy 2.5.1 Quantitative Data Collection 2.5.1.1 Sampling The population for this research study, meaning the universe of units from which the sample is to be selected (Bryman & Bell, 2007), was everyone in the fruit section that bought some kind of fruit. Stratified random sampling was used, meaning stratifying the population by a criterion (fruit buyers) and selecting a simple random sample of these customers for observations and quantitative interviews (Bryman & Bell, 2007). As interpreting Bryman and Bell (2007) and Easterby-Smith et al (2006), the advantage of using a stratified random sampling is that the researcher has the advantage of using a random sample, giving each unit of the population an equal probability of inclusion but still only including people that are relevant for the study. Due to constraints of time and cost we decided to limit the sample size to a total of 120 quantitative interviews, approximately 30 in each store each week (aiming for 15 interviews/day Thursday and Friday), and 640 observations, approximately 160 in each store each week (approximately 80 observations/day Thursday and Friday). According to Bryman and Bell (2007) the greater the sample size, the more precise the results. For our study, with more time we would be able to gather more results, however, the amount of data collected was a realistic number for the hours of observation. The number of results we gathered was also sufficient enough for our study and statistical analysis, as, according to Johan Anselmsson, the minimum amount of observations needed for our statistical formulas is 30. To eliminate the likelihood of non-responsive questionnaires/interviews and misunderstandings, the researcher directly noted down the answers, making sure that the questionnaires were correctly answered.

- Arvidsson - Palmgren - Rowland -
15
2.5.1.2 Observations In order to fulfil the purpose of the study, to increase the knowledge of consumer behaviour regarding intentions to make fruit purchases, observations were used. The observations were used to measure the consumer’s overt behaviour in the fruit section of the ICA stores. Observations are the main way for marketers to measure a consumer’s purchase decisions and therefore are an integral part of understanding consumer behaviour (Bryman & Bell, 2007). Easterby-Smith et al (2006) demonstrate that there are several ways to conduct observations such as, observing as an employee, to observe every day of the investigation, to observe sporadically, and to observe alone. The method of observation is dependent upon the investigation characteristics and abilities and resources of the researcher, each method has positive and negative aspects to take into consideration. This investigation is mainly concerned with sporadic observations, and has been dependent upon the time constraints apparent from completing the investigation, the level of access to the stores as well as the nature of the investigation not being hinged on taking observations every day. The observations were conducted systematically using a three point classification. Systematic observations, according to Bryman and Bell (2007) involve monitoring consumer behaviour following a schedule of categories. Since the purpose of the study is to increase the knowledge of consumer behaviour and attitude with regard to fruit purchases, consumer behaviour was marked numerically according to produce they bought, 1 corresponded with buying a banana; 2 corresponded with buying bananas and additional fruit; and 3 corresponded with buying fruits other than bananas. Displaying the observations numerically produced quantifiable results. Making the observations quantitative in nature ensures that the results are fast and efficient to record. This is especially important in the investigation as a large number of consumers have to be observed at a similar time (Bryman & Bell, 2007). The observations were noted down in a tally effect, allowing for efficient data collection and limited loss of time. Using the three point classification also meant that all observers were noting the same types of behaviour; there was little room for misinterpretation of consumer actions. Each researcher knew which behaviour to focus on when conducting the experiment. Details of the observation schedule showing exact reasons for categorisation can be found in the appendix section at the end of the report. Each consumer in each store was monitored in the same way in order to improve the reliability of the results (Bryman & Bell, 2007). As three people were involved in the observation process (the researchers) a pilot study was first conducted to ensure that each person knew what to observe and to understand which category corresponded to which type of behaviour. The pilot study was conducted in an ICA-store in Lund two days before the first observations were carried out, the data collected was not used in the thesis. As the pilot study was merely an exercise and therefore not dependent upon location; the ICA-store in Lund was selected out of convenience for the researchers. The study was designed to test the observation techniques and to reduce the possibility of human variation and error, for instance to make sure that the researchers counted the same products as fruit and not as vegetables. The advantages of using a systematic form of observation were noted by Bryman and Bell (2007) as allowing consumer behaviour to be observed and results noted down as the actions are occurring. The results rely on the observations of the researchers thus eliminating bias from the part of the consumer (Bryman & Bell, 2007, Easterby-Smith et al 2006). Consumers might have forgotten their actions especially if making low involvement purchase decisions as is common in a supermarket. Noting own behavioural patterns is also difficult to monitor,

- Arvidsson - Palmgren - Rowland -
16
thereby having an outsider observe the situation is much more effective and efficient (Bryman & Bell, 2007). Further important characteristics of observation behaviour are important to note for this investigation. Underhill (2003) notes that observation techniques are most effective when the observer is standing to the side of the customer, so not to be registered in the consumer’s peripheral vision. The observer must be discrete when conducting observations as not to disturb the natural actions of the consumer. The consumer may feel vulnerable or self-conscious if they feel that their actions are being scrutinised and therefore may not act normally. It was sometimes difficult to observe the consumers without being noticed as the fruit sections in both stores had fruit on both sides of the tables. To be able to see if the customer picked a fruit or only looked at it or touched it, the researcher had to follow the customer, making it impossible to always be outside the customers’ peripheral vision. The most effective method was for the researcher to act like she herself was shopping for fruit thereby staying relatively discrete and unnoticed when conducting the observations. The observations took place in weeks 16 and 17 on Thursday and Friday for each week in both the Malmö and Landskrona store. In accordance with the Latin square design and to keep as many variables in the investigation the same as possible, each store was observed on the same day and at the same time. The only factor being measured in the investigation is the change in consumer behaviour brought about by the change in layout of the bananas. All other variables remain constant to increase reliability of the gathered data (Bryman & Bell, 2007). Thursday and Friday were the chosen days of the week as, according to ICA, these are the two days of the week when most customers visit the store. We therefore thought we could gather the most amount of information by observing consumers at this time. The ideal situation would have been to conduct the observations several days each week, including the weekends, however, due to time constraints we had to limit our study to two days per week per store. On Thursdays the observations were carried out between 10.30 a.m. and 12.30 p.m. and quantitative interviews were carried out between 2.30 p.m. and 4.30 p.m. On Fridays however, the structure changed slightly as interviews were carried out in the morning and observations conducted in the afternoon. This was decided to be the most appropriate format of data collection on a Friday as shoppers would have more time to talk in the morning rather than in the afternoon when there is a rush to get home. Ideally observations would be carried out all through the day, however, for this scale of investigation, such data was not needed nor did time allow. 2.5.1.3 Structured Quantitative Interviews In order to increase the knowledge of consumer behaviour with regard to fruit purchases, structured quantitative interviews were used along with the observations. The structured quantitative interviews were used to determine consumer opinions about their fruit consumption. This interview technique, according to Easterby-Smith et al (2006) is a good and effective way of gathering quantitative data in market research. Structured interviews were used in order to standardise the asking and recording of answers and to keep interviewer-related errors to a minimum (Bryman & Bell, 2007). The interview questions can be found in the appendix section of the investigation. The interviews took a quantitative form requiring the participant to either respond with yes or no answers, which were coded as 1 and 2 respectively, or in accordance to the Likert scale measuring level of agreement numerically from 1 (strongly disagree) to 7 (strongly agree). The use of closed

- Arvidsson - Palmgren - Rowland -
17
ended questions with the Likert scale means that the data can be plotted with ease on the computer programming system for data analysis (Bryman & Bell, 2007). Quantitative interviews were preferred in this instance as it made the data collection technique much more efficient in the grocery store setting. Using short quantitative interviews reduced the time needed for respondents’ answers and thus did not encroach too much on their shopping time (Bryman & Bell, 2007). Using only six short answered questions increased the probability of consumers being willing to participate in the investigation (Bryman & Bell, 2007); however, a lot of customers still claimed they did not have time to participate in the study. Although qualitative answers could be perceived as useful to provide greater insight of consumer attitudes towards fruit (Bryman & Bell, 2007), we decided that such a level of detail was not relevant for this particular study. 2.5.1.4 Secondary Data Our secondary data is in form of sales information from the two selected ICA-stores. The stores provided us with data regarding the total fruit sales during the two weeks of the testing period, as well as data regarding only the banana sales. The secondary data provided by the stores enhanced the opportunity to look at differences in sales in the stores from one week to the other and has thus increased the validity of the research study (Bryman & Bell, 2007). According to Bryman and Bell (2007) and Easterby-Smith et al (2006), secondary data has great advantages for time and cost limitations but it is still classified as high quality data. 2.5.2 Qualitative Data Collection 2.5.2.1 Structured Qualitative Interviews To increase the understanding of consumer behaviour and attitude with regard to fruit purchases and to enhance the reliability of the study, structured qualitative interviews were also used. The structured qualitative interviews were used to discover employee perceptions resulting from the investigation. This allowed a more continuous insight to consumer behaviour as employee observations ran throughout the two week time period whilst our observations were restricted to four days in total. Before starting the experiment the fruit and vegetable managers and their employees were informed as to what was going to be observed and what questions the customers were going to be asked. Furthermore, we stressed that any comments from the employees regarding the customer’s reactions to the change in layout and the resulting buying behaviour would be appreciated after the testing period. In the end, the fruit and vegetable manager of each store was approached to take part in the interview as was one floor level employee. The interviews were conducted after the two weeks of experimentation to ascertain employee reactions and personal observations during the investigated time period. The staff’s opinions of the customers’ reaction to the change in layout were contrasted with the results from the researcher observations. Qualitative interviews were used as it was the most appropriate way to gather outsider opinions on the quality of the investigation and thoughts on which layout resulted in the most favourable sales of fruit for the ICA stores. A qualitative approach was used in favour of another quantitative interview as for this section of the results it was important to gain more in-depth personal answers to analyse and not simply use numerical data (Bryman & Bell, 2007). To keep interviewer-related errors to a minimum, the qualitative interviews were also of a structured nature (Bryman & Bell, 2007).

- Arvidsson - Palmgren - Rowland -
18
2.6 Data Analysis SPSS was used to analyse the collected data, which as noted by Easterby-Smith et al (2006), is an excellent program to use for displaying statistics due to its large range of statistical methods and effective editing and labelling features. Cross tabulation and chi-square were the methods used to analyse the yes and no answers from the quantitative interviews. For the quantitative interview answers in the form of a 1-7 Likert scale we chose to construct pie charts as these are easy to understand giving an overview of how consumers responded to the questions. The observation data was analysed and put into bar charts using Excel. 2.7 Reliability and Validity The use of triangulation and the combination of quantitative and qualitative methods make the research study reach a higher level of validity and reliability (Bryman & Bell, 2007). A quasi- experimental design can be argued to have a negative effect on the internal validity of the study (Bryman & Bell, 2007). However, we consider the combination of observations and interviews as having high validity, thus compensating the negative aspects. High validity when conducting the observations was achieved by keeping a discrete role when observing, using a clear and structured observation schedule and by pre-testing our observation skills in a pilot study. The pilot study ensured that we were conducting the observations in the same manner measuring the same things. High reliability was ensured through exposing the customer to exactly the same stimuli in the same retail context during both the interviews and the observations. Additionally, by using the Latin square research design, thus acknowledging the calendar effect on the findings, we have ensured greater reliability and validity of the results. Following advice from Easterby-Smith et al (2006) we note that for our investigation to be valid and reliable there are several measures that have to be taken into consideration. All measures used in this study are realistically constructed so they can be carried out by any form of researcher, meaning that anyone would be able to test our findings in the future. In conjunction with observing consumers, employee and manager interviews were conducted to gain a greater understanding of consumer movements and perceptions, thus increasing the validity of the findings. The use of the Latin square has enabled us to take into consideration the calendar effect which occurs during the investigation. By taking this precaution of eliminating anomalies, our results will be more significant and therefore more likely to be proven if the experiment was to be repeated. Taking the calendar effect into consideration increases the internal validity of the research study. The trustworthiness of the derived conclusion is increased as the external factors affecting the causal relationship between the two variables (fruit sales and the change in layout) are reduced. (Bryman & Bell, 2007). Due to time and financial constraints we were only able to conduct the experiment during two weeks, one week being the control. With more time and more money we would have been able to gather more data from different periods of the year which would have strengthened our results. A longer amount of time would also have allowed us to perform the research in more than two stores, in different parts of Sweden and not only in Skåne. It would also have been of great interest to compare different companies, but due to time and resource limitations, we have only performed the experiment in ICA stores and have excluded other retail environments. The results can be generalised beyond the specific research context of the study, for instance we expect the results to be relevant to the fruit section in Coop stores, giving us a high external validity (Bryman & Bell, 2007). As the study was conducted in

- Arvidsson - Palmgren - Rowland -
19
Sweden, the result is not applicable in other parts of the world, where the banana might have a different role and importance, a fact that decreases the external validity to a degree. Again, due to the time limit of the investigation, observations and interviews were only performed during Thursdays and Fridays. Data collection throughout the whole week would have provided us with more data, and thus would have increased the reliability of our findings. To strengthen our findings we originally wanted to collect sales data from 40 ICA stores, 20 stores with the bananas in the beginning of the display section and 20 stores with the bananas in the end. However, after discussing the idea with ICA Fruit and Vegetables, we realised that this was an impossible notion due to the fact that every ICA store owns there sales data and are very protective of their integrity.
- Arvidsson - Palmgren - Rowland -
20
-3-
Theoretical Framework In this chapter we present previous research on consumer behaviour and in-store marketing. The chapter is designed to offer understanding of the concepts of in-store marketing specifically relevant to our study. The following sections will demonstrate how consumer behaviour is constructed and influenced through decision making, the type of purchases and the overall store environment. Emphasis is concentrated on theories and opinions that are relevant to test during data collection. 3.1 Relevance of Theories The purpose of this investigation is to examine the change in consumers’ behaviour, regarding their intention to buy fruit when the layout of the fruit section has been changed. The new layout will force the customer into the fruit section and thus become aware of other fruit alternatives in addition to the fruit they had planned to buy. The relevance of each theory will be discussed in this paragraph; the theories will then be further evaluated and explained under their separate headings in this chapter. The consumer behaviour theory will be used to monitor the way consumers act around a store environment, and to find out which different action strategies the consumer chooses. This can give us an idea of the most appropriate positioning of the bananas when changing the layout of the fruit section. The second theory that will be used in this investigation is the decision making model. Noting how the consumers defer from their planned purchases to unplanned purchases is relevant for determining if the store layout can contribute to stimulating needs in the consumer that will result in an overall increase in sales of the fruit section. The next theory, the theory of planned behaviour, is useful to acknowledge as it combines knowledge of actual behaviour with intended behaviour. The investigation is concerned with increasing the sales of fruit through changing the layout of bananas. The bananas are thus acting as a catalyst to change consumer behaviour within the store. The movement of bananas will demonstrate if consumer behaviour is, for the majority of the time, a planned action, i.e. if consumers will buy bananas wherever they are positioned and therefore notice other fruits after the bananas have been moved, or if they are more of an impulse purchase that can easily be forgotten on the shopping trip. This knowledge will help to discover the optimal positioning tactics to increase the total number of fruit sales. The fourth theory discusses the characteristics of impulse buying behaviour and will be used to analyse the results from the observations and data collection. This will help us to understand if the display of the popular merchandise has an influence on consumer behaviour and purchase decisions which might in turn lead to an increase in sales of other products in that particular category. The next section concerns theories related to layout. The information will be used in the analysis to understand and acknowledge the changes in observed behaviour and purchase activity. This investigation will alter the layout of the fruit section by moving the position of the bananas. Changing the layout in this manner will hopefully alter the behaviour of the consumers in terms of route taken and purchases made. The consumer route

- Arvidsson - Palmgren - Rowland -
21
will also be discussed and be of interest in the analysis especially when noting the purchase behaviour of customers when the position of the bananas has changed. Finally the Mehrabian-Russell model will be used. The model is relevant to the investigation, in so far as by moving the bananas we are altering the in-store stimulus, thus harbouring the hope of altering the consumer response, resulting in an observed change of behaviour. 3.2 Consumer Behaviour Consumer behaviour is noted by Peter et al (1999) as the “physical actions of consumers that can be directly observed and measured by others” (Peter et al 1999:19) and is the essence of what is being investigated in this study. Consumer behaviour that can be measured is known as overt behaviour as opposed to the cognitive process of consumer thinking and mental activity involved with making decisions. Overt behaviour is the only way in which marketers can physically see consumer actions and, although most marketing strategies are designed to affect the consumers’ cognition, overt behaviour can be influenced in stores such as through promotional displays and discounts (Peter et al 1999) Peter et al (1999) observe that the consumer’s ability to understand the surrounding environment and combine this understanding with previous product knowledge whilst still recognising likes and dislikes of the new information will contribute to overall shopping behaviour. The shopping behaviour, as defined by Darden and Dorsch (1990) involves the implementation of different action strategies devised by the individual consumer. The outcome of the strategies can either produce positive or negative consequences for the consumer, such as from being happy with a purchase or dissatisfied after evaluating the experience. Understanding the way in which consumers develop their strategies will help retailers better organise their merchandise to appeal to the likes and convenience of the consumer. Peter et al (1999) also note that interpretation of new information is related to two cognitive processes of attention and comprehension (Peter et al 1999). Attention is concerned with “how consumers select which information to interpret and which to ignore” and comprehension is concerned with “how consumers determine the subjective meanings of information and thus create personal knowledge and beliefs” (Peter et al 1999:44) This model can help marketers and retailers to understand the most appropriate positioning of products, designing the layout of the store and making the environment an amiable place for them to stay, all with the purpose of increasing sales. 3.3 Decision Making Model Consumer decision making is the most important aspect for marketers to understand (Peter et al 1999) Consumers make decisions constantly from deciding in which locations to shop, to the type of advertisements they will spend time processing and ultimately to the product they will decide to buy. The decision making process is most commonly seen using the five-step problem solving model, also known as cognitive approach (East 1997 cited Nordfält 2005) The five steps, noted by Nordfält (2005) are need recognition; search; pre-purchase alternative evaluation; purchase and outcomes. The model shows the sequence of actions consumers go through

- Arvidsson - Palmgren - Rowland -
22
when involved in shopping activities. Most shopping activities are goal oriented (Darden and Dorsch 1990), meaning that the consumer has a set plan in mind of what to purchase before setting out on a shopping trip. 3.4 The Theory of Planned Behaviour The theory of planned behaviour was created by Fishbein and Ajzen (1985) as an expansion from their 1975 study of the theory of reasoned action (cited Darden & Dorsch 1990). The theory of planned behaviour examines the consumer’s attempt to execute their pre-conceived strategy of action. As Peter et al (1999) notes, people may intend to complete certain actions, but in truth these plans may not be fully realised. In a shopping context this may be due to lack of financial ability, lack of resources or availability of the goods being sought after. The theory is therefore concerned with intentions towards buying a product and if the intentions are realised.
“…it assumes consumers consciously consider the consequences of the alternative behaviours under consideration and choose the one that leads to the most desirable consequences and that seems realistic to carry out” (Peter et al 1999:130)
The consumer’s intentions towards deciding which item to purchase are thought to be based after evaluation of the appropriate alternatives. Intentions are often noted to be the best insight marketers can have towards purchasing decisions before they actually occur (Peter et al 1999). Monitoring consumer attitudes towards selected products can offer some indication of purchase behaviour although, the true popularity of the product cannot be observed until physical purchase has taken place. 3.5 Impulse Purchases Impulse purchase as noted by Stern (1962) concerns consumers buying products which they had not planned. Dagnoli 1987 (cited Drèze et al 1994) observe that when most people go shopping only one third of the purchases made are from planned decisions. This illustrates the point that spontaneous actions are likely to take over, especially in a convenience store situation where consumers only need to make low involvement decisions when buying goods. The significance of impulse purchases can be seen to have increased over the years with regard to the number of articles written on the subject, for example authors such as McGoldrick (2002) and Stern (1962), have researched the area. The level or likelihood of impulse purchases can be influenced by the store atmosphere and the in-store promotions. McGoldrick (2002) observes that price, personnel, packaging, display and degree of information in store can all have an impact on the consumers’ receptiveness to engage in impulse buying. Stern (1962) devised four categories to explain the differences of impulse purchasing: (1) pure impulse buying where the consumer enjoys a novelty product and which goes against normal buying behaviour; (2) reminder impulse buying for when the consumer buys an unplanned product due to being reminded of the need whilst shopping; (3) suggestion impulse buying when the consumer creates a need from seeing the product but has not actually used it before; and (4) planned impulse buying when the consumer has decided to buy a particular product but will be swayed depending on price and offers on alternatives. Stern (1962) notes that to encourage impulse purchases, the retailer should promote the selected product in a prominent display setting because, highlighting the product effectively can cause the

- Arvidsson - Palmgren - Rowland -
23
consumer to recognise a need for buying that product. Perishable goods, as recognised by Stern (1962) are often routine purchases and not necessarily noted down as planned items on a shopping list. Encountering the item in store is often the only way the consumer will remember to complete the purchase, display of goods is therefore seen as paramount when designing a retail environment. McGoldrick (1982) as cited in McGoldrick (2002:489) simplified Stern’s (1962) original categorisation for impulse purchasing. McGoldrick (1982) also devise for segments; specifically planned purchases, generally planned purchases, reminder purchases, entirely unplanned purchases. The revised addition follows a similar criteria to Stern (1962) study, however is noted by McGoldrick (2002) to be easier to implement in an experimental setting. An understanding of the varying types of impulsive behaviour can provide insight into the correct methods of displaying goods to generate the optimal amount of sales. Channelling consumer behaviour is a difficult task especially within the FMCG industry where consumer behaviour is likely to be routine. Gaining the consumer’s attention in a familiar setting could lead to an increase in unplanned purchases and therefore a greater amount of sales and profit for the store (Nordfält 2005). 3.6 Four Atmospheric Dimensions The atmospheric dimensions refer to creating a pleasant retail environment by tactically using aural, scent, taste and touch senses to stimulate a consumer response. The dimensions are inter-linking factors that influence consumer behaviour and cognition and have been discussed in many works (Hu & Jasper 2006; Bellizzi & Hite 1992; Yildrim et al 2007; Bäckström & Johansson 2006; Turley & Milliman, 2000; Yalch & Spangenberg, 1990 and Mattila & Wirtz, 2001). These factors, however, are not specifically used for data collection in this investigation as it would require too many variables to be tested at one time and this would not be possible to accurately measure under the time constraints and with the number of persons available for data collection. As these factors are not being measured in this instance they will not be discussed in any greater detail. The only factor of interest that is directly relevant for this study is the issue of store layout and design. 3.6.1 Layout and Store Design The layout another important factor contributing to the store atmospherics and has been observed by authors such as Peter et al (1999) and Spies et al (1997) to have an impact on consumer behaviour and the type and number of goods purchased. Store layout and design involves the fittings, shelves, display fixtures, floor space and product categorization (Turley & Milliman, 2000). Spies et al (1997) especially notice that the store layout is a part of the environmental stimuli experienced by consumers. Different layouts can therefore have varying effects on consumer actions. Peter et al (1999) note two main types of store layout, these are, grid design and free-flow layouts. Grocery stores typically follow the grid design pattern opting to display goods along aisles with occasional centre fixtures. In these environments consumers tend to move in a similar pattern to each other, using the aisles as a guideline to travel through different product categories. “…most customers move through the store in a counter-clockwise direction with their attention being concentrated on the wall sides” (Spies et al 1997:2) Authors such as Bäckstöm and Johansson (2006) and Spies et al (1997) agree that store layout is an important factor to enhance the shopping experience for consumers and also observe that

- Arvidsson - Palmgren - Rowland -
24
a coherent design can help create a positive mood to encourage purchases. Spies et al (1997) note that a logical store layout will please customers as it will make them feel in control of the shopping experience. Controlling tasks such as completing intended purchases will create positive feelings in customers and encourage the chance of a repeat visit. Parker et al (1989) also note that a logical distribution of products can increase the likelihood of product switching or impulse purchases. Products which are categorised in a logical manner can stimulate needs in the customer, instead of buying one product; they will be reminded of another need and purchase accordingly in order to fulfil that need. The store layout needs to be clear in structure for the consumer to follow easily. Cluttered spaces and inconsistency with product categories and information can leave the customer feeling disoriented and annoyed. (Bäckstöm & Johansson 2006) Feelings of dissatisfaction will harm the overall impression of the store environment and is expected to reduce level of sales. Disorganised, cluttered displays of products will not encourage impulse buys. Authors such as Park et al (1989) realise that knowledge of the store can have an impact on consumer behaviour. Familiarity in design aides the shopping process as goods can be found easily thus increasing satisfaction for the customer and generates a positive image of the store. Familiarity however, can also stifle impulse buys as consumers only move in the selected departments where they know they can find the item they are specifically searching. It can then therefore be argued that frequently changing designs can have a positive impact on consumer spending, although, as Wilkinson et al (1982) discovered, changes in displays maybe are only short term solutions for increasing unit sales of products. Customers will then have to walk around the store to find the goods they need, thus being exposed to a greater variety of products and increasing the probability of unplanned purchases. The changes to the store layout, however, should be conducted in a relevant manner so to create feelings of interest and unexpectedness which enhances consumer spending rather than creating feelings of confusion and annoyance (Spies et al 1997). 3.6.2. Consumer Route Park et al (1989) note that use of in-store information such as signs and discounts are of use to customers in an unfamiliar setting. As they are not used to the layout of the store, they are guided by the information they receive from the direct surroundings. Efficient signs can help to direct consumers through the store and also highlight the range of products. Peter et al (1999) note that grid designs are the most common layout for grocery stores. Customers are expected to move up and down the aisles when purchasing products, creating an image of the consumer covering the full structure of the store through their own initiative. This view however, according to Larson et al (2005), is purely an assumption and is not based on observing genuine actions. The study conducted by Larson et al (2005) involved tracking customers in grocery stores through a radio frequency identification (RFID) device attached to their shopping cart. The movement of the cart was plotted on maps demonstrating the actual consumer route throughout their shopping trip. The findings showed that in reality consumers rarely travel in a linear style up and down the aisles, instead the most common action is to dip in and out of the aisles and sporadically travel to the centre. Most of the shopping activity is therefore seen around the perimeter of the store, select passageways are also singled out rather than covering the whole floor space. Larson et al (2005) concluded that the most “face time” products received was when they are positioned at the end, rather than the centre of the aisles. This therefore is expected to have an impact on sales.

- Arvidsson - Palmgren - Rowland -
25
3.7 The Mehrabian-Russell (M-R) Environmental Psychology Model The Mehrabian-Russell model monitors the change in consumer behaviour when exposed to varying stimulus in a shopping environment. The model was first introduced by Donovan and Rossiter in their 1982 study (Donovan et al 1994) and has subsequently been used by other researchers such as Turley and Milliman (2000), Thang and Tan (2003) and Yoo et al (1998), to name a few, as a foundation for their own studies. The extensive use and variations to the Mehrabian-Russell model indicates its importance and relevance within the marketing psychology field. The model is made up of stimulus, organism and response (S-O-R) characteristics. Stimulus refers to the changeable elements in a store, also known as store atmospherics. Atmospherics, as discussed in earlier sections, concerns visual, aural, olfactory and tactile elements which contribute to the feeling of the store. Changing the atmosphere in the store will alter the consumer perspectives of the overall environment and induce feelings of pleasure or disappointment. The consumer acts as the organism in the model, the feelings experienced are a result from interpreting the store atmosphere and can make the consumer feel pleasure, satisfaction, excitement or, in unpleasant environments, disappointment and annoyance. As Sherman et al (1997) note, the stimulus is the catalyst to change the internal feelings of the consumer. The way the consumer instantly feels with regard to the store environment subsequently affects their attitude and behaviour. Responsive actions can include the volume of items purchased, time spent in the store, money spent in the store and like or dislike toward the shopping environment (Sherman et al 1997). A customer who is happy in the store environment is more likely to purchase products and spend more time browsing, whilst an unhappy shopper is more likely to leave the store quickly without making purchase transactions. Likelihood of repeat visits is also less expected for an unsatisfied consumer. Donovan et al (1994) describe how the consumer response is measured according to three states; pleasure/displeasure, arousal/non-arousal and dominance/submissiveness. The levels of pleasure, arousal and dominance would affect the extent to which consumers are drawn to the store and if they would approach or avoid the environment.

- Arvidsson - Palmgren - Rowland -
26
-4-
Results This chapter will display the results from the data collection. The quantitative data results will be first presented followed by the qualitative interviews and the findings from the store sales data. During week 16 and 17 we conducted 640 observations and 120 quantitative customer interviews in an ICA Maxi in Malmö and an ICA Kvantum in Landskrona. Gender and age were not measured in the investigation as it was irrelevant to this particular research study. Although these can be interesting factors to measure, we, in this study, are concerned with consumers’ purchase behaviour towards fruit as a whole and not specifically towards the habits of males and females separately.
4.1 Quantitative Data Collection
4.1.1 Overall Observation Results Fig. 3 below shows the total amount of observations taken for both ICA Maxi and ICA Kvantum when the bananas were positioned at the front of the fruit section. As demonstrated, the majority of consumers picked both bananas and other fruit with the second most common occurrence being only picking other fruit. The least amount of people just picked bananas.
Fig. 3: A bar chart showing the total amount of observations when bananas are positioned at the front of the fruit section
�
020406080
100120140160180
1 = only picked bananas
2 = picked bananas + other f ruit
3 = only picked other f ruitN
um
ber
of
cust
om
ers
Fruit purchases
Observations, bananas in the front
- Arvidsson - Palmgren - Rowland -
27
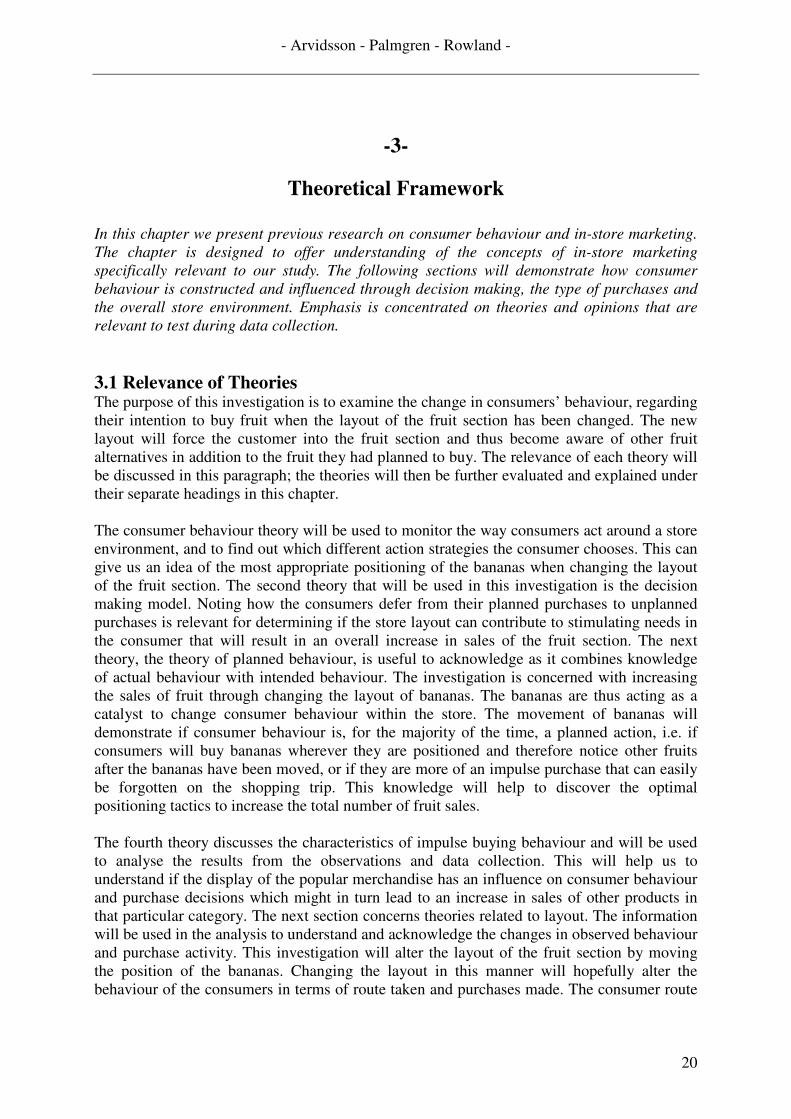
Figure 4 below indicates the total number of observations for both ICA stores when the bananas are positioned at the back of the fruit section. In this case a similar number picked both bananas and other fruit as the group who only picked other fruit. The number of customers who only picked other fruit increased when the bananas were at the back of the fruit section, while those who picked bananas and other fruit decreased in numbers. Again, the smallest group of people were those who just picked bananas. Fig. 4: A bar chart showing the total number of observations when bananas are positioned at the back of the fruit section.
4.1.2 Further Observation Findings While conducting the observations additional consumer behaviour, other than simply picking the fruit, was found. For instance, we noticed that many customers spent a lot of time wandering around the fruit section, touching the fruit, picking it up, putting it back again or deciding to put the fruit in their basket. The customers more or less chose to walk the same route in the fruit section, even though these routes did not seem systematic and logical, logical meaning walking down one aisle and up the other one. Many people did not appear to know what to buy at first, but walked around to see what looked appealing and selected that. Other customers seemed to have planned to buy one or two certain types of fruit and walked directly towards that fruit before looking at anything else.
�
020406080
100120140160180
1 = only picked bananas
2 = picked bananas + other fruit
3 = only picked other fruit
Nu
mb
er o
f cu
sto
mer
s
Fruit purchases
Observations, bananas in the back

- Arvidsson - Palmgren - Rowland -
28
4.1.3 Quantitative Interview Results 4.1.3.1 The perceived quality of the fruit section from the viewpoint of the customer Fig. 5: A Table showing the percentage of customers who perceived the fruit section as high quality
Frequency Percent Valid Percent
Cumulative
Percent
2,00 1 ,7 ,7 ,7
3,00 5 3,6 3,6 4,3
4,00 8 5,7 5,7 10,0
5,00 48 34,3 34,3 44,3
6,00 44 31,4 31,4 75,7
Strongly agree 34 24,3 24,3 100,0
Valid
Total 140 100,0 100,0
Fig. 6: A pie chart demonstrating the percentage of customers who perceived the fruit section to be of high quality.
As seen from Fig. 5 and Fig. 6 above, 90% of respondents perceived the fruit section to be of high quality, marking it as level 5 and above. Spontaneous comments from the interview with customers stated that the fruit section continues to improve, especially as indicated from customers in the Landskrona ICA Kvantum.

- Arvidsson - Palmgren - Rowland -
29
4.1.3.2 The first fruit noticed upon entering the fruit section Fig. 7: A table demonstrating which fruit the customers first saw upon entering the fruit section the week the bananas were positioned at the back of the display
What was the first fruit you noticed as you came into the fruit section?
Frequency Percent Valid Percent
Cumulative
Percent
Apple 14 20,0 20,0 20,0
Pear 6 8,6 8,6 28,6
Citrus fruits 16 22,9 22,9 51,4
Grapes 13 18,6 18,6 70,0
Bananas 3 4,3 4,3 74,3
Melon 8 11,4 11,4 85,7
Plum 1 1,4 1,4 87,1
Pineapple 2 2,9 2,9 90,0
Other fruit 7 10,0 10,0 100,0
Valid
Total 70 100,0 100,0
Fig. 8: A pie chart demonstrating which fruit the customers first saw upon entering the fruit section the week the bananas were positioned at the back of the display

- Arvidsson - Palmgren - Rowland -
30
Fig. 9: A table chart demonstrating which fruit the customers first saw upon entering the fruit section the week the bananas were positioned at the front of the display
What was the first fruit you noticed as you came into the fruit section?
Frequency Percent Valid Percent
Cumulative
Percent
Apple 4 5,7 5,7 5,7
Pear 2 2,9 2,9 8,6
Grapes 8 11,4 11,4 20,0
Bananas 51 72,9 72,9 92,9
Melon 2 2,9 2,9 95,7
Pineapple 3 4,3 4,3 100,0
Valid
Total 70 100,0 100,0
Fig. 10: A pie chart demonstrating which fruit the customers first saw upon entering the fruit section the week the bananas were positioned at the front of the display
Referring to Figures 7, 8, 9 and 10 above, the most prominent fruit seen by customers were the bananas when they were positioned at the front of the store. In contrast, the week when the bananas were placed at the back of the display, the most prominent fruits appeared to be between the apples, citrus fruits and grapes.

- Arvidsson - Palmgren - Rowland -
31
4.1.3.3 If consumers picked the first fruit they saw after entering the fruit section Fig. 11: A table chart showing if the customers picked the first fruit they saw upon entering the fruit section.
Did you pick the first fruit you noticed when entering the fruit section?
Bananas front and back
Front Back Total
Count 58 48 106 Yes
% within Bananas front and back 82,9% 68,6% 75,7%
Count 12 22 34 No
% within Bananas front and back 17,1% 31,4% 24,3%
Count 70 70 140
Did you pick the first fruit you noticed when
entering the fruit section?
Total
% within Bananas front and back 100,0% 100,0% 100,0%
Fig. 12: A table chart showing the Chi-Squared test of significance for customers picking the first fruit they saw in the fruit section
Chi-Square Tests
Value df
Asymp. Sig. (2-sided)
Exact Sig. (2-sided)
Exact Sig. (1-sided)
Pearson Chi-Square 3,885a 1 ,049 Continuity Correctionb 3,147 1 ,076
Likelihood Ratio 3,930 1 ,047 Fisher's Exact Test ,075 ,038
Linear-by-Linear Association 3,857 1 ,050
N of Valid Cases 140
As indicated in Fig. 11 above, 82.9% of customers picked the first fruit they saw when the bananas were at the front of the fruit section. This implies that the banana was the fruit selected as, referring back to the above pie charts in Fig. 10, when the bananas are at the front of the section they are the most noticed product. When the bananas were positioned at the back of the fruit section, 68.6% of customers picked the first fruit they saw. This result indicates that the majority of customers continued to pick the first fruit seen, whether it was a banana or not. Fig. 12 shows that the significance level of the test is 0.049 (2 tailed significance), meaning that the results found are significant.

- Arvidsson - Palmgren - Rowland -
32
4.1.3.4 If customers picked any other fruit other than the first item they saw upon entering the fruit section Fig. 13: A table chart showing if customers picked any other fruit other than the first fruit they saw and if they had planned to buy fruit
Did you plan to buy fruit today? Did you pick up any other fruit than the first fruit you noticed?
Did you pick up any other fruit?
Yes No Total
Count 113 9 122 Yes
% within Did you buy any other fruit? 93,4% 47,4% 87,1%
Count 8 10 18 No
% within Did you buy any other fruit? 6,6% 52,6% 12,9%
Count 121 19 140
Did you plan to buy fruit today?
Total
% within Did you buy any other fruit? 100,0% 100,0% 100,0%
Fig. 14: A table chart showing the Chi-Squared test of significance for the relationship of customers picking the first fruit they saw and others and if it was a planned purchase
Chi-Square Tests
Value Df
Asymp. Sig. (2-sided)
Exact Sig. (2-sided)
Exact Sig. (1-sided)
Pearson Chi-Square 31,040a 1 ,000 Continuity Correctionb 27,069 1 ,000 Likelihood Ratio 22,218 1 ,000 Fisher's Exact Test ,000 ,000
Linear-by-Linear Association 30,819 1 ,000
N of Valid Cases 140
Fig. 13 above indicates that 93.4% of people who picked up fruit planned to buy fruit and also picked up additional fruit items other than the one they first saw. 47.4% of the people planned to buy fruit but did not pick any other additional fruit items other than the first item they saw. In total, out of the 120 respondents, 87.1% had planned to buy fruit. Out of the unplanned purchases, 6.6% of customers who did not plan to purchase fruit at all, picked additional fruit as well as the first item they saw, whilst 52.6% of customers who did not plan to buy fruit only picked the first item they saw.

- Arvidsson - Palmgren - Rowland -
33
Fig. 14 indicates the level of significance of this relationship. As the 2-tailed significance is found to be 0.00, we find the relationship to be significant in this study. OBS: A criteria for being able to take part in the interviews was that the customer had to pick up fruit, thus people who didn’t plan to buy fruit and kept to this plan did not take part in the investigation. 4.1.3.5 If consumers thought their chance of partaking in impulse purchases increased if they were reminded of or saw different fruit Fig. 15: A table chart showing the percentage chance of impulse purchases when consumers are reminded of or notice the different fruit available
With regard to fruit, I consider that my likelihood of having impulse purchases will increase
when I notice and am reminded of the different fruit available.
Frequency Percent Valid Percent
Cumulative
Percent
Strongly disagree 28 20,0 20,0 20,0
2,00 8 5,7 5,7 25,7
3,00 6 4,3 4,3 30,0
4,00 16 11,4 11,4 41,4
5,00 27 19,3 19,3 60,7
6,00 18 12,9 12,9 73,6
Strongly agree 37 26,4 26,4 100,0
Valid
Total 140 100,0 100,0
Fig. 16: A pie chart indicating the percentage chance of impulse purchases when consumers are reminded of or notice the different fruit available

- Arvidsson - Palmgren - Rowland -
34
The above table chart in Fig. 15 and pie chart in Fig 16 indicates the level of probability consumers think they have of having impulse purchases when being reminded of or notice the different fruit available. The majority of customers strongly agree (58.6% as taken from respondents indicating 5 or above on the Likert scale) with the statement meaning that they believe impulse purchases to be enhanced from instantly seeing fruit rather than planning for it, however, the second largest segment are customers who strongly disagree with the statement, offering a conflicting argument. 4.1.4 Further Comments from the Quantitative Interviews When asking the customers what fruit they first noticed many customers replied that they went directly to the fruit they had planned to purchase. This was subsequently the first fruit they saw even if the item was found in the middle of the fruit section and they had to pass by several other fruit on their way. After picking up this fruit they became aware of the remainder of the selection. 4.2 Qualitative Interview Results Marianne Johansson at ICA Maxi in Malmö had an overall negative impression from the layout change. Marianne had not noticed any increase in the sales of other fruit; however, according to her there was a big loss in banana sales. Marianne argued that customers are used to finding the bananas in a certain place in the fruit section and that customers do not look for the bananas if they are not found where expected. According to Marianne’s perception the customers reacted negatively to the change in layout, arguing that consumers do not like changes and do not want to search for the bananas. Marianne therefore states that the most effective layout for the fruit sales is to position the bananas in the beginning of the fruit section. Regarding the question, what fruit she thought was the most popular before and after the change in layout, Marianne Johansson responded that it was bananas and apples in both cases and that this did not change depending on the store layout. Furthermore, Marianne’s overall perception of the experiment was negative and she could not see any advantages of testing this layout in the fruit section. The employee interviewed at ICA Maxi in Malmö agreed with Marianne on all questions and therefore the answers will not be repeated again. When asking Jimmy Nilsson at ICA Kvantum in Landskrona about eventual differences in fruit sales after moving the bananas, he responded that the store had a rather big decline in total fruit sales during the week the bananas were moved from the back, to the front of the fruit section. However, Jimmy did not believe this drop in sales was due to the movement of the bananas back to their original position at the front of the fruit section. Jimmy said that he thought that they would sell fewer bananas when they were moved to the back, however instead, the banana sales increased. Jimmy further stated that it might not be important where the bananas are positioned in the fruit section. Jimmy argued that the banana, being one of the top three products in terms of sales in the store, is the fruit that sells best and therefore there is no reason to “hide” them for the customers.

- Arvidsson - Palmgren - Rowland -
35
Jimmy Nilsson’s perception of how the customers reacted to the change in layout was that the customers seemed confused when not finding the bananas in the front like they are used to. When responding to the question, what fruit that was the most popular before and after the change in layout, Jimmy said that the bananas were the most popular when they were in the front of the fruit section, but that apples were the most popular fruit when the bananas were in the end of the section. This latter response was in accordance with the perception of the store employee that was interviewed at ICA Kvantum in Landskrona. The employee said that he believed that they had sold many more apples when the bananas were positioned in the back, next to the apples. Just like at the Malmö store, the employee agreed with the store’s responsible fruit manager on all questions, thus the answers will not be repeated again. 4.3 Store Data Results 4.3.1 Overall Results The sales data from ICA Maxi in Malmö and ICA Kvantum in Landskrona was added together and then divided into two groups (sales figures when bananas were positioned in the back and then in the front for both stores). From this, we can see that there is a total loss in sales of 3945.42 SEK when the bananas were positioned in the back of the fruit section. Except for the banana sales, the sales of the ten other most commonly bought fruit categories are included in the total fruit sales. The ten other fruit categories are: apple, grapes, pear, pineapple, orange, lemon/clementine, grapefruit, lime, kiwi and mango/melon. In total there was a decrease in the banana sales of 12589.54 SEK when the bananas were positioned in the back of the fruit section. Furthermore, there was one rather large negative result and one rather large positive result when the bananas were positioned in the back: a decrease in sales of grapes with 7440.27 SEK and an increase in sales of apples with 7412.45 SEK. What needs to be taken into consideration when looking at the overall data figures is that ICA Maxi in Malmö is a lot bigger than ICA Kvantum in Landskrona. Thus, the sales data from ICA Maxi have had a stronger impact on the total figures. 4.3.2 ICA Maxi, Malmö When the bananas were positioned in the back of the fruit section, ICA Maxi experienced a decrease in profits by 12910.52 SEK; this can be seen looking at data from the banana sales and the sales for the ten additional most common fruit categories. The two main fruits affected by the change in layout were the bananas, which decreased in profit by 13240 SEK and grapes which decreased by 12645.55 SEK. This result however, has to take into account external factors which might have caused the end result to be misrepresented. During the first week of experiments at the ICA Maxi store (when bananas were at the front of the fruit section) there was a sale on the grapes, which were also positioned next to the bananas. Therefore, the decrease in sales of the grapes during the second week could be a result of the price returning to normal and not because of the change in store layout. The decrease in volume of sales could be more noticeable if an uncharacteristically high level of sales has just taken place after a sales promotion. As we took into consideration the calendar effect when constructing the investigation, such differences like promotional variations should not influence the results to such a degree. However, as the promotion ran for one week out of the two weeks of data collection, it is seen

- Arvidsson - Palmgren - Rowland -
36
as a substantial amount of time to make a difference in fruit sales. Using the Latin Square meant that the two stores did not have the bananas in the same position at the same time. In spite of this consideration, the grape promotion took place the week where bananas were positioned at the back of ICA Kvantum in Landskrona and at the front of ICA Maxi in Malmö. As mentioned previously, due to the ICA Maxi size and large volume of customers, the sales data for this store will have more of an influence over the final results than ICA Kvantum. Therefore, we can assume that a larger volume of grapes would have been sold at ICA Maxi during the promotion week compared to ICA Kvantum, thus making greater implications for the difference in sales once the findings have been grouped together and the end of the study. In contrast the number of apples sold during the second week at ICA Maxi, after the change in layout, increased by 7665.99 SEK. As there was no promotion on these items during the data collection, we can assume that the result is a positive implication from moving the bananas to the back of the fruit section. 4.3.3 ICA Kvantum, Landskrona ICA Kvantum experienced an increase in profits by 8964.62 SEK when the bananas were moved to the back of the fruit display. The banana sales increased by 650 SEK as did the other fruit sales which also increased after the layout change, grapes with 5205.28 SEK and citrus with 4950.64 SEK. However, the second week of experiment at ICA Kvantum, when the bananas were positioned in the front of the fruit section, was the “salary week”, thus it can be argued that the sales of bananas this week would have been somewhat smaller during normal circumstances. This would have made the increase in banana sales even larger when the bananas were positioned in the back. Although, what needs to be mentioned and taken into consideration is that when the bananas were in the back in the fruit section at ICA Kvantum the customers could still see them when entering the fruit section, in contrast to ICA Maxi, a fact that might have affected the results and the banana sales in Landskrona.

- Arvidsson - Palmgren - Rowland -
37
-5-
Analysis In this chapter we will analyse the results linking together arguments and models discussed in the theoretical framework from chapter 3. The results will be explained and reasons to why certain factors have occurred will be presented. The purpose of this investigation is to examine the change in consumer behaviour regarding the intention towards buying fruit when the layout in the fruit section has been altered in a supermarket. The aim of changing the layout was to increase impulse purchases through making consumers more aware of alternative fruit. The data collected from the two ICA stores, ICA Maxi and ICA Kvantum have been grouped together in both the results and the subsequent analysis. The results have been added together as the importance of this investigation is to find a general trend to increase fruit sales; it is not the intention to look at each store individually. It is important to notice however, that due to the difference in the size of the stores, the data collected from ICA Maxi was more influential than the ICA Kvantum sales data results. For example, ICA Maxi is a larger store with more customers and has a larger overall sales volume, changes in sales volume at ICA Maxi, therefore, would be more noticeable in the end results than the changes that have occurred in ICA Kvantum. The analysis has been structured using sub-headings to offer a clear format for understanding. However, as the results are closely related to each other, much of analysis and discussion interlinks between the headings, several arguments for one aspect apply to others. 5.1 Changes in Consumer Behaviour The M-R Model refers to change in consumer behaviour resulting from a change in stimulus in the store environment. In the case of this investigation, the bananas were moved within the fruit section in order to generate more spontaneous purchases amongst consumers and lead to an increase in fruit sales. From looking at the results it can be seen that consumers were more prone to buying additional fruit once the bananas had changed position in the store. The stimulus, meaning the positioning of bananas, initiated the organism, the consumer, to evaluate alternative fruit products resulting in a positive response of buying more or different fruit produce during the weeks when the bananas were positioned at the back of the fruit section. The M-R Model also acknowledges the importance of the pleasure/arousal aspect of the retail environment. A pleasant environment is said to promote shopping in a retail setting. From our investigation, the perceived level of quality of the fruit section can encourage customers to purchase items. The majority of consumers (90%) perceived the fruit displays to be of high quality, and thus there was no hindrance to the shopping behaviour from that aspect. The types of consumer behaviour observed in this investigation can be separated into two categories; goal oriented behaviour and impulsive behaviour. Goal oriented consumers already have an idea of what they need to purchase when they enter the store. These consumers were observed to head straight towards the fruit item that they planned to purchase

- Arvidsson - Palmgren - Rowland -
38
and pick it up, after which they would then either evaluate the alternatives or leave after finding what they intended to buy. Goal oriented consumers are highlighted in the results as with reference to Figure 13, it can be seen that 47.4% of customers picked up fruit and then did not look at any additional items other than what they first saw in the section. This suggests that these consumers went straight to the planned item and left without considering any other options. The second category concerning impulse behaviour can be found below in section 5.2. Identifying which fruit to purchase is the first step of gaining the consumer’s attention. Comprehension is then accomplished when the consumer tries to make sense of what they are looking at, such as through touch and sight. Evaluation of alternatives derives from consumers picking out the fruit that fulfils most of their pre-conceived perceptions. Consumers’ which evaluated their choices before making a purchase were indicated through observing actions such as picking up a variety of fruits and feeling them before placing the selected item in the basket. Consumers were seen to search through the alternative choices until the desired criterion was fulfilled. Consumer behaviour noted in this study can be best analysed through the use of the decision making model and the theory of planned behaviour. In the decision making model customers recognise a need which they want to satisfy (noting a certain fruit to purchase); they begin searching for the product (identifying the fruit from the display); they take pre-purchase alternative evaluation (noticing the other alternative fruit selections available) and then make a final purchase. For this investigation we are unable to identify the post-purchase evaluation as our observations were concentrated to the store-environment. The theory of planned behaviour as discussed in the theoretical framework, identifies that behaviour can alter from what is intended to what occurs in reality after evaluation of alternative options. After evaluating alternatives, the most desirable circumstance is chosen. In this study, 12.9% of the people observed did not originally intend to purchase fruit on their shopping trip (Figure 13). This suggests that these consumers differed from their intended plan of action and were encouraged to buy fruit either from the attractive display or partaking in impulsive purchase behaviour after passing the fruit section in the supermarket. Bananas were seen to decline in terms of sales volume when they were positioned at the back of the fruit section. This suggests that bananas, although popular, are not necessarily intended purchases. As other fruit sales increased when bananas were positioned at the back indicates that consumers are encouraged to buy other fruits after evaluating all options. The most common occurrence during the observations was that consumers picked both bananas and other fruit. In the case of only choosing bananas, 77 consumers picked bananas when they were at the front of the fruit display followed by 41 the following week when bananas were positioned at the back of the store. In a general sense, it can be seen that greater amounts of other fruit was purchased when the bananas were positioned at the back of the fruit section, although the actual number of banana sales decreased for that week. This difference in consumers buying only bananas between the two weeks (77 consumers minus 41 consumers) can depend upon two things. One of them is that these 36 customers, all of who can be perceived as impulse buyers, did not care to search for the banana when it was moved to the back of the section. The other alternative which is also supported by our data is that the 36 people, instead of only buying a banana, now also bought additional fruit once the banana changed position to the back of the display. Our research shows that 87.1% of the consumers planned to buy fruit, and in this case, those consumers who plan to buy fruit and only intend

- Arvidsson - Palmgren - Rowland -
39
on buying a banana will continue to do so. As they have planned to buy a banana they will do so no matter where the banana is positioned in the store. This means that 87.1% out of the 36 customers are still buying bananas and when the bananas are moved to the back of the section, they will buy additional fruit as well. 5.2 Impulse Purchases It is important to establish if consumers picked the first fruit they saw upon entering the fruit section as it suggests that customers are susceptible to impulse purchases. Retailers could benefit from learning if consumers are prone to buying the first fruit they see, as strategically positioning fruits can cause sales to increase. The results show that when the bananas were positioned at the front of the fruit display, 82.9% of questioned customers picked the first fruit that they saw (Figure 11). Referring to Figure 10, when the bananas were positioned at the front, 72.9% of customers saw this fruit first, suggesting that most consumers picked bananas when they are at the front of the fruit section. Alternatively, when bananas were positioned at the back of the section, the first fruit most commonly seen were apples, pears and citrus fruits. Referring to Figure 11, 68.6% of consumers continued to purchase the first fruit they saw, indicating that although some sales of bananas decreased, these other fruit sales remained constant. Consumers were still buying the first fruit they noticed, suggesting that they continued to be swayed by impulsive behaviour or just did not see any other fruit on their way to the one they had planned to buy. Figures 13 and 14 indicate that out of the consumers questioned who had not originally planned to buy fruit, 52.6% ended up buying the first fruit they saw but no other items. This relationship supports the idea that customers are prone to impulse purchases once they have been reminded of or see the fruit section. Impulse buying behaviour, as discussed in the theoretical framework, is best described by Stern (1962) who identifies four categories for impulsive behaviour; pure impulse, reminder impulse, suggestion impulse and planned impulse behaviour. The results from the quantitative questionnaires highlight the occurrence of the impulse buying tendency amongst the observed customers. Although most customers appeared to be goal oriented in their actions, noticing the other fruit selections around them stimulated a need to buy other fruit. This is represented in the results under question 6, where the majority of customers (58.6%) admit that they have a high tendency to partake in impulse purchases. This is not to say that the original product was not purchased, just that other items that were not intended to be bought were in fact chosen. Following Stern’s (1962) classification of the different types of impulse purchases, most customers were seen to buy products under the reminder impulse category or the planned impulse purchase. The reminder impulse purchase could be stimulated by noticing other fruit, such as from noting the first fruit from when you enter the fruit section. Referring back to the result the first fruit noticed during the two weeks was either bananas, apples, pears or citrus fruits. As mentioned previously, customers can be goal oriented and move first towards the fruit they have planned to buy before they think about impulse purchases. Bananas are the top 3 purchases out of the whole ICA products; therefore it can be argued that most customers have already planned to buy this fruit. It is expected that if a customer has planned to buy a banana and they are positioned at the front of the display, this will naturally be the first item they notice. When bananas are in the back of the fruit section, other fruit is noticed first by the customers. The other fruit, however, are more equal in their popularity compared to the bananas so this creates a more differentiated result from the fruit that is first noticed. The banana is a fruit that many people plan to buy, but after the banana, all other fruit appear to be equal in popularity. People who want to buy apples will go to this fruit first, and the same
- Arvidsson - Palmgren - Rowland -
40
applies for people who have planned to buy citrus fruits, for example. The apples and grapes are less common purchases, therefore the people who notice these fruits first will be the customers who intend to buy the apples and grapes. As this category has fewer customers, less people are therefore expected to notice these items first in the store. This explains the differences in the pie charts from when the bananas are positioned at the front and then at the back of the display. Alternatively, if bananas are always a planned purchase, then the number sold would not decrease no matter where they are positioned in the store. Therefore bananas can also be regarded as an item which is bought impulsively. Even if the consumer intended to only buy apples, for example, they would easily come upon the banana section due to the size of the display and bright colour of the product. Seeing the product would cause the consumer to recognise a need for their purchase and then leave the store with both apples and bananas. Consumers shopping specifically for apples again after the layout alteration might not see the bananas at the back of the fruit section and therefore might not be reminded to purchase these items. Consumers, who only intend to buy apples and do not see the bananas, will only leave with apples. 5.3 Layout Our aim with changing the layout in the fruit section was to increase the overall fruit sales. In addition to observing intended purchases, we also noticed how customer routes and reactions were affected when the layout in the fruit section was changed. Looking at the customer routes, both ICA Maxi and ICA Kvantum follow the grid design with aisles where the customer can move up and down. According to Spies et al (1997) customers in this kind of layout tend to move in a similar pattern, where the aisles work as a guideline where the consumers are expected to move up and down in a linear fashion. However, we noted from observing the customers that they are more likely to move in the opposite formation; customers were found walking forward and backward in and out in the aisles not following any logical structure. Customers would walk into the fruit area and then walk into another section of the store to later return to the fruit department again. This correlates with Larson et al (2005) findings, as according to these authors, the most common action is for customer to dip in and out and sporadically travel around the store. The way consumers moved around the fruit section did not alter after the change in layout. The way the customers move, at least from results in this investigation, does not seem to be dependent on the style of layout. Referring also back to the above discussion, a logical layout design can have an impact on the tendency towards impulsive shopping behaviour. When the products are categorised in a logical manner consumers are inspired by other products and instead of buying only one product, customers are reminded of alternatives and want to fulfil more needs. According to the manager and employee interviews, most customers were seen to dislike the change in layout of the fruit section as it made them unable to immediately find the bananas. Most were annoyed and confused with the change as it took longer to find the items they required. Most customers are very familiar with the design, and this creates a degree of satisfaction as they can easily find that they are looking for. However, as noted in the theoretical framework, changing the layout and design frequently can have a positive impact on consumer spending; the customers have to walk around to find what they are looking for and are thus exposed to more goods, increasing the amount of impulse purchases which is a factor that will ultimately lead to an increase of sales. This is what the investigation was

- Arvidsson - Palmgren - Rowland -
41
designed to achieve. Creating unfamiliar circumstances, as noted by Park et al (1989) in the theoretical framework, awakens the consumer’s senses and makes them more aware of different fruit items. Changing the layout, although was seen to cause an overall decrease in banana sales, did increase the sales volume of other fruits such as the apples and citrus fruits. These changes may only be temporary though, as in accordance with findings from Park et al (1989) and Wilkinson (1982) changing layout may only cause a temporary increase in purchases. Results from this investigation support that a short term increase of fruit sales is possible from changing the display layout. There is a very fine balance to consider of changing the layout to promote impulse purchases but also keeping the customer satisfied and creating a positive image of the store. According to Spies et al (1997) the change most be conducted in a relevant matter to avoid feelings of confusion and annoyance.
- Arvidsson - Palmgren - Rowland -
42
-6-
Conclusion In the concluding chapter we will evaluate the key points discovered from this experiment and present a final discussion concerning the most appropriate way to increase fruit sales at ICA. Our aim with this investigation was to find out if fruit sales increased after a change in the section layout in a supermarket prompting a change in consumer behaviour. The previous knowledge we possessed and brought with us at the beginning of this study, derived from researchers on atmospherics and the influence on in-store marketing. We found it interesting that different environmental stimuli could have an effect on consumer behaviour and sales. The need to focus the investigation on one store area led us to consider the importance of fruit sales and healthy eating. A lack of research concerning increasing fruit sales through changing the layout made the investigation even more appealing. The Curhan (1974) article especially helped us to develop our ideas on how to increase fruit sales in stores. Curhan (1974) discovered in his findings that shelf positioning and display made the most positive difference on fruit and vegetable sales, whilst the price was not so important when consumers were choosing the products. From reading his findings, for our experiment we knew not to measure changing prices as it would not have so much of an impact on sales in terms of swaying consumer behaviour. In our investigation various kinds of data were collected in order to cross-examine the findings and to be able to answer our research question as accurately as possible. Data analysis found both advantages as well as disadvantages as a result of changing the layout by moving the bananas. Based on this evaluation we argue that the best strategy for retailers to adopt is to position the bananas at the beginning of the fruit section. When looking at the total sales figures from the two selected ICA stores, the fruit sales are seen to decrease during the week when the bananas are positioned at the end of the fruit section. At first sight, this seems an instant disadvantage for moving the bananas to the back of the section; however, external variables must be noted as influencing factors to explain this occurrence. For example, ICA Maxi in Malmö had a sale on grapes the week the bananas were positioned in the front, thus the number of grapes sold was very high that week. The level of sales subsequently decreased the following week, affecting the sales figures negatively. Although the bananas experienced a drop in sales when being positioned in the back of the section, other fruit categories, such as oranges and apples increased. The increase in these fruit categories was expected to be brought about by the likelihood of impulse purchases resulting from consumers being reminded of the product when they come across them in the store. The customers were noted to have qualities of goal oriented characteristics as well as impulsive tendencies. Customers were goal oriented in the sense that they moved straight towards their intended fruit product first before evaluating the alternative options. Impulsive tendencies were noted when the consumers evaluated other selections of fruit, implying that they were drawn to the different displays and also were swayed by reminder impulse behaviour. Customers admitted themselves that they are prone to impulsive behaviour especially when they are attracted to different displays or notice a fruit they had not planned on buying. Customers who had not originally planned on buying fruit were also noted to have

- Arvidsson - Palmgren - Rowland -
43
their actions changed through reminder impulse characteristics. This knowledge is important to retailers who can benefit from enticing customers to different products and increasing sales through placing fruit in specific areas and creating attractive designs. The two fruit managers at ICA, Jimmy Nilsson and Marianne Johansson, both of whom have a lot of knowledge and experience concerning the different fruit and the fruit popularity among consumers, agreed that there is no reason to “hide” such a popular fruit as the banana. However, if the total sales of other fruit had had a larger increase when the bananas were positioned in the back of the section, leaving us with a more visible, positive result, the managers might have been more positive towards the change in layout. According to the managers the customers reacted negatively to the change. Jimmy Nilsson and Marianne Johansson stated that the customers seemed confused and annoyed over the change in layout because it forced many of them to search for the fruit they had planned to buy. Customers are usually very familiar with the store layout and know exactly where they can find the different fruits. However, this would only be a short time problem, since the customers would get used to the new layout after a week or two and change their behaviour accordingly. As long as the structure of the fruit section is organised in a logical manner, consumers will find their way, diffusing their level of dissatisfaction. These findings concerning the consumer route and mood were sub categories of consideration and are not a main part of our aim for this paper. However, noticing these factors is of interest and does raise important questions for both us as researchers to find a point for further investigation, and to the retailers who may be able to benefit from the knowledge. Changing the store layout, as witnessed in our investigation, is very hard to achieve when making sure both parties, the retailer and customer, are happy. The retailer is happy if more sales are generated through impulse purchases when customers have to spend longer time in the store searching for products, however the customer may have an unpleasant experience from shopping in a store when they find it difficult to find the items they intended. Another point, however, is if the store never changed layout customers might get bored with the store design and the selection of products. New or unfamiliar displays generate a certain degree of interest from consumers, thus highlighting the product. Against the opinions of Marianne and Jimmy, we think that if consumers set out to buy a particular product they will spend extra time searching for it no matter where it is positioned. Spending a longer time in the store will draw attention to a greater amount of items and generate added needs that have to be fulfilled by the consumer, thus resulting in a higher number of purchases. The customer’s route around the fruit section did not change after the layout alteration. The route was seen to be sporadic with customers varying their movement around the fruit section and not moving in a uniform style. Our findings therefore support the work of Larson (2005) who also notes the varying movement patterns of consumers in supermarkets, and oppose the findings of Spies et al (1997) who suggested that customers should move along the aisles as the grid design of supermarkets has intended. The way the consumer moves around the store therefore can be seen as independent form the layout as movements did not change after the alterations had been made. However, what was not tested in this investigation was the use of lists when shopping and the effect that this has on the customer’s movement. Additional studies within this area would be interesting to investigate and see if different results would be found. Depending on what the fruit manager in the store would like to achieve with a change in layout there are different options to consider and with each choice there are distinct advantages as well as disadvantages. Looking at our results, putting the bananas in the front

- Arvidsson - Palmgren - Rowland -
44
of the fruit section resulted in higher banana sales, whilst putting them in the back made the customers a bit annoyed and confused as well as causing a decline in the number of bananas sold. On the other hand, this positioning did raise the sales of other fruit, such as apples and oranges. The choice of altering the layout ultimately depends on the main aim from the store. A desire to temporarily increase the sales volume of a specific fruit such as the apples could benefit from a change in layout. As discussed in the theoretical framework, the increase may be temporary, but will raise awareness of the fruits even if it is for a limited amount of time creating a boost in profits. However, a decline in banana sales by such a large amount could have adverse effects for the overall profit of the store. The retailer has to determine if the change is worth the consequences, some products may increase, but the popular, most profitable product may decline in numbers sold. As the bananas are the most popular fruit and third most popular item out of ICA products, it may not be beneficial to move them to the back of the section for great amounts of time. However, change in layouts can be used as a method to stimulate consumers and make them rediscover forgotten items within the store. With regard to our findings of increasing the number of sales of apples, pears and citrus fruits, we have shown that it is possible to increase fruit sales from changing the section layout, at least in the short term. An increase in these items was witnessed from moving one simple aspect of the store design, and is a factor that can be adopted by many retailers. Those who therefore to decide to follow our design could complete the transfer easily. Our most important finding from this investigation is that it is possible to make changes in overall sales and consumer behaviour by changing one simple aspect of the store layout. There is no need to always use promotions, elaborate displays or demonstrations to make an impact. Moving a simple aspect of the store layout, is an effective way for retailers to make a difference, both in saving time and money. We consider it amazing that by changing one small part of the layout we have been able to affect consumer behaviour without them noticing the impact of their actions. The investigation has proved the fact that the retailers have the power to change consumer behaviour and make consumers notice what the retailer wants them to notice and see the displays they want them to see. Finally, taking all arguments into consideration, at least for this specific study, the results state that bananas should be positioned at the front of the fruit section in a supermarket. The reasons to come to this conclusion are evident from the overall decline in fruit sales when the bananas were moved to the back of the section, the negative response witnessed in both the consumers and the store managers, and the dramatic decline in banana sales. The profit from the regular purchase of bananas appears to be beneficial and important to retailers. The decline in banana sales is not compensated by the increase of other fruit.

- Arvidsson - Palmgren - Rowland -
45
-7-
Further Research
This chapter will discuss the future research opportunities specific to expanding the knowledge on consumer behaviour and the fruit section in supermarkets. Due to the lack in previous research concerning the topic, further research into this area will be beneficial from both an academic and practical perspective. Since there is limited previous research concerning fruit and vegetables in relation to store layout and consumer behaviour, there are many different aspects that would be interesting to investigate. Repeating the study, for example, by extending the survey over a different time period would be of great interest. There are many different reasons as to why investigating the same research problem over a longer period of time would be beneficial. For instance, due to limitations in time for this investigation, we only had the possibility to conduct the experiment (the change in layout) for one week. Customers reacted negatively to the change as they did not want to search for the bananas, although, it was not the positioning of the bananas that annoyed the customers, but the feeling of lost control. Many customers are very familiar with the layout in the store in which they usually shop, they know where and how to find the different products. By changing the layout over a longer period of time, the customer would have become used to the new layout, making it easier to investigate responses and gain more accurate perceptions to the change. Moreover, conducting the experiment over a longer period of time would have provided more sales data to compare and analyse with our observation and interview findings, resulting in higher validity. It would be of great interest to see if the results and findings would be the same when conducting the study during a month or more, taking into consideration the change in seasons and the varying popularity of fruit. Even if there is a lot of previous research on investigating the influence of different atmospheric variables, there still is a research gap concerning how these variables affect the sales of fruit and vegetables. It would be beneficial to test different variables, such as music, different scents or lighting, to see how these affect the sales in the fruit section, and find additional ways to increase the total sales of volume. Also, to further expand the knowledge on the topic, it would be advantageous to conduct an experiment to see how different fruit displays affect purchases and consumer behaviour. Taking into account different store locations, catchment areas and demographic variations would provide greater depth to the issue of changing behaviours. Further studies could also focus on making major changes within the fruit section. For instance, one investigation could be to move the whole fruit section, putting it either in the very beginning of the store or in the end, close to the cashiers, where candy usually is placed. This alteration might be appreciated by healthy minded consumers, who would be encouraged to make impulse purchases of fruit instead of candy, whilst waiting in line to be served. Another interesting aspect is the use of the grid design in grocery stores. This research paper, as well as others, has shown that most customers do not walk up and down the aisles in the way the grid design intends them to move. If this is the case, why is this design still used and favoured above others? Research investigating how other store layouts, such as free standing islands in the fruit section, affects consumer behaviour would be relevant to retailers and help them tailor their store to better meet customer movements and needs. It would be interesting
- Arvidsson - Palmgren - Rowland -
46
to see how a separation of the fruit and vegetables into two different sections would affect the total sales of fruit. Furthermore, specifically observing consumers who make shopping lists could offer insight into movement around the store. Whilst this study has found customers to move in irregular formations, there is the possibility that customers shopping with a list move in a stricter manner. A final suggestion for further research studies that would be interesting to conduct is to choose a “why”-approach, looking at feelings, emotions, thoughts and the reasons behind the consumers’ behaviour, instead of the “what”-approach we chose to use in the study. This could have been conducted through the use of a qualitative research strategy, in form of focus groups and qualitative, unstructured or semi-structured interviews.

- Arvidsson - Palmgren - Rowland -
47
-8-
References
8.1 Books Bryman, Alan, Bell, Emma (2007) “Business Research Methods” 2:nd edition, Oxford University Press Inc. Easterby-Smith, Mark, Thorpe, Richard, Lowe, Andy (2006) “Management Research – An Introduction”, 2:nd edition, Sage Publications McGoldrick, Peter J. (2002) “Retail marketing”, 2:nd edition, The MacGraw-Hill Companies Nordfält, Jens (2007) “Marknadsföring i butik – om forskning och branschkunskap i detaljhandeln”, Liber AB Nordfält, Jens (2005) “Is Consumer-Decision-Making Out of Control? Non-Conscious influences on consumer decision-making for fast moving consumer goods”, Stockholm School of Economics, Stockholm Peter, J. Paul. et al (1999) “Consumer Behaviour and Marketing Strategy European Edition”, McGraw Hill, London Underhill, Paco (2003) “Why We Buy: The Science of Shopping”, Texere LCC, New York
8.2 Research Articles Babin Barry J. and Attaway Jill S. (2000) “Atmospheric Affect as a Tool for Creating Value and Gaining Share of Customer” Journal of Business Research, vol 49, 91-99 Baker Julie, Levy Michael and Grewal Dhruv (1992) “An Experimental Approach to Making Retail Store Environmental Decisions” Journal of Retailing, vol 68, 445-458 Baker, Anna H. And Wardle, Jane (2003) “Sex differences in fruit and vegetables intake in older adults”, Appetite, Vol. 40, pp. 269-275 Bellizzi Joseph A. and Hite Robert E. (1992) “Environmental Color, Consumer Feelings, and Purchase Likelihood”, Psychology and Marketing (1986-1998), Vol. 9 Issue 5 pp. 347-363 Bäckström, Kristina, Johansson, Ulf (2006) “Creating and consuming experiences in retail store environments: comparing retailer and consumer perspectives”, Journal of Retailing and Consumer Services, Vol. 13, pp. 417-430 Curhan Ronald C. (1974) “The Effects of Merchandising and Temporary Promotional Activities on the Sales of Fresh Fruits and Vegetables in Supermarkets” Journal of Marketing research, vol 11, issue 3, 286-294

- Arvidsson - Palmgren - Rowland -
48
Darden William R., Dorsch Michael J. (1990) “An Action Strategy Approach to Examining Shopping Behavior”, Journal of Business Research, Vol. 21, pp. 289-308
Donovan Robert J. et al (1994) “Store Atmosphere and Purchasing Behaviour”, Journal of Retailing, Vol. 70, Issue 3, pp.283-294 Drèze Xavier et al (1994) “Shelf Management and Space Elasticity”, Journal of Retailing, Vol. 70, Issue 4, pp. 301-326 Hu, Haiyan, Jasper, Cynthia R. (2006) “Social cues in the store environment and their impact on store image”, International Journal of Retail & Distribution Management, Vol. 34, No. 1, pp. 25-48 Larson Jeffrey et al (2005) “An exploratory look at supermarket shopping paths” International Journal of Research in Marketing, Vol. 22, pp. 395-414 Lindström, Martin, Hanson, Bertil S. and Östergren, Per-Olof (2001) ”Socioeconomic differences in the consumption of vegetables, fruit and fruit juices”, European Journal of Public Health, vol 11, issue 1, pp. 51-58 Loeillet, Denis (2004) “Supply of the European Banana Market”, Fruit Trop, July/August, No. 114, pp. 5-6 Marketing Week (2007) anonymous author, “Healthy foods: Food for thought”, London, Aug 9, pg. 26 Mattila, Anna S., Wirtz, Jochen (2001) “Congruency of scent and music as a driver of in-store evaluations and behavior”, Journal of Retailing, Vol.77, pp. 273-289 Park C.W. et al (1989) “The Effects of Situational Factors on In-Store Grocery Shopping Behaviour: The Role of Store Environment and Time Available for Shopping”, Journal of Consumer Research, Vol. 15, pp.422-433 Reid, Marie, Bunting, Jane and Hammersley, Richard (2005) “Relationship between the Food Expectancy Questionnaire (FEQ) and the Food Frequency Questionnaire (FFQ)”, Appetite, Vol 45, pp.127-136 Sherman Elaine, Mathur Anil and Smith Ruth B. (1997) “Store Environment and Consumer Purchase Behavior: Mediating Role of Consumer Emotions” Psychology and Marketing, vol 14, 361-378 Spies, Kordelia, Hesse, Friedrich, Loesch, Kerstin (1997) “Store atmosphere, mood and purchasing behavior“, International Journal of Research in Marketing, Vol. 14, pp. 1-17 Stern H. (1962) “The Significance of Impulse Buying Today”, Journal of Marketing, Vol. 26, Issue 2, pp. 59-62 Tang Doreen C.L. Tan Benjamin L.B. (2003) “Linking consumer perception to preference of retail stores: an empirical assessment of the multi-attributes of store image”, Journal of Retailing and Consumer Services, Vol. 10, pp.193-200

- Arvidsson - Palmgren - Rowland -
49
Turley, L.W., Milliman, Ronald E. (2000) “Atmospheric Effects on Shopping Behavior: A Review of the Experimental Evidence”, Journal of Business Research, Vol. 49, pp. 193-211 Wilkinson J.B. et al (1982) “Assessing the Impact of Short-Term Supermarket Strategy Variables”, Journal of Marketing Research, Vol. 19, Issue 1, pp. 72-86 Yalch, Richard, Spangenberg, Eric (1990) “Effects of store music on shopping behavior”, Journal of Consumer Marketing, Vol. 7, No. 2, pp. 55-63 Yoo Changjo et al (1998) “Effects of Store Characteristics and In-Store Emotional Experiences on Store Attitude”, Journal of Business Research, Vol. 42, pp. 253-263 Yildirim, K., Akalin-Baskaya, A., Hidayetoglu, M.L. (2007) “Effects of indoor color on mood and cognitive performance”, Building and Environment, Vol. 42, pp. 3233-3240 8.3 Electronic Sources Facts on bananas: “Bananas – the number one fruit” http://www.chiquita.com/discover/pfbananas.asp, cited 2008-04-03 “Unpeeling the Banana Trade” (2000), The Fairtrade Foundation, http://www.gapp.me.uk/Issues/Trade/unpeeling_the_banana_trade.pdf, cited 2008-04-03 Facts about ICA: www.ica.se http://www.ica.se/FrontServlet?s=in_english&state=in_english_dynamic&viewid=579878&showMenu=in_english_0, cited 2008-04-03 Facts about Latin square: research.microsoft.com http://research.microsoft.com/users/kenh/thesis/research_meth.htm, cited 2008-04-14
8.4 Reports ICA AB Yearly Report, 2007
8.5 Other Sources Anselmsson Johan, Lecture on SPSS 2008-04-14

- Arvidsson - Palmgren - Rowland -
50
Appendix A Observation Schedule What is to be observed? The research question, “To what extent could fruit sales and consumers’ intention towards making impulse purchases be affected by changing the layout of the fruit section in a supermarket? will be in the back of our minds at all times during the observations. Who is to be observed? Customers at ICA that pick some kind of fruit passing through the store’s fruit section. When will the observations take place? The observations will take place between 10.30 a.m. – 12.30 p.m. at ICA Maxi in Malmö and ICA Kvantum in Landskrona Thursday 17th and 24th April. Friday the 18th and 25th April the observations will be carried out between 2.30 p.m. and 4.30 p.m. Thursdays and Fridays are chosen because they are the most popular days to go to the supermarket. How will we observe the customers? One researcher will be observing customers in the fruit section during two days in each store, one day each of the two weeks the research study is taking place. The observer will be casually dressed, moving around the fruit section, trying not to be noticed by the customers. Strategies for observing behaviour:
- We will only monitor consumers that step into the fruit section. - These customers will be observed to see what they buy. - These behaviours will be noted by numbers, where “1” indicates that the customer
picked a banana/bananas, “2” indicates that the customer picked additional fruit, except for bananas and “3” indicates that the customer only picked other fruit than bananas. Thus, customers who end up not selecting any fruit will not be noted down and will not take part in the investigation.

- Arvidsson - Palmgren - Rowland -
51
Appendix B
Quantitative Interview Questions Introduction: Hi, I am from Lund University and I am conducting a research study for ICA Fruit and Vegetables. I wonder if you have 3 spare minutes to help me by answering 6 questions? 1. I perceive the fruit section as high quality. 1 2 3 4 5 6 7 Strongly Strongly disagree agree 2. What was the first fruit you noticed as you came into the fruit section?
1. apple 2. pear 3. citrus fruits 4. grapes 5. bananas 6. melon 7. plum 8. pineapple 9. other fruit
3. Did you select this fruit? 1. Yes 2. No 4. Did you select any other fruit? 1. Yes 2. No 5. Did you plan to buy fruit today? 1. Yes 2. No 6. With regard to fruit, I consider that the likelihood of me having impulse purchases will increase when I notice and am reminded of the different fruit available. 1 2 3 4 5 6 7 Strongly Strongly disagree agree

- Arvidsson - Palmgren - Rowland -
52
Quantitative Interview Questions (in Swedish) Introduktion: Hej, jag kommer från Lunds Universitet och genomför en undersökning för ICA Frukt och Grönt. Jag undrar om du har 3 minuter över till att svara på 6 frågor? 1. Jag upplever att kvaliteten på fruktavdelningen är hög. 1 2 3 4 5 6 7 Instämmer Instämmer inte alls helt 2. Vilken var den första frukt du lade märke till när du kom in i fruktavdelningen?
1. äpple 2. päron 3. citrusfrukter 4. vindruvor 5. banan 6. melon 7. plommon 8. ananas 9. annan frukt
3. Köpte du denna frukten? 1. Ja 2. Nej 4. Köpte du någon annan frukt? 1. Ja 2. Nej 5. Hade du planerat att köpa frukt idag? 1. Ja 2. Nej 6. Jag anser att mina impulsköp gällande frukt ökar när jag blir påmind om och uppmärksammar olika frukter. 1 2 3 4 5 6 7 Instämmer Instämmer inte alls helt

- Arvidsson - Palmgren - Rowland -
53
Appendix C Qualitative Interview Questions 1. Have you noticed any difference in sales of bananas, respectively other fruit after the movement of the bananas? What differences? 2. Which one of the two tested layouts do you consider being the most effective for the fruit sales? 3. How do you perceive that the customers reacted to the change? 4. Which fruit do you think was the most popular before, respectively after the change in layout? 5. Spontaneous comments? Qualitative Interview Questions (in Swedish) 1. Har du märkt några skillnader i försäljning av bananer, respektive annan frukt efter förändringen/flytten av bananer? Vilka? 2. Vilken av de två testade layouterna anser du vara mest effektiv för fruktförsäljningen? 3. Hur upplevde du att kunderna reagerade på förändringen? 4. Vilken frukt anser du var mest populär innan, respektive efter förändringen? 5. Spontana kommentarer?

- Arvidsson - Palmgren - Rowland -
54
Appendix D
Maps of the original fruit section layout in both ICA stores. The bananas changed place with the cucumber and the salad in the Landskrona store.
The bananas replaced the scale next to the kiwis at the Malmö store.

- Arvidsson - Palmgren - Rowland -
55
Appendix E Photographs of the original fruit section layout at ICA Kvantum at Landskrona:
Where the bananas would be positioned at the back of the fruit section:

- Arvidsson - Palmgren - Rowland -
56
Appendix F Photographs of the orginal fruit layout at ICA Maxi in Malmö:
Where the bananas would be positioned at the back of the fruit section: