aerodynamics of bridge cables with concave fillet
TRANSCRIPT

This dissertation reports an investigation into the efficiency of two new innova-tive cable surfaces fitted with concave fillets to prevent wind-induced vibration on cable stayed bridges. Focus was directed in particular on the phenomenon of rain-wind induced vibration (RWIV). Furthermore, due to the subsequent increase of the aerodynamic static loading induced by the wind action on bridge cables due to their increasing number and length, an optimal level of aerodynamic forces must be maintained when introducing passive aerodynamic means of vibration suppression on bridge cables.
Celeste Burlina
PhD Thesis
Department of Civil Engineering2018
DTU Civil Engineering Report 400
Aerodynamics of bridge cables with concave fillet
DTU Civil Engineering
Technical University of Denmark
Brovej, Building 118
2800 Kongens Lyngby
www.byg.dtu.dk
ISBN 9788778774972
ISSN 1601-2917
Aerodynam
ics of bridge cables with concave fillet
Celeste Burlina

Aerodynamics of bridge cables
with concave fillets
Celeste Burlina Ph.D. Thesis Department of Civil Engineering
Technical University of Denmark 2018

Supervisors:
Associate Professor H.H. Koss, DTU Byg, Denmark
Professor C.T. Georgakis, Aarhus University, Denmark
PhD S.V. Larsen, FORCE Technology, Denmark
Assessment Committee:
Associate Professor G. Fischer, DTU Byg, Denmark
Professor J.B. Jakobsen, University of Stavanger, Norway
PhD S.O. Hansen, Svend Ole Hansen ApS, Denmark
Copyright ©, Celeste Burlina, 2018
Printed by DTU-Tryk
Department of Civil Engineering
Technical University of Denmark

iii
“An unexamined life is not worth living”
Apology, Plato.
a Ester, Claudio e Virginia, con affetto

iv
Preface This thesis is submitted as a partial fulfilment of the requirements for the Danish Ph.D. degree. The thesis is based on experimental investigations carried out as part of the Ph.D. project “Aerodynamics and icing of bridge cables with concave fillets”, un-dertaken at the Department of Civil Engineering at the Technical University of Den-mark (DTU Byg), Kgs. Lyngby, Denmark and FORCE Technology, Kgs Lyngby, Denmark between October 2014 and January 2018.
The project included an external research stay at the Yokohama University, Yoko-hama Japan.
The principal supervisor of the Ph.D. project was Associate Professor Holger H. Koss from DTU Byg.
The project was financed by FORCE Technology and the Innovation Fund Denmark.
Kongens Lyngby, 27th June 2018
Celeste Burlina

v
Acknowledgments My first debt of gratitude goes to my co-supervisor, Professor Christos T. Georgakis, who has patiently provided the vision, encouragement, advice, and moral support to complete the project. I would like to thank him for giving me the freedom to pursue independent work and thinking, while always being on my side and believing in me.
Special thanks go also to my supervisor Associate Professor Holger Koss and co-supervisor Søren V. Larsen, for their support, guidance and helpful suggestions.
A special thank-you goes to Associate Professor Knud Erik Meyer, who supported me with knowledge, patience and precious work at a crucial moment of my PhD studies.
I’d like to express my gratitude to Philipp Egger, who patiently helped me in the de-velopment and realization of this project.
I gratefully acknowledge the support of VSL International and FORCE Technology who made this PhD possible.
Infinite gratitude goes to my parents and sister, who always encouraged me, supported me, guided me, and believed in me, during this very long journey.
Thanks too to my friends for always standing by my side and giving me inspiration, in particular Tobias Holz, who has been a precious shoulder along the way and Elise Gettliffe who provided me with the energy and support over the end of this journey.


vii
Abstract This dissertation reports an investigation into the efficiency of two new innovative cable surfaces fitted with concave fillets to prevent wind-induced vibration on cable-stayed bridges. Focus was directed in particular on the phenomenon of rain-wind-induced vibration (RWIV), which is known as the most common and damaging type of vibration. The recent increase in the number of longer and lighter cable-stayed bridges has resulted in an increase in the occurrence of this type of vibration, requir-ing an active method of damping (e.g. external dampers between bridge girder and cables). Furthermore, due to the subsequent increase of the aerodynamic static loading induced by the wind action on bridge cables due to their increasing number and length, an optimal level of aerodynamic forces must be maintained when introducing passive aerodynamic means of vibration suppression on bridge cables.
A detailed literature review provided understanding and a basic background on bridge cable aerodynamics, wind and cable interaction in terms of instabilities, a categoriza-tion of various passive techniques of control, and an identification of key mechanisms for reducing design drag force.
During the research, extensive wind-tunnel experiments were undertaken to examine the aerodynamics of the cable modifications currently used as well as the two innova-tive cable surfaces fitted with concave fillets. Two currently used systems consisting of helically filleted cables were directly compared with systems using cables with pat-tern-indented surfaces under the same conditions, and the two cable configurations fitted with helically concave fillets were found to have advantageous properties. Fur-thermore, a parametric investigation was carried out on the concave fillet shape to evaluate its effect on aerodynamic coefficients, and the structure of the flow’s near-wake and rain-rivulet suppression. The results show a complete suppression of rain rivulets and an early suppression of vortex shedding in the sub-critical regime for both the helically concave (HC) and the helically staggered concave (HSC) filleted surface modifications. In particular, the HSC filleted surface showed a low drag force in the post-critical regime, similar to the pattern-indented surfaces despite a 100% increase in the fillet height compared to a traditional helically filleted surface.
Finally, particle image velocimetry (PIV) tests were carried out in a wind tunnel in a cross-flow set-up on scaled samples of the helically concave and helically staggered concave filleted cable surfaces. Both two-dimensional and stereo PIV measurements were taken to gain a complete quantitative and qualitative overview and understand-ing of the development of the near-wake structures in both the streamwise and spanwise directions compared to a plain surface cylinder. The HC filleted surface ex-

viii
hibited a more stable near-wake region than the plain surface. This resulted in a weak-er interaction and early suppression of vortex shedding, a smooth transition of drag force in the critical regime and a constant zero lift force. In contrast, the HSC filleted surface created high turbulence at separation, weakening a further development of large-scale vortices inside the wake with an increased base pressure behind the cylin-der. These results show that the presence of the staggered concave fillets is able to control the flow and prevent the interaction between shear layers creating vortices, which results in a considerable weakening of vortex shedding, and a more stable near-wake turbulent region. This indicates a reduction in the drag force acting on the cylin-der, suppression of vortex shedding, and a smooth transition from the subcritical to the critical regime, with a constant zero lift force.

ix
Resumé (in Danish) Denne afhandling undersøger effektiviteten af to nye innovative kabeloverflader mon-teret med konkave kantrundinger for at afværge vindforårsagede vibrationer på hæn-gebroer. Den mest almindelige og mest skadelige vibrationsart, rain-wind-induced vibration (RWIV), er det primære fokus i denne afhandling. De senere år er antallet af hængebroer vokset drastisk samtidig med at disse bliver bygget længere og lettere end nogensinde før. Denne udvikling har medført et stigende antal observationer af RWIV, hvilket kræver ekstra vibrationsdæmpning (f.eks. eksterne vibrationsdæmpere mellem brodrager og kabel). Da kablerne belastes aerodynamisk og statisk ydereligere i høj vind i kraft af flere og længere kabler, må et optimalt niveau af aerodynamisk påvirkning sikres, når passive aerodynamiske vibrationsdæmpere monteres på kabler-ne.
En detaljeret litteraturgennemgang gav en bred forståelse for aerodynamiske overve-jelser ved brokabler, kablers interaktion med vind med henblik på stabilitet samt kate-gorisering af passive kontrolmetoder med en identifikation af de vigtigste mekaniske metoder til nedbringelse af vindmodstand.
I dette projekt er aerodynamiske undersøgelser af konventionelle kabler samt de to innovative løsninger med konkave kantrundinger foretaget ved eksperimentel vind-tunnel procedure. De to mest brugte systemer, helisk kantrundede kabler og mønster-prægede kabler blev sammenlignet under ens forhold, og begge viste forbedrede egenskaber efter monteringen af konkave kantrundinger. Derudover blev den konkave kantrunding undersøgt parametrisk for at evaluere deres indflydelse på aerodynamiske koefficienter, strukturen af vindstrømmens near wake og afværgelse af rain rivulets. Resultaterne viste en komplet afværgelse af rain rivulets og en tidlig afværgelse af hvirvelafgivning i de subkritiske område, både for helisk konkav konfiguration og forskudt helisk konkav konfiguration. Specielt forskudt helisk konkav konfiguration viser lav vindmodstand i det postkritiske område, sammenligneligt med mønsterpræ-gede kabler trods en 100 % forøgelse af kantrundingshøjden i forhold til traditionel helisk konfiguration.
Endeligt blev particle image velocimetry (PIV) undersøgelse foretaget i en vindtunnel ved cross-flow konfiguration på en nedskalerede prototyper af helisk konkav konfigu-ration og forskudt helisk konkav konfiguration. Målinger fra både todimensionel og stereo PIV blev foretaget for at have et fuldt kvantitativt overblik over og en forståelse for udviklingen i near-wake strukturer både i streamwise og spanwise retninger i for-hold til en cylinder med ordinær overflade. Helisk konkav overflade viser et mere sta-bilt near-wake område og tidlig afværgelse af hvirvelafgivning, en blød overgang i

x
vindmodstand, og ingen løftekraft. På den anden side viser forskudt helisk konkav konfiguration høj turbulens i strømadskillelsen, hvilket modvirker yderligere udvik-ling af større hvirvler i near wake med højnet tryk bag cylinderen. Dette beviser at brug af konkav kantrunding kan kontrollere luftstrømmen og modvirke at interaktio-nen mellem shear layers skaber hvirvler, hvilket resulterer en stærk dæmpning af hvirvelafgivning og et mere stabilt near-wake turbulensområde. Dette kan ses som indikation for reduktion af cylinderens luftmodstand, nedbringelse af hvirvelafgivning og en blød overgang fra det subkritiske til det kritiske område, og dette uden løfte-kraft.

xi

xii
Table of Contents
Preface .......................................................................................................................... iv
Acknowledgments ........................................................................................................ v
Abstract ....................................................................................................................... vii
Resumé (in Danish) ..................................................................................................... ix
Table of Contents ....................................................................................................... xii
Introduction ................................................................................................................ 16
1.1 Objectives .............................................................................................................. 18
1.2 Methodology .......................................................................................................... 18
1.3 Thesis Outline ....................................................................................................... 19
Literature review ....................................................................................................... 22
2.1 Basic aerodynamics of bridge cables .................................................................. 24
2.1.1 Flow around a circular cylinder ..................................................................... 25
2.1.2 Forces on a circular cylinder ........................................................................... 29
2.2 Bridge cable aerodynamic response and countermeasures .............................. 31
2.2.1 Vortex shedding ................................................................................................ 32
2.2.2 Buffeting ............................................................................................................ 34
2.2.3 Dry-state vibrations ......................................................................................... 35
2.2.4 Rain-wind induced vibration .......................................................................... 41
2.2.5 Ice-wind-induced vibration ............................................................................. 47
2.3 Aerodynamic control of bridge cables ................................................................ 48

xiii
2.3.1 Devices based on direct transition to turbulence .......................................... 49
2.3.2 Devices based on early separation and reattachment ................................... 51
2.3.3 Wake dephasing and three-dimensional disturbance ................................... 55
Aerodynamics and rain rivulet suppression of bridge cables with concave fillet 65
Abstract .............................................................................................................................. 65
3.1 Introduction .......................................................................................................... 66
3.2 Sectional model ..................................................................................................... 68
3.3 Experimental work ............................................................................................... 69
3.3.1 Wind tunnel facilities ....................................................................................... 69
3.3.2 Normal flow test set-up .................................................................................... 70
3.3.3 Flow visualization ............................................................................................. 71
3.3.4 Rain-rivulet suppression .................................................................................. 71
3.4 Results and discussion .......................................................................................... 73
3.4.1 Rain-rivulet suppression .................................................................................. 73
3.4.2 Force coefficients .............................................................................................. 76
3.4.3 Fluctuating lift forces ....................................................................................... 79
3.4.4 Flow visualization tests .................................................................................... 80
3.5 Conclusions ........................................................................................................... 83
Flow structures and wake development behind a cylinder with surface concave
fillets in cross flow – 2D ............................................................................................. 86
Abstract .............................................................................................................................. 86
4.1 Introduction .......................................................................................................... 87
4.2 Models .................................................................................................................... 91
4.3 Proper orthogonal decomposition (POD) method ............................................. 92

xiv
4.4 Experimental details ............................................................................................. 93
4.4.1 Flow configuration and flow regime ............................................................... 93
4.4.2 Particle image velocimetry (PIV) set-up ........................................................ 94
4.4.3 Measurement accuracy .................................................................................... 96
4.5 Near-wake mean velocity fields ........................................................................... 96
4.5.1 Mean velocity fields .......................................................................................... 96
4.5.2 Turbulent kinetic energy (TKE) ..................................................................... 99
4.5.3 Reynolds shear stresses (RSS) ....................................................................... 101
4.6 Boundary layer separation mean velocity fields .............................................. 103
4.7 Proper orthogonal decomposition (POD) analysis .......................................... 105
4.8 Conclusions ......................................................................................................... 113
Flow structures and wake development behind a cylinder with surface concave
fillets in cross flow – 3D ........................................................................................... 116
Abstract ............................................................................................................................ 116
5.1 Experimental details ........................................................................................... 117
5.1.1 Flow configuration ......................................................................................... 117
5.1.2 Stereo Particle image velocimetry (SPIV) set-up ........................................ 118
5.1.3 Measurement accuracy .................................................................................. 120
5.2 Wake topology and mean flow fields ................................................................ 121
5.3 Turbulent kinetic energy (TKE) mean flow fields .......................................... 124
5.4 Proper orthogonal decomposition (POD) analysis .......................................... 126
5.5 Reynolds shear stress (RSS) mean flow fields .................................................. 133
5.6 Conclusions ......................................................................................................... 136

xv
Conclusions ............................................................................................................... 140
6.1 Future work ........................................................................................................ 143
References ................................................................................................................. 146
Appended conference papers .................................................................................. 165
Paper 1: Preliminary evaluation of two new cable surface innovations ............. 166
Paper 2: Comparative analysis of bridge cables with concave fillets .................. 174
Paper 3: Optimization of bridge cables with concave fillets ................................ 185

16
Chapter 1
1 Introduction In the closing decades of the last century, cable-stayed bridges underwent remarkable developments in the search for increasingly longer spans, becoming the preferred op-tion for mid- to long-range span bridges. The resulting reduced stiffness and lowered inherent structural damping made the structures more susceptible to wind action and thus more prone to flow-induced vibration. Extensive research and full-scale experi-ments have been undertaken in the field of bridge aerodynamics. In particular, it has been noticed that stay cables are extremely vulnerable to wind excitation, since they are characterized by low mechanical damping. They play an essential role in the dy-namic stability and functionality of the entire structure, Fujino et al. (2012).
In recent decades, numerous efforts have been made to understand the mechanisms of various types of wind-induced cable vibration and to find control strategies that can alleviate vibration phenomena. Cable excitation mechanisms are usually categorized into two forms: those originated by cable-fluid interaction and those due to end load-ing of the cable. To the first group belong vortex shedding, high reduced-velocity vor-tex shedding, drag crisis, dry inclined galloping, ice-induced vibration, wake-induced vibration, and rain-wind-induced vibration. To the second group belong deck-cable interaction-induced vibration such as parametric excitation mechanisms, and struc-ture-induced vibrations.
While the aerodynamics of bridge decks had already become a concern in the design process in relation to flutter instability in the 1940s following the collapse of the Ta-coma Narrows Bridge, it was not until the 1970s that concern shifted towards cable

1.1 Objectives
17
stays due to the appearance of large-amplitude vibration, such as reported on the Brotonne Bridge in France, Wianecki (1979). In the following decade, due to the in-crease in bridge spans with longer cables installed, several severe problems involving the presence of rain and wind were identified on numerous bridges. This type of vi-bration, generally referred as rain-wind-induced vibration (RWIV) is the most fre-quently observed vibration mechanism on bridges. It was recognized in 1988 during the construction of the Meiko-Nishi Bridge in Japan. In this case, the bridge cables experienced large-amplitude vibration under the combination of certain wind condi-tions, in terms of velocity and direction, only when it was raining (Hikami and Shai-raishi, 1988). Since then, this type of vibration has constituted 95% of the incidence of cable stay vibration, and therefore there is a major interest in controlling this phenom-enon. Other types of vibration, such as vortex-induced vibration and vibration in dry weather conditions at relatively high Reynolds numbers, have been witnessed on sev-eral bridges. Examples of bridges with a history of cable vibration include the Second Seven Crossing (UK), the Øresund Bridge (DK-SE), and the Fred Hartman Bridge (USA).
Cable vibrations rarely lead to complete failure, but premature fatigue damage and bridge closure are common issues. Furthermore, bridge owners are often concerned about serviceability and user confidence in terms of safety when crossing the bridge.
In the ultimate limit state, as bridge spans increase, stay cable aerodynamics are of increasing importance due to high static wind loading, which often exceeds that car-ried by the combined effect of the bridge deck and pylons. The longest spanning stay-cable bridges experience up to 70% of the total horizontal wind loading through the stay cables (Gimsing and Georgakis, 2012). The drag force performance of stay ca-bles is therefore becoming essential for further development of bridge span lengths.
Cable suppliers or bridge owners have been obliged to take counter-measures, such as placing mechanical dampers between the cable and the bridge girder or crossties be-tween cables, to reduce vibration. With increasing bridge spans, these applications are becoming less effective and aesthetically unpleasant. As a result, cables would benefit from supplementing passive aerodynamic vibration control methods with shape or surface modifications which can also reduce drag force.
Most of these modifications come in the form of helical fillets, extensively used in Europe and America, or in the form of dimples, used mainly in Asia. The main pur-pose of these modifications is rain-rivulet impedance, because the presence of one or more longitudinally running rivulets on the cable surface is considered one of the in causes of the initiation of wind-induced vibration. Nevertheless, the introduction of helical fillets and dimples has not completely eliminated RWIV, so bridge owners of-

18 Department of Civil Engineering, Technical University of Denmark
ten also install cable vibration dampers or cross-ties (Kleissl and Georgakis, 2013). Previous research (Yagi, 2011 and Kleissl and Georgakis, 2013) has shown that by modifying the shape, alignment and configuration of the protuberances on the HDPE tube, it is possible to eliminate or further reduce both RWIV and drag force. In partic-ular, modifications in the form of a concave fillet, studied by Kleissl and Georgakis (2013), were found to outperform traditional surfaces, showing similar aerodynamic coefficients to a traditional helical fillet or dimpled surface despite a significant in-crease in the fillet height.
1.1 Objectives The main objective of the present research was to further examine the aerodynamic performance and understand the behaviour of the innovative bridge cable surfaces with concave fillets, particularly in comparison with plain, dimpled and helically fil-leted surfaces. Focus was on determining the flow structure and development of the near wake of bridge cables, so as to make it possible to adjust and improve concave fillets for the purpose of drag reduction, while at the same time guaranteeing optimal rain-rivulet suppression.
1.2 Methodology To achieve the aforementioned objectives, the research was divided into three main parts:
- The first part consisted in a review of the literature and the state of the art. Basic fluid dynamics around a circular cylinder were explored because they are of major importance for understanding the flow structures defining aero-dynamic forces and wind-induced vibration, which usually appears within the critical Reynolds number range. Thus, force acting on the cable and interaction between the air flow and the body itself it reviewed. As a result, an overview of the various vibration mechanisms induced by the effect of the dynamic and by the shape and surface irregularities is given. Finally, a comprehensive re-view is given on passive control methods, as these are the most widespread applications in cable-stayed bridges due to their high reliability (Chapter 2)
- In the second part of the work, extensive wind tunnel tests were carried out. Different samples with varying concave fillet heights and configurations were tested in comparison with traditional surfaces in terms of aerodynamic forces and rain-rivulet suppression. Furthermore, flow visualization tests were made to investigate the flow separation mechanism induced by the presence of the different fillet shapes. This investigation took into account our understanding

1.3 Thesis Outline
19
of the dependency of the height and radius of the concave fillets on rain-rivulet suppression and on the development of the wake in relation to the resultant drag and lift coefficients (Chapter 3).
- In the third part a combination of two-dimensional and stereoscopic particle image velocimetry (PIV), mean velocity field statistical analysis, and proper orthogonal decomposition (POD) was applied to quantitatively investigate the flow structure created by the presence of the concave fillets in the two differ-ent configurations. In particular, the focus was on the relationship between vortex shedding, boundary layer, and shear-layer evolution in relation to the subsequent drag level. These results might give us a better understanding of the flow dynamics generated by the concave fillet fitted on circular cylinders for possible future modifications (Chapter 4 and 5).
1.3 Thesis Outline The thesis is divided into six chapters which follow the chronological sequence of the research.
Chapter 2: Literature review provides a review of the literature on the basic aerodynamics and responses of bridge cables, and on aerodynamic control methods against wind-induced vibration.
Chapter 3: Aerodynamics and rain rivulet suppression of bridge cables with concave fillets (accepted paper in Journal of Wind and Structures) presents the results of the static wind tunnel tests undertaken in cross-flow on traditional bridge cable surface modifications and on innovative bridge cable surfaces with concave fillets. Results on rain-rivulet suppression and flow vis-ualization are also presented.
Chapter 4: Flow structures and wake development behind a cylinder with surface concave fillets in cross-flow – 2D (submitted paper in Journal of Experimental Thermal and Fluid Science) gives the results of two-dimensional particle image velocimetry (PIV) tests performed on scaled sam-ples of innovative bridge cable surfaces with concave fillets. The results are presented in terms of mean velocity field statistical analysis and proper or-thogonal decomposition (POD) in order to identify the governing flow struc-tures induced by the presence of the concave fillets.
Chapter 5: Flow structures and wake development behind a cylinder with surface concave fillets in cross-flow – 3D (submitted paper in Journal of Experimental Thermal and Fluid Science) gives the results of stereoscopic

20 Department of Civil Engineering, Technical University of Denmark
particle image velocimetry (PIV) tests performed on scaled samples of innova-tive bridge cable surfaces with concave fillets. The results are presented in terms of mean velocity field statistical analysis and proper orthogonal decom-position (POD) in order to identify the governing flow structures induced by the presence of the concave fillets.
Chapter 6: Conclusions presents the overall conclusions of the dissertation.

1.3 Thesis Outline
21

22 Department of Civil Engineering, Technical University of Denmark
Chapter 2
2 Literature review In the recent decades, there has been a large proliferation of cable-supported bridges worldwide. The spans of these bridges have increased exponentially, leading to an increased number of stay-cables and cables length. As a result, the wind loading act-ing on bridge cables is comparable to the load acting on the deck (Gimsing and Geor-gakis, 2012). Resulting in slender structures, they are susceptible to external forces, and most vibrations are caused by the wind action under different conditions. Vibra-tions are a topic of major interest, they can introduce undue stress and fatigue in the cables section and in the connection between the cable and the bridge deck. This will later result in problems in serviceability limits and lack of reliability of the overall structure.
In order to introduce efficient and optimal solutions to counteract stay-cable vibra-tions, the complexity of the dynamic characteristics of the phenomena have been largely studied. The mechanisms have been investigated following mainly three com-plementary approaches: theoretical modelling, i.e. finite element model; full-scale monitoring of bridges, and static and dynamic wind tunnel testing of scaled or full-scale cable sections, under different climatic conditions, i.e. dry, wet or iced. The re-sults of these experimental studies have proven that the response and instability of the cable subjected to wind load depends on many different variables. These variables can be identified as cable properties (surface roughness and irregularities, deviation from perfectly cylindrical shape, cable inclination), as structural properties (mass, damping

1.3 Thesis Outline
23
and stiffness), as cable surface conditions (dry, wet or iced), as well as wind condi-tions (wind velocity, wind angle-of-attack, turbulence intensity) (Matteoni, 2014).
Figure 2.1 - Violent cable vibration observed under the occurrence of wind and rain. From Matsumoto et al., 2006.
From the interaction between wind and cable, and from the resulting combination of different parameters, various phenomena can arise (i.e. axial flow, inner circulatory flow on cylinder side, rain rivulet, ice accretion) that can alter the stability of the cable and result in severe cable vibrations. These phenomena are usually categorized in re-gard to the climatic conditions under which they occur (dry, rain or ice).
Significantly severe cable vibrations have been identified in dry weather conditions for inclined stay-cables in field and later experimentally reproduced in wind tunnel facilities. The responses have been explained and divided in two categories: limited amplitude motion in a limited range of wind speeds and divergent motion (dry in-clined galloping) (Matsumoto et al., 2010). The mechanisms and causes of that are still unclear and will be further discussed in Section 2.2.3.
Under the combination of wind and rain, there is enough experimental and observa-tional evidence to suggest that serious vibrations initiated on inclined-cables are pro-voked by the circumferential oscillation of the upper and lower rivulets, which syn-chronize with the cable frequency. This coupling is seen as a prerequisite for large amplitude vibrations and has been identified as Rain-wind-induced vibration (RWIV) (Hikarami and Shiraishi, 1988) (Section 2.2.4).
Ice and snow accretion of stay-cables have been and are more frequently witnessed on bridges, but no field monitoring has been collected so far. It has become of major concern since it can induce aerodynamic instability, serviceability and safety issues and structural failure. The influence of ice on the aerodynamic stability has first been

24 Department of Civil Engineering, Technical University of Denmark
studied in regard to electrical power lines (Farzaneh, 2008) and in bridge engineering (Demartino et al., 2015) (Section 2.2.5).
Countermeasures have been adopted and come mainly in three forms: the placement of dampers between the cables and the bridge girder, cross-tie between the cables, and aerodynamic control which results from manipulation of the cable section shape and surface (Hojo et al., 2000).
Intensive efforts have been made to investigate and to provide appropriate aerody-namic devices against wind-induced vibrations because they require little maintenance and are generally more reliable and cost-effective (Yamaguchi and Fujino, 1998).
This chapter focuses on the basic characteristic of the aerodynamic of a circular cylin-der in terms of flow structures, aerodynamic forces (Section 2.1); on the various vi-bration mechanisms induced by the interaction of wind and stay-cable under different weather conditions (Section 2.2) and on a selective retrospect of studied flow control methods with possible application on stay-cables (Section 2.3). In this way, the litera-ture review aims to provide an overall background of the design scope and possible solutions that the introduction of new cable surfaces fitted with concave fillet in two different configurations can provide in terms of stay-cable stability and level of aero-dynamic forces, compared to existing aerodynamic solutions.
2.1 Basic aerodynamics of bridge cables Bridge cables are submerged in a wind field which is generally described as the sum of three orthogonal components, i.e. an along-wind horizontal component 𝑈 +𝑢(𝑡) where 𝑈 is the free-stream wind velocity and 𝑢(𝑡) is the turbulent component, an across-wind turbulent horizontal component 𝑣(𝑡), and a vertical turbulent component 𝑤(𝑡) (Van der Hoven, 1957).
Bridge stay-cables are usually treated as slender linear body with a circular cross sec-tion. The orientation of the cable is defined through the wind-cable angle 𝜙, i.e. the angle between the mean flow and the cylinder axis (Figure 2.2). The wind-cable angle 𝜙 is defined as:
𝜙 = 𝑎𝑟𝑐𝑐𝑜𝑠(𝑐𝑜𝑠𝛩𝑐𝑜𝑠𝛽) (2.1)
where 𝛽 is the yaw angle, i.e. the angle on the horizontal plane between the projection of the cylinder axis and the mean flow, and Θ is the inclination angle, i.e. the angle between the horizontal plane and the cylinder axis. If 𝜙= 90°, a cylinder is said to be in cross flow, otherwise the cylinder is defined as inclined and/or yawed (Demartino, 2017).

2.1 Basic aerodynamics of bridge cables
25
The interaction between the wind field and the stay-cable rises different wind compo-nents and forces acting on the body. The free stream wind velocity U can be divided into two components: a normal flow 𝑈4, perpendicular to the cylinder axis, and an axial flow 𝑈5, parallel to the cylinder axis. The aerodynamic loading can be divided into a static and a dynamic contribution. Static force coefficients are defined as: 𝐶7, along-wind force coefficient, related to the 𝑈4, and 𝐶8, the across-wind force coeffi-cient, which is perpendicular to 𝐶7 . The dynamic forces are generated by pressure fluctuation in the flow (buffeting), by periodic vortices shed from the surface of the body and developing into the wake (vortex-shedding) and by the interaction of flow mechanisms and the oscillating body (motion-induced forces) (Strømmen, 2010). Buf-feting is the reaction of the body to turbulence in the incoming flow (or turbulent wake). Thus, buffeting in not confined to certain wind speeds. Vortex-shedding is usually constrained into velocities below the critical regime and is generally self-limiting and limited in amplitude response. Motion-induced forces are generally large in amplitude and can lead to divergent motion; depending on the weather condition occurrence, they can act in sub-critical regime (wet state) or in critical regime (dry state) (Matteoni, 2014).
Figure 2.2 - Schematic of the cylinder with turbulent flow definitions and reference systems definition.
Governing parameters, basic of fluid dynamics around a circular cylinder are present-ed in this section along with wind loading and force components. Motion-induced forces under different weather conditions will be treated separately in Section 2.2.
2.1.1 Flow around a circular cylinder
Flows around cylinders in most practical applications are likely to be affected by a wide variety of disturbances, which can be conveniently quantified using an appropri-ate set of governing parameters. The property of the disturbed flow and the new forces

26 Department of Civil Engineering, Technical University of Denmark
acting on the body itself, depend on the body characteristics, fluid characteristics and the wind velocity (Burlina, 2014). The expansion of the disturbed flow is governed by the shape, orientation and size of the body, on velocity and viscosity of the fluid as well as a variety of small disturbances (Cosentino, 2003).
It should be noted that, when a circular cylinder is inclined and/or yawed, the flow behind the circular cylinder is characterized by a highly three-dimensional structure. The different flow structures that characterise different flow regimes are affected by the cable inclination, which initiate different wake patterns and vortices, compared to a cylinder in cross-flow. These characteristics are of major importance in the initiation of wind-induced vibration (see Section 2.2). In this section, we will focus only on flow regime created by a circular cylinder placed in cross-flow.
2.1.1.1 Basic characteristic of the flow around a circular cylinder in cross flow
When a fluid flows around a stationary body or a body moves through a fluid in a rest condition, a region of disturbed flow always forms around the body. The properties of the disturbed flow, and its effect on the body itself, depend on the body and fluid characteristics. They are described by quantities that depend on the non-dimensional cylinder Reynolds number:
𝑅𝑒 = ;<=
(2.2)
where U is freestream wind velocity, D is the characteristic dimension of the body (the cable diameter in case of a cable), and v is the kinematic viscosity of the air. The kinematic viscosity is expressed as v=µ/ρ where µ is the air viscosity and ρ is the air density. Being a dimensionless parameter, the Reynolds number allows for compari-son between flow characteristics and fluid dynamics created by different cylinder characteristics (Zdravkovich, 1997).
As explained by Zdravkovich (1997), the disturbed flow is characterized by the varia-tion of local velocity in magnitude, direction and time. Furthermore, it is possible to identify four different regions around the circular body: a narrow region where the velocity is close to zero, which is called stagnation point (I); two boundary layers at-tached to the surface of the cylinder (II); two sidewise regions of accelerated flow (III); and one downstream region of separated flow called the wake (IV) (Figure 2.3).
The flow undergoes many different changes as Reynolds number increases, involving the wake, separated shear layer and boundary layer, which create different flow re-gimes. A detailed description of flow regimes can be found in Zdravkovich (1981 and 1997) and in Sumer and Fredsøe (1997). It is presented here, following terminology used by Zdravkovich (1997).

2.1 Basic aerodynamics of bridge cables
27
The flow behaviour past a circular cylinder is associated with various instabilities, in-volving the wake, separated shear layers and boundary layer (Zdravkovich, 1997). At low Re numbers the disturbed flow is characterized by a laminar behaviour (laminar
REGIME
NO SEPARATION
PAIR OF
STATIONARY
VORTICES
LAMINAR VORTEX
SHEDDING
TURBULENT
VORTEX SHEDDING
Re Range 0 < Re < 5 5 < Re < 40 40 < Re < 200 200 < Re < 300
𝑪𝑫 𝐶< > 4 4 > 𝐶< > 2.1 2.1 > 𝐶< > 1.5 1.5 > 𝐶< > 1.3
𝑪𝑳 0 0 0 0
St / / 0.1 < St < 0.2 0.2 ≈ St ≈ 0.2
Sketch
REGIME
SUBCRITICAL
CRITICAL
UPPER TRANSITION
POST-CRITICAL
Re Range 300 < Re < 3 x 10⁵ 3 x 10⁵< Re < 3.5 x 10⁵ 3.5 x 10⁵< Re < 4.5 x
106
Re > 4.5 x 10⁶
𝑪𝑫 1.3 > 𝐶< > 1.2 1.2 > 𝐶< > 0.3 0.3 < 𝐶< < 0.5 0.5 < 𝐶< ?
𝑪𝑳 0 ≈ 1.3 0 0
St 0.2 ≈ St ≈ 0.2 0.2 < St < 0.45 0.45 > St > 0.25 0.25 > St ?
Sketch
Table 2.1 – Aerodynamic regimes and flow characteristics around a perfectly circular cylinder. After Sumer and Fredsøe, 1997 and Demartino et al. (2017)
state of flow, L). At Re (< 5), the flow is entirely laminar and remains attached to the cylinder surface (non-separation regime, L1). At approximately Re=5–6, the flow sep-arates from the rear of the cylinder and a pair of attached eddies are formed. As the Reynolds number increases, the eddies become elongated and the laminar wake be-comes elongated and more unstable (near-wake regime, L2). When Re reaches around 30–40, the instability in the wake region leads to the development of a vortex street with the eddies alternating in shedding on both side of the cylinder with a periodic rate that increases with increasing values of Re. This phenomenon is called vortex shedding. The wake is characterized by forming a vortex street, which is laminar for 40 < Re < 200 (periodic laminar regime, L3) and becomes turbulent for 200 < Re < 400 (transition in the wake state of flow, TrW). This former Reynolds interval is char-acterized by two flow states: a transition of laminar eddies in the wake for 200 < Re < 250 (TrW1) and a transition of an irregular eddy during its formation for 250 < Re < 400 (TrW2).

28 Department of Civil Engineering, Technical University of Denmark
In the range 300 < Re < 2.5-3 x 10⁵, the vortex shedding become less regular and tur-bulence in the wake progressively spreads upstream towards the cylinder. Separation of the laminar boundary layer on the cylinder moves progressively forward with in-creasing Reynolds numbers. This regime is known as the subcritical regime, charac-terized by a transition in the shear layer (TrSL). It is possible to identify three shear layer transitions: one characterized by development of the transition waves for 300 < Re < 1.03 (TrSL1), a second characterized by formation of transition eddies for 1.03 < Re < 2.0 x 10⁴ (TrSL2), and a last one characterized by a burst to turbulence for 2.0 x 10⁴< Re < 2.5-3 x 10⁵ (TrSL3).
As the Reynolds number increases above the value of about 3 x 10⁵, the transition from laminar to turbulent flow in the boundary layer moves on to the rear of the cyl-inder (transition in boundary layer, TrBL). The laminar boundary layer initially sepa-rates at about 𝜃= 90–100°, just ahead of the transition to turbulent flow on one side of the cylinder, but then the turbulent boundary layer reattaches downstream and forms a localized separation bubble for 3.0 x 10⁵< Re < 3.8 x 10⁵ (TrBL1). Turbulent re-separation occurs further back on the cylinder at about 𝜃= 120–140°. With increasing Re, separation bubbles form on both sides of the cylinder for 3.8 x 10⁵< Re < 5 x 10⁵ (TrBL2). As the Reynolds number increases, the rearward movement of the final sepa-ration point is accompanied by a rapid narrowing of the wake in which there is no dominant periodicity of vortex shedding. The laminar separation bubble progressively shrinks in size until a Reynolds number of approximatively 1.5 x 10⁶ (TrBL3). With increasing Re, the separation bubble completely disappears and a pronounced vortex shedding recommences. When Re > 4.5 x 10⁶, the boundary layer over the cylinder becomes fully turbulent. This is called the post-critical regime (TrBL4).
Figure 2.3 – Regions of disturbed flow. Based on Zdravkovich, 1997.

2.1 Basic aerodynamics of bridge cables
29
Chapters 4 and 5 present an in-depth analysis of the flow past a circular cylinder in cross flow in the high subcritical regime. Flow visualization experiments were carried out using particle image velocimetry (PIV) to analyse wake structures and instabili-ties. The purpose of these experiments was first to identify the main coherent struc-tures of the flow around a circular cylinder and second to determine how the presence of the concave fillets in two different configurations could affect the flow structure around a circular cylinder in a cross flow. In particular, the focus was on the relation-ship between vortex shedding, boundary layer, shear layer evolution and subsequent level of aerodynamic forces.
2.1.2 Forces on a circular cylinder
The flow around a circular cylinder described in Section 2.1.1.1 will apply a force on the circular cylinder, which can be divided into two contributions, one derived from pressure and a second one derived from friction (Sumer and Fredsøe, 1997).
The in-line components of the resultant force per unit length due to pressure and fric-tion are:
𝐹C,7 𝑡 = 𝑝(𝜃, 𝑧, 𝑡)GHI cos 𝜃 𝑅𝑑𝜃 (2.5)
𝐹N,7 𝑡 = 𝜏P(𝜃, 𝑧, 𝑡)GHI sin 𝜃 𝑅𝑑𝜃 (2.6)
where p is the surface pressure and 𝜏P is the shear stress, R is the radius.Shear stress, or friction, is associated with the development of boundary layers and it scales with Re.
The total along-wind force per unit length, or mean drag, is the sum of these two con-tributions:
𝐹< 𝑡 = 𝐹C,7 𝑡 +𝐹N,7 𝑡 (2.7)
Similarly, the cross-wind components of the resultant force per unit length due to pressure and friction are:
𝐹C,8 𝑡 = 𝑝(𝜃, 𝑧, 𝑡)GHI sin 𝜃 𝑅𝑑𝜃 (2.8)
𝐹N,8 𝑡 = 𝜏P(𝜃, 𝑧, 𝑡)GHI cos 𝜃 𝑅𝑑𝜃 (2.9)
The total across-wind force per unit length, or lift, is the sum of these two forces:
𝐹S 𝑡 = 𝐹C,8 𝑡 +𝐹N,8 𝑡 (2.10)
The aerodynamic force coefficients are defined as follows:
𝐶< 𝑡 = TU VI.XY;Z<
(2.11)

30 Department of Civil Engineering, Technical University of Denmark
𝐶S 𝑡 = T[ VI.XY;Z<
(2.12)
The aerodynamic coefficients can be separated into time-averaged components, mean drag and lift coefficients, and fluctuating components, fluctuating drag and lift coeffi-cients:
𝐶< 𝑡 = 𝐶< +𝐶<\ (𝑡) (2.13)
𝐶S 𝑡 = 𝐶S +𝐶S\(𝑡) (2.14)
The in-line force acting on the cylinder (drag force) exhibit a periodic change oscillat-ing around the mean drag, while cross-wind component will be zero due to the sym-metric nature of the flow on the side of the circular cylinder. Nevertheless, the instan-taneous cross-flow force (lift force) will not be zero, and can be rather large depend-ing on the flow regime and evolution of vortex shedding (Sumer and Fredsøe, 1997).
Figure 2.4 – Variation of force coefficients with Reynolds number for a circular cylinder normal to the flow. Based Zdravkovich, 1981.
Despite changes in aerodynamic forces can be affected by level of incoming turbu-lence, surface roughness, cross-sectional shape and cable inclination, in this section we will focus only on the effect of different flow regimes (increase in Reynolds num-ber and vortex shedding) for a cylinder in cross flow.
As shown in Figure 2.4, in the subcritical regime (300 < Re < 3 x 10⁵) force coeffi-cients and vortex shedding frequency are not affected by Reynolds number changes: the drag force maintains a constant value (around 1.2) and the lift force is zero. When the Reynolds number attains the value of approximately 3 x 10⁵, which correspond to the beginning of the single bubble regime (TrBL1), there is a drastic change in the

2.2 Bridge cable aerodynamic response and countermeasures
31
drag coefficients and the appearance of a non-zero mean lift coefficient. This phe-nomenon is called drag crisis, characterized by the rapid drop in the drag coefficient from about 𝐶<=1.2 to 0.25. TrBL1 is followed by a discontinuous fall in 𝐶< and 𝐶S at the start of the two bubbles regime (TrBL2). This region is characterized by a wide variation of 𝐶<, with the bottom curve corresponding to a preservation of the two bubbles and the top curve corresponding to a fragmentation of the bubbles (Zdravko-vich, 1997).
2.2 Bridge cable aerodynamic response and countermeasures
Flow regimes are characterized by coherent structures that characterized the wake of the circular cylinder. Vortex shedding phenomenon is the most important flow feature of the different flow regimes, and is represented by alternating vortices shedding on both sides of the cylinder. Vortex shedding it is not a risk for the stability of bridge cables, but its suppression can lead to separation delays and reduction of aerodynamic forces. In most cases large amplitude vibrations on bridge stay-cables are caused by dry galloping, vortex-induced vibrations at high reduced velocity (dry state) (Matsu-moto, 1999, Chen et al., 2003), galloping in the presence of rain (wet state) (Hikami and Shiraishi, 1988), sleet, snow or ice (iced state) (Koss and Lund, 2013). In-service bridge stay-cable vibrations occur within the critical Reynolds number region. Operat-ing, in the critical range, stay cables are subject to strong changes of aerodynamic forces (Macdonald and Larose, 2008a). Flow structures are characterized by asym-metry and sudden changes of dominant coherent structures, and are susceptible to crit-ical Reynolds number transitions, influence of the cable-wind angle, angle-of-attack, surface imperfections and level of turbulence (Macdonald and Larose, 2008a). This section contains a description of these instabilities, based on field monitoring and ex-perimental work performed on stay cable surfaces in full-scale conditions.
Theoretical modelling
Much effort has been invested in the development of analytical models to predict in-stability in bridge cables. Various models have been developed for different surface states, because different climate conditions acting on the cable surface induce differ-ent boundary conditions. In dry conditions, the cross-section is usually considered time-invariant, while in rain and ice conditions the shape of the cable is considered time-dependent, because the time fluctuations of the cross-sectional shape happen faster than the aerodynamic phenomena that cause the instabilities. Nevertheless, in frozen conditions when the time variation of the cross-sectional shape is slower than

32 Department of Civil Engineering, Technical University of Denmark
the aerodynamic phenomena, analytical models can neglect the time dependency (Matteoni, 2014).
Macdonald and Larose (2008a) developed a theoretical model aimed at clarifying the mechanism of dry inclined galloping. It was derived for the quasi-steady aerodynamic damping of vibration in any yawed/inclined cylinder in any given plane, including 3-D and Reynolds effects. They showed that the model covered the special cases of Den Hartog Galloping (Section 2.2.1), conventional quasi-steady aerodynamic damping, the drag crisis, and sub-critical aerodynamic damping of inclined cables. This particu-lar model applies in both dry and iced conditions, due to the time invariance of the cases.
In the case of rain, a lot of research has been done to further understand the mecha-nism of RWIV (Flamand, 1995; Bosdogianni and Olivari, 1996; Matteoni and Geor-gakis, 2013). Li et al., 2013 present an overview of the models and their validity of application.
2.2.1 Vortex shedding
From the different flow regimes previously described, the most important flow fea-ture, is the vortex shedding phenomenon, which characterizes all regimes for Re > 40.
Regular vortex shedding into the wake of a long bluff body results from the rolling-up of the separating shear layers alternately on one side, then the other, and occurs on bluff-bodies of all cross sections. A regular pattern of decaying vortices, known as the Karman vortex ‘street’, appears in the wake of the body. Turbulence in the approach-ing flow tends to make the shedding less regular, but the strength of the vortices is maintained or even enhanced. As each vortex is shed from a bluff-body, a strong cross-wind force is induced towards the side where the vortex was shed. In this way, the alternate shedding of vortices induces a nearly harmonic sinusoidal cross-wind variation on the body (fluctuating lift force) (Holmes, 2001).
The shedding of the vortices is characterized by a frequency which is a function of the Reynolds number. The vortex shedding frequency, when normalized by the cylinder diameter D and the incoming wind velocity U, can be defined by the Strouhal num-ber:
𝑆𝑡 = _̂<;
(2.3)
where 𝑓= is the average frequency of the vortex shedding.
For a circular cylinder in cross flow, the St remain practically constant in the subcriti-cal regime with a value of 0.20. The Strouhal frequency experiences a sudden jump in

2.2 Bridge cable aerodynamic response and countermeasures
33
the drag crisis region from a value of 0.20 to 0.45. The increased St in the supercritical regime is caused by the turbulent boundary layer, which causes a delay in the separa-tion on the rear side of the cylinder. In this way, the shed vortices interact at a faster rate than in the subcritical regime (Sumer and Fredsøe, 1997).
The vortices shed at both sides of the cylinder induce a sinusoidal excitation on the circular cylinder which are characterized by small amplitudes vibrations. Neverthe-less, if the cable frequency synchronizes with the vortex shedding frequency 𝑓=, a res-onance take place which leads to increased oscillations and additional across-wind loads for a certain range of wind velocities (de Sa Caetano, 2007). This phenomenon is generally referred as vortex-induced vibration and usually it occurs in the subcriti-cal regime.
Figure 2.5 – Detailed picture of flow near separation for a plain circular cylinder (a), for a plain circular cylinder with fitted with fillet lower than boundary layer thickness 𝜹 > 𝒉 (b) and for a plain circular cylinder with fitted with fillet higher than boundary layer thickness
𝜹 < 𝒉 (c).
Vortex shedding countermeasures
Vortex shedding occurs only under the interaction of the two shear layers. If this in-teraction is in some way obstructed, no vortex shedding will occur. The suppression of vortex shedding can give rise to separation delay, reduction and control of drag and lift fluctuations, and decrease in noise and induced vibrations. As a result, it can be advantageous to design bridge stay cables to suppress this phenomenon at an early stage in the subcritical Reynolds range. This can often be achieved using passive con-trol methods, such as surface modifications applied on plain surface bridge cables.
For a traditionally helically filleted surface vortex shedding ceases when the boundary layer undergoes the transition from laminar to turbulent at Re = 1.8 x 10⁵ (Kleissl et al., 2011b, Burlina et al., 2017). The work of Ekmekci et al. (2014) showed that, be-

34 Department of Civil Engineering, Technical University of Denmark
yond the critical location, the helical protrusions alter the shear layer and the overall near-wake characteristics. But, because the protrusions are smaller than the boundary layer thickness, they do not alter the strength and coherence of the Karman instability. It is interesting to observe that in the case of an inclined flow set-up for the helical fillets, the vortex shedding persists up to the post-critical Reynolds regime (Christian-sen et al., 2015). Furthermore, the same study showed that the frequencies at which the high-frequency vortex shedding takes place vary depending on the angular posi-tion of the helical protrusions. These results were also in agreement with the findings of Nebres and Batill (1993).
In contrast, vortex shedding continues up to the post-critical regime for the pattern-indented surfaces, despite an early flow transition around Re = 0.5 x 10⁵, with a Strouhal value of 0.28, higher than for a plain surface (Kleissl et al., 2011b).
The innovative surfaces extensively investigated in this work, i.e. the helically con-cave (HC) filleted surface and the helically staggered concave (HSC) filleted surface, are able to suppress vortex-shedding formation at much lower Reynolds numbers (Re = 1.5 x 10⁵, St = 0.20) than the traditional helical fillet and dimpled surfaces. This Reynolds range corresponds to the smooth transition to the post-critical regime for the HC filleted surface and to the early transition to the post-critical regime for the HSC filleted surface (Burlina et al., 2017). The presence of the concave fillet, which height is higher than the boundary layer thickness, does not allow for reattachment after sep-aration, enhances the turbulence and vorticity in the shear layer, reduces the interac-tion between shear layers and increases the vortex formation length (Figure 2.5). In this way, a possibility for vortex-shedding and cable interaction and subsequent vor-tex-induced vibrations are avoided.
Further results on the response of traditionally helically filleted, pattern-indented and helically concave surfaces are presented in Chapter 3. Chapters 4 and 5 will exten-sively describe the flow structures created by the concave fillet in connection with the weakening and suppression of vortex shedding. The alterations in flow mechanisms induced by surface modifications on circular cylinders are further discussed in Section 2.3.
2.2.2 Buffeting
Wind gusts due to turbulence in the wind cause buffeting of cables. The wind speed is generally characterized by three time-dependent velocity components (de Sa Caetano, 2007):
U(t) = U + u(t) (2.16)
V(t) = v(t) (2.17)

2.2 Bridge cable aerodynamic response and countermeasures
35
W(t) = w(t) (2.18)
where U is the mean wind velocity, and u(t), v(t), and w(t) are the fluctuating compo-nents in the Cartesian orthogonal directions. The amplitudes caused by buffeting are generally not a concern for bridge stability, but can cause structural fatigue (Eriksen and Mattiello, 2012). Nevertheless, buffeting vibration does not represent a very seri-ous concern for structural cables. In fact, the high tension of bridge stay cables gener-ally helps to limit the amplitude of buffeting vibration.
Figure 2.6 – Illustration of parameters influencing cables stability.
2.2.3 Dry-state vibrations
In dry condition, two types of instabilities occurring under a combination of different parameters are of major concern for the stability and serviceability of cable-stay bridges, which can result in limited amplitude motion in a limited range of wind speeds (i.e. vortex-induced vibration at high Reynolds number) or in divergent motion (i.e. dry inclined galloping) (Matsumoto, 1999; Larose et al., 2003, Cheng et al., 2003 and 2008; Zuo and Jones, 2010; Matteoni and Georgakis, 2013; Christiansen et al., 2015).
The first response type was described after inclined/yawed cable (𝛽 = 45o) wind tun-nel tests performed by Matsumoto (1999) and later reproduced by Cheng et al. (2008). The vibration was identified in a reduced velocity range, higher than the resonance reduced velocity of Karman vortex-shedding and under the presence of vortex along the cable axis (axial flow), which causes negative slope of the lift force. These condi-tions enhance a velocity fluctuation in the wake, acting at the same cable vibration

36 Department of Civil Engineering, Technical University of Denmark
frequency, inducing limited amplitude oscillations. This response implies the presence of an enhanced vortex-shedding in the high reduced velocity range (Matsumoto, 1999).
The second response type is usually referred as dry-inclined galloping. In a more gen-eral context, galloping was presented by Den Hartog (1985) and is a vibration mecha-nism, which requires an initial transverse motion of the cable with respect to the mean wind direction (Eriksen and Mattiello, 2012). The transverse cable motion corre-sponds to a change in the relative angle of attack 𝛼, which induces a transverse load component. Galloping occurs when this load coincides with the direction of motion of the cable and in this way amplifying the response, which can result in large-amplitude vibration. On the other hand, the complicated mechanism of dry-inclined galloping cannot be easily simplified and has been partially clarified by a number of researches and wind tunnel campaigns. Different parameters must be taken into consideration. Cheng et al. (2003) and Larose et al. (2003) pointed out the important role of axial flow, critical Reynolds range and mitigation of Karman vortex for the initiation of galloping instabilities. Matsumoto et al. (2010) summarized the phenomenon and pro-posed two distinguished mechanisms including divergent-type galloping with steady amplitude and unsteady galloping with unstable amplitude, which depend on the Karman-vortex mitigation level. On one hand, enhanced non-periodic mixed orienta-tion of vortices (highly three-dimensional flow) can force the cylinder into large vi-brations. Otherwise, it is assumed that the presence axial flow act as a splitter plate, interrupting communication between shear layers and in this way inducing galloping (Nakamura and Hirata, 1994).
Figure 2.7 – Cable vibrations in dry conditions observed on bridge cables prototype in Ja-pan. From Matsumoto et al., 2010.
2.2.3.1 Full-scale evidence
Dry-state vibrations have been experienced on many different bridges around the world base on field observation and monitoring. Nevertheless, a clear understanding of the causes behind dry vibration has not been compiled yet and it is still unclear. The table below lists some of the cases.

2.2 Bridge cable aerodynamic response and countermeasures
37
Bridge Reference
Faro Bridge Langsoe and Larsen 1987
Helgeland Bridge Melby et al. 1994
Meiko West Bridge Matsumoto 1999
International Guardian Bridge de Sa Caetano 2007
Øresund Bridge
Øresund Bridge
Svensson et al. 2004
Acampora and Georgakis 2013
Iroise Bridge Boujard 2007
Veterans Memorial Bridge Zuo and Jones 2010
Fred Hartman Bridge Zuo and Jones 2010
Unidentified Bridge Matsumoto et al. 2010
Third Bosporus Bridge de Ville 2017
Table 2.2 - Examples of cable-stayed bridges where dry state vibrations occurred in the last 30 years.
On the Øresund Bridge large amplitude vibrations in dry weather conditions were witnessed (Svensson et al., 2004). Macdonald and Larose (2006) hypothesized that the vibration can be characterized as dry-inclined galloping, as they occurred in the critical Reynolds range (12 to 21 m/s for a 250mm cable). At the Iroise Bridge vibra-tions in the absence of rain or ice were experienced which were clearly different from vortex-induced vibrations. Furthermore, the characteristic of the excitations, due to limited wind speed range and displacements, wind critical directions and spectral con-tent, were similar to the rain wind induced vibrations. This lead to the assumption of a possible link between dry-inclined galloping and rain-wind induced vibration (Flamand and Boujard, 2009). Zuo and Jones (2010) reported large-amplitude vibra-tion in the absence of precipitation on the Fred Hartman Bridge and on the Veterans Memorial Bridge. The type of dry-inclined vibration is believed to not be induced by Karman vortex shedding or the vibration of the bridge deck. The vibration occurred when the angle-of-attack is less or around 90o, in the subcritical Reynolds range and within a limited amplitude range, therefore they are assumed to be different from the divergent type described by Cheng et al. (2003). Matsumoto et al. (2010) reported vi-brations up to 1.5 m in amplitude on an inclined cable during the passing of a ty-phoon. The estimated velocity was approximately 18 m/s. During the event, the in-

38 Department of Civil Engineering, Technical University of Denmark
stalled viscous damper was completely damaged due to assumed divergent type vibra-tions. As a result, the phenomenon was assumed to be dry-inclined galloping.
2.2.3.2 Experimental work
Extensive wind tunnel tests have been carried out to investigate the nature of dry in-clined cable instabilities. The Reynolds number, cable-wind angle 𝜙, wind angle-of-attack 𝛼, and surface irregularities and level of turbulence are all important parame-ters in relation to the stability of the cable, especially where small changes in the flow regime can cause drastic changes in aerodynamic forces (Larose et al., 2003).
Large amplitude vibrations in dry conditions have been observed during dynamic wind tunnel experiments. The testing conditions and results are summarized in Table 2.3. Even if there is no available report related to divergent type motions and onset conditions in wind-tunnel tests are not clear and consistent, the possibility of occur-rence of this phenomenon cannot be ignored.
Following dynamic tests, static tests in cross-flow and in inclined/yawed configura-tions can help identify parameters which can trigger dry large amplitude vibrations, and so guide in the design of passive aerodynamic countermeasures to suppress wind-induced vibrations. Studies performed by Schewe (1986), Bursnall and Loftin (1951), Larose et al. (2003 and 2005), Cheng et al. (2008a), Kleissl and Georgakis (2012), Matteoni and Georgakis (2013) and Christiansen et al. (2015), Christiansen (2016) are some of the examples.
Governing parameters
Tests carried out by Larose et al. (2003) and Kleissl and Georgakis (2012) in cross-flow set-ups, i.e. Θ = 90°, and 𝛽 = 90°, show a transition in the critical Reynolds number range, a drop in drag coefficient, and a sudden jump in the lift coefficient from the zero trend (drag crisis region). This transition is characterized by the for-mation of a single laminar separation bubble that creates asymmetry in the pressure distribution TrBL1 and is followed by a symmetric two-bubble regime TrBL2 (Zdravkovich, 1997).
Bursnall and Loftin (1951) performed a series of tests on a plain cable for different inclination angles and did not observe drastic changes in the pressure distribution for varying inclination angle in the subcritical range. Nevertheless, by changing the incli-nation angle, changes in the pressure distribution take place over the critical range. Furthermore, it was noticed that for low inclination angles, the transition from the subcritical to the postcritical regime take place at lower Reynolds number and propa-gates over a wider Reynolds range. As a result, also the non-zero-lift coefficient is

2.2 Bridge cable aerodynamic response and countermeasures
39
maintained over a wider Reynolds range. This behaviour has been confirmed by Larose et al. (2003) and Christiansen et al. (2015).
Reference Saito et
al. (1994) Miyata et al. (1994)
Honda et al. (1995)
Cheng et al.
(2008a)
Cheng et al.
(2008a)
Jakobsen et al.
(2012)
Matteoni and
Georgakis (2013)
Model
orientation 𝜙 = 45o 𝜙 = 60o 𝜙 = 45o 𝜙 = 60o 𝜙 = 60o 𝜙= 60o 𝜙= 63o
Reynolds range
7.23 x 10⁴
1.81 x 10⁵
4.65 x 10⁴ 3.3 x 10⁵
1.86 x 10⁵ 3.1 x 10⁵ 2.5 x 10⁵
Response type
Divergent vibrations
Divergent vibrations
Divergent vibrations
Divergent vibrations
Limited amplitude
Limited amplitude
Divergent vibrations
Table 2.3 – Examples of dynamic tests critical conditions for occurrence of dry state vibra-tions.
Surface irregularities, such as changes in surface roughness, cable imperfections, and any deviation from a perfect circular shape, create a wind angle-of-attack dependency. Flamand and Boujard (2009) rotated the cylinder around its axis and noticed a wind angle-of-attack dependency on the load direction due to changes in surface roughness. Matteoni and Georgakis (2013) and Christiansen et al. (2015) studied the influence of deviations from a perfectly round shape in a smooth bridge cable. In particular, Chris-tiansen et al. (2015) showed that the direction of the lift force is related to the shape of the cylinder for different angles of attack. It was shown that the formation of the first laminar separation bubble is not random, but related to the cylinder shape, which is decisive for the magnitude of the adverse pressure gradients.
Larose et al. (2005) and Christiansen et al. (2015) carried out a series of wind tunnel tests spanning from the subcritical up to the post-critical regime for various levels of turbulence intensity, spanning from 2.5% to 11% in the first study, and between 4 and 5% in the second study. They have noted that a turbulent flow is more representative of real field conditions. From these studies, it was shown that an increase in the turbu-lence intensity helps to eliminate the single bubble regime, and thus avoid or shift the drag crisis region to a lower Reynolds number. Interestingly, Christiansen et al. 2015 noticed that a bridge stay cable fitted with helical fillets is less affected by an increase in the level of turbulence so that separation bubble instabilities are maintained. They argued that this seems to be induced by the presence of the helical fillet which plays a dominant role in the separation mechanism.

40 Department of Civil Engineering, Technical University of Denmark
Helically concave filleted surfaces countermeasures
As a result of the identification of the listed governing parameters and since vibrations in dry weather conditions also have been observed for cables with helical fillets (Christiansen et al. 2015), other surface treatments have been preliminarily tested by Kleissl (2013) to prevent vibrations both in dry and wet conditions. Tests were run statically up to the post-critical regime (Re=3.5 x 10⁵) and dynamically in a Reynolds number range from 0 up to 2 x 10⁵ on two new cable surfaces fitted with concave fil-lets (h/D=0.043), one helically arranged, i.e. a helically concave (HC) filleted surface, and one with a staggered helically concave arrangement, i.e. a helically staggered concave (HSC) filleted surface. Both cable surfaces were able to avoid drastic chang-es in drag coefficient from the subcritical up to the post-critical Reynolds range and maintaining a zero-lift coefficient, and so avoiding the drag crisis regime and subse-quent possible wind-induced vibrations. In dry dynamic tests, the HC filleted surface was observed to experience the same limited amplitude vibrations as observed for other cables with helical fillets. On the other hand, the HSC filleted surface was dy-namically stable in dry conditions (Kleissl, 2013). As part of the research, a detailed wind tunnel investigation was carried out in order to understand the coherent and three-dimensional turbulent flow structures created by the presence of concave fillet and their relation to the cable stability. For the HC filleted surface, this seems to be created by the particular concave shape, which allows a fillet with greater height than
Figure 2.8 – Schematics of flow structures created by the presence of the concave fillet in two different configurations.

2.2 Bridge cable aerodynamic response and countermeasures
41
the traditional helically filleted surface, while maintaining similar values of aerody-namic forces. It seems that the increased height of the fillet creates stronger turbulent three-dimensional structures at separation, which are than propagated along the axial direction. This behavior decreases the area of boundary layer reattachment after lami-nar separation and suppressing the possibility of single bubble formation. The HSC filleted surface, due to the staggered arrangement of its concave fillets, creates strong three-dimensional structures that exhibit a periodic undulation of the shear layer, with longitudinal streamwise vortices, which decrease the interaction between boundary layers. In this way, it seems that the formation of single laminar separation bubble causing asymmetry in the pressure distribution is completely suppressed and as a re-sult no drag crisis region is created. The flow mechanisms created by the concave fil-leted surface are extensively described in Chapters 4 and 5, which report results of PIV tests from an extensive wind tunnel investigation.
The flow mechanisms created by the presence of the concave fillets mean that surface irregularities should not create a dependency on the cable-wind angle or wind angle-of-attack. Just as a traditional helically filleted surface is not greatly affected by in-creased turbulence intensity (Christiansen et al., 2015), the two cable surfaces fitted with concave fillets can be expected to exhibit the same behavior. Both conditions should be experimentally studied and confirmed in future work.
2.2.4 Rain-wind induced vibration
Rain-wind induced vibrations (RWIV) were first identified by Hikami and Shiraishi (1988) on the Meiko-Nishi bridge. It was noticed that cables were stable with respect to wind action in dry conditions, but become very unstable in rain conditions. Vibra-tions were identified in a frequency range lower than vortex-induced vibrations or gal-loping instabilities, and in a defined wind velocity interval, therefore it was hypothe-sized to be an independent aeroelastic instability.
Many studies have been conducted to identify the initiating and driving mechanism of RWIV on stay cables. Studies include field monitoring (Hikami and Shiraishi,1988; Zuo and Jones, 2010; Acampora and Georgakis, 2011), wind tunnel testing in wet conditions (Flamand, 1995; Bosdogianni and Olivari, 1996; Matteoni and Georgakis, 2013).
Wind-rain tunnel experiments show the formation of an upper and lower rain-rivulet on the surface of the cable is an essential component for the initiation of the phenom-enon. The presence of the rain-rivulets, which changes the cross-sectional shape of the cable facing the incoming wind, and its sinusoidal movement along the cable surface as the cable oscillate, cause cyclical changes of aerodynamic forces and flow instabili-

42 Department of Civil Engineering, Technical University of Denmark
ties that lead to large amplitude vibrations (Hikami and Shiraishi, 1988; Flamand, 1995).
RWIVs represent a major concern for bridge owners, due to their large amplitudes and frequency of occurrence, and it is of significant consideration during the design of mitigation measures for stay cables. A more in depth understanding of the rain-rivulet formation, vibrations occurrence and initiation mechanism can lead to the design of optimal countermeasures, not only for suppression of RWIV but on the overall aero-dynamic of the cable (Kleissl, 2013).
Figure 2.9 – Definitions of the angular position of the upper and lower rivulet.
2.2.4.1 Full-scale evidence
Although a large number of RWIVs have been reported on cable-stay bridges, there is not a large number of field measurements on stay-cables and most of the knowledge acquired up to today is based on full scale wind tunnel tests (Matsumoto, 1990, Flamand 1995). Hikami and Shiraishi (1988) reported the occurrence of the first iden-tified event on the Meiko-Nishi Bridge in Japan. They noticed that large amplitude vibrations occurred in the presence of rain, in a defined range of velocities, between 5 and 15m/s, and for cable frequencies between 1-3 Hz. Ni et al. (2007) identified the event to occur in a wind velocity range of 6-14 m/s under light to moderate rainfall, for a yawed angle 𝛽 between 10o and 50o. Zuo and Jones (2010) reported rain-wind induced vibrations both on the Fred Hartman Bridge and the Veterans Memorial Bridge. It was highlighted that Karman-vortex-induced vibrations and large-amplitude dry cable vibration share similar characteristics with rain-wind induced vibrations. It is believed that this kind of aeroelastic instability exists on yawed and inclined cables despite the presence of rain, and the role of the formation of the rain-rivulet is to en-hance and promote the instability. On the Øresund Bridge, large amplitude vibrations

2.2 Bridge cable aerodynamic response and countermeasures
43
have been experienced both in the presence of ice and rain (Svensson et al., 2004). Acampora and Georgakis (2011), after long-term monitoring, reported large ampli-tude vibrations up to 0.6 m in the presence of rain, in a wind velocity interval between 5-15 m/s. Table 2.4 lists some of the cases that can be found in literature.
Bridge Reference
Faro Bridge Langsoe and Larsen 1987
Meiko-Nishi Bridge Hikami and Shiraishi 1988
Second Severn Crossing Bridge Macdonald et al. 1997
Erasmus Bridge Peersoon and Noorlander 1999
Franjo Tudjman Bridge Weber et al. 2007
Dongting Lake Bridge Ni et al. 2007
Alamillo Bridge Casas and Aparicio 2009
Veterans Memorial Bridge Zuo and Jones 2010
Fred Hartman Bridge Zuo and Jones 2010
Øresund Bridge Acampora and Georgakis 2011
Table 2.4 – Examples of cable-stayed bridges where RWIVs occurred in the last thirty years.
2.2.4.2 Experimental work
Many researchers have tried to characterize the complex aerodynamic behaviour of RWIV.
Different approaches have been adopted to investigate the vibration, for instance by applying an artificial protrusion simulating the presence of the rivulet, by creating rain-rivulets by water supply, or by studying the influence of the trajectory of the rain rivulet and analysing the influence of the surface conditions (i.e. roughness, wettabil-ity). A summary and categorization has been published in Demartino et al. (2017).
The use of fixed protrusions to simulate the rivulets was adopted by Xu et al. (2006) and Du et al. (2013). It should be noted that this approach does not take into account the effects of the time-varying shape and motion of real rivulets. The results conclud-ed that with just one artificial rivulet on the cylinder surface, 𝐶< and 𝐶S vary signifi-cantly, depending on the angular position of the rivulet. On the other hand, although the size and shape of the artificial rivulet and the wind yaw angle affect the aerody-namic coefficients, they do not have a significant effect on the variation of the rivulet angle.

44 Department of Civil Engineering, Technical University of Denmark
A more precise simulation of the effects of the rain-rivulet can be achieved by gener-ating real water rivulets on the upper and lower bridge cable surface (Matteoni and Georgakis, 2013). Using various mechanisms for the generation of rain water rivulets, Wang et al. (2005), Alam and Zhou (2007), and Matteoni and Georgakis (2013), stud-ied the aerodynamic behaviour of a wet cable in static wind tunnel tests. Wang et al. (2005) found that the rivulet position and behaviour depend on the water flow rate Q and the wind speed. Both rivulets formed around the separation line (Figure 2.10).
Figure 2.10 - Rivulets on the cylinder at a U = 9 m/s, and Q = 8.0 l/h: (a) windward rivulet; (b) leeward rivulet, from Wang et al. (2005).
As the wind speed was increased, the rivulets tended to climb up the cylinder surface. Both rivulets oscillated circumferentially. It was found that the rivulets caused an in-crease in the normalized dominant frequencies in the near wake and moreover led to a significant increase in 𝐶<, which is consistent with the violent vibration associated with the rain-wind-cable interaction. Alam and Zhou (2007) identified different re-gimes, each associated with a specific range of Re, where the rivulet took a different position on the cylinder, as shown in Figure 2.11. The significance for RWIV is shown by regime D, where the circumferential oscillation of water rivulets gives rise to an increase in vortex strength, a relatively low St, and an increase in aerodynamic forces. Matteoni and Georgakis (2013) performed tests for two cable-wind angles 𝜑 of 60° and 55°. They found that the upper and lower rivulets form when the wind ve-locity reaches 8 m/s. Above this threshold, the rivulet tends to follow a sinusoidal tra-jectory on the spanwise direction of the cable. After 18m/s the rain rivulet is com-pletely suppressed since all the water is blown away by the wind. Hikami and Shirai-shi (1988) and Bosdogianni and Olivari (1996) investigated the trajectories of the riv-ulets on the cylinder to try to correlate the rivulet motion or the rivulet average posi-

2.2 Bridge cable aerodynamic response and countermeasures
45
tion with the aerodynamics and reported that only cable declining in the wind direc-tion are prone to RWIV. They also investigated the dependence of the rivulet for-mation on wind velocity. These general conditions were combined by Gimsing and Georgakis (2012), with wind speeds between 5–18 m/s, and yaw angles 𝛽 between 0–45o, and frequencies in the range of 0.5–3.3 Hz. The influence of superficial condi-tions on rivulet behaviour was studied by Flamand (1995) and Kleissl (2013), who observed that RWIV depends on physical parameters such as cable size and shape, surface roughness and wettability.
Figure 2.11 – Effects of water rivulets (𝚯 = 55°) on 𝑪𝑫, 𝑪𝑳 and St.: without water (circles), and with water (triangles). From Alam and Zhou (2007).
2.2.4.3 RWIVs passive countermeasures
Intensive efforts have been made to investigate the mechanism of RWIV and to pro-vide appropriate vibration control measures. These come mainly in three forms: the placement of dampers between the cables and the bridge girder, cross-ties between the cables, and aerodynamic control from the manipulation of the cable section shape and surface (Hojo et al., 2000).
Figure 2.12 – Examples of (a) dampers between the cable and the bridge girder (From http://ravenelbridge.net/freyssinet.php), and (b) cross-ties between cables (From
https://failures.wikispaces.com/Cable+Bridge+Failures+Overview).
Several different aerodynamic cable surfaces have been proposed to date in an attempt to control vibration, either through prevention of rain-rivulet formation or by disturb-

46 Department of Civil Engineering, Technical University of Denmark
ing the flow around the cable. Two cable surfaces currently dominate the market: hel-ical fillets, which are extensively used in Europe and North America, and dimples, which are used predominantly in Asia (Figure 2.13). The first surface modification was tested in connection with the design of the Normandy Bridge by Flamand (1995). It was noticed that the application of double-helical fillets induced a disorganized rain rivulet on the bridge cable surface. This led to the suppression of vibration while at the same time maintaining an optimal level of drag coefficient. The second surface modification was first suggested by Miyata et al. (1994) and first applied to the Tatara Bridge.
Nevertheless, the introduction of helical fillets and dimples has not completely elimi-nated RWIV, so bridge owners often install cable vibration dampers or cross-ties. Previous research (Yagi, 2011, Kleissl and Georgakis, 2013) shows that by modifying the shape, alignment and configuration of the protuberances on the HDPE tube, it is possible to eliminate or further reduce RWIV, as well as reduce drag force.
In particular, preliminary investigations of cable surface modifications involving con-cave fillets, as undertaken by Kleissl and Georgakis (2013), were found to outperform traditional surfaces in the prevention of rain rivulet formtaion. Tests were run dynam-ically in a Reynolds number range from 0 up to 2 x 10⁵ on the HC and HSC filleted surface with a fillet height of h/D=0.043. The results from the wet dynamic tests show that neither of the two new innovative surfaces were found to suffer from RWIV when tested dynamically.
Figure 2.13 – Cable sample models of current dominant aerodynamic measures.
A parametric investigation was performed by Burlina et al. (2016) on the influence of the height and width of the fillet in the ability to suppress the rain-rivulet. It was no-ticed that the width of the fillet plays an important role in the ability to suppress the rivulet formation. This is hypothesized to be due to friction/tension forces created be-tween the rain rivulet and the upper part of the fillet. By introducing a sharp edged fillet this problem should be avoided. The HC and HSC filleted surfaces outperformed the traditional cable surfaces in terms of rain-rivulet suppression, with a complete suppression of the upper and lower rain-rivulets at all tested velocities. This is true

2.2 Bridge cable aerodynamic response and countermeasures
47
even for the profile with the shortest concave fillet tested. It is believed that this is due to the ability of the concave fillet to act as a ramp for the incoming rain-rivulet
The development and final design of these new surface modifications are described in Chapter 3.
2.2.5 Ice-wind-induced vibration
The influence of ice on aerodynamics has been studied mainly in the fields of electri-cal distribution (Farzaneh, 2008), of aircraft wings (Lynch and Khodadoust, 2001), and of wind turbine blades (Mattiello, 2014).
Less literature is available in the area of bridge engineering, although in recent years the relevance of ice accretion for wind-induced vibration in bridge cables has been recognized. Full-scale monitoring indicates that ice accretion from light precipitation at low temperature can lead to large-amplitude vibration in bridge cables under wind action (Koss and Lund, 2013). A fundamental aspect in the phenomenon is the devia-tion from a circular shape and changes in surface roughness due to the ice layer on the bridge cable surface. Recent studies on the topic have been carried out by Koss and Lund (2013), Demartino et al. (2015), Koss et al. (2013), and Gorski et al. (2016). In this research, the aerodynamic coefficients of the ice accreted cylinder showed a marked dependency on the angle of attack and considerable variation with different types and forms of ice accretion. Furthermore, it was found that compared with a per-fectly circular cylinder ice accretion strongly affects the Strouhal number and that this variation is related to the angle of attack.
Figure 2.14 – Ice formation on the cable sections of the Port Mann Bridge in Vancouver, British Columbia (a); damage to passing car (b). (Pictures from
http://www.vancouversun.com).
Furthermore, ice-wind-induced vibrations can lead to ice pieces falling on the bridge deck, compromising the serviceability and safety of the bridge.

48 Department of Civil Engineering, Technical University of Denmark
2.3 Aerodynamic control of bridge cables Intensive efforts have been made to investigate and to provide appropriate control measures against wind-induced vibration. Since the level of drag acting on cables can be crucial in the overall design of a cable-supported bridge (Gimsing and Georgakis, 2012), particular efforts have been made to find countermeasures that are effective in dry conditions, can mitigate RWIV, and cope with wind-ice effects (Sections 2.2), as well as reduce aerodynamic forces or maintain it at an optimal level (Demartino, 2017). As mentioned earlier, appropriate control measures come mainly in three forms: the placement of dampers between the cables and the bridge girder, cross-ties between the cables, and aerodynamic control from the manipulation of the cable sec-tion shape and surface (Hojo et al., 2000). Due to the costly implementation and maintenance of dampers, aerodynamic devices are a more desirable solution since can be more reliable and cost effective.
There are many methods of flow-control, but they are usually categorized into active control methods, which require energy input, and passive control methods, which re-quire no external energy, but where modifications are made to the structure (Demarti-no, 2017). Active control methods come in many forms, such as rotary (Poncet, 2002), blowing/suction (Fransson et al., 2004), and distributed forcing (Kim and Choi, 2005). However, in this thesis only passive control methods are discussed, because they are the most commonly used in cable-stayed bridges.
Among passive control methods, direct wake modifications and near-wake stabilizers such as splitter plates are not considered since they are not omnidirectional devices and deviate the cross section from a circular cylindrical shape. Circular cylinders with shape modifications, on the other hand, are easy to manufacture and install, and they are effective irrespective of the direction of the incoming wind. Finally, as observed by Choi et al. (2008), stay cables cover different Reynolds regime, and the efficiency of a device in a certain Reynolds regime in not necessarily guaranteed over the other one.
The following paragraphs present a selective retrospect on documented flow control approaches with the potential to be used for cable structures. Reviews on the aerody-namic control of bluff-bodies have been given by Zdravkovich (1981), Gad-el-Hak (2000), Collis et al. (2004), Choi et al. (2008), and Kleissl (2013). Kleissl (2013) pro-poses a categorization of surface modifications as follows:
- Direct transition to turbulence (boundary-layer instability).
- Early separation and reattachment (shear-layer instability).
- Wake dephasing and 3D disturbance (three-dimensional wake structures).

2.3 Aerodynamic control of bridge cables
49
2.3.1 Devices based on direct transition to turbulence
A circular cylinder is considered a bluff body with a movable separation point. For this type of bluff body, the delay of the main separation induces a significant drag re-duction. To delay separation, the near-wall streamwise momentum near and before the separation point needs enhancing, so the adverse pressure gradient in the rear part of the bluff body can be overcome. One of the ways to enhance the near-wall momentum is through direct boundary-layer transition to turbulence. The generation of strong near-wall momentum using the direct transition to turbulence is possible at Reynolds numbers large enough to trigger boundary-layer instability, so this type of control is limited to subcritical Reynolds numbers (Kleissl, 2013).
2.3.1.1 Surface roughness
Increasing surface roughness generates vorticity, which creates strong near-wall mo-mentum by direct transition to turbulence. There is a vast amount of literature on the effects of surface roughness around a circular cylinder (Achnebach, 1971, 1974; Choi, 2006).
Achenbach (1971, 1974) showed that with surface roughness the drag coefficient sharply decreases and then increases rapidly with increasing Reynolds number, giving a local minimum at a critical Reynolds number. As a result, when altering laminar separation through a turbulent boundary layer, the thickness of the boundary layer must be controlled, because thick turbulent wall-bound flows increases the drag force (Figure 2.15).
Figure 2.15 – Surface roughness effect on drag coefficient

50 Department of Civil Engineering, Technical University of Denmark
2.3.1.2 Circumferential riblets
Circumferential riblets create an anisotropic surface with the presence of grooves or protrusions on the surface of the cylinder, which are aligned with the flow direction. Vortices are created in different positions, so that the boundary layer is shifted into controlled turbulence and the shear layer development is in this way affected. Riblets trigger the transition to turbulence at a lower Reynolds number than with a smooth cylinder (Kleissl, 2013). Much research has been undertaken to understand the effect of different sizes of groove (Leung, 1988) and different shapes, such as V-grooved and U-grooved cylinders (Lim and Lee, 2002, 2003; Lee et al., 2005). Similar behav-ior to that experienced with increased surface roughness was confirmed, but with an earlier transition to the post-critical regime.
Figure 2.16 – Flow visualization in horizontal plane for a V-grooved and a U-grooved cylinder Re = 1.25 x 10⁴. From Lim and Lee (2002).
2.3.1.3 Vortex generators
Vortex generators are aerodynamic devices in the form of small vane or bump that create an enhancement of the near-wall momentum, by stimulating macro-vortical flow structures in the boundary layer and its vicinity. In particular, vortex generators have a height not higher than 10% and 50% of the boundary-layer thickness (Lin, 2002). Vortex generators are classified based on their number, shape, dimensions and arrangement (Figure 2.17).

2.3 Aerodynamic control of bridge cables
51
Figure 2.17 – Various types of low-profile vortex generators. From Lin (2002).
The effect of the vortex generators depends mainly on the angular position of the de-vice itself and around the circular cylinder, because its efficiency has been found to be mainly directional (Demartino, 2017). As a result, aerodynamic forces and the St number will increase or decrease depending on changes in the angular position (Unal and Atlar, 2010). Vortex generators generate an irregular separation line (Mizuno, 1988) and generate a narrower near wake, by bending the two shear layers towards the centerline of the cylinder (Unal and Atlar, 2010). Igarashi (1985) classified the differ-ent flow patterns created into four categories based on the state of the boundary layer, presenting different aerodynamic forces and St number. Furthermore, vortex genera-tors are Reynolds number-dependent and their efficiency is altered in the lower sub-critical and post-critical regimes (Mizuno, 1988). These studies suggest that the drag reduction achieved by vortex generators can be large in the subcritical regime (up to 50%) (Demartino, 2017); this is because delay in separation in subcritical flow past circular cylinder results in drag reduction (Zdravkovich, 1997).
2.3.2 Devices based on early separation and reattachment
A different way to delay separation and reduce the level of aerodynamic forces is through early separation and reattachment of the flow on the circular cylinder surface. The mechanism initiated is similar to the one observed in the transition in boundary layer, TrBL regime. The transition from laminar to turbulent flow in the boundary lay-er moves on to the rear of the cylinder, through the formation of a separation bubble. The initiation of this kind of instability is constrained in the subcritical regime, since no transition has yet occurred. There are different ways in order to trigger instabili-ties, and some of them are here discussed.

52 Department of Civil Engineering, Technical University of Denmark
2.3.2.1 Axial protrusions
Axial protrusions were firstly investigated in the form a trip wire, or pairs of wires applied on the upper surface of the cylinder. Following the trip-wire approach, there have been many attempts to create an omnidirectional application that attempt to re-produce these features using several protrusions all around the cylinder. One recog-nized disadvantage of the application of fixed parallel axial protrusions is that the co-herent disturbance along the axial direction of the cylinder induces a high correlation length. This can lead to uniform two-dimensional flow structure, which can create a regular vortex shedding up to the postcritical regime (Naumann and Quadflieg 1974; Naudascher and Rockwell 2005).
An overview of some of the various axial protrusion inputs to generate the early sepa-ration and reattachment of the flow is given by Kleissl (2013) and summarized in Fig-ure 2.18.
Flamand (1993,1994,1995) considered rods of 0.009D diameter parallel to the stay axis every 30° (See Figure 2.17(a)). The surface modification was first designed for the purpose of mitigation of RWIVs. While the protrusion was able to act as a guide for the upper-rivulet and thus limiting its sinusoidal movement, drag coefficient was kept constant at 1.05 in the transition from the subcritical to the postcritical regime.
Figure 2.18 – Overview of the various types of axial protrusion. From Kleissl (2013).
Later Flamand and Boujard (2009) performed similar tests on smaller protrusions with a smaller angular spacing between the rods. This resulted in a smaller drag coefficient from the subcritical regime, but it is unclear how rain rivulets are affected by these very low rods. Studies performed by Nigim and Batill (1997) considered equally spaced circular cross-section protrusions with a size of up to 10% of the cylinder di-ameter. Among the many combinations of sizes and spacing tested, only the ones pre-sented in Figure 2.18(b-c) performed omnidirectional. Nevertheless, the drag coeffi-cient in the subcritical regime was found to be around 0.9.
A fifth type of cylinder with longitudinal protrusions was created in connection to the Higarashi-Kobe Bridge in Japan (Yamada et al., 1991) with equally spaced rectangu-

2.3 Aerodynamic control of bridge cables
53
lar protrusions (See Figure 2.18(e)). By creating axial channels, the purpose was to guide the upper-rivulet down the inclined surface of the cable, and suppressing the sinusoidal movement. The axial protrusions are positioned every 30° with a height of h/D = 0.031 and a width of w/D = 0.069. The configuration appeared to be effective in mitigating rain-wind-induced and inclined cable vibration, nevertheless, high-speed vortex shedding has been reported (Saito et al. 1994; Matsumoto et al. 1992, 1995).
The major drawback of axial protrusion is the constant and high drag force over the whole design wind velocity (Miyata et al., 1999).
2.3.2.2 Axial grooves
Axial grooves consist of indentations along the cylinder axis. The dimpled surface of a golf ball is a common example (Bearman and Harvey, 1976). The purpose of the design behind the golf ball surface is to maintain a low drag force from subcritical to postcritical Reynolds regime. Recent research has also found inspiration for the de-sign of axial grooves in the aerodynamics of cacti, which are thought to possess an advantageous aerodynamic response in high wind (El-Makdah and Oweis 2013; Wang et al. 2017; Liu et al. 2011; Babu and Mahesh 2008; Karaki et al., 2008; Mor-genthal and Walther 2007; Yamagishi and Oki, 2005; Talley et al., 2001).
Figure 2.19 – Illustration of drag-reduction mechanism of indentations. From Choi et al. (2006).
The mechanism behind the drag reduction has been clarified by Choi et al. (2006): the indentations create local flow separation and shear layer instability, which generate high turbulence intensity. Figure 2.19 shows how the flow after turbulent separation reattaches to the surface with an increase near-wall momentum, which than result in a delayed separation and narrower wake. Compared to axial protrusions, axial grooves suffer of a lower drag penalty but they are not able to sustain similar flow structures over the different Reynolds regimes. The number, the depth and the shape are the pa-rameters by which axial grooves are usually defined.

54 Department of Civil Engineering, Technical University of Denmark
The effect of the shape and number of longitudinal grooves covering the surface of a cylinder was studied by Yamagashi and Oki (2004, 2005). They note that the critical Re corresponding to the sudden drop in cylinder drag decreased with an increased number of grooves. They also note that triangular grooves resulted in higher drag re-duction than rounded grooves.
According to El-Makdah and Oweis (2013), an axial grooved surface inspired by cacti exhibited better wake behaviour than the circular model in terms of reduced stream-wise turbulent velocity, a vorticity more closely attached to the cylinder surface, and a reduced velocity deficit of the cylinder. This improvement in wake behaviour was Reynolds number-dependent because it was seen at higher Re numbers (170,000 and 110,000), but not at lower numbers (50,000). They believed this was the result of a reduction in the critical Re number due to the geometrical cactus features. Further studies on similar shapes (Wang et al. 2017) show that the mean drag coefficient is independent of the yaw angle, and that the mean lift coefficient is dependent on both the angle of attack and the yaw angle.
Figure 2.20 – Cross-sectional view of the cactus cable model (a); view from upstream of an inclined cactus-model cable during wind tunnel tests. From Wang et al. (2017).
2.3.2.3 Pattern-indented
The pattern-indented (dimpled) surface was initially proposed by Miyata et al. (1994b). The modifications are created through thermal production procedure and are formed by protruding periphery of displaced material (Katsuchi et al., 2010). The dimpled surface causes local flow separation and triggers shear-layer instability along

2.3 Aerodynamic control of bridge cables
55
the separating shear layers, resulting in the generation of a large degree of turbulence intensity and a delayed separation point. As a result, dimples delay the main separa-tion and reduce drag significantly (Choi et al. 2006). Measured pressure distributions indicate that such a cable enters the supercritical flow state at the lower wind veloci-ties where RWIV tends to occur. Furthermore, the flow separation point remains sta-ble in the supercritical region, resulting in a near-constant drag coefficient (Hojo et al., 2000). It has also been found that the dimpled surface can inhibit the formation of a coherent rain rivulet, leading to a reduction in RWIV (Miyata, 1994b). The pattern-indented surface was first applied to the cables of the Tatara Bridge in 1999, and later to the Sutong and Stonecutters Bridges (2008 and 2009). Nevertheless, vibration has recently been observed in pattern-indented cables, both in the field and in laboratory tests (Chen, 2011; Katsuchi, 2011).
Figure 2.21 – Mean drag coefficient as a function of Re for a HDPE plain, pattern-indented and helical fitted cylinder (a); surface oil visualization on a pattern-indented surface (b).
From Kleissl and Georgakis (2013).
Kleissl and Georgakis (2012) studied the aerodynamics of bridge cables with a pat-tern-indented surface in cross-flow and inclined set-up. Cross flow tests confirmed that the pattern-indented surface exhibits a lower drag coefficient than traditional heli-cally filleted cylinders (Figure 2.21), reaching the post-critical state for Re at lower values than the other models tested. From the power spectral density of the fluctuating lift, they found that the pattern-indented cable maintain vortex shedding throughout the whole Reynolds range of flow velocities tested, despite a transition to the post-critical range at low Reynolds number. In the inclined flow set-up, pattern-indentation guarantees low drag force and an almost zero lift through the whole Reynolds range tested.
2.3.3 Wake dephasing and three-dimensional disturbance
The near-wake behind a circular cylinder is characterized by different flow structures, and many studies have focused on identifying the dominant features in the flow be-

56 Department of Civil Engineering, Technical University of Denmark
hind bluff bodies, including the birth of coherent structures in the low Reynolds num-ber range and their persistence in the turbulent regime. The main structures are the von Karman vortices that result from a global instability, the longitudinal vortices that connect these and originate secondary instabilities (e.g. Williamson, 1992, Persillon and Braza, 1998, Perrin et al., 2006), and the smaller-scale Kelvin-Helmholtz vortices that result from convective instability in the shear layer (e.g. Bloor, 1964, Braza et al., 1990, Perrin et al., 2006). By introducing periodic geometric changes in the spanwise directions three-dimensional flow instabilities are introduced, by altering the two-dimensional shear layer and dislocating the vortex formation in the wake (Naumann and Quadflieg, 1974). By creating three-dimensional flow structures the shear layers are less prone to rolling up into organized Karman vortex street. An additional benefi-cial effect of the shear layer dephasing and three-dimensional flow structure is an in-crease in the base pressure and so a reduction of the drag force. If the additional drag introduced by the presence of the surface modification is small enough, an overall drag reduction can be achieved (Bearman, 1969). Another advantage of the presence of streamwise vortices in the wake (Rodriguez, 1991) is the reduction of the interac-tion between separated shear layers, which increases the vortex formation length.
Figure 2.22 – Illustration of different types of omnidirectional surface protrusions. From Zdravkovich (1981).
Research focus mainly in designing surface modifications that will provide omnidi-rectional aerodynamics and easy manufacture with an attempt to attenuate vortex shedding and keep the drag coefficient at an optimal level for design and performance purposes. That is why only applications of interest in relation to bridge cables are dis-cussed here.
2.3.3.1 Continuous helical devices
One of the most widely spread type of continuous spanwise modifications are contin-uous helical devices. The variables defining the geometric characteristics of helical devices are the number of helical elements, and the height, pitch and shape of the pro-

2.3 Aerodynamic control of bridge cables
57
trusion. The most common shapes to date are strakes (rectangular) and wires (circu-lar), but new shapes have been proposed in recent years in connection with the sup-pression of rain-rivulet formation and the reduction of aerodynamic forces (Kleissl and Georgakis, 2013; Burlina et al., 2016).
Studies pointed out that three effects mainly dominate the three-dimensional character of the flow: streamwise vortices, spanwise variation, diminished shear-layer interac-tion.
(a) (b)
Figure 2.23 – Circular cylinder fitted with helical staikes (a) from Korkischko and Meneghini (2011); Circular cylinder fitted with helical wire and wake development (b) from
Kleissl (2013).
The use of helical strakes was initially proposed by (Scruton and Walshe, 1957) and later patented (Scruton and Walshe, 1963). They ran tests on a series of different strake heights (h = 0.03 D to h = 0.12 D) with a fixed pitch length of 15 D. Although the lowest strakes were able to reduce the possibility of wind-induced vibrations, ma-jor reductions were achieved for the highest strakes. Cowdrey and Lawes (1959) found a constant drag (for h/D = 0.059 𝐶< = 1.25 and for h/D = 0.118 𝐶< = 1.4) in the Reynolds range of 8.5 x 10⁴ < Re < 3.8 x 10⁶. These results were in agreement with the one found by Kleissl and Georgakis (2013) for a circular cylinder fitted with 12 rectangular helical strakes (h/D = 0.031) in the Reynolds range of 5 x 10⁴ < Re < 3.3 x 10⁵. The relatively large size of helical strakes generally increases the drag of static cylinders.
The original purpose of helical wires was also the suppression of vortex-induced vi-bration by forcing a dislocation of vortex formation with different angles along the length of the cylinder (Price, 1956). They have since been tested with regard to the suppression of RWIV (Refer to Chapter 3). Figure 2.23 (a) gives a schematic illustra-tion of four different flow regimes round a cylinder with helical wire depending on the angular position of the wire, based on testes performed by Nebres and Batill

58 Department of Civil Engineering, Technical University of Denmark
(1993). When the wire is arranged helically, this results in a periodic waviness in the separation line and wake width. Aerodynamic behavior like that of helical strakes was observed for helical wire by Nakagawa (1965) with 1, 4 and 8 helical wires (d/D = 0.004) in the range of Re from 105 to 106 (Figure 2.23 (b)). Figure 2.23 (b) shows data from different helical protrusion sizes with d/D between 0.004 and 0.008 (Flamand, 1995; Flamand and Boujard, 2009; Virlogeux, 1998; Yamauchi et al., 2011). It should be noted that when helical strakes and wires are smaller than the boundary layer thickness, they do not alter the strength and coherence of the Karman instability (Ek-mekci, 2013). As a result, the introduction of helical strakes or wires does not seem to be an efficient design solution because of the need to strengthen the structure to resist the higher drag.
(a) (b)
Figure 2.24 – Schematic of four different flow regimes as a function of the perturbation an-gular position (a), from Nebres and Batill (1993); drag force data for various helical protru-
sions (b), from Flamand (1995), Flamand and Boujard (2009), Virlogeux (1998), Yamauchi et al. (2011).
Recent cable surface modifications in the form of a concave fillet studied by Kleissl and Georgakis (2013) and Burlina et al. (2016) were found to outperform traditional solutions in terms of cable vibration suppression (e.g. RWIV), mitigation of ice accre-tion phenomena, and control of aerodynamic drag force. Static wind tunnel tests were carried out on cylinders with a helically concave (HC) filleted surface with a 45° pitch and with a helically staggered concave (HSC) filleted surface with a 30° pitch. The strake cross-section has a triangular shape with concave sides and a height of h/D=0.027 (HC) and h/D=0.043 (HSC). The HSC filleted surface had a post-critical drag coefficient of 0.65, which is similar to that of pattern-indented cable surfaces and a traditional helical fillet. The HC filleted surface had a post-critical drag coefficient of 0.71. Furthermore, both these modified cable surfaces showed a smooth transition into the post-critical regime, avoiding in this way possible instabilities from drastic

2.3 Aerodynamic control of bridge cables
59
changes in drag force (Burlina et al. 2017). Further research on the new cable profile is presented in Chapter 3, 4 and 5.
Figure 2.25 – Illustrations of a helical concave filleted and a helical staggered concave filleted circular cylinder. From Burlina et al. (2016).
2.3.3.2 Variable local radius
Many circular cylinders in engineering applications have a spanwise-varying local radius. In the field of bridge cable aerodynamics, research has mainly focused on dis-continuous variation, e.g. circular rings/ridges or elliptical rings, and sinusoidal varia-tion, e.g. wavy cylinders. These variations produce considerable effects on aerody-namics: they disrupt the vortical structures in the spanwise direction, the spanwise correlation, and the formation of organized Karman vortex streets.
Figure 2.26 – Circular cylinders fitted with O-rings. From Lim and Lee (2004).
2.3.3.2.1 Discontinuous cylinders
Discontinuous cylinders are characterized by step variation in the diameter along the cylinder axis. In particular, with the aim of avoiding vortex shedding from suddenly occurring along the entire length of the cylinder, Sallet and Berezow (1972) first pro-posed the use of a multi-step geometry cylinder created by attaching a series of rings

60 Department of Civil Engineering, Technical University of Denmark
to the surface of a small diameter cylinder. It was not until 1998 that these discontinu-ous cylinders were considered for cable stays. The aerodynamics of multi-step cylin-ders is strongly influenced by the diameter, the spanwise length of the rings, and the spanwise distance between the rings.
Figure 2.27 – Geometrics of the O-ringed cylinder (a); mean streamwise velocity in the yz plane for the three-dimensional O-ringed cylinder (b). From Zhang et al. (2016).
A detailed investigation of the flow around static cylinders with circular rings was made by Lim and Lee (2004). Two of the models tested in that study are shown in Figure 2.26. Circular rings with d = 0.017D diameter and 0.165D spacing were found to provide a drag reduction of 9%, though only within the subcritical Reynolds num-ber regime up to Re = 1.2 x 10⁵. Furthermore, flow visualizations confirmed the pres-ence of a narrower wake and an elongated vortex formation region. Nakamura and Igarashi (2007, 2008) optimized the design with respect to minimizing the drag coef-ficient. Once it was realized the subcritical drag force was reduced by 15%. The flow visualizations showed a narrowing of the wake together with a weakening of the fluc-tuating lift due to the suppression of vortex shedding. The latest study by Zhang et al. (2016) used CFD simulation to investigate the flow of a circular cylinder fitted with d = 0.1D and found locally low aerodynamic forces in corresponding to the position of the rings. The separation of the boundary layer at the position of the rings is signifi-cantly delayed, which gives rise to a shrink wake. This promotes the formation of transverse vortices on both sides of the rings. These vortices obstruct the shedding of Karman vortices and thus reduce the aerodynamic forces. Confirming previous stud-ies, the importance of the Reynolds number in the effectiveness of the rings was demonstrated out of all the variables previously cited. Furthermore, studies on the ef-

2.3 Aerodynamic control of bridge cables
61
fectiveness of these devices in the suppression of RWIV have been carried out by Yamauchi et al. (2011).
While it may be a bit impractical, an elliptical protrusion could utilize the fact that the wind is always nearly horizontal. The idea of using thick horizontal elliptical plates was proposed and tested by Matsumoto et al. (1998). Since the modification should be sufficient to prevent water rivulets from forming, only the formation of axial flow and the high reduced velocity dynamic response were studied, and in both cases a reduc-tion was found.
2.3.3.2.2 Wavy cylinders
Wavy cylinders are often characterized by a sinusoidal spanwise variation of the cross section, with the aim of reducing drag forces and vortex-induced vibrations (Figure 2.28). A well-known example of a wavy cylinder (albeit with square cross section) is the Brancusi Tower in Romania, built in 1938. Despite its great slenderness, it has ex-cellent aero-elastic behaviour (Kleissl and Georgakis, 2011).
Significant spanwise variation can be observed in the drag force of the sinusoidal wavy cylinder (Zhang, 2016), where the drag coefficient reaches its maximum value at the node point and its minimum at the saddle point. This finding is in agreement with that of Ahmed and Bays-Muchmore (1992). In wavy cylinders, the boundary layer separation is delayed at the node, so the higher drag coefficient at the node seems to contradict previous knowledge that delaying separation is one way to miti-gate drag force (Zhang, 2016). So, at best, a wavy cylinder would probably have an unchanged drag performance and should only be considered because of its other bene-ficial effects (Kleissl, 2013).
The flow is generally far more stable and symmetrical around the geometric saddle than around the geometric node (Ahmed and Bays-Muchmore, 1992) and the wake has more incoherent turbulence than perfectly circular cylinders due to enhanced tur-bulent mixing (Lam et al., 2004a).The formation of trailing streamwise vortices be-hind nodal points of separation gives rise to a locally narrower wake, a rapid wake velocity recovery, and suppression of turbulence development within the separated boundary layer (Ahmed and Bays-Muchmore 1992, Lam et al., 2004a). The pro-nounced spanwise variations in the flow structure in the near-wake behind the sinus-oidal cylinder are attributed to the formation of counter-rotating streamwise vortices on either side of each node and to their interaction with the large-scale spanwise vor-tices (Zhang, 2005). Well-organized streamwise vortices with alternating positive and negative vorticity have been observed along the span of the sinusoidal cylinder. The 3-D vortex sheet rolls up at a position further downstream and with lower strength,

62 Department of Civil Engineering, Technical University of Denmark
and then interacts and breaks down through a rib-like structure (Lam et al., 2004a). As a result, base pressure is increased and the fluctuating pressure is reduced, which gives a reduction in the average mean drag and fluctuating lift. The free shear layers shed from points near the saddles extend in the spanwise direction, while the shear layer near the nodes contract.
Figure 2.28 – Geometry and characteristics of wavy cylinders (a) (b), from Demartino et al. (2017) and Lam et al. (2004b); mean streamwise velocity in the yz plane for the three-
dimensional sinusoidal wavy cylinder (c), from Zhang et al. (2016).

63


65
Chapter 3
3 Aerodynamics and rain rivulet suppression of bridge cables with concave fillet The results presented in this chapter are based on the paper: Aerodynamics and rain-rivulet suppression of bridge cables with concave fillets. Burlina, C., Georgakis, C.T., Larsen, S.L., Egger, P., Published in Journal of Wind and Structures, February 2018, Volume 26, Issue 4, pp. 253-266 (Publisher: TECHNO-PRESS).
Abstract In this paper, the aerodynamic performance of two new cable surfaces with concave fillets (strakes) is examined and compared to plain, dimpled and helically filleted sur-faces. To this end, an extensive wind-tunnel campaign was undertaken. Different samples with different concave fillet heights for both new surfaces were tested and compared to traditional surfaces in terms of aerodynamic forces (i.e. drag and lift re-duction) and rain-rivulet suppression. Furthermore, flow visualization tests were per-formed to investigate the flow separation mechanism induced by the presence of the concave fillet and its relation to the aerodynamic forces. Both new cable surfaces out-performed the traditional surfaces in terms of rain-rivulet suppression thanks to the ability of the concave shape of the fillet to act as a ramp for the incoming rain-rivulet. Furthermore, both new surfaces with the lowest tested fillet height were found to have

66 Department of Civil Engineering, Technical University of Denmark
drag coefficients in the supercritical Reynolds range that compare favourably to exist-ing cable surfaces, with an early suppression of vortex shedding.
3.1 Introduction Worldwide economic development has led to a significant increase in long-span bridge construction. The reduced cost and ease of construction of cable-stayed bridges has made them the choice bridge for medium to longer spans.
Cable-stayed bridges have been constructed in past with a variety of different types of cable, but the parallel mono-strand cable has emerged as the preferred solution in re-cent years, for reasons of cost, maintenance, and corrosion protection (Gimsing and Georgakis, 2012).
The parallel mono-strand cable employs three layers of corrosion protection, namely galvanization of the wires, a polyethylene wrap of the individual strands and a final outer HDPE (High Density Polyethylene) sleeve for all of the strands. The outer cas-ing is traditionally circular in shape, the aerodynamic performance of which has been ex-tensively studied.
Figure 3.1 - Cable sample models from previous aerodynamic measures.
In earlier applications, smooth-surfaced cables were often employed. This surface, generally stable with respect to wind action under dry conditions, can become very unstable under the combination of rain and wind. In certain conditions, the rainwater forms small rivulets, which flow down the surface of the cable and make the apparent cable cross-section aerodynamically unstable. The resulting vibration phenomenon is called rain-wind-induced vibration (RWIV). RWIV can reach amplitudes as high as a several diameters of the cable, and therefore pose a significant threat to the fatigue lifetime and serviceability of the structure.
RWIVs constitute 95% of all knows bridge cable vibrations (Gimsing and Georgakis, 2012). The mechanism was first identified the late 80’s on the Meiko-Nishi Bridge in Japan, during its construction (Hikami and Shairaishi, 1988). After this first report, it has become clear that many other cable vibration episodes that had been observed ear-lier and since for other bridges, can be classified as rain-wind-induced vibration.

3.1 Introduction
67
Intensive efforts have been made to investigate the mechanism of RWIV and to pro-vide appropriate vibration control measures, which come mainly in three forms: the placement of dampers between the cables and the bridge girder, cross-ties between the cables, and aerodynamic control which results from manipulation of the cable section shape and surface (Hojo et al., 2000).
Figure 3.2 – Cable sample models with concave fillets
Several different aerodynamic cable surfaces have been proposed to date in order to control vibrations either through prevention of rain-rivulet formation or by disturbing the flow around the cable. Two cable surfaces currently dominate the market, namely helical fillets, which are extensively used in Europe and North America, and dimples, which are used predominantly in Asia (Figure 3.1). Nevertheless, the introduction of helical fillets and dimples has not completely eliminated RWIVs, often leading bridge owners to install cable vibration dampers or cross-ties. Previous research (Yagi, 2011; Kleissl and Georgakis, 2013) shows that by modifying the shape, alignment and con-

68 Department of Civil Engineering, Technical University of Denmark
figuration of the protuberances on the HDPE tube, it is possible to eliminate or further reduce the RWIVs, together with a reduction in drag force.
In particular, preliminary investigations of cable surface modifications involving con-cave fillets, as undertaken by Kleissl and Georgakis (2013), were found to outperform traditional surfaces, showing similar aerodynamic force coefficients, compared to tra-ditionally helically filleted and dimpled surfaces despite a significant increase in the fillet height.
As a result, the objective of the present work is to further examine the aerodynamic performance and understand the behaviour of innovative bridge cable surfaces with concave fillets, particularly when compared with plain, dimpled and helically filleted surfaces. Focus is placed on the determination of the flow structure and development of the near-wake of bridge cables, so as to make it possible to adjust and thus improve concave fillets for the purpose of drag reduction, while at the same time guaranteeing optimal rain-rivulet suppression. To this end, an extensive wind-tunnel test campaign was performed at the Climatic Wind Tunnel (CWT) at FORCE Technology (Den-mark). Different samples with varying concave fillet heights were tested and com-pared to the traditional surfaces in terms of aerodynamic forces and rain-rivulet sup-pression. Furthermore, flow visualization tests were performed to investigate the flow separation mechanism induced by the presence of the different fillet shapes. This in-vestigation allows for the understanding of the dependencies of the height and the ra-dius of the concave fillet on the suppression of the rain-rivulet and on the develop-ment of the wake in relation to the resultant drag and lift coefficients.
3.2 Sectional model The models tested were full-scale samples of high density polyethylene (HDPE) tub-ing. As mentioned, several cable surfaces were tested for the purpose of comparison (Figure 3.2). These included a plain surface cable, a traditional helically filleted cable, a dimpled cable, a helically concave (HC) filleted surface and a helically staggered concave (HSC) filleted surface. The plain HDPE tube has a 160 mm outer diameter. The HDPE tubes with two helically wrapped fillets also have an outer diameter of 160 mm. The fillets are rounded with a height of approximately 2 mm on the first sample and 4mm on the second sample, with a pitch angle of 45° and a spiral distance of 251mm. The pattern-indented tube has a diameter of 140 mm, as this is an actual sample of the most common diameter of cable used on the Sutong Bridge. The rela-tive surface roughness is defined by the depth of the indentations, measured to be ap-proximately 1% of cable diameter. The surface with concave fillets were first pro-posed by Kleissl and Georgakis (2013) and have two major mechanical functions.

3.3 Experimental work
69
Firstly, the fillets work as a ramp for rain rivulets, forcing water to leave the surface of the cable. Secondly, the concave sides and the sharp tip of the fillet lead to stronger directional guidance of the remaining water along the fillet (Kleissl and Georgakis, 2013). For helically concave filleted surface, the fillets replicate the typical arrange-ment of current stay cables with helical fillets, which results in a 45° pitch angle and a spiral distance of 251mm.
For the helically staggered concave filleted surface, the fillets are arranged laterally in a staggered helical pattern with a pitch angle of 30° and spacing between the fillets of 20mm.
For both concave filleted surfaces, three different heights of the fillet were produced and tested in order to understand the dependency of the height and arrangement of the fillet on the drag force and its ability to maintain optimal performance in terms of rain-rivulet suppression. In the original design first proposed by Kleissl and Georgakis (2013), a height (h) of 6.9mm (h/D = 0.043) was used. From the original design, two additional fillet heights were chosen for testing. For the HC filleted surface, the height was set at 4.3mm (h/D = 0.027) and 5.3mm (h/D = 0.033). For the HSC filleted sur-face, the height was set at 4.3mm (h/D = 0.027) and 8.9mm (h/D = 0.055). The tallest fillet, for HSC filleted surface, was chosen after considerations about the possible ad-vantages during ice and snow events, as it could lead to a greater accretion retention.
Figure 3.3 – Climatic wind tunnel at FORCE Technology, Denamrk (Vertical section)
3.3 Experimental work
3.3.1 Wind tunnel facilities
The closed-circuit climatic wind tunnel has a test chamber cross-section of 2m x 2m and is 5m long, which allows for testing of full-scale cables sections, with a diameter

70 Department of Civil Engineering, Technical University of Denmark
up to approximately 200mm in cross-flow, that would equate to a maximum blockage ratio of 10%. The tests were performed at a temperature of approximately 20°C. Wind velocities up to 31m/s can be generated with an average turbulence intensity of less than 1% in normal conditions, i.e. without turbulence grids or the water spray system mounted. The wind velocity was measured with a Pitot-static tube, which was mount-ed on the ceiling mid-width of the test chamber’s cross-section and placed 1.5 m up-stream of the tested models. Turbulence intensity was found to be in range of Iu=0.7% to 1.1% for varying wind velocities, with a value of 0.9% for the average wind veloci-ty of 20 m/s.
3.3.2 Normal flow test set-up
The cables section prototypes were placed horizontally in the wind-tunnel cross sec-tion, resulting in a near two-dimensional flow normal to the cable section. The set up was made as rigid as possible for the execution of the static tests. The drag and lift forces were measured using 6 DOF force transducers (AMTI MC3A-500) placed at either end. The two force transducers were installed between the cable model and supporting cardan joints. The cardan joints were installed in order to reduce the bend-ing moments on the force transducers and to align the cable between the two side walls of the wind tunnel cross-section. The transducers and the joints were covered with dummy pieces of the same cable material and diameter. A gap of approximately 2mm was left between the cable model and the dummy pieces. The HDPE tube and the inner alluminium tube were fixed by means of through-screws in order to avoid any relative movement.
The length of the models was 1.52m, resulting in an aspect ratio of 8.9:1. The block-age ratio for the cable model was 8% and thus the drag coefficients have been correct-ed using the Maskell III method, according to Cooper et al. (1999).
During the tests the wind velocity was increased by regular increments of approxi-mately 1m/s within a range of 5 to 30m/s, allowing for supercritical Reynolds num-bers to be reached for all tested repetitions. The time window used in all measure-ments was 30 s and the sampling frequency was 2048 Hz.
For each tested configuration, the drag CD and the lift CL coefficients were calculated, based on the averaged along-wind and across-wind forces respectively, normalized by the along-wind flow velocity:
𝐶< = TU
hZY;
ZS< (3.1)
𝐶S = T[
hZY;
ZS< (3.2)

3.3 Experimental work
71
Figure 3.4 – Normal flow test set-up
where FD is the total along-wind force and FL is the across-wind component, U is the mean wind, L is the effective length of the cable, D the outer diameter of a plain sur-face cable, without taking into consideration cable surface modifications and 𝜌 the air density, taken here as 1.25kg/m3.
3.3.3 Flow visualization
During the flow visualization tests, cable samples were placed normal to the flow for comparison with the results obtained from the static tests. Smoke particles were added to the flow to trace the fluid motion. In order to visualize a slice of the fluid flow pat-tern, the particles were illuminated with a sheet of laser light. With smoke particle sizes in the order of 0.2 µm, it can be assumed that the particles faithfully follow the streamlines of the flow (Kleissl et al. 2013). For this, a high-output smoke generator was employed using a water-based quick dispersing smoke fluid. The smoke injection was applied approximately 0.5 m upwind of the cable samples. Due to dispersion of the particles at high wind velocities, tests were run up to the sub-critical Reynolds number range limit, namely Re ≈ 0.6 x10⁵. The laser sheet was generated with a green (532 nm) 3W continuous-wave diode-pumped solid-state laser and a 451 Powell lens line generator ensuring a uniform intensity throughout the sheet. The laser sheet had a thickness of approximately 2 mm.
3.3.4 Rain-rivulet suppression
Rivulet suppression tests were performed with the cable declining along the wind di-rection. The inclination is quantified through the wind-cylinder angle, 𝜙, i.e. the angle between the mean flow and the cylinder axis. When gravity affects the behaviour (e.g. in presence of water or ice accretions on the cylinder surface) or when the cylinder is not perfectly symmetric, two angles must be considered: the yaw angle, 𝛽, i.e. the an-

72 Department of Civil Engineering, Technical University of Denmark
gle between the projections of the mean flow and the cylinder axis in the horizontal plane, and the inclination angle, Θ, i.e. the angle between the cylinder axis and the horizontal plane. The relationship between 𝜙; 𝛽 and Θ is:
𝜙 = 𝑎𝑟𝑐𝑐𝑜𝑠(𝑐𝑜𝑠Θ𝑐𝑜𝑠𝛽) (3.3)
Figure 3.5 - Rain-wind-induced vibration set-up schematics (a),rivulet suppression set-up (b) and flow visualization set-up (c)
In the current set-up tests were performed at a cable inclination angle of Θ= 40° and with a yaw angle of 𝛽 = + 22.5°, resulting in a relative cable-wind angle of 𝜙 = 45° (Kleissl and Georgakis, 2013). A plain surface cable section was used to make up the first top half of the model length, in order to facilitate the formation of the upper and lower rivulet, while varying cable sections were used to make up the second half of

3.4 Results and discussion
73
the length. Kick-starting the rivulet on the first plain surface half of the model allowed for an easy evaluation of the distance the rivulets could travel along the modified ca-ble section before complete suppression (Kleissl and Georgakis, 2013). All tests were repeated for 7m/s (Re = 7.06 x 10⁴) and 15m/s (Re = 1.63 x 10⁵) which are the repre-sentative values for the lower and upper velocity range for RWIVs respectively.
3.4 Results and discussion
3.4.1 Rain-rivulet suppression
The formation of one or two rain water rivulets (upper and/or lower) and the rivulet motion as well, is a necessity for the development of large amplitude vibrations (see e.g. Hikami and Shiraishi (1988), Flammand (1995), Cosentino et al. (2003), Yamau-chi et al. (2008), Kleissl (2013)). The formation of the upper rivulet requires moderate wind speeds. The upper rivulet forms on the side of the cable where the wind hits the cable surface, since the wind avoid the water from sliding down. Therefore, the wind speed cannot be too high, as this would blow the water away. On the other hand, the wind speed cannot be too low, as gravity will prevail and the upper rivulet will join the lower rivulet.
Figure 3.6 – Rain-rivulet suppression of traditionally helically filleted surfaces at U = 7m/s (Re = 7.06 x 10⁴).
The structural conditions and weather conditions for RWIVs to take place on a smooth cable surface have been compiled over the years, Gimsing and Georgakis (2012), and researched by Hikami and Shiraishi. (1988), Matsumoto et al. (1992), Flamand et al. (1995), Larose et al. (1999), Cosentino et al. (2003), although not all are in accordance. The general conditions include wind speeds between 7 - 15 m/s, cable frequencies 0.5–3.3 Hz, yaw angles 0–45° (with 0° being parallel to the cable axis), low wind turbulence and mainly stays declining along the wind. Since the syn-chronization of the cable and rivulet movement its seen as a driving parameter by the-se researchers, it is thought to either suppress or disorganise the rivulet movement, while keeping aerodynamic forces, in particular the drag coefficient, at an acceptable

74 Department of Civil Engineering, Technical University of Denmark
level. After studies were carried out, the helical fillet and pattern-indented surface has been mainly applied to the protective tubes of stay cables. Recent studies performed by Yamauchi et al. (2008), show that a disorganization of the rain-rivulet should be sufficient to suppress RWIV. Nevertheless, these modifications are not fully able to supress vibrations. Rain-wind-induced vibrations were reported on studies on the Øre-sund Bridge for the traditional helically filleted cable (Larose and Smitt, 1999; Acampora and Georgakis 2011) and on studies regarding the pattern-indented cables on bridges (Chen, 2011; Katsuchi, 2011) and in wind tunnel tests (Katsuchi and Yamada, 2011). Due to such discoveries and since vibrations in dry weather condi-tions also have been observed for cables with helical fillets (Christiansen et al. 2015), other surface treatments have been preliminary tested by Kleissl (2013) to prevent vi-brations in dry and wet conditions. Test were run statically up to the post-critical re-gime (Re=3.5 x 10⁵) and dynamically in a Reynolds number range from 0 up to 2 x 10⁵ on the HC and HSC filleted surface with a fillet height of h/D=0.043. The results from the wet dynamic tests show that neither of the two new innovative surfaces were found to suffer from RWIV when tested dynamically. In dry conditions one of the in-novations with helically arranged strakes was observed to experience the same limited amplitude vibrations as observed for other cables with helical fillets. On the other hand, the innovative cable with staggered concave strakes was dynamically stable in dry conditions (Kleissl, 2013).
Figure 3.7 – Rain-rivulet suppression of helically concave filleted surfaces at U = 7m/s (Re = 7.06 x 10⁴).
A parametric investigation is herewith performed on the concave filleted cable sec-tions in order to understand the dependencies of the variation of the concave fillet height in terms of rain rivulet suppression, since the complete removal of the rivulet will totally eliminate the mechanism leading to RWIV. Comparison also is made with traditional cable surfaces with similar fillet height in order to understand the influence of the fillet shape on the formation and/or suppression of the rain rivulet. Furthermore, by lowering the concave fillet height from the original height tested by Kleissl (2013), better aerodynamic performances can be achieved.

3.4 Results and discussion
75
Figure 3.6 shows the rain rivulet suppression ability of the tested cable surfaces. The helically filleted surface for both the different fillet heights of h/D=0.0125 and h/D=0.025 is able to reduce the size of the rain rivulet along the length of the cable and the way the rain-rivulet is formed but it is not able to completely suppress it. The-se observations are in agreement with recent tests performed by Yamauchi et al. (2008) on cable with double helical ribs with a fillet height of h/D=0.014. Results from the wet dynamic tests on the sample show a similar disorganized rain-rivulet running on the cable surface. On the other hand, concave filleted cables experience a complete suppression of the upper and lower rivulets at both wind velocities tested (Figure 3.7).
Figure 3.8 – Rain-rivulet suppression for different concave fillets heights at U = 7m/s (Re = 7.06 x 10⁴).
The particular shape of the concave fillet acts as a ramp, blocking the formation of the upper and lower rivulet along the whole length of the cable. It was noted that this is mainly due to the concavity of the fillet and its sharp top edge (Burlina et al. 2016). Furthermore, and unlike the traditional cables, the concave fillet is able to supress up-per and lower rivulet formation, even with the lowest tested height of h/D=0.027 (Figure 3.8).
Regarding the dimpled surface, it was not possible to test the sample due to rain rivu-let suppression test set-up constraints. From previous studies performed by Kleissl and Georgakis (2013), the dimpled surface performs similarly to the traditional helical fillet, which is able to reduce the size of the rain rivulet along the length of the cable but it is not able to completely suppress it.

76 Department of Civil Engineering, Technical University of Denmark
3.4.2 Force coefficients
A parametric investigation was performed in cross-flow on the concave filleted cable sections in order to understand the dependencies of the variation of the concave fillet height in terms of aerodynamic forces. Furthermore, they were compared with the plain, dimpled and traditional helically filleted surfaces under the same conditions.
It can be noted in Figure 3.9(a) that for the HC filleted surface there is gradual transi-tion from the sub-critical to the post-critical regime starting from a value of approxi-mately 1.0 to an end value of approximately 0.7 remaining nearly constant after enter-ing the post-critical regime. An accentuated transition in correspondence of the criti-cal Reynolds number does not appear as for the plain cable surface (see Zdravkovich, 1986).
Figure 3.9(a) also shows the variations of drag coefficient with the Reynolds number for the three different heights of concave fillet (h/D = 0.027, 0.033 and 0.043). Note a decrease of the drag coefficients in the supercritical range from 0.76 down to 0.71 with the decrease of the fillet height from 6.9mm to 4.3mm.
As a result, there is a clear dependency of the fillet height on the level of drag force in the post-critical regime. A higher fillet creates localized wider wake, influencing the overall level of drag force, not allowing for a boundary layer transition, narrowing of the wake and subsequent decrease in drag force. The same transitional behaviour from the sub-critical to the post-critical regime. The difference can be attributed to form drag.
When compared to a helically filleted surface (Figure 3.9(c)), the HC filleted surface with the 4.3mm concave fillet height experiences the same drag force compared to the traditional helical fillet with a 4mm fillet height. The helically filleted surface with the 2mm fillet height experiences a lower drag of 0.64 when entering the post-critical range. This is due to a more accentuated drag transition in the Reynolds number range between 2.0 and 2.6 x 10⁵. Despite the same arrangement the fillet directly facing the incoming flow, which acts as a fixed ramp and separation point and thus resulting in a wider wake. As was noted from Figure 3.7(a), this phenomenon is reduced when the concave fillet height is reduced (Burlina et al., 2016). Different heights of concave fillet (h/D = 0.027, 0.033 and 0.043). Note a decrease of the drag coefficients in the supercritical range from 0.76 down to 0.71 with the decrease of the fillet height from 6.9mm to 4.3mm.
As a result, there is a clear dependency of the fillet height on the level of drag force while showing the same transitional behaviour from the sub-critical to the post-critical regime. The difference can be attributed to form drag.

3.4 Results and discussion
77
Figure 3.9 – Force Coefficients
The HSC filleted surface (Figure 3.9(b)) exhibits an earlier reduction in the drag force in the sub-critical Reynolds range and a smooth and prolonged flow transition which starts at lower Reynolds numbers between 0.8 - 1.0 x 10⁵. The flow enters a post-critical state at a Reynolds number of about 2.0 x 10⁵ with a constant drag force value of about 0.65. This behaviour results in near-constant drag coefficients over a wide range of Reynolds numbers, after the initial reduction.
The drag coefficient (Figure 3.9(b)) of approximately 0.65 is maintained, when either increasing the concave fillet height up to 8.3mm (h/D = 0.055) or decreasing it down

78 Department of Civil Engineering, Technical University of Denmark
to 4.3mm (h/D = 0.027). As stated earlier, it is believed, that this optimal performance is due to the ability of the staggered sharp shaped concave fillet facing the flow, and the circumferential orientation, to enhance vorticities at the boundary layer resulting in a turbulent boundary layer flow. A turbulent boundary layer flow has a larger mo-mentum than
Figure 3.10 – Power spectral density (PSD) of lift coefficients for traditional cable surfaces
laminar boundary layer flow, thus resulting in a delayed flow separation and in a nar-rower wake. This leads to the subsequent lower drag.
When comparing drag, the HSC filleted surface and the dimpled surface show a simi-lar behaviour over the tested Reynolds number range. On the other hand, the HSC fil-leted surface shows a smoother transition compared to the dimpled surface, leading to lower risk of aerodynamic instabilities over the affected Reynolds numbers interval. The early flow transition for the dimpled surface cable agrees well with what has been observed for circular cylinders with uniform high roughness, which easily triggers turbulence ensuring a near-constant super-critical drag (Miyata et al. 1994 and Hojo et al. 1995).
Concerning the lift force, apart from the plain cable surface, the other four cable sur-faces experience an almost zero lift along the whole range of wind velocities tested

3.4 Results and discussion
79
(Figure 3.9(f)). This is most likely due to the ability of all the surface modifications to generate variations in the flow and separation lines along the length of the cable. The-se variations, as largely reported in previous studies, are the result of enhanced vorti-cities and counter rotating vortices for the dimpled surface (Miyata et al., 1994) and of periodic structures in the spanwise direction with localized increased streamwise vor-ticities and elongations of the vortex formation region for the traditional helical fillet (Nebres and Batill, 1993). It must be noted that recent studies by Larose et al. (2012) and Matteoni et al. (2013) show a sensitivity of the aerodynamic performance of the cables, with both plain and helically filleted surfaces, with respect to the cable wind angle of attack. This is due to the deviation of the cable from its original circular shape. The studies show that each time the cable was rotated on its axis, a new shape was exposed to the flow and a different behaviour can be expected in terms of lift force.
3.4.3 Fluctuating lift forces
A frequency analysis of the unsteady cross-stream force (fluctuating lift) is undertak-en. With the particular cross-flow test set-up employed, the fluctuations of the total lift force on the model can be determined. The frequency distributions of the lift force are determined using a Fast Fourier Transformation (FFT) to compute the power spec-tral density (PSD) of the lift coefficient. The PSD is computed for each of the flow velocities tested. The discrete number of flow velocity-specific spectra is then ex-panded into a two-dimensional contour plot, as seen in Figure 3.10 and 3.11, for each of the cable models. The Strouhal number is computed for all five cables (St = fs D/U, where fs is the frequency of vortex shedding). The increased PSDs at around 30 and 35Hz can be explained as the incidences of model resonance.
The linear trend, identifying vortex shedding, disappears around a Reynolds number between 2.0 and 2.2 x 10⁵ for the plain cable and the traditional helically filleted cable respectively. These values correspond for both surfaces to the flow transition from the sub-critical to the post-critical Reynolds number regions. The same linear behaviour disappears at much lower Reynolds numbers for the cable surfaces with the concave fillet for the whole range of fillet heights tested. This occurs at Reynolds number around 1.5 x 10⁵ for both concave filleted surfaces, which corresponds to the smooth and prolonged drag transition for the HC filleted surface and to the entrance in the su-per-critical regime for the HSC filleted surface. On the other hand, the vortex shed-ding remains throughout the whole range of tested velocities for the dimpled cable surface, despite the early flow transition at a Re = 0.8-1.0 x 10⁵, as experienced also by the HSC filleted surface. Furthermore, a significantly higher Strouhal number of 0.28 is determined for the dimpled surface compared to the other samples, which were

80 Department of Civil Engineering, Technical University of Denmark
founded to have a Strouhal number of 0.20. As a result, both concave filleted surfaces are able to suppress vortex shedding formation at much lower wind velocities than a traditional helically filleted or dimpled surface. The HSC filleted surface, which expe-riences the same drag reduction showed by the dimpled surface, is able to suppress vortex shedding in the same range as the transition to the super-critical regime.
Figure 3.11 - Normal flow lift coefficients (PSD) for helically concave filleted cable surfaces.
3.4.4 Flow visualization tests
Flow visualization tests were performed on the HC filleted and the HSC filleted cable surfaces for the varying concave fillet heights. The aim of the tests was to understand the disturbance created by the concave fillet on the incoming flow, the separation mechanism, and subsequent development of the near wake.
Figure 3.12(a) and (b) shows the separation points created by the concave fillet in both cables at the subcritical Reynolds number of 0.6 x 10⁵. The concave fillet in the HC filleted surface (Figure 3.12(a)), is seen as a solid fence to the oncoming boundary layer flow. In this way, it creates a fixed separation point and a subsequent recirculat-ing zone behind the concave fillet. Hence, as the concave fillet height is increased from 4.3mm (h/D = 0.027) to 6.9mm (h/D = 0.043), a larger recirculation zone is

3.4 Results and discussion
81
formed behind the fillet. As a result, the height of the fillet changes the aerodynamic performance of the cable with a dependency on the diameter of the cable in terms of h/D ratio. In fact, the increase in size of the recirculating zone created behind the fillet will affect the possibility for early flow reattachment, a delayed further downstream turbulent separation, and a narrower wake. This particular behaviour does not allow for a transition in the flow for increased Reynolds numbers, which would lead to a reduction of the wake’s size and subsequently a reduction of the drag coefficient in the supercritical range (See Figure 3.9).
Figure 3.12 - Flow separation mechanism for HC filleted surface (a) and HSC filleted surface (b)
On the other hand, the same concave fillet applied in a helical staggered configuration (HSC filleted surface) shows a different separation mechanism (Figure 3.12(b)). The concave fillets are oriented parallel to the flow, so that the fillet cross section is per-pendicular to the flow, leading them to behave as vortex generators. Vortex generators are small plates, in the form of wedges, fences, fairing, etc., mounted to a surface, so as to protrude into the flow. They work by generating a strong overturning macro-vortical motion of the near-wall flow (Gad-El-Hak and Bushnell, 1991) causing high energy air outside the boundary layer to be fed into the lower energy region within the boundary layer and thus, through mixing enhancement, results in an enhanced mo-mentum in the vicinity of the wall. In this particular case, it is believed that the large velocity differences generate a region of high shear, resulting in the formation of a pair of counter-rotating vortices. These pairs of vortices leak larger-scale streamwise vorticity into the wake, which stabilizes the narrow wake provided by the delayed

82 Department of Civil Engineering, Technical University of Denmark
separation. This is the major cause of an earlier transition to the supercritical region with a steady low drag force of approximately 0.65 (See Fig. 13). By increasing the fillet height from 4.3mm (h/D = 0.027) to 8.9mm (h/D = 0.055) the same behaviour is observed. This is due to the high sharp edge of the concave fillet, which does not af-fect the flow separation mechanism. As a result, the same level of drag is maintained over the whole range of Reynolds number tested for the different fillet height.
Figure 3.13 – Near-wake development at Re = 0.6 x 10⁵.
In Figure 3.13, the development of the near wake for varying angular positions (0°, 30°, 60°, 90°) for both helically concave filleted surfaces and for the two lower and taller fillets is shown. Different angular positions are achieved by rotating the cable around its axis starting from a fillet position directly facing the flow at 90°.
Through this, it is possible to understand the influence of the fillet height and of the helical orientation on the generation of three-dimensional flow structures, as they cre-ate uncorrelated fluctuations along the span of the cylinder (Zdravkovich, 1981 and Nebres and Batill 1993).

3.5 Conclusions
83
In the case of the HC filleted surface, the different angular position of the concave fillet along the spanwise direction creates various flow regimes and separation mech-anisms as identified by Nebres and Batill (1993) and Ekmekci and Rockwell (2010). When arranged helically, the axial overlap of these mechanisms results in a periodic waviness in the separation line and wake width as illustrated in Figure 3.13. Further-more, when considering different concave fillet heights, the development of the tridi-mensional structure of the wake is enhanced (h/D = 0.043) or reduced (h/D = 0.027) resulting in a higher or lower drag force.
In the case of HSC filleted surface, the helical orientation of the staggered fillets cre-ates a spanwise phase mismatch in the vortex-shedding process. As a result, the vorti-cal structure becomes three-dimensional and loses its strength. The larger near-wake width created by the fillet positioned at 90° in respect to the incoming flow, retard the interaction between the vortices shed from the upper and lower edge on the cable. This mechanism creates an area of acceleration and suction along the spanwise of the cable (Park et al., 2006). It is believed that the low drag that characterizes the HSC filleted surface is not only due to the turbulent separation generated by the fillet as previously explained, but also by the three-dimensional flow created by the vortex dislocation in the wake, resulting in a mean-velocity modification along the spanwise direction (acceleration and deceleration) and in a narrower wake. Furthermore, as the separation mechanism is not influenced by the fillet height, the wake development and resulting drag force are not affected.
3.5 Conclusions Two new cable surfaces with concave fillets are wind tunnel tested for the determina-tion of the aerodynamic coefficients, the structure of the flow’s near-wake and for rain-rivulet suppression. The results are compared with traditional cables with plain, dimpled and helically filleted surfaces. Furthermore, a parametric investigation is per-formed on the concave fillet shape in order to evaluate its performance when applied on both helically concave filleted surfaces.
The helically concave filleted surfaces outperformed the traditional cable surfaces in terms of rain-rivulet suppression, with a complete suppression of the upper and lower rain-rivulets at all tested velocities. This is true even for the profile with the shortest concave fillet tested. This is due to the ability of the concave fillet to act as a ramp for the incoming rain-rivulet.
The helically staggered concave filleted surface exhibits the same behaviour as a dim-pled cable surface in terms of drag coefficient, showing an early transition to the su-percritical range and a subsequent reduction of the drag force. This is due to the abil-

84 Department of Civil Engineering, Technical University of Denmark
ity of the staggered surface configuration to enhance turbulence at the boundary layer level. The HSC filleted surface is also able to suppress vortex shedding formation at lower Reynolds numbers, unlike the dimpled cable surface, which maintains it up to the critical Reynolds number range (Burlina et al., 2016). Furthermore, the HSC fil-leted surface is able to maintain a low level of drag even with an increase of the height of the concave fillet from its original design, which represents a more than 100% in-crease of the fillet height compared to a traditional helical fillet.
The helically concave filleted surface shows a higher drag in the super-critical range compared to HSC filleted surface. This is due to the helical arrangement of the con-cave fillet, which acts as a fixed ramp and separation point and thus resulting in a wider wake. This phenomenon is reduced with a reduction of the height of the fillet.

85

86 Department of Civil Engineering, Technical University of Denmark
Chapter 4
4 Flow structures and wake development behind a cylinder with surface concave fillets in cross flow – 2D The results presented in this chapter are based on the paper: Flow structures and wake development behind a cylinder with surface concave fillets in cross flow – 2D. Burlina, C., Meyer, K.E., Georgakis, C.T., Submitted to the Journal of Experimental Thermal and Fluid Science, April 2018.
Abstract The research reported here explored the effects of concave protruding fillets fitted on a plane circular cylinder in uniform cross flow. The investigation was based on com-parison with the flow dynamics and wake structures induced by a same-size plain sur-face circular cylinder. In particular, focus was directed to the relationship between boundary layer and shear layer instabilities, and between vortex shedding and the sub-sequent level of aerodynamic forces. To make it possible to analyse these wake insta-bilities, flow visualization experiments were carried out using particle image veloci-metry (PIV) on a plain surface and two samples fitted with concave fillets in different configurations: a helically concave (HC) filleted surface and a helically staggered concave (HSC) filleted surface. Tests were performed in the subcritical Reynolds

4.1 Introduction
87
number range (20–40k < Re < 300–400k) for three different wind velocities up to high subcritical Reynolds numbers. Mean flow fields were analysed and turbulent charac-teristics were correlated through turbulent kinetic energy (TKE) and Reynolds shear stress (RSS) analysis. In addition, the investigation of the generation of particular co-herent and non-coherent flow structures in the wake of the three samples was based on proper orthogonal decomposition (POD) analysis. The research showed that the helically concave filleted surface has several effects on the shear layer and on the overall near-wake characteristics, inducing different levels of aerodynamic forces and flow transition regimes than those induced by a plain surface cylinder. Distinct flow variations are identified in the effects induced by the presence of the concave fillets in the HC and HSC filleted circular cylinders.
4.1 Introduction In recent decades, flow around a circular cross-section has been widely investigated, since it is a common shape in many engineering applications such as bridge stay-cables. A circular cylinder generally represents behaviour of wake behind bluff bodies and it is characterized by particular flow mechanisms (Zdravkovich, 1997; William-son, 1996; Soria, 1996). Some of the various complex phenomena can be identified as vortex shedding, unsteady pressure fields, fluctuating aerodynamic forces and down-stream evolution in the wake formation (Oruç et al., 2016). All these features of flow separation are interconnected and strongly depend on Reynolds number, turbulence intensity, cylinder-flow relative angle, surface roughness and geometry. Particular at-tention has been given in investigating the flow structures created and the influence on the flow of the different governing parameters, since they can be the source of high aerodynamic forces and flow instabilities. Various means to suppress these problems and control the wake and aerodynamic forces have been studied (Zdravkovich, 1981, and Naudascher and Rockwell, 2005).
Several methods with varying degrees of effectiveness have been proposed. There are three main categories, based on their phenomenological mechanisms (Kleissl, 2013). The first one is boundary layer control, through a direct transition to turbulence. The boundary layer encounters a laminar-to-turbulence transition in the critical Reynolds number which empowers a larger momentum against the adverse pressure gradient. This mechanism delays the separation point which results in a lower drag. Surface roughness, circumferential riblets and vortex generators are some of the effective countermeasures introduced. The second category of aerodynamic controls is usually applied in the axial direction and has the goal to create an early separation and reat-tachment, which will lead to a laminar to turbulent separation in the rear side of the cylinder. Axial protrusions and axial groves are some of the aerodynamic counter-

88 Department of Civil Engineering, Technical University of Denmark
measures that create this particular flow mechanism. The major drawback with these modifications is that introduces a high and constant drag coefficient over the typical
Figure 4.1 – Samples and concave fillet shape overview.
design wind velocities (Miyata et al., 1999). More efficient aerodynamic counter-measures in the same categories are dimpled surfaces such as pattern-indented sur-

4.1 Introduction
89
face, which are able to create a narrower wake and a subsequent low drag force in the postcritical regime. The third category involves a combination of the previous two categories, with modification in cross section and spanwise. The goal is to induce a three-dimensional flow at separation and wake dephasing. For bridge cables to date, this combination has resulted in a helical strake or wire wrapped around the cylinder with various sizes and shapes, and it is the most widely adopted solution from a com-mercial point of view. The mechanism behind the effect of the helical fillets comes from periodic geometric changes in the spanwise direction near the separation point. These changes can disrupt the two-dimensional shear layer, triggering a three-dimensional flow instability which is redistributed due to the helical organization of the wire (Naumann and Quadflieg 1974).
This last category of modification is of particular interest in this study along with dimpled surface modifications (Miyata et al., 1994), because they have both been widely adopted as bridge cable solutions to suppress vortex-induced vibration, dry galloping, and rain-wind-induced vibration (RWIV). Nevertheless, the introduction of helical fillets and dimpled surfaces has not fully eliminated rain-wind vibration, lead-ing bridge owners to install cable vibration dampers and/or cross-ties. Previous re-search (Yagi, 2011, and Kleissl and Georgakis, 2013) shows that by modifying the shape, alignment, and configuration of the protuberances on the HDPE tube, it is pos-sible to eliminate or further reduce RWIV, as well as reduce drag force. In particular, cable surface modifications in the form of a concave fillet, which have been studied by Kleissl and Georgakis (2013) and Burlina et al. (2016), have been found to outper-form currently used solutions, both in terms of cable vibration suppression and control of aerodynamic drag force. Static wind tunnel tests were carried out on cylinders with a helically concave (HC) filleted surface with a 45° pitch and with a helically stag-gered concave (HSC) filleted surface with a 30° pitch. The strake cross-section has a trapezoidal shape with concave sides and a height of h/D=0.027 (HC) and h/D=0.043 (HSC). The HSC filleted surface had a post-critical drag coefficient of 0.65, which is similar to that of pattern-indented cable surfaces and a traditional helical fillet. The HC filleted surface had a post-critical drag coefficient of 0.71. Furthermore, both the-se modified cable surfaces showed a smooth transition into the post-critical regime, avoiding in this way possible instabilities from drastic changes in drag force (Burlina et al. 2017). As observed by Choi et al. (2008), different Reynolds number-dependent flow regimes can occur, and a device that is successful at a given Reynolds number is not necessarily successful over the entire range of interest. With regard to the lift force, both HC and HSC filleted surfaces have an almost zero lift from sub-critical up to the post-critical regime. This is probably due to the ability of all the surface modifi-cations to generate variations in the flow and separation lines along the length of the

90 Department of Civil Engineering, Technical University of Denmark
cable. Frequency analysis of the unsteady cross-stream force (fluctuating lift) also showed that both innovative surfaces are able to suppress vortex shedding at an earlier flow regime than a plain surface or traditional cable surface modifications. Complete suppression of vortex shedding is achieved by the HC filleted surface at a Reynolds number equal to 1.5 x 10⁵ and by the HSC filleted surface at a Reynolds number be-tween 0.8 and 1.0 x 10⁵, with a Strouhal number equal to 0.20 for both innovations (Burlina et al. 2017).
Nevertheless, the structures and mechanisms created in the cylinder wake which are able to introduce these improvements are still unclear and have yet to be experimen-tally studied. As a result, the objective of the research was to study the behaviour of innovative bridge cable surfaces with concave fillets, since a better understanding of these structures and their development in the near-wake will make it possible to em-ploy further manipulations and improvements of the concave fillet for drag reduction in combination with high rain-rivulet suppression performance. Many studies have focused on identifying the dominant features in the flow behind bluff bodies, includ-ing the birth of coherent structures in the low Reynolds number range and their persis-tence in the turbulent regime. The main structures identified are the von Karman vor-tices, that result from a global instability, the longitudinal vortices, that connect these and originate secondary instabilities (e.g. Williamson, 1992, Persillon and Braza, 1998, Perrin et al., 2006), and the smaller-scale Kelvin-Helmholtz vortices, that result from convective instability in the shear layer (e.g. Bloor, 1964, Braza et al., 1990, Per-rin et al., 2006). Therefore, at the Reynolds numbers tested, the flow presents a dual character, with organized and chaotically fluctuating motions interacting non-linearly. As a result, the overall flow structure is a superposition of several structures, and it is therefore necessary to carry out a statistical analysis to make it possible to decompose the flow and reach a conclusion about its dynamic.
Numerous studies have previously been undertaken to of decompose this type of flow into its random and coherent parts. Since coherent structures are periodic, the main method of analysing them are phase-averaging (Cantwell and Coles, 1983), linear sto-chastic estimation (LSE) and proper orthogonal decomposition (POD). LSE was pro-posed by Adrian (1977) and is based on a set of non-conditionally acquired data used to estimate the conditional averages. POD uses a series of measurements decomposed into a number of modes which make up an orthonormal basis spanning the entire data set (Meyer et al. 2007).
In order to investigate these wake instabilities, flow visualization experiments were carried out using particle image velocimetry (PIV) on a plain surface and two samples fitted with concave fillets in different configurations. The present study characterizes different aspects of the flow using a combination of two-dimensional particle image

4.2 Models
91
velocimetry (PIV) and stereoscopic particle image velocimetry (SPIV). Two-dimensional PIV measures two components of the instantaneous velocity vector (see Figure 4.2), while SPIV measures all three components of the instantaneous velocity vector in the plane (see Figure 5.1)., where each sample can be considered a ‘snap-shot’ of a cut through the flow. Tests were performed in the subcritical Reynolds number range. Mean flow fields were analysed and turbulent characteristics were cor-related using turbulent kinetic energy (TKE) and Reynolds shear stress (RSS) analy-sis. The decomposition of the flow is then carried out using POD. It is not usually possible to achieve sufficiently high time resolution to get several snapshots of the same structure. Based on energy considerations, the POD captures the most energetic and therefore largest structures of the flow in the first modes. So, if the dynamics of the flow are dominated by a few large flow structures, the data can often be satisfacto-rily represented using only a few of the first modes, which will then reflect the domi-nant flow structures (Meyer et al., 2007).
Chapter 4 presents the results of the two-dimensional particle image velocimetry (PIV), while Chapter 5 presents results of the stereoscopic particle image velocimetry (SPIV) tests. Furthermore, description of the models and POD method employed are commonly described in Section 4.2 and 4.3, since they are similarly used in both se-ries of tests.
4.2 Models The models tested were 1:3 cylindrical scaled samples made of anodized aluminium from original full-scale samples of high density polyethylene (HDPE) tubing. The models had an outer diameter of D = 53.3mm, concave fillet excluded, and a length of L=300mm. Various cable surfaces were tested (Figure 4.1): one sample with plain surface, and two innovative profiles that involve the application of concave protruding fillets. The fillet cross-section has a trapezoidal shape with concave sides, as first pro-posed by Kleissl and Georgakis (2013). In one of these profiles, which will be re-ferred to as the helically concave (HC) filleted surface, the fillets replicate the typical arrangement of current stay cables with helical fillets, which have a 45° pitch angle, a spiral distance of a = 83.7mm, and a fillet height of h = 1.4mm (h/D = 0.027). In the second model, which will be referred to as the helically staggered concave (HSC) fil-leted surface, the fillets are arranged laterally in a staggered helical pattern with a pitch angle of 30°, spacing between the fillets of 20mm, and a fillet height of h = 2.1mm (h/D = 0.043).

92 Department of Civil Engineering, Technical University of Denmark
4.3 Proper orthogonal decomposition (POD) method Proper orthogonal decomposition of the flow field was used to analyse the coherence and dominant dynamics in the wake behind the curved cylinder.
Proper Orthogonal Decomposition (POD) was first suggested by Lumley (1967) in the area of coherent structures along with field-measurement techniques. The present analysis used the so-called “Snap-shot method” of Sirovich (1987). This approach us-es snapshots as a numerical procedure to reduce the computational time of POD mode calculations. The present study followed the procedure presented by Meyer et al. (2007) and previously studied by Lumley et al. (1998) and Pedersen (2003).
Each instantaneous PIV measurement is considered to be a snapshot of the flow. The analysis in this study was performed on 1000 samples taken in one plane based on variability and standard deviation in the instantaneous flow field. The first step is to calculate the mean velocity field, which is then considered as the zeroth mode of the POD analysis. The rest of the analysis concerns the fluctuating parts of the velocity components (𝑢jk, 𝑣jk, 𝑤jk), where u, v, and w denote the fluctuating part of each of the
three velocity components. Index n runs through the N number of snapshot and j, runs through the M positions of velocity vectors in a given snapshot (i.e. uj = u(xj, yj, zj)). All fluctuating velocity components from the N snapshots are arranged in a matrix U as:
𝑈 = 𝑢l𝑢G …𝑢4 =
𝑢ll𝑢lG …𝑢l4..…...… ...….𝑢nl 𝑢nG …𝑢n4
𝑣ll𝑣lG …𝑣l4..… ...… ...… .𝑣nl 𝑣nG …𝑣n4
𝑤ll𝑤lG …𝑤l4..… ...… ...… .𝑤nl 𝑤nG …𝑤n4
(4.1)
The autocovariance matrix is created as
𝐶 = 𝑈o𝑈 (4.2)
and the corresponding eigenvalue problem
𝐶𝐴q = 𝜆q𝐴q (4.3)

4.4 Experimental details
93
is solved. The solutions are ordered according to the size of the eigenvalues
𝜆l > 𝜆G > … > 𝜆q = 0 (4.4)
The eigenvectors of (x.x) form the basis for constructing the POD mode 𝜙q,
𝜙q = 5tu vtwtxh
5tu vtwtxh
, i = 1, …., N. (4.5)
where 𝐴kq is the nth component of the eigenvector corresponding to 𝜆q from (x.x) and the discrete 2-norm is defined as
𝑦 = 𝑦lG +𝑦GG + ⋯+𝑦nG (4.6)
Each snapshot can be expanded into a series of POD modes with an expansion coeffi-cient ai for each POD mode i. The coefficients, also called POD coefficients, are de-termined by projecting the fluctuating part of the velocity field into the POD modes
𝑎k = Ψo𝑢k (4.7)
where Ψ = 𝜙l𝜙G … . 𝜙4 has been introduced. The expansion of the fluctuating part of a snapshot n is
𝑢k = 𝑎qk𝜙q = Ψ𝑎k4q|l (4.8)
It should be noted that the amount of total kinetic energy from velocity fluctuations in the snapshots associated with the POD modes is proportional to the corresponding eigenvalue (Fukunaga 1990). As a result, the ordering of the eigenvalues and eigen-vectors ensures that the most important modes in terms of energy are the first modes. This means the higher modes are the ones associated with the large-scale structures of the flow.
4.4 Experimental details
4.4.1 Flow configuration and flow regime
The experimental investigations were performed in the closed-loop wind tunnel in the Department of Mechanical Engineering at the Technical University of Denmark. The wind tunnel has an upstream contraction area ratio of 12.94:1 and a test chamber cross-section of 300x300mm. The test section has optical access through windows in the side and top walls. The sample was placed vertically along the centreline of the wind tunnel cross section. The coordinate system is defined in Figure 4.2: y is the cross-flow direction, x is the horizontal out-of-plane direction, and z is the vertical out-of-plane direction, with the origin in the centre of the circular cylinder. The tests were performed at a temperature of approximately 20 °C. The temperature, ambient

94 Department of Civil Engineering, Technical University of Denmark
pressure, and wind velocity could be estimated by monitoring the pressure difference of the section using a Debro micromanometer and using the Bernoulli equation and the law of mass conservation.
The tests were conducted at three different free-stream velocities (cross-flow velocity) of U¥ = 15.0 + 0.4 m/s, 25.0 + 0.4 m/s, 35.0 + 0.4 m/s, taking into account the error margins of the indirect measurements. The corresponding Reynolds numbers based on the sample diameter D and free-stream velocity U¥ are Re = 5.08 x 10⁴, 8.45 x 10⁴, 1.18 x 10⁵. The calculated Reynolds numbers fall under the subcritical flow regime. Based on the length and diameter of the models tested, the resultant aspect ratio is equivalent to 1:5.7 for the particular wind tunnel cross section. The resulting blockage
Figure 4.2 – Two-dimensional particle image velocimetry (PIV) set-up
ratio (BR) for the cable model is 17%. The effect of this range of blockage ratio in terms of critical Reynolds number, vortex shedding and wake development has previ-ously been studied by Patil et al. (2008). That study showed that the critical Reynolds number gets delayed and the steady wake bubble is found to decrease with values of BR up to 40%. This is due to the effect of the walls, which act as a damper for the in-stabilities and impart stability to the flow without altering flow structures. Based on this, we assumed that the characteristics and development of the flow and wake be-hind the three samples was not altered in terms of dominant structures and that com-parison between the samples is possible.
4.4.2 Particle image velocimetry (PIV) set-up
In this study, a two-dimensional particle image velocimetry (PIV) was used to inves-tigate the modification of the near-wake flow structure. This technique makes it pos-sible to simultaneously obtain the velocity vectors at many different points in the flow

4.4 Experimental details
95
field. The technique includes flow seeding, test section illumination, and a rapid suc-cession of two images capturing the illuminated region. The velocity vectors in the flow field can be computed from the particle displacement if the elapsed time between successively captured images is known. A schematic diagram of the experimental ap-paratus is shown in Figure 4.2. The PIV system was provided by Dantec Dynamics and consists of a Dantec Hisense II camera (resolution 1344x1024) with 24mm and 70mm Nikon lenses. The 24mm lens was used to visualize the near wake developed behind the cylinders to a distance up to 3D in the y-direction and +1D in the x-direction from the cylinder centre. The 70mm lens was used to visualize the flow sep-aration mechanism created by the presence of the concave fillet in an area of approx-imately 1D2 from the centre of the cylinder.
The camera was positioned perpendicular to the inflow direction, recording with an f-number f#=5.6 for both lenses used. The laser was a Nd:YAG laser with a wavelength of 532nm, a pulse energy of 200mJ, and a sheet thickness of 1.5mm. Glycerol drop-lets with diameter around 2µm were added to the flow.
Figure 4.3 – Schematic showing the planar fields of visualization.
The images were processed using Dantec Dynamic Studio version 2015a with 32 x 32 pixels per interrogation area with 50% overlap. Considering the image area and size of the CCD, a magnification factor of M0_70 = 0.129 with a resultant viewing area of 40.5x53.2mm was achieved for the 70mm lens, and of M0_24 = 0.048 with a resultant viewing area 108.9 x 142.9mm was achieved for the 24mm lens. Image maps were recorded with an acquisition rate of 4 Hz, which ensured the statistical independence of the samples. The time between pulses (tbp) was set to tbp_70 = 21, 13, 9 µs for the 70mm lens and to tbp_24=56, 34, 24 µs for the 24mm lens for the respective three flow

96 Department of Civil Engineering, Technical University of Denmark
velocities tested U¥ = 15, 25, 35 m/s. In this way, a maximum particle image dis-placement of 10 pixels between pulses was ensured.
4.4.3 Measurement accuracy
All the quality measures, which together define the performance of the PIV system, are listed in Table 4.1 together with some values usually found in the literature.
Quality measures Control Parameters
S/N ratio Spatial resolution
laser-pulse delay time (Dt) in-plane displacement
- DX < 0.25DI, where DX is the in-plane displacement and DI is the length of the interrogation area
out-of-plane displacement - Dz < 0.25DZ, where Dz is the out-of-
plane displacement and DZ is the laser sheet thickness
Correlation-noise (scorr ≈ 0.1 px)
particle image density - NI > 10, where NI is the mean number of
particle images in the interrogation area particle loss due to out-of-plane motion
- Fo > 0.75, where Fo is the fraction of particles that is present in both images
velocity gradient - MoçDUçDt/di < 0.5, where DU is the ve-
locity difference within one interroga-tion area
Systematic errors - bias - peak-locking
mean particle image diameter 2px < dt < 4px
Detection rate (95%, i.e. less than 5% spurious vectors)
Table 4.1 – Quality measurement parameters for quality assurance of PIV system calibra-tion and data acquisition.
4.5 Near-wake mean velocity fields
4.5.1 Mean velocity fields
A first impression of the flow wake structure developed behind the three samples test-ed was given by the mean flow fields. The topology of the mean flow fields for the three samples for the three different velocities tested (Re = 5.08 x 10⁴, 8.45 x 10⁴,

4.5 Near-wake mean velocity fields
97
1.18 x 10⁵) is plotted in Figure 4.4 in accordance with Reynolds averaging decompo-sition. The mean flow fields illustrate iso-Vcontours normalized by free-stream veloc-ity, measured by the 2C PIV and representing the near wake of the flow behind circu-lar cylinders in the Shear Layer Transition Regime: burst to turbulence TrSL3 (20–40k < Re < 300–400k for a plane circular cylinder) (Zdravkovich, 1981). In this range, the boundary layer over the plain cylinder surface is laminar and the wake be-comes increasingly turbulent, with increased Reynolds number. A sudden burst to tur-bulence occurs in the free shear layer near the side of the cylinder and eddies form close to the rear of the cylinder (Zdravkovich, 1981). This regime is also known as the sub-critical regime, in which drag force and the Strouhal number are almost constant and lift force is close to zero.
These flow characteristics are valid in the case of plain surface circular cylinders, but in the case of the modified surfaces tested here, these mechanisms are disrupted by the presence of the concave fillets, which create alteration in the topology of the shear layer, the formation of vortices, and wake size.
As expected, a two-symmetric-eddies pattern was obtained for the plain circular cyl-inder, due to the averaging of the passage of the alternating vortices, resulting in a symmetric pattern for U. The change of sign of the mean streamwise component of velocity along the rear axis defines the dimensionless recirculating length Lc. Lc is found to be constant with values between 1.1 and 1.3 for all the three different Reyn-olds numbers tested in the case of the plain surface. Lc depends strongly on the boundary conditions (aspect ratio, blocking factor, and turbulence intensity). Values between 1.1 and 1.4 have been found by several authors (Cantwell and Coles, 1983; Djeridi et al., 2003, Perrin et al., 2008) in the same Re number range, so the measured value seems reasonable. Furthermore, in the case of the plain surface, the same near-
wake topology can be seen for all three velocities. This is in agreement with the quasi-invariable nature of flow in the TrSL3 regime in contrast to an uninterrupted variation of flow through all other flow regimes. The short eddy formation region produces a wide near wake. This in turn displaces the free shear layers into the free stream and causes the acceleration of the stream adjacent to the near wake. The latter may have a strong stabilizing effect on the transition in free shear layers (Zdravkovich, 1981). On the other hand, the HC surface shows the same topology of wake and iso-U contour as the plain surface, in the case of the lower Reynolds number tested (Re=5.08 x 10⁴). If the inflow wind velocity is increased, an elongation of the recirculating length Lc can be seen of up to 1.7 for Re=8.45 x 10⁴ and 1.8 for Re=1.18 x 10⁵. This implies an elongation of the vortex formation length Lf induced by the presence of the helical concave fillet, which creates a shift of the core of the near wake, with negative turbu-lent velocities moved further downstream from the rear stagnation centre of the cylin

98 Department of Civil Engineering, Technical University of Denmark
Figure 4.4 - Mean magnitude flow velocity fields at three different Reynolds numbers: (a) Re=5.08 x 10⁴ (b) Re=8.45 x 10⁴ (c) Re=1.18 x 10⁵.
der. This can be seen as a good indication of the suppression of vortex shedding. Fur-thermore, it is noticeable that the overall shape of the near wake becomes narrower and more elongated with increased velocities than with a plain surface. The HSC sur-face cylinder at Re=5.08 x 10⁴ shows a recirculating length Lc of 2.1 and an increase in the width of the near wake in the x-direction compared to the plain surface at Re=5.08 x 10⁴. If the wind velocity is increased, Lc decreases to 1.5 for Re=8.45 x 10⁴
and 1.1 for Re=1.18 x 10⁵ and the width of the near wake become narrower. These values of Lc are comparable to those encountered for the plain surface cylinder. On the other hand, the overall area of the wake is elongated further downstream from the

4.5 Near-wake mean velocity fields
99
rear stagnation centre of the cylinder. It can be concluded that the HC and HSC fillet-ed surfaces produce narrower wakes than the plain surface cylinder.
Compared to the plain surface cylinder, in the HSC filleted surface case the dimen-sions of the recirculating zone increase as Reynolds number increase, while the oppo-site behaviour is noticed for the HC filleted surface, where the recirculating zone de-creases as the Reynolds number increases.
These facts agree well with the higher and lower drag coefficients exhibited respec-tively for the two samples in the high sub-critical regime, which is then maintained up to the post-critical regime (Burlina et al. 2016).
4.5.2 Turbulent kinetic energy (TKE)
The turbulent kinetic energy (TKE) corresponding to vortex dynamics is one of the most important variables for characterizing the degree of turbulence mixing and for assessing the effect of control techniques (Liu et al., 2016). Because the 2D-PIV pro-vides only a two-dimensional velocity field, the TKE was calculated in normalized
form as TKE=0.75( 𝑢´G +𝑣´G /𝑈�G where u´ is the streamwise velocity fluctuation, and v´ is the crosswise velocity fluctuation. The normalized TKE contours for the three samples at the three different Reynolds numbers tested are shown in Figure 4.5. For ease of comparison between the different samples and inflow wind velocities, the same scaling of velocity vectors and the same intervals between contour levels have been adopted in the plot. For the plain surface cylinder, TKE distributions had a high-ly concentrated zone located along the wake centreline due to a high degree of veloci-ty fluctuation generated by the large-scale vortex shedding (Liu et al. 2016). The val-ue of the maximum TKE, which is located in high concentrated zone, is equal to 0.56 for all the three Reynolds numbers, showing an increase in the maximum area region as velocity increases.
The HC filleted surface shows a similar TKE distribution to that of the plain surface, with a concentrated zone located along the wake centreline. Unlike the plain surface, the HC filleted surface shows an obvious decay in the concentration of TKE contours and the peak magnitudes are lower and moved into the far-wake as the Reynolds number increases. In particular, the value of maximum TKE decreases to 0.48 for Re=5.08 x 10⁴, to 0.36 for Re=8.45 x 10⁴, and to 0.28 for Re=1.18 x 10⁵. This means that the interaction between the shear layers is moved further away from the cylinder wake, resulting in reduced fluctuation in the near wake (Gozmen et al. 2013). Fur-thermore, the weakening of TKE contours shows that the cylinder is influenced by the possible undulating forces induced by the presence of the concave fillet, and can be seen as a solution for controlling the flow over circular cylinders and can be correlate

100 Department of Civil Engineering, Technical University of Denmark
Figure 4.5 - Turbulent kinetic energy (TKE) mean fields at three different Reynolds numbers: (a) Re=5.08 x 10⁴ (b) Re=8.45 x 10⁴ (c) Re=1.18 x 10⁵.
ed to the smooth transition over drag force in the critical regime. The HSC filleted surface shows higher TKE contours values in the region above and below the wake centreline, and these zones of greater TKE are distributed symmetrically about the centreline. This seems to be due to the behaviour of the large-scale vortices in this system, which do not show active motion across the wake centreline and shed down-stream with a straight trajectory due to high turbulence created at separation. The highest value of TKE is reduced to 0.24 for the three different Reynolds numbers, which is nearly half of the maximum value of TKE with the plain cylinder. Further-more, the highest value is located in two symmetrical regions about the centreline,

4.5 Near-wake mean velocity fields
101
closer to the separation point. It seems therefore that the staggered helically concave fillets create high turbulence at separation, weakening a further development of large-scale vortices inside the wake. This confirms that the presence of the staggered con-cave fillet is able to control the flow and prevent interaction between shear layers to create vortices. Moreover, the symmetrically distributed TKE contour regions can be a good indication of low drag acting on the cylinder, and an avoidance of a drastic de-crease in drag force along the flow regimes.
4.5.3 Reynolds shear stresses (RSS)
The normalized Reynolds shear stress (RSS) correlations, 𝑢´𝑣´ /𝑈�G corresponding to the momentum transfer are presented in Figure 4.6 to characterize velocity fluctua-tions in both streamwise and crosswise directions. For ease of comparison between the different samples and inflow wind velocities, the same scaling of velocity vectors and the same intervals between contour levels have been adopted in the plot. RSS is a significant parameter which is normally investigated for flow over bluff bodies. It has a close relevance with the effect of unsteady drag forces acting on the body (Oruç, 2016). It was possible to identify a pair of large-scale 𝑢´𝑣´ /𝑈�G concentrations with opposite sign peaks symmetrically located downstream of the cylinder for all three samples tested because of the creation of large vortex structures. The two regions are more marked and accentuated for the plain surface cylinder, and are weaker and less identifiable for the HC filleted surface, and even more so for the HSC filleted surface. The concentrations in 𝑢´𝑣´ /𝑈�G contours are clear for the plain cylinder case, where they intensify as the streamwise velocity increases. On the other hand, there is a clear weakening of the 𝑢´𝑣´ /𝑈�G contour intensity for the HC filleted surface, and even more so for the HSC filleted surface, as a result of flow suppression leading to a re-duction in drag force acting on the cylinders. The peak magnitude RSS values which arise in the shear layers are also shown in Figure 4.5. The peak values of 𝑢´𝑣´ /𝑈�G move downstream for the HC filleted surface as the Reynolds number increases, and their magnitudes are noticeably diminished compared to the plain surface. Further-more, the maximum absolute values of Reynolds shear stress found in the centre of the large-scale stress concentration regions appear to be further away inside the wake along the cylinder centreline, and at a distance that increases as the Reynolds number increases and gets into the high sub-critical regime. As a result, the HC filleted sur-face shows a more stable near wake region, with an increased vortex formation length, weaker interaction between vortices, and a more stabilized near wake compared to the plain surface. The result is an earlier suppression of vortex shedding and a subsequent smooth transition of the drag force and zero lift force over the critical regime (Burlina

102 Department of Civil Engineering, Technical University of Denmark
Figure 4.5 - Reynolds shear stress (RSS) fields at three different Reynolds numbers: (a) Re=5.08 x 10⁴ (b) Re=8.45 x 10⁴ (c) Re=1.18 x 10⁵.
et al., 2016). The HSC filleted surface shows a reduction in peak values of 𝑢´𝑣´ /𝑈�G of almost 50% for the three velocities tested compared to the plain cylinder. The re-gion of high intensity of Reynolds shear stress is elongated from the separation point along the shear layer further inside the wake, showing the high turbulence created by the staggered concave fillet. Furthermore, compared to the plain surface, the HSC fil-leted surface shows no marked region of maximum absolute values of 𝑢´𝑣´ /𝑈�G . This results in a strong weakening of vortex formation and interaction between shear layers, with a more stable near-wake turbulent region, which indicates a reduction in

4.6 Boundary layer separation mean velocity fields
103
drag force acting on the cylinder, a suppression of vortex shedding, and a smooth transition from the subcritical to the critical regime (Burlina et al., 2016).
4.6 Boundary layer separation mean velocity fields To further investigate the altered flow mechanism induced by the presence of the con-cave fillet in both innovations, a series of close-up PIV measurements were performed at flow separation point. The centre of the concave fillet is positioned at 90° to the
centreline of the circular cylinder for both samples. The time-averaged contours of velocity flow field, turbulent kinetic energy, and Reynolds shear stress for the three different flow velocities are presented in Figure 4.6 for the HC filleted surface and Figure 4.7 for the HSC filleted surface.
Figure 4.6 - Mean velocity fields, turbulent kinetic energy velocity fields, and Reynolds shear stress velocity fields at three different Reynolds numbers: (a) Re=5.08 x 10⁴ (b) Re=8.45 x 10⁴
(c) Re=1.18 x 10⁵ for the HC filleted surface sample.
The mean flow velocity contour plots for the HC filleted surface show no reattach-ment after the forced separation created by the presence of the concave fillet for the three Reynolds numbers tested. The concave fillet acts as a ramp for the incoming flow, creating a zero-velocity region behind the fillet. If the Reynolds number is in-

104 Department of Civil Engineering, Technical University of Denmark
creased to Re=8.45 x 10⁴ and Re=1.18 x 10⁵, the zero-velocity region becomes small-er, the recirculating region bends inside the near wake behind the cylinder, while the shear layer boundary appears to stay invariant. The TKE contour plot at Re=5.08 x 10⁴ shows a narrow region of higher turbulence at the forced separation point, which propagates into the shear layer, and a region of zero-turbulence appears behind the concave fillet region. If the Reynolds number is increased (Re=8.45 x 10⁴), the shear layer turbulence decreases and the region of zero-turbulence become smaller. At Re=1.18 x 10⁵, the region of zero-turbulence almost completely disappears and a vor-tical structure becomes dominant behind the concave fillet. This behaviour is confirm
ed by the Reynolds shear stress contour plot for the three different velocities, which show the low level of momentum transfer and weak 𝑢´𝑣´ /𝑈�G contour intensity. These mechanisms disturb the development of vortex shedding and explain the in-crease in the overall vortex formation length, resulting in a more stable near wake.
Figure 4.7 - Mean velocity fields, turbulent kinetic energy velocity fields, and Reynolds shear stress velocity fields at three different Reynolds numbers: (a) Re=5.08 x 10⁴ (b) Re=8.45 x 10⁴
(c) Re=1.18 x 10⁵ for the HSC filleted surface sample.
A different flow structure is created by the helical staggered concave fillet. The mean flow velocity contour plots for the HSC filleted surface show a uniform decrease in

4.7 Proper orthogonal decomposition (POD) analysis
105
mean velocity moving from the shear layer inside the near wake at Re=5.08 x 10⁴. As the Reynolds number increases, the shear layer moves inside the near wake, narrow-ing the subsequent size of the wake behind the cylinder. TKE contour plots at Re=5.08 x 10⁴ show a region of high turbulence equal to 0.24 at separation that then propagates inside the shear layer. As the Reynolds number increases to Re=8.45 x 10⁴, the region of high turbulence becomes stronger, more elongated and more defined in-side the shear layer. At the highest value of Reynolds number tested, Re=1.18 x 10⁵, the region of high turbulence becomes less narrow and propagates behind the cylin-der. The Reynolds shear stress contour plot at Re=5.08 x 10⁴ is almost zero in
all the regions analysed. As the Reynolds number increases, RSS increases with nega-tive values where the turbulent flow is created by the staggered concave fillet and moving to positive values behind the cylinder. This behaviour becomes accentuated for the highest Reynolds number tested, 1.18 x 10⁵. The result is that the staggered concave fillet creates a region of high turbulence after separation which propagates along the shear layer level further inside the wake, preventing the formation of inter-acting and strong vortices on both sides of the cylinder. As the velocity increases, the turbulence becomes stronger, stabilizing the flow from possible fluctuations.
4.7 Proper orthogonal decomposition (POD) analysis For each cylinder type, eigenvalues and eigenmodes are computed as explained in Section 4.3.4, and the instantaneous velocity fields are projected into POD basis. Fig-ure 4.9 shows the percentage of the total kinetic energy of velocity fluctuations in the plane associated with the POD mode. The plain surface sample contains more than 50% of the total kinetic energy in the first two modes, with a subsequent distribution
of energy of less than 3% for each of the higher modes. The HC filleted surface sam-ple shows the same energy distribution as described for the plain surface sample, but with less energy concentrated in the first two modes. The HSC filleted surface shows a more evenly distributed kinetic energy concentration in the higher modes. The high-er modes, representing turbulent structures of the unsteady flow, therefore play an im-portant role in the overall configuration of the flow. Nevertheless, after mode 4, all higher modes have contributions of less than 6% to the total kinetic energy and can therefore be neglected in any description of the dominant coherent structures in the flow. As a result, in all three cases presented, representation of just the first three modes carrying the highest kinetic energy is enough to describe the dominant struc-tures of the unsteady flow and its possible realization. Figures 4.9, 4.10, and 4.11, pre-sent velocity vector field plots of the mean flow field and of the first three modes for the three samples at the three different Reynolds numbers tested (Re = 5.08 x 10⁴,

106 Department of Civil Engineering, Technical University of Denmark
8.45 x 10⁴, 1.18 x 10⁵). To make it easier to compare the different modes, in-flow ve-locities, and samples tested, the same vector scaling has been used. Furthermore, for a given snapshot, the importance of the different modes can be expressed by the POD coefficients that are found by projecting the snapshot onto the POD modes as illus-trated by (X:X). The relationship between two modes can be shown as a scatter plot of the two coefficients found for all snapshots (Meyer et al. 2007). Figure 4.12 shows such scatter plots for the coefficients of the first two modes, a1 and a2, in the xy-plane for the three different samples tested at Re = 1.18 x 10⁵.
Figure 4.8 - Eigenvalue ratio for the first 10 modes for the three samples at three different Reynolds numbers: (a) Re=5.08 x 10⁴ (b) Re=8.45 x 10⁴ (c) Re=1.18 x 10⁵.
Plain surface cylinder
For the plain cylinder, a series of alternating clockwise and counter-clockwise vorti-ces develop in the cylinder wake. It is possible to identify the development of the vor-tices in the velocity vector field of mode 1 (Figure 4.9). The circular distribution of vectors develops and increases in radius along the centreline of the cylinder (y-axis), moving deeper inside the wake. Eddies are formed close to the rear of the cylinder, identified by the core of the first vector circular structure, due to a sudden burst to tur-bulence of the free shear layer near the side of the cylinder in the high subcritical re-

4.7 Proper orthogonal decomposition (POD) analysis
107
gime. The velocity vector fields of the first two modes are highly correlated. In par-ticular, mode 2 can be regarded as a streamwise shift of mode 1, with a phase differ-ence shift of the shedding circle, while maintaining the same dominant flow struc-tures. This particular behaviour is in agreement with previous studies on the wake of plain surface circular cylinders, e.g. Perrin et al. (2007), Gallardo et al. (2014). The strong connection between mode 1 and mode 2 is further represented by the POD co-efficients scatter plot, where most points are located around a circle with radius 1000 and centre at (a1,a2) = (0,0). The circular distribution of the (a1,a2) coefficients sug-gests a cyclic variation of POD modes 1 and 2, which is exactly what would be ex-pected if two POD modes describe different phases of a smooth process creating and convecting vortices (Meyer et al. 2007). Furthermore, more than 50% of the total ki-netic energy is contained in mode 1 (32%) and mode 2 (27%) taken together, which therefore represent the dominant coherent structures of the flow, identified as vortex shedding. Mode 3, on the other hand, presents a different distribution of the vector field from the first two modes.
It is possible to identify alternating positive and negative circular elongated areas symmetrical about the centreline of the cylinder with a significant drop in kinetic en-ergy, less than 3%, which is maintained for each of the higher modes (Figure 4.8). As with mode 3, the higher modes, which are not shown here, identify irregular small-scale turbulent flow structures carrying a low level of kinetic energy. In the case of the plain cylinder, therefore, turbulent non-coherent structures do not influence the development of the vortical structures for any given Reynolds number range. If we compare the same POD mode vector plots for the three different Reynolds numbers tested, the same structures and the same vortex formation length are shown, resulting in the same broad wake size and the same magnitude of the mean fields. The con-sistency of the dominant coherent structure and vortex formation length along the ve-locity range tested is in agreement with the quasi-invariable nature of the high subcrit-ical regime for a plain circular cylinder. This invariance contributes to the almost con-stant aerodynamic forces and Strouhal number in this regime (Zdravkovich, 1981).
Helically concave filleted surface cylinder
In general, the dominant coherent structures of the first three eigenmodes for the HC filleted surface cylinders are similar to those identified for the plain surface circular cylinder (Figure 4.10). This indicates that the overall structure of the flow is not great-ly affected by the presence of the helical concave fillets. Nevertheless, different angu-lar concave fillet positions should be tested and taken into consideration to better in-vestigate the overall influence of the fillet on the flow structure. However, variations in the POD mode vector plots can still be observed. In comparison to the plain surface cylinder, the first mode shows a shift deeper inside the wake of the core of the circular

108 Department of Civil Engineering, Technical University of Denmark
Figure 4.9 - Plain surface cylinder mean flow field and POD modes at three different Reyn-olds numbers: (a) Re=5.08 x 10⁴ (b) Re=8.45 x 10⁴ (c) Re=1.18 x 10⁵.

4.7 Proper orthogonal decomposition (POD) analysis
109
Figure 4.10 - HC filleted surface cylinder mean flow field and POD modes at three different Reynolds numbers: (a) Re=5.08 x 10⁴ (b) Re=8.45 x 10⁴ (c) Re=1.18 x 10⁵.

110 Department of Civil Engineering, Technical University of Denmark
Figure 4.11 - HSC filleted surface cylinder mean flow field and POD modes at three different Reynolds numbers: (a) Re=5.08 x 10⁴ (b) Re=8.45 x 10⁴ (c) Re=1.18 x 10⁵.

4.7 Proper orthogonal decomposition (POD) analysis
111
vector distribution, representing the formation of the first set of vortices. In particular, as the Reynolds number increases, the vortex formation length increases and the strength of the vortical structure decreases. This is clear if we look at the vector plots of the first mode for the three different Reynolds numbers tested. The core of the first circular vector distribution shifts deeper inside the wake and loses its shape. This is further confirmed by the loss of kinetic energy of the first mode, which decreases from 37% down to 24% for the higher Reynolds numbers tested.
The vortical structures observed in mode 2 are similar to mode 1, and represent as for the plain cylinder a streamwise shift of mode 1, with a phase difference shift of the shedding circle. Modes 1 and 2 therefore represent the dominant coherent structure of the flow, but the overall kinetic energy level of the vortex shedding contained in the first two modes is lower than for the plain cylinder. The loss in strength of the vortex shedding for the HC filleted surface cylinder confirmed by the POD coefficients scat-ter plot. As with the plain cylinder, most of the points are arranged around a circle with centre in (a1,a2) = (0,0), but the radius decreases down to 700. This may be due to the effect of the concave fillets on the flow regime, as they break the spanwise vor-tices and conduct the flow in the streamwise direction (Khashehchi et al., 2014). More powerful turbulent structures are shown in mode 3 than for the plain surface. Here a high turbulent region develops on one side of the cylinder, representing the turbulent vortical structure created by the presence of the concave fillets, which alter the inter-action between shear layers and the two-dimensional structure of the wake in the spanwise direction. The kinetic energy level remains lower than 5% and it is therefore not able to strongly affect the interaction between vortices. Nevertheless, compared to the plain surface cylinder, the HC filleted surface cylinder exhibits flow variations in the subcritical regime. The elongation of the vortex formation length as velocity in-creases results in a reduced influence of the vortices on the samples. This phenome-non can explain the smooth transition in the drag coefficient from the subcritical to the post-critical regime, an almost zero lift force, and an early suppression of vortex shedding. Furthermore, the elongated wake results in a higher drag force than for the plain cylinder, but avoids flow alterations that could affect the stability of the sample.
Helically staggered concave filleted surface cylinder
Unlike the plain and HC filleted surface cylinders, the structures of the flow behind the HSC filleted surface cylinder vary markedly from mode to mode, indicating that they are closely related with small-scale velocity fluctuations and the dynamics of the downstream flow field. This is immediately clear from the drop of kinetic energy con-tained in the first two modes compared to the plain surface. This energy is then dis-

112 Department of Civil Engineering, Technical University of Denmark
tributed in the higher modes (Figure 4.11). This implies a stronger role for small-scale flow fluctuations in the wake region with the HSC filleted surface cylinder. Figure
Figure 4.12 - Distribution of the first and second POD modes for the three samples at Re = 1.18x10⁵.
4.12 shows that there is a loss of circular pattern and most of the points are located in a concentrated region around the centre at (a1,a2) = (0,0). If we look at the POD modes vector fields, it is possible to clarify the development of the flow behind the cylinder fitted with helically staggered concave fillets. At Re=5.08x10⁴, mode 1 ex-hibits a negative vector field area developing on the rear side of the cylinder. This negative flow contains 19% of the total kinetic energy and helps narrow the overall wake. On the other hand, modes 2 and 3 show similar circular vortical structures to those identified in the first two modes with the plain cylinder, and they therefore rep-resent interaction between vortices. In contrast to the plain surface cylinder, the HSC filleted surface sample shows a clear drop of energy carried by the vortex shedding: 12% in mode 2 and 9% in mode 3. At Re=8.45x10⁴, the same structures are main-tained over the first three modes, but with an increase in kinetic energy in mode 1 of up to 22% and a weakening of the vortex shedding energy represented by the interac-tion of mode 2 (12%) and mode 3 (8%). The increase of energy in mode 1 is also rep-resented by the shift closer to the rear side of the cylinder of the opposite direction vector field in respect to the in-flow direction, which further helps narrow the near wake represented by the mean flow field (Figure 4.11). At Re=1.18x10⁵, the first POD is no longer symmetrical in the y-axis, but has a strong peak in magnitude in a region near x/D=-0.5. The second mode is almost a mirror image of mode 1 in the y-axis. It is also interesting to note that the mean field has become slightly asymmetrical in the y-axis. If we look at the distribution of the first and second reconstruction coefficient in Figure 4.13, we find an asymmetrical distribution with low variation for negative values of the coefficients and larger variation for positive values. In Figure 4.13, the reconstruction coefficients are plotted in time. The reconstruction coefficients some-times take almost exclusively positive or negative values for long periods of 10s of seconds. This indicates that the flow can have an asymmetrical separation for a sub-stantial time, and that this occurs in a random way. Some of the time, both modes are

4.8 Conclusions
113
equally active giving the same effect as the symmetrical first mode seen at the lower Reynolds numbers. The slightly asymmetrical mean field could be a result of too short a sampling time to statistically represent this phenomenon. Another explanation could be that the staggered pattern is more exposed to the flow on one side of the cylinder causing a bias in direction of flow separation. For Re=1.18x10^5, modes 3 and 4 (not shown) represent large vortices indicating that vortex shedding is still occurring, but that it is starting at a greater distance from the cylinder and with decreased energy. It is therefore possible to conclude that the helical staggered concave fillet creates a re-gion of high turbulence, represented by the first two modes, which contribute to the narrowing of the wake and the subsequent lower drag that characterize this innova-tion. Furthermore, the weakening of the vortex shedding and turbulent disturbance creates a more stable wake, which is less prone to induce flow instabilities around the HSC filleted sample. This results in the smooth transition of the drag force from the subcritical to post-critical regime, an almost zero lift coefficient, and an early suppres-sion of vortex shedding.
Figure 4.13 - Reconstruction coefficients for the first two modes at Re=1.18x10⁵ for the HSC filleted surface cylinder.
4.8 Conclusions The critical effects of concave protruding fillets fitted on a circular cylinder in uni-form cross flow have been explored based on an investigation of the flow dynamics and wake structures induced by a same-size plain surface circular cylinder. Two fillet configurations were tested. In the first model, the helically concave (HC) filleted sur-face, the fillets have an h/D = 0.027, replicating the usual arrangement of current stay cables with helical fillets. In the second model, the helically staggered concave (HSC) filleted surface, the fillets have an h/D=0.043 and are arranged laterally in a staggered

114 Department of Civil Engineering, Technical University of Denmark
helical pattern. To make it possible to analyse the wake instabilities, a flow visualiza-tion experiment was carried out using particle image velocimetry (PIV). Tests were performed in the subcritical Reynolds number range (20–40k < Re < 300–400k) for three different wind speed velocities up to a high subcritical Reynolds number. The research showed that the helical concave protrusion induces different effects on the shear layer and on the overall near-wake characteristics from a plain surface cylinder. Distinct flow variations were identified in the effects induced by the presence of con-cave fillets in the HC and HSC filleted circular cylinders. The results for the HC fil-leted surface show similar dominant and coherent structures created in the wake com-pared to those of the plain circular cylinder. Nevertheless, the size and strength of the flow structures differ due to the presence of the helical concave fillet. A statistical comparison between flow structures shows that the HC filleted cylinder has a narrow-er wake, with an increased recirculating zone, and a subsequent increased vortex for-mation length in the streamwise direction. These differences are followed up by a de-cay of concentration and lower peak magnitude in both turbulent kinetic energy and Reynolds shear stress, which indicate a weaker interaction between shear layers. Fur-thermore, the POD analysis makes it possible to identify the same dominant coherent structure and vortex shedding in the first two modes with less energy than with the plain surface. As a result, it is possible to conclude that the HC filleted surface creates a more stable near-wake region than a plain surface, which results in a weaker interac-tion and early suppression of vortex shedding, a smooth transition of drag force in the critical regime, and a constant zero lift force.
The HSC filleted cylinder exhibits a similar size of recirculating zone to that of the plain cylinder. This indicates low drag force. Yet it creates very different dominant and coherent structures in the wake. Statistical comparison between flow structures shows a weaker concentration and lower magnitude of peak TKE, with the presence of two distinct symmetrical regions about the centreline of the circular cylinder. Fur-thermore, the HSC filleted surface shows a reduction in the magnitude of RSS of more than 50%. POD analysis shows that the structures of the flow behind the HSC filleted surface cylinder, unlike those of the plain cylinder, vary markedly from mode to mode and that the energy is distributed to higher modes, indicating that the varia-tions are closely related to small-scale velocity fluctuations and the dynamics of the downstream flow field. So it seems that the staggered helically concave fillets create high turbulence at separation, weakening any further development of large-scale vor-tices inside the wake. This confirms that the presence of the staggered concave fillet is able to control the flow and prevent the interaction between shear layers that might create vortices, which results in a strong reduction in vortex shedding and a more sta-ble near-wake turbulent region. This can be viewed as a reason for the reduction in

4.8 Conclusions
115
drag force acting on the cylinder, the suppression of vortex shedding, and the smooth transition from the subcritical to the critical regime.

116 Department of Civil Engineering, Technical University of Denmark
Chapter 5
5 Flow structures and wake development behind a cylinder with surface concave fillets in cross flow – 3D The results presented in this chapter are based on the paper: Flow structures and wake development behind a cylinder with surface concave fillets in cross flow – 3D. Burlina, C., Meyer, K.E., Georgakis, C.T., Submitted to the Journal of Experimental Thermal and Fluid Science, April 2018.
Abstract Surface modification is one of the most effective ways of manipulating the flow past a circular cylinder. Depending on the physical application, creating various structures and mechanisms in the cylinder wake can be a target for drag reduction. In particular, the objective of the present study was to explore the development of structures and mechanisms in the near wake of bridge cable profiles fitted with concave fillets in two different configurations. Following the introduction to the work presented in Section 4.1, stereo particle image velocimetry (SPIV) was used to investigate the near-wake region of a plain cylinder, a helically concave (HC) filleted surface cylinder, and a helically staggered concave (HSC) filleted surface cylinder (Section 4.2). The purpose

5.1 Experimental details
117
of this analysis was to investigate the flow characteristics for these three cases. The experiments were carried out at a Reynolds number of 5.08 x 10⁴ for three different positions inside the near wake. Three dimensional results of the portion investigated reveal important aspects of the local flow features of the plain and concave filleted surface cylinders. These include boundary layer development over the surface, three-dimensional structures created at the separation point, and evolution inside the wake, which results in different near wake structures for the different samples. The applica-tion of Proper Orthogonal Decomposition (POD) (Section 4.3) to the PIV velocity fields of the three cylinder types is also discussed. The POD computed for the velocity fields measured for all three cases shows that the first two modes contain most of the kinetic energy of the flow, irrespective of the cylinder type. These two modes are also responsible for the large-scale coherent structure dominating the flow. For the three cylinder types, the first three eigenmodes of the flow field for the three different posi-tions tested were calculated and their structures analysed in detail. Furthermore, Reynolds shear stresses and turbulent kinetic energy were calculated to complement the selection and validation of the turbulence models.
5.1 Experimental details
5.1.1 Flow configuration
The experimental investigations were performed in the closed-loop wind tunnel in the Department of Mechanical Engineering at the Technical University of Denmark. The wind tunnel has an upstream contraction area ratio of 12.94:1 and a test chamber cross-section of 300x300mm. The test section has optical access through windows in the side and top walls. The sample was placed vertically along the centreline of the wind tunnel cross section. The coordinate system is defined in Figure 5.1: z is the cross-flow direction, x is the horizontal out-of-plane direction and y is the vertical out-of-plane direction, with the origin in the centre of the sample. The tests were per-formed at a temperature around 20°C. Wind velocities of up to approx. 60m/s can be generated with a turbulence intensity of less than 1% in normal conditions. The tem-perature, ambient pressure, and wind velocity was calculated by monitoring the pres-sure difference of the section using a Debro micromanometer and using the Bernoulli equation and the law of mass conservation.
The experiments were conducted at a free-stream velocity (cross-flow velocity) of U¥ = 15 + 0.4 m/s, taking into account the error margins of the indirect measurements. The Reynolds number based on the sample diameter D and free-stream velocity U¥ was Re = 5.08x 10⁴. In the case of a plain smooth cylinder, the calculated Reynolds number falls under the subcritical flow regime, where the cylinder is characterized by

118 Department of Civil Engineering, Technical University of Denmark
a turbulent wake despite a laminar boundary layer separation. The characteristic re-gion of the near wake in this particular case is therefore approximately 1.5D (Zdravkovich, 1981). The length of the models was L = 300mm with a diameter of D = 53.3mm resulting in an aspect ratio of 1:5.7 for the wind tunnel test cross-section. The resulting blockage ratio (BR) for the cable model was 17%. The effect of this size of blockage ratio in terms of critical Reynolds number, vortex shedding, and wake development has previously been studied by Patil et al. (2008). That study showed that the critical Reynolds number gets delayed and the steady wake bubble is reduced with BR values of up to 40%. This is due to the effect of the walls, which act as a damper for the instabilities and impart stability to the flow without altering flow struc-tures. This yields a drag coefficient higher than in a non-confined case, but for the purpose of this study it seemed reasonable to assume that the characteristics and de-velopment of the flow and wake behind the three samples was not altered in terms of dominant structures and that comparison between the samples is possible.
Figure 5.1 – Stereoscopic particle image velocimetry (SPIV) set-up.
5.1.2 Stereo Particle image velocimetry (SPIV) set-up
Stereoscopic PIV (SPIV) was employed to measure all three components (3C) of the velocity in the plane of the light sheet. SPIV makes use of two cameras that look at the light sheet from two different angles. Since each camera measures the particle dis-placement perpendicular to its viewing direction, the two cameras measure different projections of the velocity. At every measurement point in the plane of the light sheet

5.1 Experimental details
119
Figure 5.2 – Schematics showing the three-dimensional field of observation
two different projections of the velocity are obtained, one from each camera, and in principle the complete velocity vector can be reconstructed. The angular Scheimpflug configuration was employed (Figure 5.1) to obtain good focus in the entire image plane, but the magnification was not uniform. The procedure employed is the same as in Cid et al. (2002). The reconstruction of the three components was done in the ob-ject plane, using the equations
𝑑𝑥 = ���V�k������V�k��V�k���V�k��
(5.1)
𝑑𝑦 = �������G
+�������G
. V�k���V�k��V�k���V�k��
(5.2)
𝑑𝑧 = �������V�k���V�k��
(5.3)
where dXA, dYA, dXB, dYB, are the particle displacements recorded on each camera and projected in the object plane.
The SPIV system was provided by Dantec Dynamics and consists of two Dantec Hisense II cameras (resolution 1344x1024) with 60mm focal length Nikkor lenses. The angle between the cameras was approximately 80° and the recording F-number was 11. The laser used was a Nd:YAG laser with a wavelength of 532nm, a pulse en-ergy of up to 200mJ, and a sheet thickness of 3mm. The flow was seeded with 2µm glycerol droplets with a concentration corresponding to more than 10 particles images per interrogation window. Dantec Dynamics Studio version 2015a was used for data processing.
A double-sided calibration target was aligned with the laser sheet plane and five planes were recorded to calibrate the camera pinhole model. “Calibration refinement” was used to correct the calibration for a small misalignment between the laser sheet and the calibration target. The measurements were taken in three different positions of the characteristic region of the near wake from the centre of the cylinder: at z/D=0.59 (Position 1), at z/D= 0.97 (Position 2), and at z/D= 1.34 (Position 3) (Figure 5.2).

120 Department of Civil Engineering, Technical University of Denmark
The images were processed using a multipass window deformation cross-correlation technique (adaptive PIV) with a resolution of 32 x 32 pixels per interrogation area, which results in an approximate resolution of 2.64x3.03mm2. Considering the image area and size of the CCD, a magnification factor of M0 = 0.078 was achieved with a viewing area of 11x97mm2. Image maps were recorded with an acquisition rate of 1 Hz, which ensured the statistical independence of samples. Time between pulses was set to 24µs, based on a target free-stream flow velocity of U¥ = 15ms, and a total of 1000 pictures were recorded to guarantee statistical independence.
5.1.3 Measurement accuracy
The first source of possible error is connected with the computation of the 2C-displacement-vectors by means of the PIV interrogation. The usual errors found in standard 2C-PIV also apply here: correlation-noise, bias, and peak locking. Correla-tion-noise is generally the main error source in standard 2C-PIV measurements. When sufficient particle pairs are present in the interrogation area (NI x Fo > 7) and the ve-locity gradients are not too large (MoçDUçDt/di < 0.5), the RMS of the particle image displacements measured is about 0.1px (scorr ≈ 0.1 px). This is therefore the uncertain-ty in each component of the 2C-vectors from which the 3C-vectors will be calculated later. Moreover, peak-locking is generally rather small when dt > 2 dpixel.
In this study, the resulting air disc diameter (particle size on the CCD) was:
𝑑V = 𝑀PG +𝑑CG +𝑑�G (5.4)
where dp is the particle size and ds is the diffraction limited spot diameter:
𝑑� = 2.44(1 +𝑀P)𝑓#𝜆 (5.6)
where f# is the focal number and l is the wavelength.
Based on the above equations, dt = 15.4µm. If we compare this with the pixel pitch dpixel = 6.7µm, the Nyquist criterion is satisfied. Next, the 2C-vector fields were de-warped, i.e. mapped from the image plane to the measurement plane. Errors in the mapping function can lead to a mismatch of the two de-warped vector fields. This means that velocity information from different regions in the illuminated plane will be combined, which leads to further errors in the 3C-vectors. The 3C-vectors are calcu-lated with the help of recombination equations, and the error in the 3C-vectors de-pends on the uncertainties in all the parameters. These include not only errors in the 2C-vectors, but also errors in all the proportionality constants which are derived from the 3D-calibration.

5.2 Wake topology and mean flow fields
121
In addition to the uncertainty in the velocity, the overall performance of a PIV system is also determined by the signal-to-noise ratio (S/N), by the fraction of spurious vec-tors, and by the spatial and temporal resolutions of the measurements. In this regard, the time between pulses, which was set to 24µs based on a target free-stream flow ve-locity of U¥ = 15ms, satisfies the condition of keeping the in-plane displacement at DX < 0.25DI, where DI is the length of the interrogation area, and the out-of-plane displacement at Dz < 0.25DZ, where DZ is the laser sheet thickness.
All the quality measures, which together define the performance of the PIV system, are listed in Table 4.1 together with some values usually found in the literature.
5.2 Wake topology and mean flow fields A first impression of the flow and wake structures developed behind the samples was given by the mean velocity fields. The mean velocity fields of the portions of the flow investigated in this study are plotted in Figure 5.3, which illustrates the three-dimensional character of the flow developed behind the three samples investigated. The data are plotted with the in-plane velocity components represented as velocity vectors and the out-of-plane velocity component represented as a contour plot in col-our scale. Coordinates were normalized with the cylinder sample diameter D, while the out-of-plane velocity component was normalized with the free-stream velocity U∞. For ease of comparison between the different plane positions and different cylinder samples, the same scaling of velocity vectors and the same intervals between contour levels have been adopted in the plots. The thin region at the top and bottom with zero velocity in the out-of-plane direction on each plot represents a region with no data due to the perspective effect in the camera views. Lighter contours indicate positive in-flow velocity values and represent a section of the spanwise region of displaced and accelerated flow (boundary layer) developed on the side of the cylinder. This can also be seen in the uniform nature of the flow and similar magnitude of the velocity vec-tors in this region. The extent of the displaced region is strongly affected by being in the vicinity of the confining walls of the wind tunnel, an influence defined as the blockage effect (=17%) (Zdravkovich, 1981). Darker contours mark negative in-flow velocity values and represent a spanwise section of the large recirculating zone devel-oped in the near wake behind the samples. The different flow structures and wake re-circulating regions are also identified in the vector map representing the in-plane components. Taking into consideration the Reynolds number (Re = 5.08x 10⁴), the contour plots represent the flow behind a circular cylinder in the Shear Layer Transi-tion Regime: burst to turbulence TrSL3 (20–40k < Re < 300–400k for a plane circu-lar cylinder). In this range, the boundary layer over the plain cylinder surface is lami-

122 Department of Civil Engineering, Technical University of Denmark
nar and the wake becomes increasingly turbulent, with increased Reynolds numbers. A sudden burst to turbulence occurs in the free shear layer near the side of the cylin-der, and eddies form close to the rear of the cylinder (Zdravkovich, 1981). According to Williamson (1996), the Kelvin-Helmholtz instability of the shear layer is two-dimensional, whereas three-dimensional structures on the scale of both shear layer (small-scale) and von Karman (large-scale) vortices develop in this regime. The above described flow characteristics are valid in the case of plain surface circular cylinders, but in the case of the modified surfaces tested here, these mechanisms are disrupted by the presence of the concave fillet, which creates alteration in the topology of the shear layer, vortex formation, and wake size.
For the plain cylinder, a uniform transition from negative to positive velocity values is found along the height of the cylinder (y-direction), which is maintained for the three positions tested. The change of sign of the mean streamwise component of velocity along the rear axis defines the dimensionless recirculating zone. Values between 1.1 and 1.4 have been found along the recirculating zone by several authors (Cantwell and Coles, 1983; Djeridi et al., 2003, Perrin et al., 2008) in the same Re number range. The three positions (Position 1 (z/D=0.59), Position 2 (z/D=0.97), and Position 3 (z/D=1.34)) therefore show a portion of the shear layer and identify the development of primary vortices and the two-dimensional nature of the flow in this section of the near-wake. Furthermore, as we move further inside the wake (from Position 1 to Posi-tion 3), a change of orientation is seen in the vector field in the positive in-flow por-tion of the flow, which bends towards the centreline of the rear axis of the wake be-hind the cylinder. This process, depicted in Figure 5.3, shows the rolling-up of the shear layer detached from the surface of the plain cylinder to form primary vortices (Gallardo et al., 2014).
The HC filleted surface cylinder, on the other hand, shows an alteration in the shear layer topology along the height of the sample (y-direction), where the separation point is altered by the presence of the concave fillet (y/D between 2.4 and 2.8). The altera-tion represents a three-dimensional vortical structure developing in both the stream-wise (out-of-plane) direction and the spanwise (in-plane) direction, which is main-tained for all three positions tested. Periodic geometric changes in the spanwise direc-tion near the separation point can disrupt the two-dimensional shear layer by trigger-ing a three-dimensional flow instability, which initiates periodic vortex dislocations in the wake (Naumann and Quadflieg, 1974). As with the plain cylinder, the contour plots for the HC filleted surface represent the recirculating zone and the development of primary vortices. But in contrast to the plain cylinder, the HC filleted surface shows a delay in the change of orientation of vector fields in the positive in-flow por-tion of the flow, which appears in Position 3. This process shows that the presence of
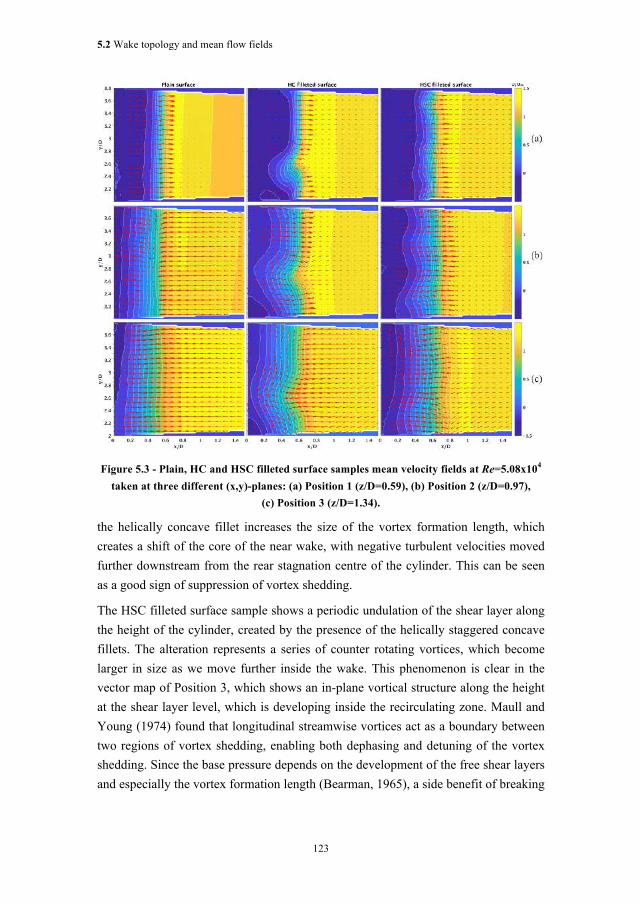
5.2 Wake topology and mean flow fields
123
Figure 5.3 - Plain, HC and HSC filleted surface samples mean velocity fields at Re=5.08x10⁴ taken at three different (x,y)-planes: (a) Position 1 (z/D=0.59), (b) Position 2 (z/D=0.97),
(c) Position 3 (z/D=1.34).
the helically concave fillet increases the size of the vortex formation length, which creates a shift of the core of the near wake, with negative turbulent velocities moved further downstream from the rear stagnation centre of the cylinder. This can be seen as a good sign of suppression of vortex shedding.
The HSC filleted surface sample shows a periodic undulation of the shear layer along the height of the cylinder, created by the presence of the helically staggered concave fillets. The alteration represents a series of counter rotating vortices, which become larger in size as we move further inside the wake. This phenomenon is clear in the vector map of Position 3, which shows an in-plane vortical structure along the height at the shear layer level, which is developing inside the recirculating zone. Maull and Young (1974) found that longitudinal streamwise vortices act as a boundary between two regions of vortex shedding, enabling both dephasing and detuning of the vortex shedding. Since the base pressure depends on the development of the free shear layers and especially the vortex formation length (Bearman, 1965), a side benefit of breaking

124 Department of Civil Engineering, Technical University of Denmark
the nominally two-dimensional nature of the wake structures with vortex dislocations is an increased base pressure, which is also a mechanism for base drag reduction.
5.3 Turbulent kinetic energy (TKE) mean flow fields The turbulent kinetic energy (TKE) corresponding to vortex dynamics is one of the most important variables for characterizing the degree of turbulence mixing and for assessing the effect of control techniques (Liu et al., 2016).The TKE was calculated in
normalized form as TKE=0.5 𝑢´G +𝑣´G +𝑤´G /𝑈�G where u´ is the in-plane velocity fluctuation in the on the x-axis, v´ is the in-plane velocity fluctuation on the y-axis, and w´ is the crosswise velocity fluctuation on the z-axis. The normalized TKE con-tours for the three samples at the three different positions inside the wake tested are shown in Figure 5.4. For ease of comparison between the different samples and inflow positions, the same scaling of velocity vectors and the same intervals between contour levels have been adopted in the plots. The plain surface cylinder in Position 1 shows TKE contours with a uniformly high concentrated zone at the level of the shear layer along the height of the cylinder (y-direction), which increases as we move towards the centreline of the cylinder inside the wake, reaching a maximum value of 0.16. As we move to Position 2, the TKE distribution shows a higher peak of 0.4 and the energy is spread inside the boundary layer (x/D=1). This behaviour is accentuated in Position 3, where the energy peak reaches a value of 0.5, and the energy moves further into the wake boundary layer at a x/D=1.3. The increase in uniform distribution along the x-axis of the TKE energy peak and the distribution in the wake boundary layer as we move inside the wake in the inflow direction can be identified as indicating a high de-gree of velocity fluctuation generated by large-scale vortex shedding (Liu et al. 2016).
In contrast to the plain surface cylinder, the HC filleted surface cylinder shows an in-terruption in the uniform distribution of the TKE in Position 1, where the separation point is altered by the presence of the concave fillet (y/D between 2.4 and 2.8). The alteration is maintained for the three positions tested, but with a loss of shape and a more uniform distribution inside the wake boundary layer. Nevertheless, compared to the plain surface cylinder, the HC filleted surface shows a decrease in magnitude of turbulent kinetic energy down to a peak value of 0.24. Moreover, the distribution of TKE inside the boundary layer is more contained than with the plain cylinder, up to a maximum distance of x/D=0.9. The weakening of TKE contours shows that the HC cylinder is influenced by the undulating forces induced by the presence of the concave fillets along the height of the cylinder. This can be seen as a solution for controlling the flow over the circular cylinder and can be correlated to the smooth transition over drag force in the critical regime (Burlina et al., 2016).
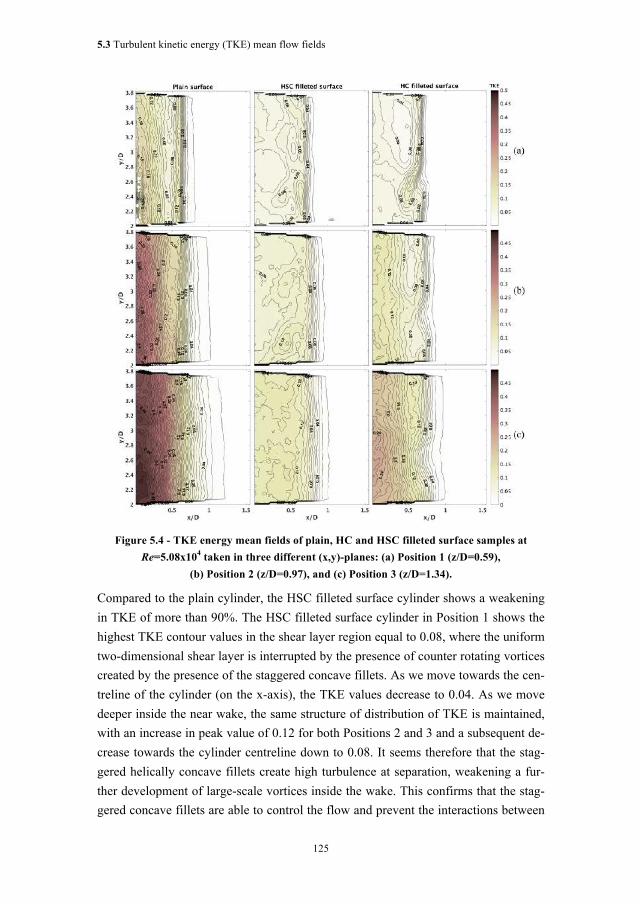
5.3 Turbulent kinetic energy (TKE) mean flow fields
125
Figure 5.4 - TKE energy mean fields of plain, HC and HSC filleted surface samples at Re=5.08x10⁴ taken in three different (x,y)-planes: (a) Position 1 (z/D=0.59),
(b) Position 2 (z/D=0.97), and (c) Position 3 (z/D=1.34).
Compared to the plain cylinder, the HSC filleted surface cylinder shows a weakening in TKE of more than 90%. The HSC filleted surface cylinder in Position 1 shows the highest TKE contour values in the shear layer region equal to 0.08, where the uniform two-dimensional shear layer is interrupted by the presence of counter rotating vortices created by the presence of the staggered concave fillets. As we move towards the cen-treline of the cylinder (on the x-axis), the TKE values decrease to 0.04. As we move deeper inside the near wake, the same structure of distribution of TKE is maintained, with an increase in peak value of 0.12 for both Positions 2 and 3 and a subsequent de-crease towards the cylinder centreline down to 0.08. It seems therefore that the stag-gered helically concave fillets create high turbulence at separation, weakening a fur-ther development of large-scale vortices inside the wake. This confirms that the stag-gered concave fillets are able to control the flow and prevent the interactions between

126 Department of Civil Engineering, Technical University of Denmark
shear layers that create vortices. Furthermore, the distribution of TKE inside the boundary layer is more contained than with the plain cylinder, up to a maximum dis-tance of x/D=0.9, as with the HC filleted surface.
5.4 Proper orthogonal decomposition (POD) analysis For each cylinder type, eigenvalues and eigenmodes are computed as explained in Section 4.3 and the instantaneous velocity field are projected into POD basis. Table 1 shows the accumulated contribution to the turbulent kinetic energy for the different samples for the different (x,y)-planes tested. The first two modes capture between 25% and 55% of the kinetic energy in the flow field at different depths inside the wake for the three samples, so they are substantially more energetic than the higher order modes in the unsteady flow. For the plain surface cylinder, vortex shedding is sufficiently strong to account for more than 40% of the kinetic energy in all three depths tested, whereas for the HC and HSC filleted surface samples, the contribution of kinetic energy to the rolling-up of primary vortices decreases, leading to a less or-ganized near wake. The energy captured by the first 20 modes varies between 60% and 80% for the different depths inside the wake for the three samples. This shows that the difference in energy captured at different depths is reduced by incorporating more modes (Gallardo et al., 2014). To capture 90% of the turbulent kinetic energy in these (x,y)-planes, between 65 and 201 modes are required, and to account for 99% of the turbulent kinetic energy, the number of modes required increases to 811. The large gap between the first modes and the remaining modes, and the large number of higher modes required to cover the same kinetic energy carried in the first two modes, indi-cates that the structure of the flow is relatively simple, with a dynamic evolution gov-erned by the interaction of the large-scale motions present in the flow. So to simplify conclusions, representations for just the first three eigenmodes, which carry the high-est kinetic energy and probable realization of the flow, are presented here.
Contour plots of the first three modes corresponding to the streamwise velocity fluc-tuation w´, for the three different near-wake depths (Position 1 (z/D=0.59), Position 2 (z/D=0.97), Position 3 (z/D=1.34)), and for the three different samples are presented respectively in Figures 5.5, 5.6 and 5.7. To ease comparison between different modes and different cylinder cases, the same intervals between contour levels (0.001U¥) and the same extreme values (-0.05/0.05U¥) have been used for the POD-mode plots for the fluctuating velocity component w´. Blue contours indicate negative values and red contours indicate positive values. The dominant POD modes, which represent the large-scale turbulent structures embedded in the flow field, are those with the highest kinetic energy. So, the first mode in each case represents the most energetic and prob-able realization of the flow, which shows similarities with the mean velocity field

5.4 Proper orthogonal decomposition (POD) analysis
127
(Khashehchi et al. 2014). Furthermore, the temporal evolution and importance of the various modes can be further expressed by the POD coefficients that are found by projecting the snapshots onto the POD modes as previously illustrated in Section 4.3. The relationship between two modes can be shown as a scatter plot of the two coeffi-cients found for all the snapshots, and this plot can be used to identify periodic struc-tures in the flow such as vortex shedding. To simplify conclusions, results are pre-sented for POD coefficients where it was possible to identify periodicity in the inter-action between lower modes (the high energy content modes). In particular, a circular distribution of the POD coefficients (ai, aj) suggests a cyclic variation of POD modes i and j, which is exactly what would be expected if two modes describe different phases of a smooth process of creating and convecting vortices. On the other hand, random variations from a simple circle account for the influence of turbulence in terms of both local velocity fluctuations and irregularities in the creation of vortices in the wake (Meyer 2007).
𝜆l + 𝜆G % 𝜆k(%)GI
k|l
𝑁�I% 𝑁��%
Plain surface Position 1 43% 68% 170 800
Position 2 49% 75% 97 588
Position 3 54% 80% 65 468
HC filleted surface
Position 1 24% 54% 287 811
Position 2 36% 63% 181 723
Position 3 46% 71% 127 643
HSC filleted surface
Position 1 30% 63% 201 761
Position 2 31% 64% 181 711
Position 3 25% 62% 173 699
Table 5.1 – Energy distribution
Plain surface cylinder
The contour plots for the plain surface cylinder (Figure 5.5) at z/D=0.59 for mode 1 presents a uniform area of high kinetic energy at the level of the shear layer, resem-bling the shape of the mean velocity field (Figure 5.3). Mode 2 maintains the same structure as mode 1. This phenomenon can identify the interaction between the two modes and in particular the process of creating and convecting vortices (vortex shed-ding), which represents the dominant coherent structure maintained along the height

128 Department of Civil Engineering, Technical University of Denmark
Figure 5.5 - Visualization of the first three eigenmodes in three different (x,y)-planes: Posi-tion 1 (z/D=0.59), Position 2 (z/D=0.97), Position 3 (z/D=1.34)) for the plain surface cylinder. The percentage in the corner represents the energy level of each mode. Plots have intervals
between contour levels of 0.001U¥ and the extreme values between -0.05/0.05U¥.

5.4 Proper orthogonal decomposition (POD) analysis
129
Figure 5.6 - Visualization of the first three eigenmodes in three different (x,y)-planes: Posi-tion 1 (z/D=0.59), Position 2 (z/D=0.97), Position 3 (z/D=1.34)) for the HC filleted surface cyl-inder. The percentage in the corner represents the energy level of each mode. Plots have in-
tervals between contour levels of 0.001U¥ and the extreme values between -0.05/0.05U¥.

130 Department of Civil Engineering, Technical University of Denmark
Figure 5.7 - Visualization of the first three eigenmodes in three different (x,y)-planes: Posi-tion 1 (z/D=0.59), Position 2 (z/D=0.97), Position 3 (z/D=1.34)) for the HSC filleted surface
cylinder. The percentage in the corner represents the energy level of each mode. Plots have intervals between contour levels of 0.001U¥ and the extreme values between -0.05/0.05U¥.
5.4 Proper orthogonal decomposition (POD) analysis
131
of the cylinder. The strong connection between the first two modes is further shown by the scatter plot of the POD coefficients (Figure 5.8), where most points are located around an ellipse with a major radius of 700 and a minor radius of 300 with a centre at (a1,a2) = (0,0), identifying vortex shedding. The variation in the distribution from that of a perfectly circular cylinder is due to the concentration of energy being higher in mode 1 (31%) than in mode 2 (11%) (Figure 5.5), and also due to a dissipation of ki-netic energy along the boundary layer of mode 1 that is stronger than in mode 2. This distribution of energy along the boundary layer can also be seen in the TKE contour plots presented in Figure 5.4 for the plain surface cylinder. The structure of mode 3, on the other hand, exhibits a marked variation from the uniform distribution along the shear layer presented in modes 1 and 2. Mode 3 counter plots present two positive and negative areas, identifying small-scale turbulence which propagates in the in-flow di-rection, creating a sinusoidal alteration of the mean shear layer further inside the wake. The same small-scale turbulent structures are maintained in higher modes, though not shown here. The small level of kinetic energy contained in the higher modes (Table1) show that small-scale turbulent structures do not disturb the creation of vortex shedding. The same structures described for the three modes are maintained in the other two positions tested. Nevertheless, it can be seen that the shape of the structure is stretched in both directions: inside the near-wake and the boundary layer. The concentration of kinetic energy carried by the first two modes also increases to 49% for Position 2 and to 54% for Position 3. This is consistent with the identification of the end of the vortex formation length and subsequent rolling up of the shear layer for the formation of the primary vortices.
Helically concave filleted surface cylinder
The dominant coherent structures of the first three eigenmodes of the HC filleted sur-face cylinder are generally quite similar to those of the plain cylinder (Figure 5.6). This indicates that the overall structure of the flow is not greatly affected by the pres-ence of the helical concave fillets. Nevertheless, significant changes in the POD mode contour plots and in the kinetic energy distribution can be identified. In mode 1 at Po-sition 1 (z/D=0.59), the uniform shear layer presented in mode 1 for the plain cylinder is disrupted by the presence of the concave fillets at the flow separation point (y/D between 2.4 and 2.8). Furthermore, the level of energy for the first mode drops down to 13% compared to the 31% kinetic energy with the plain cylinder. Mode 2 shows a three-dimensional turbulent structure comprising a large vortex in the in-flow direc-tion. This structure is represented by two circular kinetic energy fields in the contour map, and by streamwise vortices in the (x,y)-plane. Mode 3 shows the same flow structure as mode 1, but with a lower kinetic energy level (6%) (Figure 5.6). So we see that the structures present in modes 1 and 3, just like modes 1 and 2 for the plain

132 Department of Civil Engineering, Technical University of Denmark
cylinder, identify the interaction between the two modes and in particular the process of creating and convecting vortices (vortex shedding). In this case, the vortex shed-ding is disturbed by the higher energy in mode 2 (10%), which reduces the interaction between modes 1 and 3. The loss in strength of the vortex shedding is further shown by the loss in kinetic energy contained in the first modes compared to the plain sur-face cylinder. This interference suppresses the creation of larger spanwise vortices (vortex shedding); with a subsequent reduction in momentum transfer through the central region of the wake. This creates a longer recirculating zone behind the HC cyl-inder and an increased vortex formation length. Moving to Position 2, the same struc-ture is maintained in mode 1, but the streamwise vortical structure characterizing mode 2 in Position 1, is now shifted to mode 3 in Position 2, showing a loss of kinetic energy. As a result, Position 2 shows a similar interaction of shear layer to that of the plain cylinder, where the vortex shedding mechanism is no longer disturbed by the presence of the three-dimensional vortical structure. The only disturbance in the pro-cess of creating and convecting vortices is now given by the interruption of the uni-form shear layer induced by the presence of the concave fillets. This interruption cre-ates a dislocation of vortices along the spanwise direction.
The same behaviour as Position 2 is maintained over Position 3, showing the same changes presented for the plain surface cylinder, but with a loss of kinetic energy (Ta-ble1). The loss of kinetic energy compared to the plain cylinder is also shown by the POD coefficient scatter plot (Figure 5.9), where most points are located around a cir-cle with a small radius of 400 and centre at (a1,a2) = (0,0). The small radius can be further associated with the reduced energy in the lower modes and the higher disturb-ance of turbulence created by the higher modes in the development of the vortex shedding.
Helically staggered concave filleted surface cylinder
In contrast to the plain cylinder and the HC filleted surface cylinder, the structures of the flow behind the HSC filleted surface cylinder vary markedly between the different modes and from the uniform shear layer behaviour that characterized the previous samples. This indicates that small-scale velocity fluctuations, small scale turbulent structures, and the dynamics of the downstream flow field are more closely related and define the structure of the wake. As illustrated in Table 1, more energy is con-tained in the higher modes than for the plain cylinder. This implies a stronger role for small scale-fluctuations in the region behind the HSC filleted surface cylinder. In Po-sition 1 (Figure 5.7), mode 1 shows the same structure presented by the plain cylinder in mode 3, where the uniform shear layer is replaced by small-scale turbulent struc-tures propagating into the flow, represented by the positive and negative circular areas in the counter plots. In particular, the negative region represents an area of delayed

5.5 Reynolds shear stress (RSS) mean flow fields
133
Figure 5.8 - Distribution of the first and second POD modes for the three samples at Position 3 (z/D=1.34).
turbulent separation and lower in-flow velocity created by the presence of the helical-ly staggered concave fillets. The positive region represents an area of turbulent flow and faster in-flow velocity, due to the lack of disturbance from the helically staggered concave fillets at separation. This phenomenon induces a sinusoidal shape of the flow in the streamwise direction, further disturbed by three-dimensional turbulent vortical structures. Modes 2 and 3 show similar structures but with dislocated structures along the height of the cylinder compared to mode 1. The same structures are maintained for both Positions 2 and 3, but with a stretched shape in both directions: inside the near wake and along the boundary layer. The combined effect of the three-dimensional vortical turbulent shear layer and its dislocation distributed along the different modes provokes strong fluctuations in the shear layer, which prevents the formation of vortex shedding and stabilizes the wake, avoiding sudden drops in drag force when entering the critical regime. All this is confirmed by the loss of kinetic energy as we move deeper into the wake (Table1), whereas the plain surface cylinder exhibits an increase in kinetic energy as we move deeper into the wake. The loss of kinetic energy sym-bolizes a strengthening of the vortex formation length and rolling up of vortices. The disruption of vortex shedding and loss of kinetic energy compared to the plain cylin-der is also shown by the POD coefficient scatter plot (Figure 5.8), where most points are located around a concentrated circle with centre at (a1,a2) = (0,0).
5.5 Reynolds shear stress (RSS) mean flow fields The normalized Reynolds shear stress (RSS) correlations 𝑢´𝑤´ /𝑈�G and 𝑣´𝑤´ /𝑈�G corresponding to the momentum transfer are presented in Figure 5.9 and Figure 5.10. Results for 𝑢´𝑣´ /𝑈�G exhibit an absence of any significant level of stress and are therefore not presented here. Knowledge of the influence of the curvature on Reyn-olds stresses may complement the validation of flow characterization. The Reynolds shear stresses provide a measure of the transfer of orthogonal momentum between adjacent layers of flow and therefore give an indication of where the flow is most tur

134 Department of Civil Engineering, Technical University of Denmark
Figure 5.9 - Contour plots of shear stresses 𝒖′𝒘′/𝑼�𝟐 plotted taken at three different (x,y)-planes: (a) Position 1 (z/D=0.59), (b) Position 2 (z/D=0.97), (c) Position 3 (z/D=1.34) for the
three different samples tested.
bulent. If no momentum is transferred between adjacent layers of flow, the Reynolds shear stress is close to zero and the flow is considered laminar. For ease of compari-son between the different samples and wake depths, the same scaling of velocity vec-tors and the same intervals between contour levels have been adopted in the plot.
Figure 5.9 shows the contours of horizontal (x,y)-plane slices of the shear stress 𝑢´𝑤´ /𝑈�G plotted at three depths for the three samples tested. The 𝑢´𝑤´ contours in-
crease in intensity at the shear layer level. This shift in intensity is related to the strong instabilities induced by the burst to turbulence in the free shear layer. The plain cylin-der exhibits a higher uniform momentum transfer along the shear layer, which in-creases in size and intensity as we move deeper into the wake. This behaviour identi-fies the vortex formation region. Eddies form close to the rear of the cylinder for the plain cylinder (Zdravkovich, 1981). The HC and HSC filleted surfaces exhibit lower
levels of 𝑢′𝑤′ shear stress. This can be interpreted as a clear representation of a reduc-tion in the strength of the vortex shedding. In particular, the HC filleted surface exhib-its an interruption of the intense Reynolds stresses where the flow separation line is

5.5 Reynolds shear stress (RSS) mean flow fields
135
Figure 5.10 - Contour plots of shear stresses 𝒗′𝒘′/𝑼�𝟐 for the three different samples tested measured in three different (x,y)-planes: (a )Position 1 (z/D=0.59), (b) Position 2 (z/D=0.97),
and (c) Position 3 (z/D=1.34).
interrupted by the presence of the concave fillets. In contrast, the HSC filleted surface
exhibits a wider region of 𝑢′𝑤′ shear stresses. This suggests that the wider high inten-sity region of the shear layer is achieved as a result of turbulent vortical structures in-duced by the concave staggered fillets positioned along the height of the cylinder. Figure 5.10 shows the iso-contours of horizontal (x,y)-plane slices of the shear stress
𝑣′𝑤′/𝑈�G plotted at the first position for the three different cylinders tested. The plain
cylinder exhibits an absence of significant levels of 𝑣′𝑤′ stress, confirming a tendency towards a two-dimensional flow characterized by a rolling up of primary vortices.
On the other hand, the HC and HSC filleted surfaces exhibit large regions of intense Reynolds stresses, creating an overall three-dimensional structure of the flow along the height of the cylinder which diffuses inside the wake. In particular, the HC filleted surface shows a structure with two main lobes in the flow detachment region. The HSC filleted surface exhibits structures with alternating lobes along the height of the cylinder, induced by the staggered concave fillet configuration. These structures rep-

136 Department of Civil Engineering, Technical University of Denmark
resent vortical turbulent structures detaching from the side of the cylinder and disturb-ing the rolling up of primary vortices.
5.6 Conclusions PIV measurements were carried out in a wind tunnel. A stereo PIV system manufac-tured by Dantec Dynamics was utilized to take measurements in three different posi-tions inside the near wake of a helically concave (HC) filleted surface circular cylin-der and a helically staggered concave (HSC) filleted surface circular cylinder. In the
model of the helically concave (HC) filleted surface, the fillets have an h/D = 0.027 and replicate the usual arrangement of currently-used stay cables with helical fillets. In the model of the helically staggered concave (HSC) filleted surface, the fillets have with an h/D = 0.043 and are arranged laterally in a staggered helical pattern. Tests were performed in the subcritical Reynolds number range (20–40k < Re < 300–400k) for Re = 5.08 x 10⁴. The results were compared with those for a plain surface circular cylinder. The research shows that the helical concave protrusion induces several ef-fects on the shear layer and on the overall near-wake characteristics not found with a plain surface cylinder. Distinct flow variations were identified in the effects induced by the presence of concave fillets in the HC and HSC filleted circular cylinders.
The results for the HC filleted surface cylinder show similar dominant structures to those for the plain surface cylinder, but with an alteration in the uniform shear layer along the length of the sample, induced by the presence of the concave fillets at sepa-ration. This is represented by a three-dimensional vortical structure which introduces spanwise variations. These changes were followed up by a weakening of the strength of primary vortices and an increase in vortex formation length and in the size of the recirculating zone. This was confirmed by a decrease and weakening of TKE con-tours. The POD analysis made it possible to identify similar dominant coherent struc-tures to those found for the plain surface cylinder, which shows that the overall flow is not greatly affected by the presence of the concave fillets. Nevertheless, the three-dimensional vortical structure represents a dominant energetic mode, which creates a disturbance between the modes representing the rolling up of primary vortices. This is further confirmed by the decrease in radius of the plots of the POD coefficients, indi-cating a decrease in energy. As a result, it is possible to conclude that the HC filleted surface exhibits a more stable near-wake region than the plain surface, providing a weaker interaction between shear layers, early suppression of vortex shedding, a smooth transition of drag force in the critical regime, and a constant zero lift force.
The HSC filleted surface cylinder shows completely different dominant coherent structures to those of the plain surface circular cylinder. The HSC filleted surface

5.6 Conclusions
137
sample exhibits a period undulation of the shear layer, with longitudinal streamwise vortices which reduce the interaction between boundary layers. Statistical comparison between the flow structures shows an almost 90% weaker concentration and lower magnitude of peak TKE than with the plain surface sample. The concentration weak-ens further as we move deeper inside the near wake. This confirms the creation of high turbulence at separation, which then propagates inside the wake avoiding interac-tion between boundary layers. Furthermore, the POD analysis shows that, in contrast to the plain surface cylinder, the dominant coherent structure of the HSC filleted sur-face cylinder varies greatly from mode to mode. In particular, each mode shows a si-nusoidal shape in the in-flow direction and shear layer three-dimensional vortical structures. Each mode shows a dislocation of these dominant structures along the length of the cylinder. Furthermore, the energy is distributed to higher modes, which confirms the great influence of turbulent three-dimensional structures on the main structure of the flow. So it seems that the staggered helically concave fillets create high turbulence at separation, weakening a further development of large-scale vortices inside the wake with an increased base pressure behind the cylinder. This confirms that staggered concave fillets can control the flow and prevent the interaction between shear layers that creates vortices, resulting in a strong weakening of vortex shedding and a more stable near-wake turbulent region that can be seen as indicating reduced drag force acting on the cylinder, a suppression of vortex shedding, and a smooth transition from the subcritical to the critical regime, with a constant zero lift force.


139

140 Department of Civil Engineering, Technical University of Denmark
Chapter 6
6 Conclusions In the research for the present thesis, passive aerodynamic means for stay cables were extensively studied in relation to rain-rivulet suppression and drag performance by following an experimental research approach, i.e. climatic wind tunnel-testing of full-scale bridge cable sections and particle image velocimetry (PIV) wake flow analysis of scaled bridge cable sections.
Firstly, a literature review about basic fluid dynamics around circular cylinders was carried out, because they are of major importance for understanding the flow struc-tures, evolution, and development of boundary layers, shear layer interaction, and the related level of aerodynamic forces from the sub-critical to the post-critical Reynolds number regime. The forces acting on the cable and the interaction between the air flow and the body itself were therefore reviewed. Various vibration mechanisms can be identified, e.g. vortex-induced vibration, buffeting, dry galloping, and wake wind-induced vibration. Attention was also given to describe the effects of surface irregu-larities, section and spanwise irregularities, and the presence of rain and snow on the initiation mechanism of wind-induced vibration in bridge cables. The literature review also summarized our present knowledge and findings on surface and shape modifica-

0
141
tions to stay cables, following the categorization introduced by Kleissl and Georgakis (2013): (a) direct transition to turbulence by using boundary-layer instability, (b) early separation and reattachment using shear-layer instability, (c) wake dephasing and 3-D disturbance by the generation of three-dimensional wake structures, and (d) outer-layer-devices that affect the entrainment layers. This approach introduced all the key passive aerodynamic mechanisms available for controlling vibration in stay cables: altering boundary layers, shear layer interaction, and subsequent wake development to promote low drag forces within the supercritical flow regime and avoid disturbing vortex shedding. In most cases, this involves the mitigation or complete suppression of rain-wind-induced vibration and dry galloping.
Secondly, a detailed wind tunnel investigation was carried out on two new cable sur-faces with concave fillets to determine their aerodynamic coefficients, the structure of the near-wake flow, and their degree of rain-rivulet suppression. The results were compared with traditional cables with plain, dimpled and helically filleted surfaces. In addition, a parametric investigation was conducted on the concave fillet shape to evaluate its performance when applied on the two helically concave filleted surfaces. The helically concave (HC) filleted surfaces outperformed the traditional cable sur-faces in terms of rain-rivulet suppression, with a complete suppression of both upper and lower rain-rivulets at all tested wind velocities. This was true even for the profile with the shortest concave fillet tested. The concave fillet seemed to be able to act as a ramp for the incoming rain-rivulet. The helically staggered concave (HCS) filleted surface exhibited the same behaviour as a dimpled cable surface in terms of drag coef-ficient, showing an early transition to the supercritical range and a subsequent drag force reduction. The staggered surface configuration is able to enhance turbulence at the boundary layer level. The HSC filleted surface was also able to suppress vortex shedding formation at lower Reynolds numbers, in contrast to the dimpled cable sur-face which has vortex shedding formation all the way up to the critical Reynolds number range (Burlina et al., 2016). Furthermore, the HSC filleted surface was able to maintain a low level of drag even with an increase in the height of the concave fillet of more than 100% compared to a traditional helical fillet. The HC filleted surface shows a higher drag in the super-critical range compared to HSC filleted surface. This is due to the helical arrangement of the concave fillet which acts as a fixed ramp and separation point and therefore results in a wider wake. This phenomenon was reduced with a reduction in the height of the fillet.
Finally, particle image velocimetry (PIV) tests were carried out in a wind tunnel in a cross-flow set-up on scaled samples of the HC and HSC filleted cable surfaces. Both two-dimensional and stereo PIV measurements were made to achieve a complete quantitative and qualitative overview and understanding of the development of the

142 Department of Civil Engineering, Technical University of Denmark
near-wake structures both in the streamwise and spanwise directions. Distinct flow variations were identified in the effects induced by the presence of the concave fillet in the HC and HSC filleted circular cylinders. The results from the PIV tests that cap-tured the near-wake behind the HC filleted surface sample show dominant and coher-ent structures created in the wake similar to those with the plain circular cylinder. Nevertheless, the size and strength of the flow structures changed due to the presence of the HC fillet, which introduces three-dimensional wake structures because it has spanwise variations. An alteration in the uniform shear layer along the height of the sample represented by a three-dimensional vortical structure was induced by the pres-ence of the concave fillet at separation. These changes were followed by a weakening in the strength of the primary vortices and an increase in both vortex formation length and the recirculating zone. Statistical comparison between the flow structures shows the HC filleted cylinder had a narrower wake with an increased recirculating zone, and a subsequent increase in vortex formation length in the streamwise direction. The-se changes were followed by a decay in the concentration and lower peak magnitude of both turbulent kinetic energy and Reynolds shear stresses, which represented a weaker interaction between shear layers. Moreover, the POD analysis made it possible to identify the same dominant coherent structure and vortex shedding in the first two modes with less energy than with the plain surface. Furthermore, the three-dimensional vortical structure represents a dominant energetic mode, which acts as a disturbance between the modes representing the rolling up of primary vortices. As a result, it is possible to conclude that HC filleted surfaces exhibit a more stable near wake region than the plain surface, which results in a weaker interaction and early suppression of vortex shedding, a smooth drag force transition in the critical regime and a constant zero lift force. On the one hand, the PIV tests showed that the HSC fil-leted cylinder had a recirculating zone similar in size to that of the plain cylinder, which can be associated with the low drag force. On the other hand, the HSC filleted cylinder had different dominant and coherent structures created in the wake. In partic-ular, the HSC filleted surface sample exhibited a periodic undulation in the shear lay-er, with longitudinal streamwise vortices, which reduced the interaction between boundary layers. The statistical comparison between flow structures makes it possible to see a weak concentration and lower magnitude of peak TKE, with the presence of two distinct symmetrical regions around the centreline of the circular cylinder. Fur-thermore, the HSC filleted surface showed a decrease RSS magnitude of more than 50%. This indicates the creation of a high turbulence at separation which propagates inside the wake, avoiding interaction between boundary layers. The POD analysis shows that, unlike with the plain cylinder, the structures of the flow behind the HSC filleted surface cylinder vary markedly from mode to mode and the energy is distrib-uted to higher modes, indicating that they are closely related to small-scale velocity

6.1 Future work
143
fluctuations and the dynamics of the downstream flow field. In particular, in the SPIV results, each mode shows a sinusoidal shape in the in-flow direction and shear layer three-dimensional vortical structures. Each mode shows a dislocation of these domi-nant structures along the height of the cylinder. It is therefore likely that the staggered helically concave fillets create high turbulence at separation, weakening any further development of large-scale vortices inside the wake with an increased base pressure behind the cylinder. The staggered concave fillet seems able to control the flow and prevent the interaction between shear layers creating vortices, which results in a strong weakening in the vortex shedding and a less turbulent near wake region. This indicates a reduction in drag force acting on the cylinder, suppression of vortex shed-ding, and a smooth transition from the subcritical to the critical regime, with a con-stant zero lift force.
6.1 Future work Bridge cable fluid dynamics with regard to aerodynamic forces, wind-induced vibra-tion and response under varying meteorological conditions is a very broad and com-plex topic of research. After many years of experimental and theoretical research, bridge cable instabilities are still not completely predictable. Passive aerodynamic modifications of bridge cables still require compromises in terms of drag force and the use of additional active methods, i.e. external dampers. The investigations carried out during this research were aimed at understanding and explaining the aerodynamic per-formance of two innovative cable surfaces fitted with concave fillets, whose main purpose is to mitigate vibrations under a variety of meteorological conditions while maintaining an optimal level of aerodynamic forces. However, there are a number of topics still requiring investigation. A selection of these is suggested here.
Angle-of-attack dependency of the force coefficients of inclined / yawed cable sec-tions fitted with concave fillets
Numerous experimental and theoretical studies have demonstrated that, for inclined cables, especially when characterised by a particular cross-sectional shape as with sur-face shape modifications, the combination of three parameters affects the trend of the force coefficients and associated aerodynamic instabilities: the Reynolds number, the angle between the cable axis and the wind direction, and the angle-of-attack.
Static tests have been carried out in the DTU/FORCE Technology climatic wind tun-nel with cross-flow for varying Reynolds numbers up to the supercritical state. Aero-dynamic coefficients have been implemented and a parametric investigation has been undertaken to find the best solution in terms of rain-rivulet suppression and level of drag force.

144 Department of Civil Engineering, Technical University of Denmark
Additional wind tunnel tests should be conducted to investigate the effect of various combinations of all three parameters (i.e. Reynolds number, cable-wind angle, and angle-of-attack) on the aerodynamic force coefficients. The investigation should par-ticularly focus on the helically staggered concave filleted surface, because its particu-lar configuration means that different levels of aerodynamic force should be expected for different combinations.
Snow/ice accretion criteria on cable sections fitted with concave fillet
Ice and snow accretions on bridges pose a hazard for motorists and pedestrians, be-cause shedding accretions can have a significant mass associated with them. Various technologies have been tested on numerous bridges in an attempt to prevent accretion build-up or help mitigate the effects of the falling snow or ice on the traffic below. Most, however, have been found to have problems with durability and cost-effectiveness. Recent studies by Matejicka et al. (2017) present preliminary results from ice shedding tests, which have been carried out on innovative cable surface mod-ifications in the DTU/FORCE Technology climatic wind tunnel. They show that un-like the ice shedding of currently used cable surfaces, the innovative surfaces retain the ice longer during the melting process, reducing the shedding ice mass and particle size, and thus reducing the risk associated with the shedding ice.
Additional wind tunnel tests should be conducted to investigate the effect of various combinations of parameters (i.e. ice/snow type and phenomena, cable-wind angle, and the angle-of-attack) on the retention of snow and ice. The investigation should par-ticularly focus on the helically staggered concave filleted surface, because its particu-lar configuration means that it could be particularly beneficial as a passive control method for the retention of snow and ice.
Passive-dynamic wind tunnel testing of cable sections fitted with concave fillet in dry, wet and iced state
Passive-dynamic wind tunnel tests should be conducted for horizontal/vertical and inclined/yawed bridge cables, in dry, wet and iced conditions. It is generally recog-nised that at the present moment the characteristics of cable instability are still un-clear. This implies that a very large parametric study should be undertaken, where combinations of numerous parameters should be investigated, such as range of critical cable-wind angles, Reynolds number, and angle-of-attack. Moreover, focus should be on cable mass instability, vibration frequency, and structural damping. Data from pas-sive-dynamic tests could be useful for validating predictions of aerodynamic instabil-ity based on the application of quasi-steady aerodynamic criteria.

Department of Civil Engineering, Technical University of Denmark 145

146 Department of Civil Engineering, Technical University of Denmark
7 8 9 References Acampora, A., Georgakis, C.T., 2011. Recent monitoring of the Øresund bridge: Rain-wind induced cable vibrations. In: Proceedings of the 13th International Wind Engineering Conference, Amsterdam. Acampora, A., Georgakis, C.T., 2013. Influence of rain on a cable vibrations and back-calculated aerodynamic force coefficients for a skewed wind condition. J. Wind Engineering and Industrial Aerodynamics. Achenbach, E., 1968. Distribution of local pressure and skin friction around a circular cylinder in cross-flow up to Re = 5 x 10⁶. J. Fluid Mechanics 34(4):625–39. Achenbach, E., 1971. Influence of surface roughness on the cross-flow around a cir-cular cylinder. J. Fluid Mechanics 46(2):321–335. Achenbach, E., 1974. The effects of surface roughness and tunnel blockage on the flow past spheres. J. Fluid Mechanics 65(1):113–125. Adrian, R.J., 1977. On the Role of Conditional Averages in Turbulence Theory. In: Turbulence in Liquids vol. 1, 1977, pp. 323–332. Ahmed, A., Bays-Muchmore, B., 1992. Transverse flow over a wavy cylinder. Phys-ics of Fluids A 4(9):1959–1967. Ahmed, A., Khan, M. J., Bays-Muchmore, B., Mar 1993. Experimental investigation of a three-dimensional bluff-body wake. AIAA Journal 31(3):559–563.

147
Alam, M., Zhou, Y., 2007. Turbulent wake of an inclined cylinder with water running. J. Fluid Mechanics 589:261–303. Aubry, N., 1991. On the hidden beauty of the proper orthogonal decomposition. Theo-retical Computational Fluid Dynamics. 2(5–6):339–352. Babu, P., Mahesh, K., 2008. Aerodynamic loads on cactus-shaped cylinders at low Reynolds numbers. Physics of Fluids 20(3),035112 Bearman, P.W., 1969. On vortex shedding from a circular cylinder in the critical Reynolds number regime. J. Fluid Mechanics 37(3):577–85. Bearman, P., Brankovic, M., 2004. Experimental studies of passive control of vortex induced vibration. Europan J. Mech-B/Fluids 23(1):9–15. Bearman, P.W., Harvey, J.K., 1976. Golf ball aerodynamics. Aeronautical Quarterly 27(2):112–122. Bearman, P.W., Harvey, J.K., 1993. Control of circular cylinder flow by the use of dimples. AIAA Journal 31(10):1753–1756. Bloor, M., 1964. Transition to turbulence in the wake of a circular cylinder. J. Fluid Mechanics 19:290–304. Bosdogianni, A., Olivari, D., 1996. Wind- and rain-induced oscillations of cables of stayed bridges. J. Wind Engineering and Industrial Aerodynamics 64(2–3):171–85. Bloor, M., 1964. Transition to turbulence in the wake of a circular cylinder. J. Fluid Mechanics 19:290–304. Braza, M., Chassaing, P., Minh, HH., 1990. Prediction of large-scale transition fea-tures in the wake of a circular cylinder. Phys Fluids A 2(8):1461–1471. Braza, M., Faghani, D., Persillon, H., 2007. Successive stages and role of natural vor-tex dislocations in the three-dimensional wake transition. J. Fluid Mechanics 439:1–43. Burlina, C, 2014. Aerodynamics of dry helically filleted bridge cables. Master Thesis, Technical University of Denmark – DTU, Kgs. Lyngby, Denmark. Burlina, C., Georgakis, C.T., Larsen, S.V., Egger, P., 2015. Preliminary evaluation of two new cable surface innovations. In: Proceeding of 14th International Conference on Wind Engineering, Porto Alegre, Brazil. Burlina, C., Georgakis, C.T., Larsen, S.V., Egger, P., 2016. Comparative Analysis of Bridge Cables with Concave Fillets. In: Proceeding of International Symposium on Flutter and its Application, Tokyo, Japan.

148 Department of Civil Engineering, Technical University of Denmark
Burlina, C., Georgakis, C.T., Larsen, S.V., Egger, P., 2016. Optimization of bridge cables with concave fillets. In: Proceeding of 8th International Colloquium on Bluff Body Aerodynamics and Applications, Boston, USA. Burlina, C., Georgakis, C.T., Larsen, S.V., Egger, P., 2018. Aerodynamics and rain rivulet suppression of bridge cables with concave fillets. J. Wind and Structures, vol.26, issue 6, pp 253-266 Bursnall, W.J., Loftin, L.K., 1951. Experimental investigation of the pressure distribu-tion about a yawed circular cylinder in the critical Reynolds number range. Technical Report Technical Note 2463, NACA. de Sá Caetano, E., 2007. Cable Vibrations in Cable-Stayed Bridges. IABSE-AIPC-IVBH, ETH Hönggerberg, CH-8093 Zürich, Switzerland, 1st edition Cantwell, B., Coles, D., 1983. An experimental study of entrainment and transport in the turbulent near wake of a circular cylinder. J. Fluid Mechanics 136(1):321–374. Capone, A., Klein, C., Di Felice, F., Miozzi, M., 2016. Phenomenology of a flow around a circular cylinder at sub-critical and critical Reynolds numbers, J. Physics of Fluids 28(7):074101. Casas, JR, Aparicio, AC, 2009. Rain–wind-induced cable vibrations in the Alamillo cable-stayed bridge (Sevilla, Spain). Assessment and remedial action. J. Structure and Infrastructures Engineering, vol 1- 8 art 1. Cheng, S., Larose, G.L., Savage, M.G., Tanaka, H., 2003. Aerodynamic behaviour of an inclined circular cylinder. J. Wind and Structures 6(3):197–208. Cheng, S., Larose G.L., Savage, M., Tanaka, H., Irwin, P.A., 2008a. Experimental study on the wind-induced vibration of a dry inclined cable – Part I: Phenomena. J. Wind Engineering and Industrial Aerodynamics. 96(12):2231-2253. Cheng, S., Irwin P.A., Tanaka, H., 2008b. Experimental study on the wind induced vibration of a dry inclined cable - Part II: Proposed mechanisms. J. Wind Engineering and Industrial Aerodynamics. 96(12):2254-2272. Choi, H., Jeon, W., Kim, J., 2008. Control of flow over a bluff body. In: Annual Re-
view of Fluid Mechanics, 40:113–139. Choi, J., Jeon, W., Choi, H., 2006. Mechanism of drag reduction by dimples on a sphere. In: AIP Physics of Fluids 18, 041702. Christiansen, H., Jakobsen, J.B., Macdonald, J.H.G., Larose, G.I., Bosch, H.R., 2015. Aerodynamics of a stay cable with helical fillets - Part I: stability and load character-istics. J. Wind Engineering and Industrial Aerodynamics Christiansenn, H., Jakobsen, J.B., Macdonald, J.H.G., Larose, G.I., Bosch, H.R., 2015. Aerodynamics of a stay cable with helical fillets - Part II: fluctuating load and wake characteristics. J. Wind Engineering and Industrial Aerodynamics.
149
Christiansen, H., 2016. Aerodynamics of bridge stay cables – Wind tunnel studies. PhD Thesis, University of Stavanger, Norway. Chyu, C., Rockwell, D., 2002. Near-wake flow structure of a cylinder with a helical surface perturbation. J. Fluids and Structures 16(2):263–9. Cid, E., Cazin, S., Drouin, V., 2002. Validation de PIV stéréoscopique et application à un écoulement aérodynamique de sillage 3D. In: 8e Congrès Francophone de Véloci-métrie Laser, Meudon, France. Collis, S.S., Joslin, R.D., Seifert, A., Theofilis, V. 2004. Issues in active flow control: theory, control, simulation, and experiment. Prog Aerospace Sci 40(4):237–89. Cooper, K., Mercke, E., Wiedemann, J., 1999. Improved blockage corrections for bluff-bodies in closed and open wind tunnels, In: 10th International Conference Wind Engineering, Copenhagen, June., pp. 1627–1634. Cosentino, N., Flamand, O., and Ceccoli, C., 2003. Rain-wind induced vibration of inclined stay cables. Part I: Experimental investigation and physical explanation. J. Wind and Structures 6(6):471–484. Cowdrey, C.F., Lawes, J.A., 1959. Drag measurements at high Reynolds numbers of a circular cylinder fitted with three helical strakes. National Physical Laboratory, De-partment of Scientific and Industrial Research. Dantec Dynamics User’s Guide. By Dantec Dynamics A/S, Publication no: 9040U1859, 2015, Denmark. Demartino, C., Koss, H.H., Georgakis, C.T., Ricciardelli, F., 2015. Effects of ice ac-cretion on the aerodynamics of bridge cables. J. Wind Engineering and Industrial Aerodynamics 138:98–119. Demartino, C., Ricciardelli, F., 2015. Aerodynamic stability of ice-accreted bridge cables. J. Fluids and Structures. 52:81–100. Demartino, C., Ricciardelli, F., 2017. Aerodynamics of nominally circular cylinders: A review of experimental results for Civil Engineering applications. J. Engineering Structures 137:76–114. de Ville, V., 2017. Aerodynamic behaviour of cables at Third Bosphous Bridge – Ob-servation on site. In: Proceedings of International Symposium on the Dynamics and Aerodynamics of Cables – ISDAC 2017, Porto, Portugal. Djeridi, H., Braza, M., Perrin, R., Harran, G., Cid, E., and Cazin, S., 2003. Near-wake turbulence properties around a circular cylinder at high Reynolds number. J. Flow, Turbulence and Combustion 71:19–34 (2003).

150 Department of Civil Engineering, Technical University of Denmark
Du, X., Gu, M., Chen, S., 2013. Aerodynamic characteristics of an inclined and yawed circular cylinder with artificial rivulet. J. Fluids and Structures. 43:64–82. El-Makdah, A.M., Oweis, G.F. 2013. The flow past a cactus-inspired grooved cylin-der. J. Experiments in Fluids 54(2):1464. Ekmekci, A., 2014. Circular cylinders fitted with small-scale straight and helical wires: A comparative study on the wire-induced critical effects. J. Experimental Thermal and Fluid Science 53:179–189. Ekmekci, A., Rockwell, D., 2010. Effects of a geometrical surface disturbance on flow past a circular cylinder: a large-scale spanwise flow. J. Fluid Mechanics (2010), vol. 665, pp.120–157. Eriksen, M.B. and Mattiello, E., 2012. Passive-Dynamic Wind Tunnel Tests of the Øresund Bridge Cables. Master’s Thesis, Technical University of Denmark, Kgs. Lyngby Farzaneh, M., 2008. Atmospheric icing of power networks. Springer. Flamand, O., Jun, 1993. Rain-wind induced vibration of cables. In: Proceedings of the 2nd European Conference on Structural Dynamics, Trondhein, Norway. A.A. Balkema, Rotterdam, The Netherlands. Flamand, O., Oct 1994. Rain-wind-induced vibration of cables. In: Proceedings of the International Conference on Cable-Stayed and Suspension Bridges, Deauville, France. Vol. 2. pp. 523–531. Flamand, O., 1995. Rain-wind induced vibration of cables. J. Wind Engineering and Industrial Aerodynamics 57 (2–3):353–362. Flamand, O., Peube, J.L., Papanikolas, P., 2001. An explanation of the rain-wind in-duced vibration of inclined stays. In: Proceedings of 4th International Symposium on Cable Dynamics, Montreal, pp. 69–76. Flamand, O., Boujard, O., Jul 2009. A comparison between dry cylinder galloping and rain-wind induced excitation. In: Proceedings of the 5th European & African Confer-ence on Wind Engineering, Florence. Fransson, J.H.M., Konieczny, P., Alfredsson, P.H., 2004. Flow around a porous cyl-inder subject to continuous suction or blowing. J. Fluids and Structures 19(8):1031–1048. Fukunaga, K., 1990. Introduction to Statistical Pattern Recognition, 2nd edn. Aca-demic Press. Gallardo, J.P., Andersson, H.I., Pettersen, B., 2014. Turbulent wake behind a curved circular cylinder. J. Fluid Mechanics 742:192–229.

151
Gad-el-Hak, M., 2000. Flow control: passive, active, and reactive flow management. Cambridge Univ. Press. Georgakis, C.T., Koss, H.H., Ricciardelli, F., 2009. Design specifications for a novel climatic wind tunnel for the testing of structural cables, In: Proceedings of the 8th In-ternational Symposium on Cable Dynamics, Paris, France, September, pp. 333–340. Gimsing, N.J., Georgakis, C.T., 2012. Cable Supported Bridges: Concept and Design, 3rd ed. John Wiley & Sons Ltd. Gorski, P., Pospisil, S., Kuznetsov, S., Tatara, M., Marusic, A., 2016. Strouhal num-ber of bridge cables with ice accretion at low flow turbulence. J. Wind and Structures 22(2):253–72. Gozmen, B., Akilli, H., Sahin, B., 2013. Passive control of a circular cylinder wake in shallow water. Measurement 46(3):1125–1136. Den Hartog, J.P., 1985. Mechanical Vibrations. Courier Dover Publications. Hikami, Y., Shiraishi, N., 1988. Rain-wind induced vibrations of cables stayed bridg-es. J. Wind Engineering and Industrial Aerodynamics 29(1–3):409–18. Hojo, T., Yamazaki, S., Miyata, T., Yamada, H., 1994. Experimental study on aero-dynamic characteristics of cables patterned surfaces. In: Journal of Structural Engi-neering, vol. 40A. Hojo, T., Yamazaki, S., Miyata, T., Yamada, H., 1995. Development of aerodynami-cally stable cables for cable-stayed bridges having low resistance. Bridges & Founda-tions Engineering 6:27–32, in Japanese. Hojo, T., Yamazaki, S., Okada, H., 2000. Development of Lowdrag Aerodynamically Stable Cable with Indented Processing, Nippon Steel Corporation, July (Special Issue on Steel Structure 82), URL /http://www.nsc.co.jp/en/tech/report/pdf/8203.pdfS. Holmes, J.D., 2001. Wind Loading of Structures. Spon Press, 11 New Fetter Lane, London, EC4P 4EE, United Kingdom, 1st edition. Honda, A., Yamanaka, T., Fujiwara, T., Saito, T., 1995. Wind tunnel test on Rain-Induced Vibration of the Stay Cable. In: Proceedings of International Symposium on Cable Dynamics, Liege, Belgium, pp. 255–262. Humphreys, J.S., 1960. On a circular cylinder in a steady wind at transition Reynolds numbers. J. Fluid Mechanics 9(4):603–12. Igarashi, T., 1985. Effect of vortex generators on the flow around a circular cylinder normal to an airstream. Bulletin of the JSME 28 (236), 274–282. Igarashi, T., Iida, Y., 1988. Fluid flow and heat transfer around a circular cylinder with vortex generators. JSME Int J. 31:701–8.

152 Department of Civil Engineering, Technical University of Denmark
Jakobsen, J.B., Andersen, T.L., Macdonald, J.H.G., Nikitas, N., Larose, G.L., Savage, M.G., McAuliffe, B.R., 2012. Wind-induced response and excitation characteristics of an inclined cable model in the critical Reynolds number range. J. Wind Engineering and Industrial Aerodynamics 110, 100-112. Ji, T.H., Kim, S.Y., Hyun, J.M., 2008. Experiments on heat transfer enhancement from a heated square cylinder in a pulsating channel flow, Int. J. Heat Mass Transfer 51(5–6):1130–1138. Katsuchi, H., Yamada, H., 2009a. Surface pressure and axial flow measurements for indented-surface stay cable. In: Proceedings of 8th International Symposium on Cable Dynamics, Paris, France. Katsuchi, H., Yamada, H., Jun 2009b. Wind-tunnel study on dry-galloping of indent-ed surface stay cable. In: Proceedings of 11th Americas Conference on Wind Engi-neering, San Juan, Puerto Rico. Katsuchi, H., Yamada, H., Sasaki, E., Inamori, K., Kaga, S., 2010. Study on dry-galloping of inclined cable with real indented surface. In: Proceedings of the 21st Na-tional Symposium on Wind Engineering, Japan. pp. 387–392, in Japanese. Karaki, W., Abboud, J., Daher, N., Osman, M., Oweis, G., 2008. PIV measurements in the wake of a cactus shaped cylinder. ASME 2008 International Mechanical Engi-neering Congress and Exposition (IMECE2008), Boston, Massachusetts, USA. Khashehchi, M., Ashtiani Abdi, I., Hooman, K., Roesgen, T., 2014. A comparison between the wake behind finned and foamed circular cylinders in cross-flow. J. Ex-perimental Thermal and Fluid Science 52:328–338. Kim, J., Choi, H., 2005. Distributed forcing of flow over a circular cylinder. Phys. Fluids 17(3):033103. Kimura, T., Tsutahara, M., 1991. Fluid dynamic effects of grooves on circular cylin-der surface. AIAA Journal 29(12):2062–2068. Kleissl, K., Georgakis, C., 2011a. Aerodynamic control of bridge cables through shape modification: A preliminary study. J. Fluids and Structures 27(7):1006–1020. Kleissl, K., Georgakis, C., 2011b. Comparison of the aerodynamics of bridge cables with helical fillets and a pattern-indented surface in normal flow. In: Proceedings of the 13th International Conference on Wind Engineering, Amsterdam, Netherlands. Kleissl, K., Georgakis, C., 2012a. Comparison of several innovative bridge cable sur-face modifications. In: Proceedings of 7th International Colloquium on Bluff Body Aerodynamics & Applications, Shanghai, China. Kleissl, K., Georgakis, C., 2012b. Comparison of the aerodynamics of bridge cables with helical fillets and a pattern-indented surface. J. Wind Engineering and Industrial Aerodynamics 104–106:166–175.

153
Kobayashi, H., Minami, Y., Miki, M., 1995. Prevention of rain–wind induced vibra-tion of an inclined cable by surface processing. In: Proceedings of 9th international conference on wind engineering, New Delhi, India; 1995. pp.753–8. Korkischko, I., Meneghini, J.R., 2012. Suppression of vortex-induced vibration using moving surface boundary-layer control, J. Fluids and Structures 34:259–270. Koss, H., 2009. Climatic Wind Tunnel, December 2009. http://www.cesdyn.byg.dtu.dk/Publications/Femern_Project.aspx. Koss, H., 2012. Introduction to Wind Tunnel Testing in Civil Engineering. Technical report, Byg DTU, CESDyn. Koss, H., Lund, M., 2013. Experimental investigation of aerodynamic instability of iced bridge cable sections. In: Proceedings of 6th European and African conference on wind engineering. UK: Robinson College, Cambridge. Kumar, R.A., Sohn, C.-H., Bangalore, H.L., 2008. Passive Control of Vortex-Induced Vibrations: An Overview 1. Recent Patents on Mechanical Engineering, Korea, 1–11. Kundu, P., Cohen, I., Dowling, D., 2011. Fluid Mechanics – 5th Edition. Elsevier Inc. 2012. Lam K, Wang F, Li J, So R., 2004. Experimental investigation of the mean and fluc-tuating forces of wavy (varicose) cylinders in a cross-flow. J Fluids and Structures 19(3):321–34. Langsoe, H., Larsen, O., 1987. Generating mechanisms for cable stay oscillations at the Faroe bridges. In: Proceedings of International conference on cable-stayed bridg-es. Bangkok, November 18-20. Larose, G.L., D'Auteuil, A., 2008. Experiments on 2D rectangular prisms at high Reynolds numbers in a pressurised wind tunnel. J. Wind Engineering and Industrial Aerodynamics 96 (6–7):923–933. Larose, G.L., Savage, M.G., Jakobsen, J.B., 2003. Wind tunnel experiments on an in-clined and yawed stay-cable model in the critical Reynolds number range. Proc. of 11th International Conference on Wind Engineering, Lubbock, Texas, pages 1705-1712. Larose, G.L., Smitt, L.W., 1999. Rain-wind induced vibrations of the parallel stay ca-bles for the Øresund High Bridge. Proc. of the IABSE Conference, Cable-stayed Bridges, Malmø, Sweden. Larose, G.L., Zan, S.J., 2001. The aerodynamic forces on stay cables of cable stayed bridges in the critical Reynolds number range. In: Proceedings of 4th International Symposium on Cable Dynamics. Montreal, Canada, pp. 77–84.

154 Department of Civil Engineering, Technical University of Denmark
Larose, G.L., Zasso, A., Giappino, S., 2005. Experiments on a yawed circular cylinder in turbulent flow in the critical Reynolds number. In: Proceedings of 6th International Symposium on Cable Dynamics, Charleston, SC, USA. Larose, G.L., D'Auteuil, A., 2014. Wind tunnel investigations of an inclined stay ca-ble with a helical fillet. Technical Report FHWA-HRT-14-070, Federal Highway Administration. Lee, S.J., Kim, H.B., 1997. The effect of surface protrusions on the near wake of a circular cylinder. J Wind Engineering and Industrial Aerodynamics. 69:351–61. Lee, S.J., Lee, J.Y., 2008. PIV measurements of the wake behind a rotationally oscil-lating circular cylinder, J. Fluids and Structures 24(1):2–17. Lee, S.J., Kim, H.B., 1997. The effect of surface protrusions on the near wake of a circular cylinder. Journal of Wind Engineering and Industrial Aerodynamics 69–71:351–361. In: Proceedings of the 3rd International Colloquium on Bluff Body Aero-dynamics and Applications. Lee, S.J., Lim, H.C., Han, M., Lee, S.S., 2005. Flow control of circular cylinder with a v-grooved micro-riblet film. Fluid Dynamics Research 37(4):246–266. Lee, S.J., Nguyen, A.T., 2007. Experimental investigation on wake behind a wavy cylinder having sinusoidal cross-sectional area variation. Fluid Dynamics Research 39(4):292–304. Lee, S.J., Lee, J.Y., 2008. PIV measurements of the wake behind a rotationally oscil-lating circular cylinder, J. Fluids and Structures 24(1):2–17. Leung, Y.C., 1988. Investigation of flows over grooved surfaces. PhD thesis, Univer-sity of Hong Kong. Leung, Y.C., Ko, N.W.M., 1991. Near wall characteristics of flow over grooved cir-cular cylinder. Experiments in Fluids 10(6):322–332, 10.1007/BF00190248. Li, S., Chen, Z., Wu, T., Kareem, A., 2013. Rain-wind-induced in-plane and out-of-plane vibrations of stay cables. J. Engineering Mechanics Vol.139,No.12. Lim, H.C., Lee, S.J., 2002. Flow control of circular cylinders with longitudinal grooved surfaces. AIAA Journal 40(10):2027–2036. Lim, H.C., Lee, S.J., 2003. PIV measurements of near wake behind a U-grooved cyl-inder. J. Fluids and Structures 18(1):119–130. Lim, H.C., Lee, S.J., 2004. Flow control of a circular cylinder with O-rings. Fluid Dynamics Research 35(2):107–122. Lin, J.C., 2002. Review of research on low-profile vortex generators to control boundary layer separation. Progress in Aerospace Sciences 38(4–5):389–420.

155
Liu, Y.Z., Shi, L.L., Yu, J., 2011. TR-PIV measurements of the wake behind a grooved cylinder at low Reynolds number. J Fluids and Structures 27:394–407. Lumley, J.L., Holmes, P., Berkooz, G., 1993. The proper orthogonal decomposition in the analysis of turbulent flows. Annali Review Fluid Mechanics 25:539–575. Lungu, D., Bartoli, G., Righi, M., Vacareanu, R., Villa, A., 2002. Reliability under wind loads of the Brancusi endless column, Romania. In: Proceedings of International Journal of Fluid Mechanics Research. 29:323–328. Lynch, F.T., Khodadoust, A., 2001. Effects of ice accretions on aircraft aerodynamics. Prog Aerospace Sci. 37(8):669–767. Macdonald, JHG, Dagless, EL, Thomas, BT, Taylor, CA, 1997. Dynamic measure-ments of the Second Severn Crossing. In: Proceedings of Institution of Civil Engi-neers – Transport, Vol. 123, No. 4, pp. 241-248. Macdonald, J. and Larose, G., 2006. A unified approach to aerodynamic damping and drag/lift instabilities, and its application to dry inclined cable galloping. J. Fluids and Structures, 22,pg.229-252. Macdonald, J.H.J., Larose, G.L., 2008a. A unified approach to aerodynamic damping and drag/lift instabilities, and its application to dry inclined cable galloping. J. Fluids and Structures 22(2):229–252. Main, J.A., Jones, N.P., 2000. A Comparison of Full-Scale Measurements of Stay Ca-ble Vibration. In Proceedings of Advanced Technology in Structural Engineering: Structures Congress pp. 1–8. Matsumoto, M., 1999. Vortex shedding of bluff bodies: a review. J. Fluid and Struc-tures 13,791-811. Matsumoto, M., Hikami, Y., Kitazawa, M., 1994. Cable vibration and its aerodynam-ic/mechanical control. In: Proceedings of Internal Conference on Cable-stayed and Suspension Bridges, Deauville, France, vol. 2, pages 439–452. Matsumoto, M., Shiraishi, N., Kitazawa, M., Knisely, C., Shirato, H., Kim, Y., Tsujii, M., 1990. Aerodynamic behaviour of inclined circular cylinders – cable aerodynam-ics. J. Wind Engineering and Industrial Aerodynamics 33(1–2):63–72. Matsumoto, M., Shiraishi, N., Shirato, H., 1992. Rain-wind induced vibration of ca-bles of cable-stayed bridges. J. Wind Engineering and Industrial Aerodynamics 43(1–3), pages 2011–2022. Matsumoto, M., Shirato, H., Yagi, T., Goto, M., Sakai, S., Ohya, J., 2003. Field ob-servation of the full-scale wind-induced cable vibration. J. Wind Engineering and In-dustrial Aerodynamics 91(1–2):13–26.

156 Department of Civil Engineering, Technical University of Denmark
Matsumoto, M., Yagi, T., Tsushima, D., 1999. Vortex-induced vibration of inclined cables at high wind velocity. In: Proceedings of 10th International Conference on Wind Engineering, Copenhagen, pp. 979–986. Matsumoto, M., Yagi, T., Hatsuda, H., Shima, T., Tanaka, M., and Naito, H., 2010. Dry galloping characteristics and its mechanism of inclined/yawed cables. J. Wind Engineering and Industrial Aerodynamics 98(6–7):317–327. Matsumoto, M., Yagi, T., Liu, Q., Oishi, T., and Adachi, Y., 2005. Effects of axial flow and Karman vortex interference on dry-state galloping of inclined stay cables. In: Proceedings of 6th International Symposium on Cable Dynamics. Charleston, SC, USA, 19–22 Sept., pp. 247–254 Matsumoto, M., Yagi, T., Shigemura, Y., Trushima, D., 2001. Vortex-induced cable vibration of cable-stayed bridges at high reduced wind velocity. J. Wind Engineering and Industrial Aerodynamics 89(7–8):633–647. Matsumoto, M., Yamagishi, M., Aiko, J., Shiraishi, N., 1995. Various mechanisms of inclined cable aerodynamics. In: Proceedings of 9th International Conference on Wind Engineering, New Delhi, India, pp. 759–770. Matteoni, G., 2014. Understanding and simulating vibrations of plain bridge cables under varying meteorological conditions. PhD thesis, Technical University of Den-mark, Kgs. Lyngby, Denmark. Matteoni, G., Georgakis, C.T., 2013. Effects of bridge cable surface roughness and cross-sectional distortion on aerodynamic force coefficients. J. Wind Engineering and Industrial Aerodynamics 104–106:176–187. Mattiello, E., 2014. Aerodynamic forces on a NACA 0015 airfoil in dry and iced states. In: Proceeding of In-Vento 2014, XIII Conference of the Italian Association for Wind Engineering, Genova, Italy. Maull, D.J., Young, R.A., 1974. Vortex shedding from bluff bodies in a shear flow. J. Fluid Mechanics 60(2):401–409. Melby, S., Hovland, K., Østlid, H.,1994. Construction and maintenance of two-cable-stayed bridges in adverse environment. In: Proceedings of 3rd Symposium on Straits Crossings, Alesund, Norway. Balkema, Rotterdam, pg.157-165. Meyer, K.E., Pedersen, J.M., Özcan, O., 2007. A turbulent jet in crossflow analysed with proper orthogonal decomposition. J. Fluid Mechanics583:199–227. Miyata, Y., Yamada, H., Hojo, T., 1994. Experimental study on aerodynamic charac-teristics of cables with patterned surface. J. Structural Engineering 40A (March), 1065–1076. Miyata, T., Yamada, H., Hojo, T., 1994b. Aerodynamic response of PE stay cables with pattern indented surface. In: Proceedings of International Conference A.I.P.C.-F.I.P. Deauville on Cable stayed and Suspension Bridges, Vol. 2, pp. 515-522.

157
Miyata, T., Katsuchi, H., Tamura, Y., 1999. Comprehensive discussion on structural control for wind-induced responses of bridges and buildings, In: Wind Engineering into the 21st Century, Proceedings of the 10th International Conference on Wind En-gineering, vol. 1, pp. 487–494. Mizuno, S., 1970. Effects of three-dimensional roughness elements on the flow around a circular cylinder. J Sci Hiroshima Univ. 34(3):215–258. Morgenthal, G., Walther, J.H., 2007. An immersed interface method for the vortex-in-cell algorithm. Comput Struct 85(11–14):712–726 Nakagawa, K., Fujino, T., Arita, Y., Ogata, Y., Masaki, K., 1959. An experimental investigation of aerodynamic instability of circular cylinders at supercritical Reynolds numbers. In: Proceedings of 9th Japanese Congress of Applied Mechanics, Tokyo. pp. 235–240. Nakagawa, K., Fujino, T., Arita, Y., Shima, K., 1963. An experimental study of aero-dynamic devices for reducing wind-induced oscillatory tendencies of stacks. In: Pro-ceedings of International Conference on Wind Effects on Buildings and Structures, Teddington, U.K. pp.774–795. Nakamura, Y., Hirata, K., 1994. The aerodynamic mechanism of galloping. Transac-tion of the Japan Society for Aeronautical and Space Science 36 (114), 257–269. Nakamura, H., Igarashi, T., 2007. Reductions in drag and fluctuating forces for a cir-cular cylinder by attaching cylindrical rings. J. Fluid Science and Technology 2(1):12–22. Nakamura, H., Igarashi, T., 2008. Omnidirectional reductions in drag and fluctuating forces for a circular cylinder by attaching rings. J. Wind Engineering and Industrial Aerodynamics 96(6–7):887–899. Naudascher, E., Rockwell, D., 2005. Flow-Induced Vibrations: An Engineering Guide. Dover Publications, Inc., 31 East 2nd Street, Mineola, N.Y.11501. Naumann, A., Quadflieg, H., 1974. Vortex generation and its simulation in wind tun-nels. In: Proceedings of the IUTAM-IAHR Symposium on flow-induced structural vibrations, Karlsruhe, Germany, August 14–16, 1972. Nebres, J., Batill, S., 1993. Flow about a circular cylinder with a single large-scale surface perturbation. Experiments in Fluids 15(6):369–379. Nebres, J., Batill, S., 1992. Flow about cylinders with helical surface protrusions. 30th AIAA Aerospace Sciences Meeting and Exhibit, Reno, Nevada 92 (0540), 1992. Nguyen, A.T., Lee, S.J., May 2004. Experimental investigation on wake behind a si-nusoidal cylinder. In: Proceeding of 10th Asian Congress of Fluid Mechanics, Sri Lanka.

158 Department of Civil Engineering, Technical University of Denmark
Ni, Y.Q., Wang, X.Y., Chen, Z.Q., Ko, J.M., 2007. Field observations of rain-wind-induced cable vibration in cable-stayed Dongting Lake Bridge. J. Wind Engineering and Industrial Aerodynamics. 95, 303-328. Nigim, H.H., Batill, S.M., 1997. Flow about cylinders with surface perturbations. J. Fluids and Structures 11(8):893–907. Oruç, V., Akilli, H., Sahin, B., 2016. PIV measurements on the passive control of flow past a circular cylinder. J. Experimental Thermal and Fluid Science 70:283–291. Ozkan, G.M., Firat, E., Akilli, H., 2017. Passive flow control in the near wake of a circular cylinder using attached permeable and inclined short plates, J. Ocean Engi-neering 134:35–49 Park, H., Lee, D., Jeon, W., Hahn, S., Kim, J., Choi, J., Choi, H., 2006. Drag reduc-tion in flow over a two-dimensional bluff body with a blunt trailing edge using a new passive device. J. Fluid Mechanics, vol. 563, pp. 389–414. Patil, P.P., Tiwari, S., 2008. Effect of blockage ratio on wake transition for flow past square cylinder, J. Fluid Dynamics Research 40:753–778. Pedersen, J. M., 2003 Analysis of planar measurements of turbulent flows. PhD the-sis, Department of Mechanical Engineering, Technical University of Denmark. Perrin, R., Cid, E., Cazin, S., Sevrain, A., Braza, M., Moradei, F., Harran, G., 2006. Phase-averaged measurements of the turbulence properties in the near wake of a cir-cular cylinder at high Reynolds number by 2C-PIV and 3C-PIV. Journal of Experi-mental Fluids 42:93–109. Perrin, R., Cid, E., Cazin, S., Sevrain, A., Braza, M., Moradei, F., Harran, G., 2006. Obtaining phase averaged turbulence properties in the near wake of a circular cylinder at high Reynolds number using POD. Experiments in Fluids 43(2–3):341–355. Persillon, H., Braza, M., 1998. Physical analysis of the transition to turbulence in the wake of a circular cylinder by three-dimensional Navier–Stokes simulation. J. Fluid Mechanics 365:23–88. Poncet, P., 2002. Vanishing of mode B in the wake behind a rotationally oscillating circula cylinder. Phys. Fluids 14(6), 2021–2023. Price, P., 1956. Suppression of the fluid-induced vibration of circular cylinders. J. En-gineering Mechanics Division of the American Society of Civil Engineers 82(3):1–22. Raffel, M., Willert, C., Wereley, C., Kompenhans, J., 2007. Particle Image Veloci-metry, a Practical Guide. Second edition, Springer-Verlag berlin Heidelberg 1998 2007. Rajagopalan S., Antonia R.A., 2005. Flow around a circular cylinder-structure of the near wake shear layer, J. Experimental Fluids 38:393–402.

159
Rashidi, S., Hayatadavoodi, M., Esfahani, J.A., 2016. Vortex shedding suppression and wake control: A review. J. Ocean Engineering 126:57–80. Rodriguez, O., 1991. Base drag reduction by control of the three-dimensional un-steady vortical structures. Experiments in Fluids 11(4):218–226. Roshko, A., 1961. Experiments on the flow past a circular cylinder at very high Reynolds number, J. Fluid Mechanics 10(3):345–356. Saad, M., Lee, L., Lee, T., 2007. Shear layers of a circular cylinder with rotary oscil-lation. J. Experimental Fluids 43:569–578. Saito, T., Matsumoto, M., Kitazawa, M., 1994. Rain-wind excitation of cables on ca-ble-stayed Higashi-Kobe bridge and cable vibration control. Proc. of International Conference on Cable-stayed and Suspension Bridges, Deauville, France, Vol. 2, pp. 507–514. Sallet, D., Berezow, J., 1972. Suppression of flow-induced vibrations by means of body surface modifications. Shock Vib Bull. 42(4):215–28. Schewe, G., 1986. Sensitivity of transition phenomena to small perturbations in flow around a circular cylinder. J. Fluid Mechanics 172:33–46. Scruton, C., 1963. Introductory review of wind effects on buildings and structures. In: Proceedings of 1st International Conference Wind Engineering, Teddington. Scruton, C., Walshe, D.E., Feb 1963. Stabilisation of wind-excited structures. Scruton, C., Walshe, D.E.J., Oct 1957. A means for avoiding wind-excited oscilla-tions of structures with circular or nearly circular cross section. Natl. Phys. Lab.(UK), Aero Report 335. Shirakashi, M., Hasegawa, A., Wakiya, S., 1986. Effect of the secondary flow on Karman vortex shedding from a yawed cylinder. Bulletin of JSME 29(250):1124–1128. Sirovich, L., 1987. Turbulence and the dynamics of coherent structures. I-Coherent structures. II-Symmetries and transformations. III-Dynamics and scaling, Quarterly of Applied Mathematics 45:561–571. Soria J., 1996. An investigation of the near wake of a circular cylinder using a video based digital cross-correlation particle image velocimetry technique, Exp. Therm. Flu-id Sci. 12:221–233. Son, K., Choi, J., Jeon, W., Choi, H., 2011. Mechanism of drag reduction by a surface trip wire on a sphere. J. Fluid Mechanics, vol. 672, pp. 411–427. Strømmen, E., 2010. Theory of Bridge Aerodynamics. 2nd Edition, Springer.

160 Department of Civil Engineering, Technical University of Denmark
Sumer, B.M., Fredsøe, J., 1997. Hydrodynamics around cylindrical structures. Ad-vanced series on ocean engineering, vol.12. World Scientific. Svensson, B., Emmanuelsson, L., Svensson, E., 2004. Øresund Bridge –Cable system – Vibration incidents, mechanisms and alleviating measures. In: Proceedings of 4th International Cable Supported Bridge Operators Conference, Copenhagen, pp. 99-108. Talley, S., Iaccarino, G., Mungal, G., Mansur, N.N., 2001. An experimental and com-putational investigation of flow past cacti. Annual Research Brief, Center for Turbu-lence Research, NASA Ames/Stanford University, California, pp 51–64 Ünal, U.O , Atlar, M., 2010. An experimental investigation into the effect of vortex generators on the near-wake flow of a circular cylinder. Experiments in Fluids; 48(6):1059–79. Van der Hoven, I., 1957. Power spectrum of wind velocity fluctuations in the fre-quency range from 0.0007 to 900 cycles per hour. J. Meteor, 14, 1254-1255. Virlogeux, M., 1998. Cable vibrations in cable-stayed bridges. In: Bridge Aerodynam-ics, A. Larsen and S. Esdahl (eds.), In: Proceedings of International Symposium on Advances in Bridge Aerodynamics, Copenhagen, Denmark. pp. 213–233. Virlogeux, M., 1999. Recent evolution of cable-stayed bridges. J. Engineering Struc-tures 21(8):737–755. Walshe, D.E., Wootton, L.R., 1970. Preventing wind-induced oscillations of struc-tures of circular section. In: Proceedings of Inst. Civil Engineering 47(1):1–24. Wang, J., Jakobsen, J.B., McTavish, S., Larose, G.L., 2017. Aerodynamic perfor-mance of a cactus-shaped cable under static wind tunnel tests. In: Proceedings of In-ternational Symposium on the Dynamics and Aerodynamics of Cables – ISDAC 2017, Porto, Portugal, paper no. 119. Wang, Z.J., Zhou, Y., Huang, J.F., Xu, Y.L., 2005. Fluid dynamics around an inclined cylinder with running water rivulets. J. Fluids and Structures 21(1):49–64. Weber, F., Distl, H., Feltrin, F., Motavalli, M., 2007. Design, Implementation and Field Test of the Adaptive Damping System of the Franjo Tudjman Bridge nearby Dubrovnik, Croatia. In: Proceeding of IABSE Symposium Report. Wianecki, J., 1979. Cables wind excited vibrations of cable-stayed bridges. In: Pro-ceedings of 5th International Conference of Wind Engineering, pp.1381–93. Williamson, CHK., 1992. The natural and forced formation of spot-like vortex dislo-cations in the transition of a wake. J. Fluid Mechanics 243:393–441. Williamson, C.H.K., 1996. Vortex dynamics in the cylinder wake, Annual Review of Fluid Mechanics 28:477–539.

161
Williamson, C.H.K., Govardhan, R., 2004. Vortex-induced vibrations, Annual Re-view Fluid Mechanics 36(1):413–455. Xu, C.-Y., Chen, L.-W., Lu, X.-Y., 2010.Large-eddy simulation of the compressible flow past a wavy cylinder. J. Fluid Mechanics 665:238–273. Xu, Y.L., Li, Y.L., Shum, K.M., Kwok, K.C.F, Kwok, K.C.S., Hitchcock, P.A., 2006. Aerodynamic coefficients of inclined circular cylinders with artificial rivulet in smooth flow. Advances in Structural Engineering; 9(2):265–78. Yagi, T., Naito, H., Liang, Z., Shirato, H., 2009. Evaluation of aerodynamic forces on inclined cable in consideration of end conditions of model for wind tunnel tests. In: Proceedings of 8th International Symposium on Cable Dynamics, Paris, France, pp. 151–158. Yagi, T., Narita, S., Okamoto, K., Shinjo, K., Shirato, H., Oct 2011a. Investigation of dry-state galloping of stay-cables with various kinds of surface configuration. In: 9th International Symposium on Cable Dynamics, Shanghai, China. pp. 215–222. Yagi, T., Shinjo, K., Okamoto, K., Shirato, H., 2014. Galloping instability of inclined cable models based on unsteady aerodynamic force and flow field. In: Proceedings of Symposium on the Dynamics and Aerodynamics of Cables, Copenhagen, Denmark, 25–26 Sept. Yamada, Y., Shiraishi, N., Toki, K., Matsumoto, M., Matsuhashi, K., Kitazawa, M., Ishizaki, H., 1991. Earthquake-resistant and wind-resistant design of the Higashi-Kobe bridge. In: Cable-stayed bridges: recent developments and their future, Elsevier, Amsterdam, pp. 397–416. Yamagishi, Y., Oki, M., 2005. Effect of the number of grooves on flow characteristics around a circular cylinder with triangular grooves. J. Visualization 8(1):57–64. Yamaguchi, H., Fujino, Y., 1998. Stayed cable dynamics and its vibration control. Bridge Aerodynamics, pp 235–253. Yamaguchi, K., Manabe, Y., Sasaki, N., Morishita, K., 1999. Field observation and vibration test of the Tatara bridge. In: Proceedings of IABSE Conference, Cable-Stayed Bridges – Past, Present and Future, Malmo, Sweden. pp. 707–714. Yamauchi, K., Uejima, H., Kuroda, S., Oct 2011. An investigation of the aerodynamic characteristics of cable with surface ribs. In: Proceedings of 9th International Sympo-sium on Cable Dynamics, Shanghai, China. pp. 397–402. Zdravkovich, M.M., 1981. Review and classification of various aerodynamic and hy-drodynamic means for suppressing vortex shedding. J. Wind Engineering and Indus-trial Aerodynamics 7(2):145–189. Zdravkovich, M.M., 1984. Reduction of effectiveness of means for suppressing wind-induced oscillation. Engineering Structures 6(4):344–349.

162 Department of Civil Engineering, Technical University of Denmark
Zdravkovich, M.M. (1997). Flow around Circular Cylinders, Volume 1. Oxford Uni-versity Press, Oxford, UK. Zhang, K., Katsuchi, H., Zhou, D., Yamada, H., Han, Z., 2016. Numerical study on the effect of shape modification to the flow around a circular cylinder. J. Wind Engi-neering and Industrial Aerodynamics. 152:23–40. Zhou, T., Razali, S.F.M., Hao, Z., Cheng, L., 2011. On the study of vortex-induced vibration of a cylinder with helical strakes. J. Fluids and Structures 27(7):903–917. Zhou, B., Wang, X., Guo, W., Gho, W.M., Tan, S.K., 2015. Experimental study on flow past a circular cylinder with rough surface, J. Ocean Engineering 109:7–13. Zuo, D., Jones, N.P., 2010. Interpretation of field observations of wind- and rain-wind-induced stay cable vibrations. J. Wind Engineering and Industrial Aerodynamics 98(2):73–87. CBC News, British Columbia, 2012. “Port Mann Bridge closure unacceptable, says minister.” http://www.cbc.ca/news/canada/british-columbia/story/2012/12/20/bc-port-mann-ice.html (Dec. 20, 2012)

163

164 Department of Civil Engineering, Technical University of Denmark

165
Appendix A
10 Appended conference papers This appendix contains conference papers prepared and presented following the chronological order. The appended papers represent the background and experimental research for the final results presented in Chapter 3.

166 Department of Civil Engineering, Technical University of Denmark
Paper 1 Preliminary evaluation of two new cable surface
innovation Celeste Burlina, Christos T. Georgakis, Søren V. Larsen, Philipp Egger
In Proceedings: 14th International Conference on Wind Engineering, Porto Alegre, Brazil, June 2016.

167

168 Department of Civil Engineering, Technical University of Denmark

169

170 Department of Civil Engineering, Technical University of Denmark

171

172 Department of Civil Engineering, Technical University of Denmark

173

174 Department of Civil Engineering, Technical University of Denmark
Paper 2 Comparative analysis of bridge cables with
concave fillets Celeste Burlina, Christos T. Georgakis, Søren V. Larsen, Philipp Egger
In Proceedings: First International Symposium on Flutter and its Applications, Tokyo, Japan, May 2016.

175

176 Department of Civil Engineering, Technical University of Denmark

177

178 Department of Civil Engineering, Technical University of Denmark

179

180 Department of Civil Engineering, Technical University of Denmark

181

182 Department of Civil Engineering, Technical University of Denmark

183

184 Department of Civil Engineering, Technical University of Denmark

185
Paper 3 Optimization of bridge cables with concave
fillets Celeste Burlina, Christos T. Georgakis, Søren V. Larsen, Philipp Egger
In Proceedings: 8th International colloquium on Bluff Body Aerodynamics and Appli-cations, Boston, USA, June 2016.
186 Department of Civil Engineering, Technical University of Denmark

187

188 Department of Civil Engineering, Technical University of Denmark

189

190 Department of Civil Engineering, Technical University of Denmark

191

192 Department of Civil Engineering, Technical University of Denmark

193

194 Department of Civil Engineering, Technical University of Denmark

195

This dissertation reports an investigation into the efficiency of two new innova-tive cable surfaces fitted with concave fillets to prevent wind-induced vibration on cable stayed bridges. Focus was directed in particular on the phenomenon of rain-wind induced vibration (RWIV). Furthermore, due to the subsequent increase of the aerodynamic static loading induced by the wind action on bridge cables due to their increasing number and length, an optimal level of aerodynamic forces must be maintained when introducing passive aerodynamic means of vibration suppression on bridge cables.
Celeste Burlina
PhD Thesis
Department of Civil Engineering2018
DTU Civil Engineering Report 400
Aerodynamics of bridge cables with concave fillet
DTU Civil Engineering
Technical University of Denmark
Brovej, Building 118
2800 Kongens Lyngby
www.byg.dtu.dk
ISBN 9788778774972
ISSN 1601-2917
Aerodynam
ics of bridge cables with concave fillet
Celeste Burlina