aerodynamic characteristics of a propeller-powered … · aerodynamic characteristics of a...
TRANSCRIPT

NASA Technical Memorandum 4541
Aerodynamic Characteristics of aPropeller-Powered High-Lift Semispan Wing
Garl L. Gentry, Jr.
Langley Research Center • Hampton, Virginia
M. A. Takallu
Lockheed Engineering & Sciences Company • Hampton, Virginia
Zachary T. Applin
Langley Research Center ,, Hampton, Virgi, ia
National Aeronautics and Space AdministrationLangley Research Center • Hampton, Virginia 23681-0001
April 1994
https://ntrs.nasa.gov/search.jsp?R=19940025432 2018-05-30T17:12:06+00:00Z


Abstract
A small-scale semispan high-lift wing-flap system equipped underthe wing with a turboprop engine assembly was tested in the Langley
14- by 22-Foot Subsonic Tunnel. E:rperimentaI data were obtained
for various propeller rotational speeds, nacelle locations, and nacelle
inclinations. To isolate the effects of the high-lift system, data wereobtained with and without the flaps and leading-edge device. The effects
of the propeller slipstream on the overall longitudinal aerodynamic
characteristics of the wing-propeller assembly were examined. Test
results indicated that the lift coefficient of the wing could be increased
by the propeller slipstream when the rotational speed was increasedand high-lift devices were deployed. Dccreasing the nacelle inclination
(increased pitch down) enhanced the lift performance of the system much
more than varying the vertical or horizontal location of the nacelle.Furthermore, decreasing the nacelle inclination led to higher lift curve
slope values, which indicated that the powered wing could sustain higher
angles of attack near maximum, lift performance. Any lift augmentation
was accompanied by a drag penalty due to the increased wing lift.
Introduction
As part of the NASA Advanced Turboprop (ATP)
Program, investigations were conducted at Lang-ley Research Center on the engine-airframe integra-
tion aerodynamics for potential transport aircraft
configurations (refs. 1 2). Some of these detailedstudies have demonstrated tile potential for ma-
jor economic benefits through the use of advanced
turboprop propulsion systems (refs. 3 5). Thesestudies have focused primarily on providing high-
efficiency cruise performance through the use of aft-
fuselage-mounted turboprop arrangements or inte-
grated wing-mounted nacelles designed to minimizeinterference effects. Advanced turboprops are also
very attractive for short take-off and landing (STOL)
transport applications, but little work has been re-
ported regarding their propulsive-lift benefits.
Designs of high-bypass-ratio turbofans were stud-
led in considerable detail (luring the 1970's (ref. 6).These studies examined systems with relatively large
diameter slipstreams and the effect of the turbofans
on aircraft performance. While the effort is continu-
ing in this area (ref. 7), the task of designing the ad-vanced turboprop systenls becomes more challenging
because of the large helical slipstream of the highlyloaded blades. The response of the rifting surfaces to
the slipstream varies with the system configuration
and position of the slipstream; however, the highly
loaded turboprop system integrated on a high-lift
wing may increase the understanding of problems as-sociated with some of the most critical phases of air-
craft operations, such as take-off or missed approach
procedure.
The objective of this investigation was to conducta series of tests to investigate the potential for ob-
taining propulsive-lift benefits in a high-lift system
using a wing-mounted, turboprop propulsion system.
The investigation focused on varying the position of
the propulsion system to determine the system aero-dynamics. The results of the investigation were ex-
ploratory in nature, useful for any fllture analysis of
a design of a general transport model with similarflow characteristics.
[n the following sections, the model setup and test
conditions for the investigation are described, and
the results of the study are presented and describedin detail. Presentation of the results includes a dis-
cussion of the measured system aerodynamic force
and moment coefficients, followed by detailed discus-sions about estimation of force and moment coeffi-
ciems due to the propeller slipstream only. This re-
port focuses on three different wing configurations:
(1) cruise wing, (2) wing with double-slotted flaps at
60 ° deflection, and (3) the second configuration witha leading-edge Krueger flap added.
Symbols
CD
Cr.
Cm
drag coefficient, Drag force/qS
lift coefficient, Lift force/qS
pitching-moment coefficient,
Pitching moment/qSc
wing chord of cruise configuration, ft
mean aerodynamic chord

inac
q
S
Tc
X, y, Z
z/c
z/c
OL
A
6
Subscripts:
I
K
l
tt
v
w
nacelle inclination with respect towing chord, deg
free-stream dynamic pressure, lb/ft 2
wring area, ft 2
static thrust, lb
Cartesian coordinate system, in.
nondimensionalized longitudinalpropeller location from wing leading
edge
nondimensionalized vertical propeller
location from wing leading edge
wing angle of attack, deg
differential
component deflection, positive down-
ward, deg
flap
Krueger
wing lower surface
wing upper surface
vane
wing
Abbreviations:
ATP
QCSEE
WM
Advanced Turboprop Program
quiet clean short-haul experimental
engine
windmill condition
Model Setup and Apparatus
A photograph of tile model assembly, installed in
the test section of the Langley 14- by 22-Foot Sub-
sonic Tunnel, is presented in figure 1. The semispanwing had a rectangular planform with a 20-in. chord
and a 48-in. span as shown in figure 2(a). The wingwas equipped with a leading-edge flap (Krueger type)
and a double-slotted flap system (fig. 2(b)), and in-
corporated a constant-chord QCSEE (quiet cleanshort-haul experimental engine) airfoil section (ref. 8).
The cruise wing configuration is shown in figure 2(c).
Wing and high-lift system sectional coordinates are
given in tables I V. The propuMon system consisted
of an eight-bladed, single-rotation propeller drivenby an air turbine motor mounted in a nacelle. The
cylindrical nacelle was mounted with prefabricated
support links to the wing and could be placed at
several different longitudinal (x/c) and vertical (z/c)locations (fig. 3). Similar support links were used
to vary the nacelle inclination with respect to the
wing chord line. Variations in the nacelle inclination
(thrust line angle) as a result of using two differentsupport links changed the nacelle vertical and hori-
zontal positions by small increments, but wdre negli-
gible when compared with the variation of the nacellclocation.
The 1-ft-diameter, eight-bladed propeller was ascale model of the SR-7L propeller designed and de-
veloped jointly by Hamilton Standard Propellers and
NASA Lewis Research Center (ref. 9). The air motorthat was used to power" the propeller was a compact,'
high power-to-weight ratio, four-stage turbine de-
signed to deliver approximately 150 hp at 19 000 rpmand was housed in the 5-in-diameter nacelle. The
drive air was exhausted through a nozzle at the na-
celle exit directly in the nacelle axial direction. The
high-pressure air line (see trombone-shaped ducts infig. 2(a)) for the power system was routed through
the tunnel system to a rigid mount at the bottom of
the model support system into a rigid point on the
wing and bridged the external balance. Motor rota-tional speed was measured with a 30-per-revolution
signal decoded by a tachometer. Overall forces and
moments of the wing-propeller assembly were mea-
sured with a six-component strain-gage balance lo-cated insMe the wing with a balance moment center
at 0.4c. (See fig. 2(a).) There were no provisions
for direct measurements of thrust and torque for thepropulsion system.
The investigation was performed in the Langley
14- by 22-Foot Subsonic Tunnel (ref. 10), which has
a test section of 14.50 ft high, 21.75 ft wide, and50.00 ft long. This atmospheric wind tunnel is
capable of test section speeds from 0 to 200 knots.
The model system was situated in the center of thetunnel on a masthead. This entire system was on a
turning table 45 in. above the tuimel floor, which was
well above the floor wall boundary layer (ref. 10).
Test Conditions
Experiments were conducted at a free-streamdynamic pressure of 15 lb/ft2 (66.5 knots), which
yielded a Reynolds number of 0.66x10⁶ based on
the wing reference chord of 20 in. Wing angle ofattack was varied within the stall boundaries from
-30 ° to 40 ° . The dynamic pressure and the propellerspeeds of 11 000 and 14 000 rpm were selected to sim-
ulate highly loaded blade configurations (refs. I1 14),
corresponding to critical phases of flight operations
such as climb out and missed approach. The blade
pitch angleat 75 percent radial station was set to
40 ° throughout the tests (ref. 11). Operating condi-
tions were established by first setting the tunnel dy-
namic pressure and then setting the propeller rpm,
which were held constant throughout the given angle-of-attack range. All the data presented were time av-
eraged and were acquired at a rate of 5 samples/seefor 5 see.
Discussion of Results
The effects of the nacelle and propeller slipstrcamon the overall force and moment characteristics of
the wing-propeller assembly wcre obtained and are
presented in detail in the following sections. Presen-tation of the results will include the discussion of the
measured system aerodynamic force and moment co-
efficients followed by detailed discussion of the force
and the moment coefficients duc to the propeller slip-
stream only. Three different wing configurations were
studied: (1) cruise wing, (2) wing with double-slottedflaps at 60 ° deflection, and (3) the second configura-
tion with a leading-edge Krueger flap added. Theresults are presented to show the effects of different
components of the system on the longitudinal aero-
dynamic characteristics of tile cntirc system. The
basic test matrix is presented in table VI.
Presentation of Basic Data
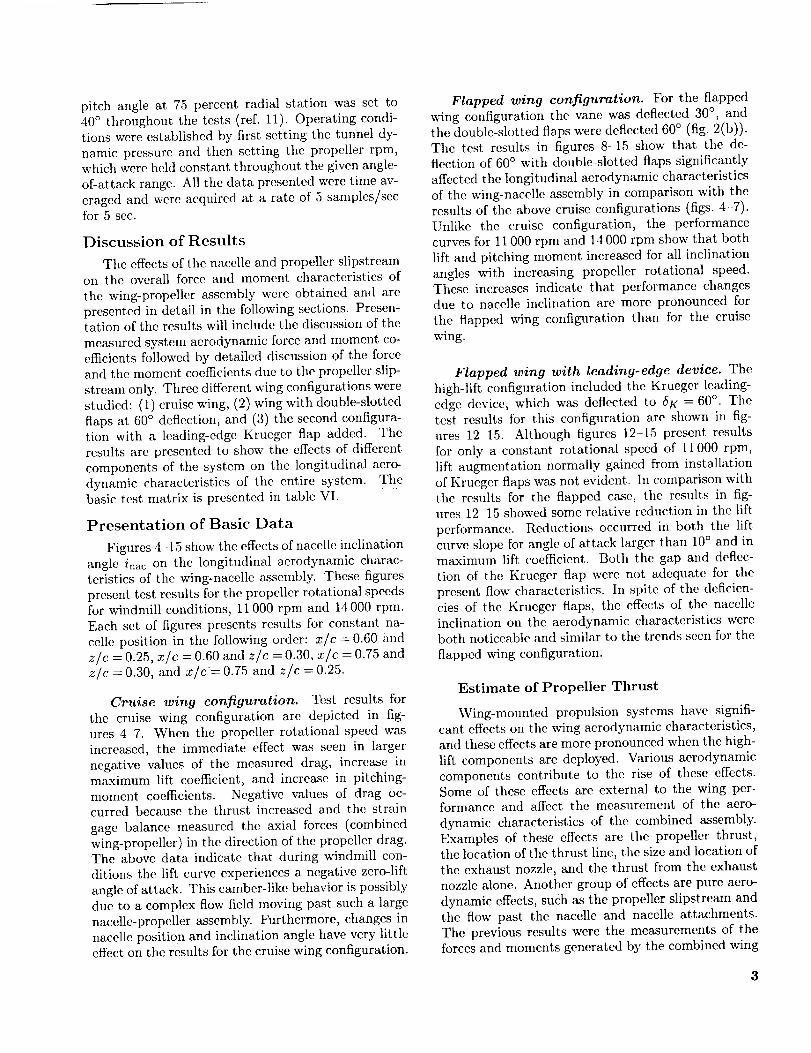
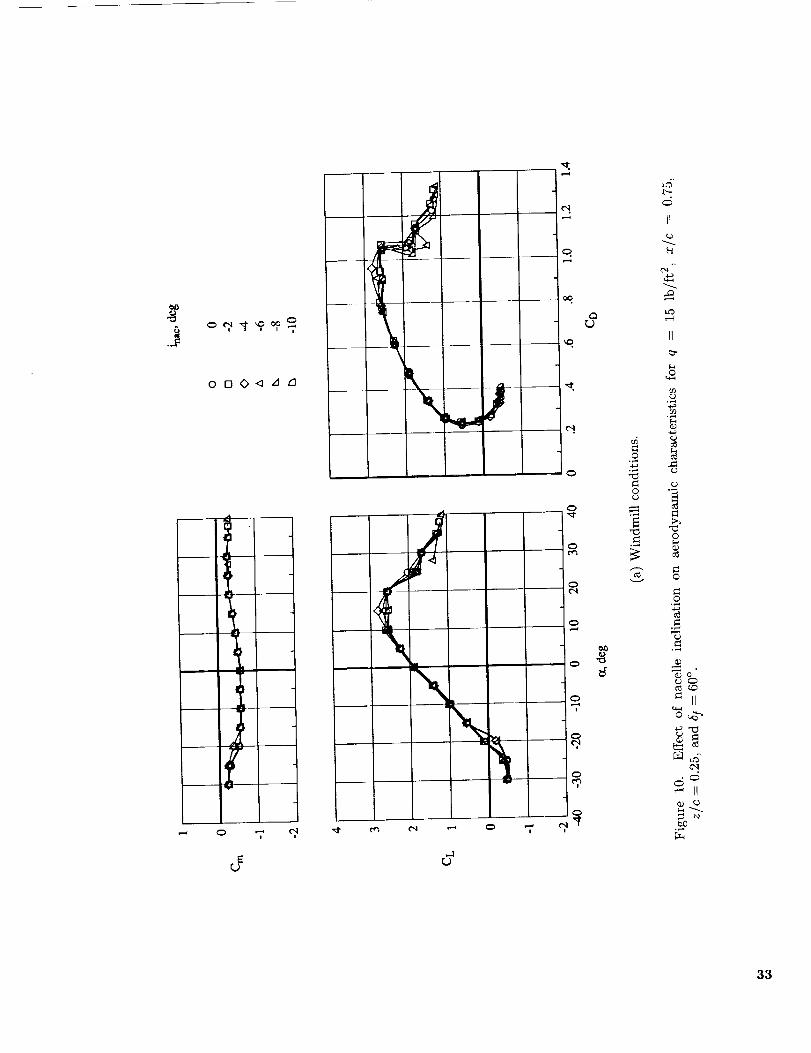
Figures 4-.15 show the effects of nacelle inclinationangle inac on the longitudinal aerodynamic charac-
teristics of the wing-nacelle assembly. These figures
present test results for tile propeller rotational speedsfor windmill conditions, 11 000 rpm and 14 000 rpm.
Each set of figures presents results for constant na-
celle position in the following order: x/c = 0.60 and
z/c = 0.25, x/c = 0.60 and z/c = 0.30, x/c = 0.75 and
z/c = 0.30, and x/c'= 0.75 and z/e = 0.25.
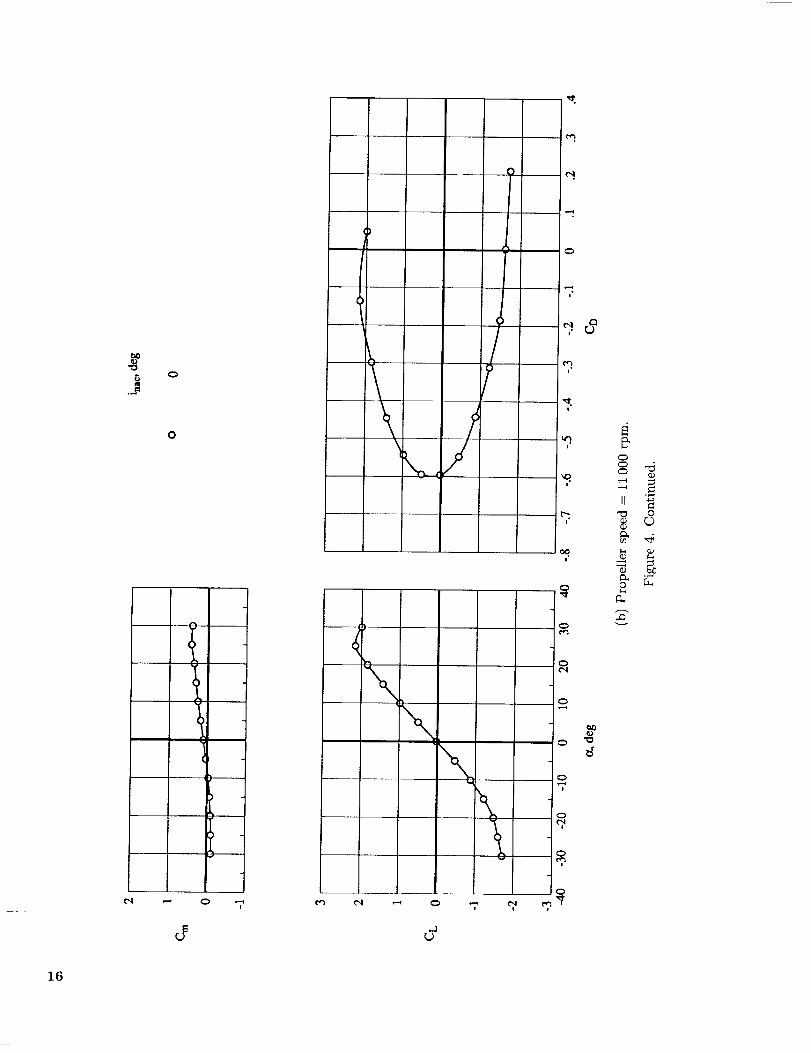
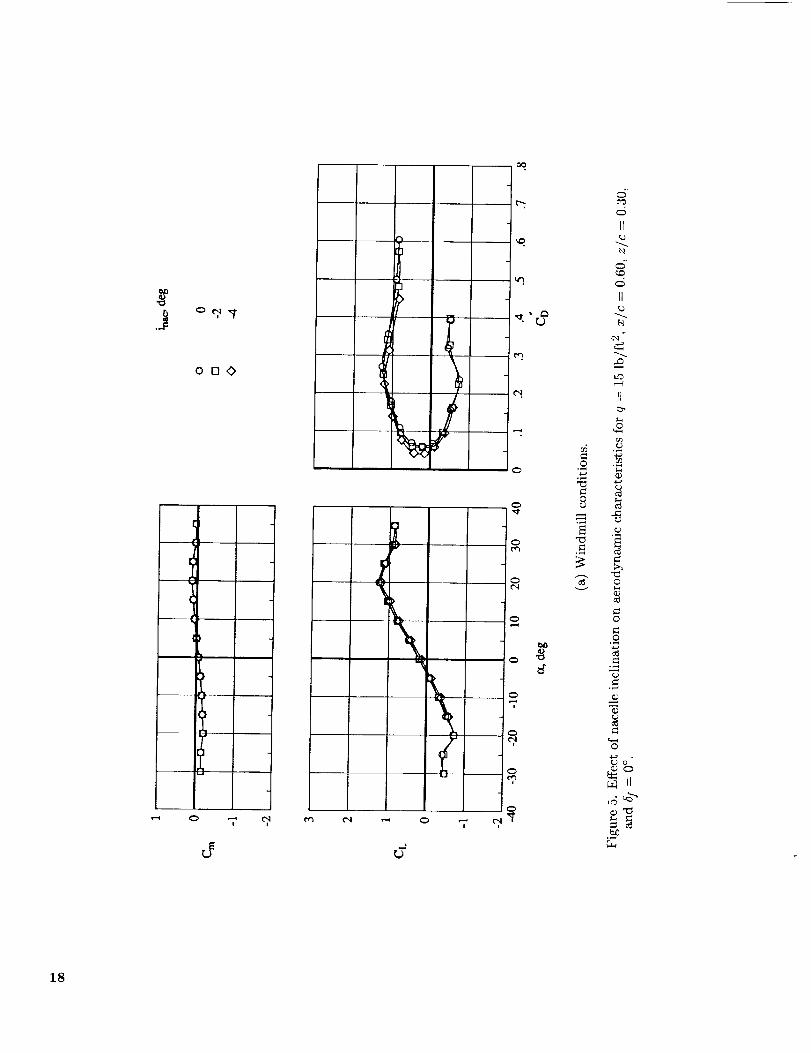
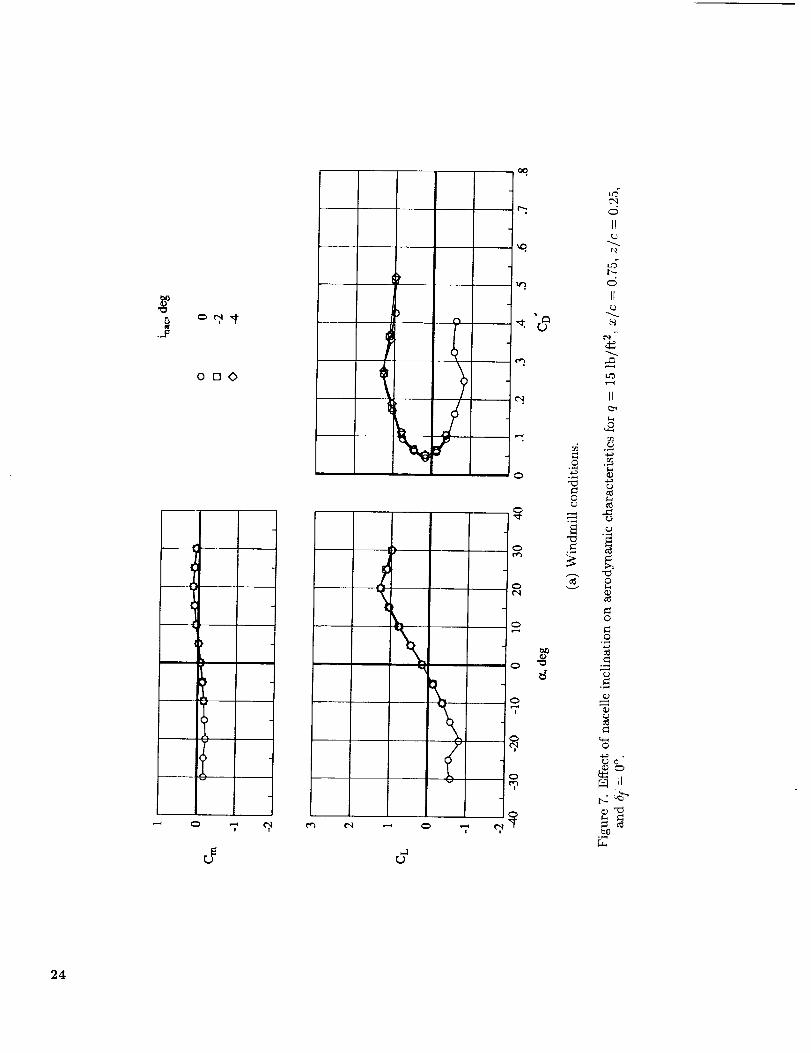
Cruise wing configuration. Test results for
the cruise wing configuration are depicted in fig-
ures 4 7. When the Propeller rotational speed wasincreased, the immediate effect was seen in larger
negative values of the measured drag, increase in
maximum lift coefficient, and increase in pitching-
moment coefficients. Negative values of drag oc-curred because the thrust increased and the strain
gage balance measured the axial forces (combined
wing-propeller) in the direction of the propeller drag.The above data indicate that during windmill con-
ditions the lift curve experiences a negative zero-lift
angle of attack. This camber-like behavior is possibly
due to a complex flow field moving past such a large
nacelle-propeller assembly. Furthermore, changes innacelle position and inclination angle have very little
effect on the results for the cruise wing configuration.
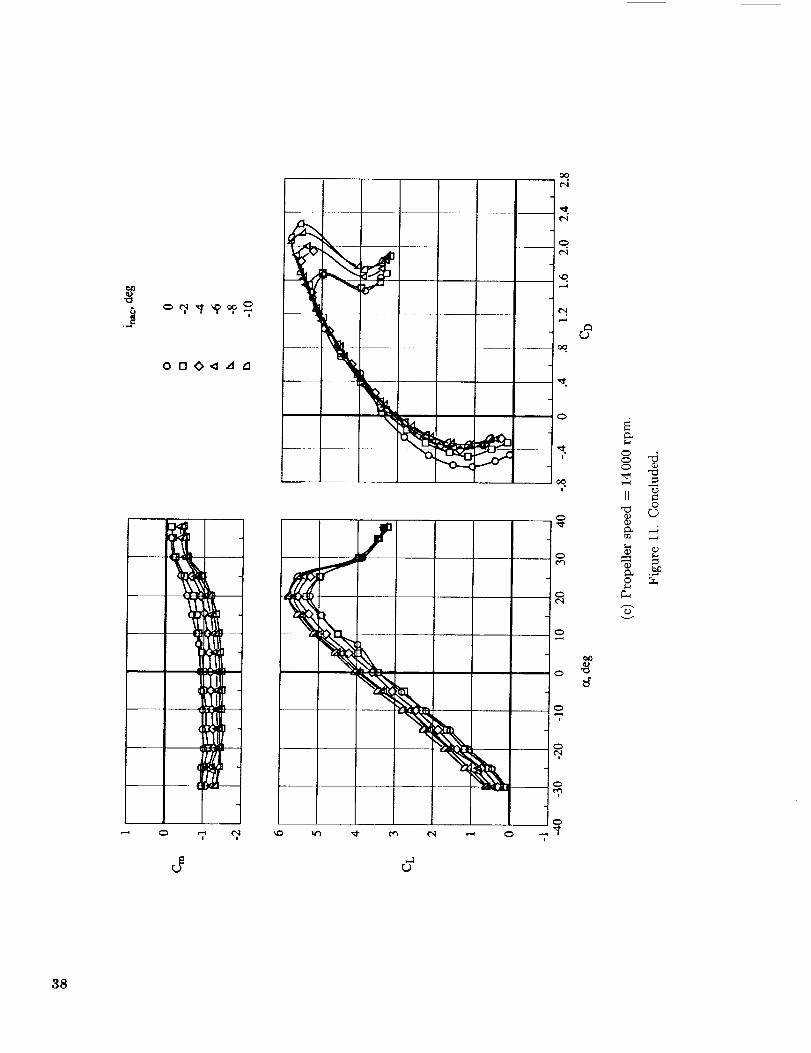
Flapped wing configuration. For the flapped
wing configuration the vane was deflected 30 °, and
the double-slotted flaps were deflected 60 ° (fig. 2(b)).
The test results in figures 8 15 show that the de-
flection of 60 ° with double-slotted flaps significantlyaffected the longitudinal aerodynamic characteristics
of the wing-nacelle assembly in comparison with the
results of the above cruise configurations (figs. 4 7).
Unlike the cruise configuration, the performancecurves for 11 000 rpm and 14 000 rpm show that both
lift and pitching moment increased for all inclination
angles with increasing propeller rotational speed.
These increascs indicate that performance changesdue to nacelle inclination are more pronounced for
the flapped wing configuration than for the cruise
wing.
Flapped wing with leading-edge device. The
high-lift configuration included tile Krueger leading-edge device, which was deflected to 6K = 60°. The
test results for this configuration are shown in fig-
ures 12 15. Although figures 12 d5 present results
for only a constant rotational speed of 11 000 rpm,lift augmentation normally gained from installation
of Krueger flaps was not evident. In comparison with
the results for the flapped case, the results in fig-urcs 12 15 showed some relative reduction in the lift
performance. Reductions occurred in both the lift
curve slope for angle of attack larger than 10 ° and in
maximum lift coefficient. Both the gap and deflec-
tion of the Krueger flap were not adequate for thepresent flow characteristics. In spite of the deficien-
cies of the Krueger flaps, the effects of the nacelle
inclination on the aerodynamic characteristics wereboth noticeable and similar to the trends seen for the
flapped wing configuration.
Estimate of Propeller Thrust
Wing-mounted propulsion systems have signifi-
cant effects on the wing aerodynamic characteristics,
and these effects are more pronounced when the high-lift components are deployed. Various aerodynamic
components contribute to the rise of these effects.
Some of these effects are external to the wing per-formance and affect the measurement of the aero-
dynamic characteristics of the combined assembly.
Examples of these effects are the propeller thrust,
the location of the thrust line, tile size and location ofthe exhaust nozzle, and the thrust from the exhaust
nozzle alone. Another group of effects are pure aero-
dynamic effects, such as the propeller slipstream and
the flow past the nacelle and nacelle attachments.
The previous results were the measurements of the
forces and moments generated by the combined wing

andthepropulsionsystem.Toestimatethecontribu-tion of the propeller wake on the wing aerodynamic
characteristics, the thrust of the propeller must be
quantified and its contribution nmst be removed fromthe overall measurements. As it was mentioned ear-
lier, the six-component balance was positioned in thewing assembly; therefore, a direct measurement of
propeller performance or performance of the isolated
propeller was not available. Thus, the normal and
axial forces wcrc obtained for the combination of pro-peller and cruise wing at zero inclination and no wind
conditions. Data were obtained for a wide range of
propeller rotational speeds, and results are shown infigure 16. Care was taken to account for all static
forces and moments arising from the relative posi-tions of the center of thrust and the thrust line to
the strain-gage balance for various inclination anglesand nacelle positions. These forces (interpolated for
a given rpm) were then numerically removed fromthe me_ured data discussed earlier.
Analysis of Thrust-Removed Data
With the method described in the previous sec-tion, the contribution of the propeller thrust was re-
moved from data presented in figures 4 15, and the
results are presented in figures 17 27. The effect
of the propeller slipstream was more pronounced for
the high-lift configuration; thus, the presentation ofthrust-removed data is limited to data for the high-
lift configurations.
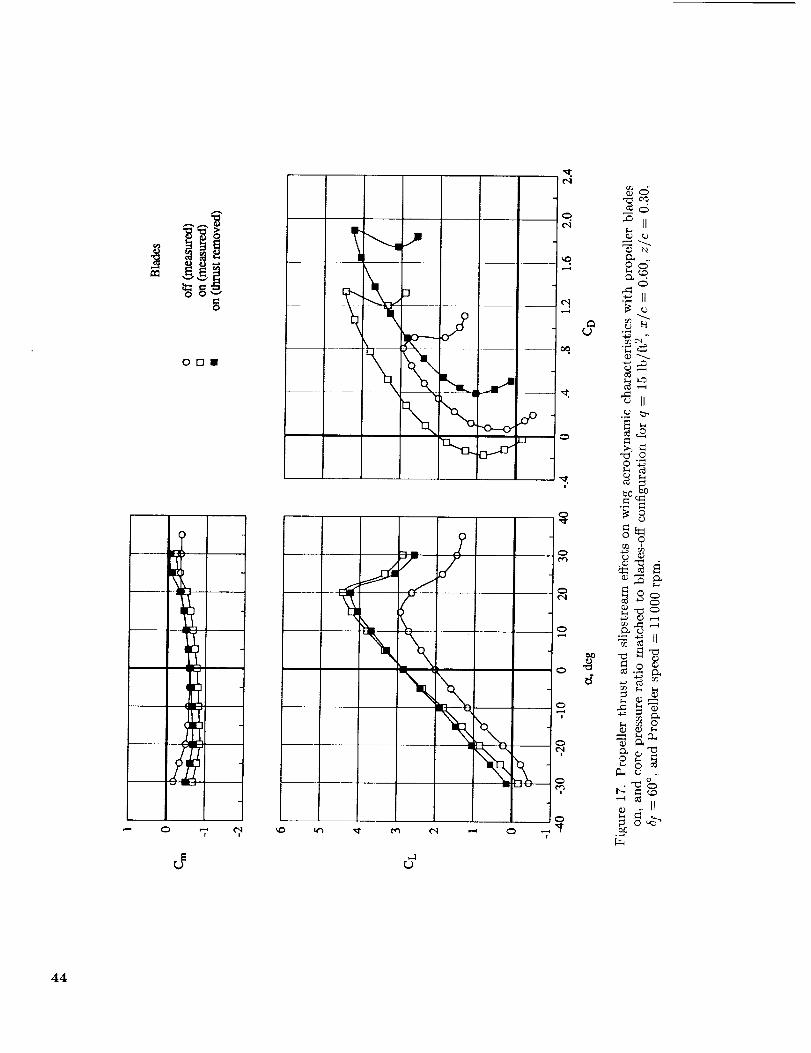
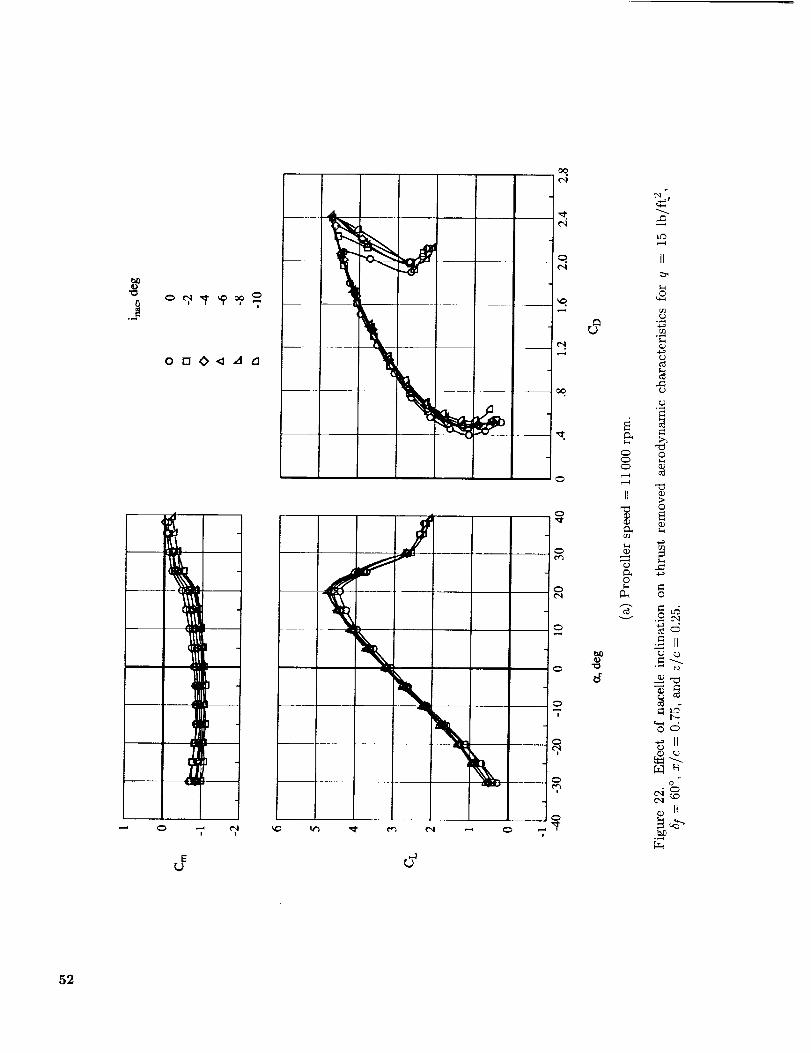
Flapped wing configuration. The results for
the wing with no leading-edge devices and with
double-slotted flap configuration for 5f = 60 °, witha nacelle location of x/c = 0.60, and z/e = 0.30, andwith a nacelle inclination of inac = 0_ are discussed
here to illustrate typical results. Figure 17 com-
pares results of measured data and the direct-thrust-
removed data and includes a curve showing the ef-fects on the exhaust discharge of removing the blades
while the core pressure remains constant.
The powered nacelle without the propeller bladesproduced a maximum lift coefficient of 2.9 at _ = 15 °
and a minimum drag coefficient of 0.05 (fig. 17).
This comparison was in contrast to the cases with
blades on, where less drag (more thrust) and more lift
were measured (i.e., the curve indicating the directmeasurements shows a maximum lift coefficient of 4.4
at a = 20 ° and a minimum drag coefficient of -0.2
at a =-20°). This dr_tic change was because of
the contributions of both the propeller thrust and
the propeller slipstream. The lift curve with allthe thrust contributions removed shows little change
from the measured lift curve; however, the lift curve
with blades removed brings about a larger change
from the measured lift curve. This similarity of lift
characteristics indicates a supercirculation (refs. 6 8)effect with the propeller slipstream as the major
source of lift augmentation. Added drag values were
caused by a lack of thrust contribution and induced
drag was caused by the lift augmentation.
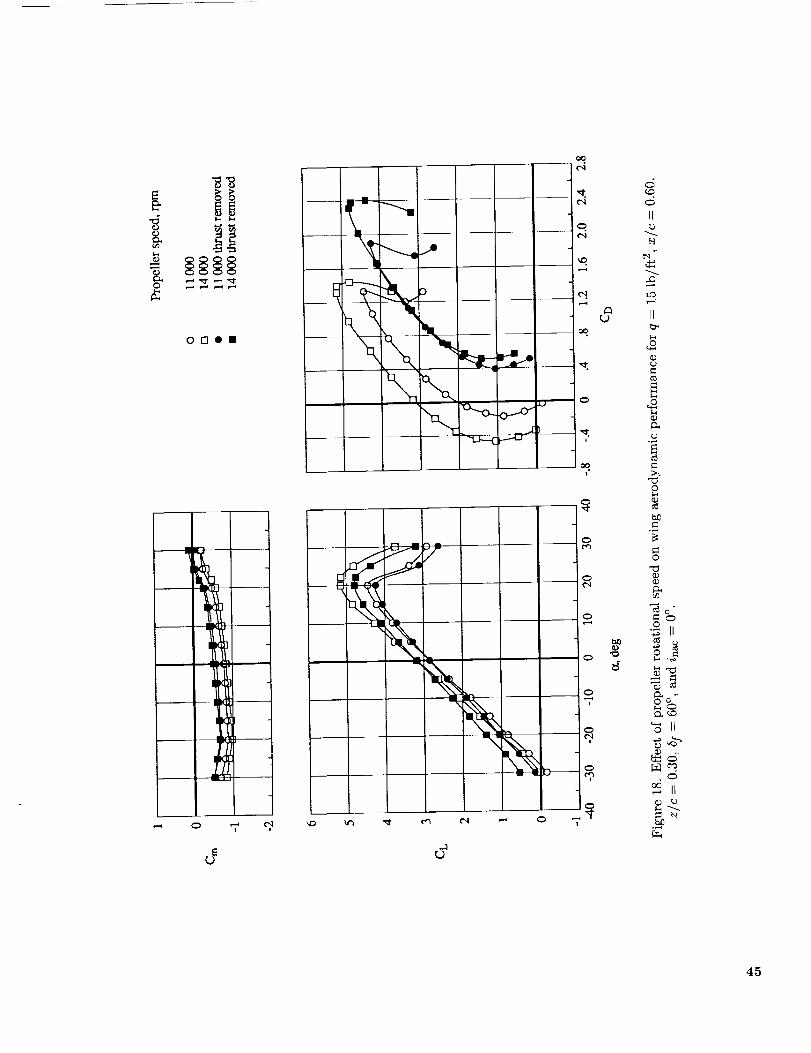
Figure 18 shows comparisons between thrust-
removed data and measured data at propeller rota-
tional speeds of 11 000 rpm and 14000 rpm. Again,the lift performance of the thrust-removed data is
only slightly less than that of the measured data,
which indicates the lift augmentation effects on tile
propeller slipstream. Figures 19 and 20 show, in moredetail, the thrust-removed performance characteris-
tics with variations in rpm, nacelle position, and in-
clination. In all the eases illustrated, higher lift ben-efits were gained from the additional flow over the
wing than from the apparent lift due to tile thrust
component when the propeller rotational speed (disk
loading) was increased. However, when the thrustvalues were removed from the data, there was a net
increase in the drag coefficient. This drag penaltywas due to added lift. with an associated increase
in induced drag and some skin friction drag causedby the stronger propeller slipstream. Furthermore,
a comparison of the moment coefficients shows no
significant change due to increased rotational speed
(disk loading). One may conclude that in tile case ofan aircraft no additional trim moment may be needed
for higher disk loading. Figures 19 and 20 also show
that as tile nacelle inclination decreased, the lift per-formance improved proportionally. This lift augmen-
tation was associated with an increased drag and de-
creasing pitching-moment coefficients. Furthermore,
the change in nacelle inclination caused a shift in the
lift curve slope accordingly. In particular, decreasing
nacelle inclination (increased pitch-down) resulted inincreasing lift over the entire angle-of-attack range.
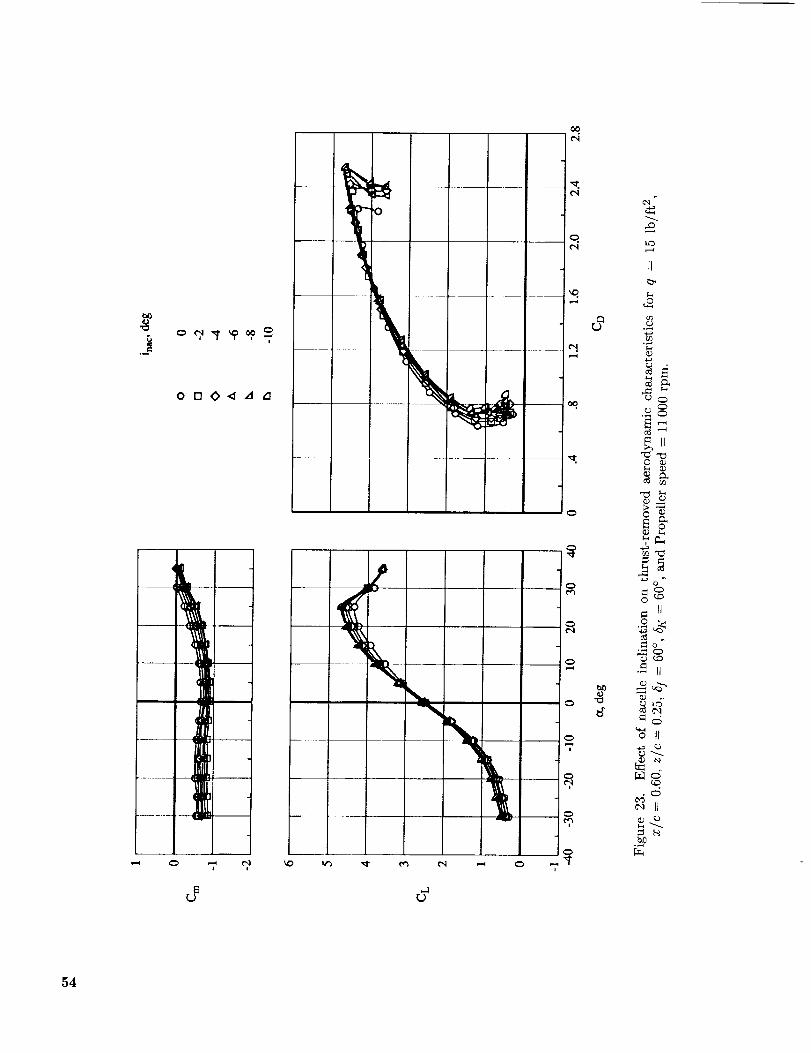
Flapped wing with leading-edge device. The
thrust-removed data are shown for a high-lift configu-
ration in figures 23 26 (i.e., when both double-slotted
flaps and Krueger leading-edge devices are deployed
at 5f = 60" and 5h" = 60°, respectively). The resultsare shown for a constant propeller rotational speed
of 11 000 rpm and for all four nacelle locations. The
thrust-removed longitudinal aerodynamic character-
istics of this high-lift configuration also showed that
as the nacelle pitch is lowered (decreasing nacelle in-clination) the lift curve performance improves pro-
portionally. Again, lift augmentation was associated
with increasing drag and decreasing (more negative)
pitching-moment coefficient. Furthermore, for the

high-liftconfiguration,thedecreasingnacelleinclina-tion (increasedpitch-down)resultedin anincreasinglift curveslope,but nottheshift in lift curvethatwasobservedin figures1922,whichis atrendtypicalofwingswith leading-edgedevices.
Effect of Nacelle Position onThrust-Removed Data
In thefollowingsection,theresultsthat werepre-sentedpreviouslyareplottedin a differentform tofacilitateadetailedlookat incrementalchangesthatthe systemexperiencesbccauscof the specificposi-tion or inclinationof thepropeller-nacelleassemblywith respcctto thewing.
Effect of longitudinal and vertical positions
of propeller-nacelle. In figure 27 the aerodynamiccoefficients for tile powered propeller are presentedfor the four nacelle locations tested. Results are
showm for the wing with _f = 60 °, inac ---- 0 °, andtwo propeller rotational speeds. A close examination
of figure 27 indicates that a longitudinal or vertical
change in the location of the nacelle with respectto the wing resulted in a shift in the lift curve. In
particular, a change in the vertical location affected
the performance data more than the variations in tilehorizontal direction. In both cases, the incremental
changes were more pronounced at higher propeller
rotationa_ speed. Thesc trends seem to confirm
previous observations that the amount of projectionof the propeller disk exposed to high-lift devices may
influence the magnitude of the supercirculation.
Effect of inclination. The nacelle inclination
changes the direction of the propeller slipstream and
affects tile aerodynamic characteristics of the pow-ered high-lift wing system. To examine these charac-
teristics in detail, the.longitudinal aerodynamic coef-
ficients of tile flapped configuration, 5I = 60°' wereselected. The differences between the performancecoefficients at various nacelle inclinations and zero
nacelle inclination were computed and the results are
plotted in figures 28 31. Two different propeller rota-tional speeds were selected. Again, results arc shown
for all four nacelle locations. Lift, drag, and pitching-
moment coefficients increascd with increased pitch-down values of nacelle inclination. In addition, both
lift and drag increased with different angles of attack;therefore, a pitch-down change in the nacelle inclina-
tion during high angle-of-attack operations can effec-
tively produce substantial lift augmentation for the
system. The incremental values of the moment co-
efficients moderately changed with decreasing incli-nation angle but did not vary strongly as angle of
attack was increased. In real aircraft operations, the
increased drag and losses due to trim must be over-
come by added thrust during some crucial maneu-vers such as level off to minimum descent altitude or
a missed approach procedure. These maneuvers re-
quire high-lift performance and full propeller thrust
(to stop the descent or to initiate a climb out) with
alignment of the thrust line and free-stream direc-
tion. This configuration suggests an innovative de-sign where a pitch-doom movement of the nacelle dur-
ing these maneuvers could align the thrust line withthe free-stream direction to counteract added drag
more effectively and to expand the range of maximumlift. A possible additional benefit of nacelle and free-
stream alignment would be the reduction in asym-
metric propeller disc loading and the elimination of
some stability and control concerns. An asymmetric
disc loading is known to cause undesirable changesin tile frequency spectrum of the propeller radiatednoise.
Concluding Remarks
An experimental investigation was conducted on
the engine-airframe integration aerodynamics for ahigh-lift wing configuration. The model consisted of
an untapered semispan wing with a double-slotted
flap system with and without a Krueger leading-edgedevice. Tile advanced propeller and the powered
nacelle were tested, and aerodynamic characteristics
of the combined system were presented.
Results indicate that the lift coefficient of the
powered wing could be increased by the propeller
slipstream when the rotational speed (disk loading)
was increased and high-lift devices were incorpo-
rated. Moving the nacelle with respect to the wingleading edge in vertical and longitudinal directions
increased lift augmentation through a distinct shift
in the lift curve with no change in the lift curve slope.Vertical displacement showed more effective lift aug-
mentation than longitudinal displacement. Decreas-
ing the nacelle inclination (increased pitch-down) in-creased the lift performance of the flapped system
over the entire angle-of-attack range. The combina-
tion of large pitch-down inclination angle and high
angle of attack showed the largest increase in lift in-
crement. Any lift augmentation was accompaniedwith an additional increase in drag due to the in-
creased wing lift.
NASA Langley Research CenterHampton, _v\_ 23681-0001December 15, 1993

References
1. Applin, Zachary T.; and Gentry, Garl L., Jr.: Low-Spccd
Stability and Control Characteristics of a Transport Model
With Aft-Fuselage-Mounted Advanced Turboprops. NASA
TP-2535, I986.
2. Dunham, Dana Morris; Gentry, Garl L.; Manuel,
Gregory S.; Applin, Zachary T.; and Quinto, P. Frank:
Low-Speed Aerodynamic Characteristics of a Twin-Engine
General Aviation Configuration With Aft-Fuselage-
Mounted Pusher Propellers. NASA TP-2763, 1987.
3. Goldsmith, I. M.: A Study To Define the Research and
Technology Requirements for Advanced Turbo/Propfan
Transport Aircraft. NASA CR-166138, 1981.
4. Levin, Alan D.; Smith, ttonald C.; and Wood, Richard D.:
Aerodynamic and Propeller Performance Character-
istics of a Prop fan-Powered, Semispan Model. NASA
TM-86705, 1985.
5. "Whitlow, J. B., Jr.; and Sievers, G. K.: Fuel Savings
Potential of the NASA Advanced Turboprop Program.
NASA TM-83736, [198.'1].
6. Johnson, William G., Jr.: Aerodynamic Characteristics of
a Powered, Externally Blown Flap STOL Transport Model
With Two Engine Simulator Sizes. NASA TN D-8057,1975.
7. Favier, D.; Maresca, C.; Barbi, C.; and Fratello, G.: Ex-
perimental and Numerical Study of the Propeller/Fixed
Wing Interaction. AIAA-88-2571, 1988.
8.
10.
11.
12.
13.
14.
Phelps, Arthur E., III: Static and Wind-On Tests of an
Upper-Surfacc-Blown Jet-Flap Nozzle Arrangement for
Use on the Quiet Clean Short-Haul Experimental Enginc
(QCSEE). NASA TN D-8476, 1977.
Parzych, D.; Shenkman, A.; and Cohen, S.: Large-
Scale Advanced Propfan (LAP) Performance, Acous-
tic and Weight Estimation, January, 198_. NASA
CR- 174782, 1985.
Gentry, Garl L., Jr.; Quinto, P. Frank; Gatlin, Gregory
M.; and Applin, Zachary T.: The Langley 1_- by 22-Foot
Subsonic Tunnel: Description, Flow Characteristics, and
Guide for Users. NASA TP-3008, 1990.
Gentry, Garl L., Jr.; Booth, Earl R., Jr.; and Takallu,
M.A.: Effect of Pylon Wake With and Without Pylon
Blowing on Propeller Thrust. NASA TM-4162, 1990.
Takallu, M. A.; anti Dunham, Dana Morris: A Hy-
brid Mcthod for Prediction of Propeller Performance.
AIAA-90-0440, Jan. 1990.
Takallu, M.; and Lessard, V.: Periodic Blade Loads
of a High Speed Propeller at Small Angle of Attack.
AIAA-91-2250, June 1991.
Takallu, M. A.; and Gentry, G. L., Jr.: Aerodynamic
Characteristics of a Propeller Powered High Lift Semi-
Span Wing. AIAA-92-0388, Jan. 1992.
6

Table I. Coordinates of Cruise Wing Section
27
(o)0.00
1.25
2,50
5.00
7.50
10.00
15.00
(a)0.000
30.00
2.920
3.9705.180
5.910
6.480
7.33020.00 7.920
25.00 8.310
8.610
35.00 8.800
40.00 8,920
45.00 8.902
50.00 8.850
55.00 8.615
60.00 8.340
65.00 7.92570.00 I 7.360
75.00
80,00
85.00
6.500
5.6104.425'
0.000
0.000
-3.120
-4.140
-5.340
-6.060
-6.580
-7.300
-7.770
-8.040
-8.180
-8.160
-8,050
-7.734
-7.370
-6.450
-5.475
-3.715
-2.000
-1.005
-0.300-0.040
90.00 3.140 -0. i00
95.00 1.620 -0.450
100.00 -0.770
"Coordinates are given in percent of local wing chord.c_, = 20 in,
7

TableII. Coordinatesof High-LiftWingSection
x
(a)0.00
1.25
2.50
5.00
7.50
z, u
(a)0.000
2.920
3.920
0.000
-3.120
-4.140
5.180 -5.340
5.910 -6.060
10.00 6.480 -6.580
15.00 7.330 -7.300
20.00
25.00
30.00
7.920 -7.770
8.310 -8.040
8.610 -8.180
8.800 -8.160
8.920 -8.050
8.900 -7.750
8.850 -7.370
35.00
40.00
45.00
50.00
55.00 8.640 -6.695
60.00 8.340 -5.870
65.00 7.950 1.820
7.36070.00 5.550
79.00 5.610 5.550
aCoordinates are given in percent of local wing chord.
cw = 20 in.
Table III. Coordinates of Flap Vane Airfoil Section
x
(a)0.00
1.25
5.00
7.50
10.00
15.00
20.00
25.00
30.00
40.00
50.00
52.01
54.00
60.00
70.00
Zll
(a)-12.500 -12.500
-6.525 -16.500
-0.297 -19.490
2.331 -20.210
4.801 -20.490
8.496 -20.130
11.530 -19.190
14.110 -17.990
16.270 -16.500
19.410
21.060
-13.810
-11.500
21.250 1.102
21.420 4.110
21.840 9.979
21.820 13.700
80.00 21.120 15.850
90.00 19.920 16.720
100.00 18.010 16.550
aCoordinates are given in percent of flap vane chord.
Cv= 0.236cw.
8

TableIV. Coordinatesof FlapAirfoil Section
x I0 -4.000
1.25 0.000
11910
-7.390
2.50 -8.410
5.00 -8.6904.790
7.50 6.930
10.00 8,670
15.00 11.000
20.00 12.630
25.00 13.790
14.530
15.060
30.00
40.00
-8.450
-7.880
-6.700
-0.640
-4.680
-3.750
-2.160
50.00 14.240 -1.020
60.00 12.330 -0.440
80.00 6.690 -1.000
90.00 3.260
-0.440100.00
-1.800
-2.710
aCoordinates are given in percent of local flap chord.
cf = 0.26,tc_,.
Tat)lc V. Coordinates of Krueger Flap
X
__ (-)0.00
1.25
2.50
Z_
(a)0.000
5.000
6.950
0.000
-5.000
-6.950
5.00 10.000 -10.000
7.50 12.000 -12.000
10.00 13.550 -13.550
15.00
15.00
20.00
30.00
40.0O
50.00
15.590 -15.590
15.590 5.680
16.950
17.910
17.500 [16.180
14.200
11.590
8.550
60.00
70.00
80.00
5.680
5.680
5.680
5.680
5.680
5.680
5.680
90.00 5.250 5.680
100.00 1.700 5.680
"Coordimites are given in percent of local Kruoger chord.
cA" = 0.22cu,.
9

Tat)leVI. _,Ving-NacelleConfigurations
Figure 04(a) x4(b) x
4(c) x5(a) x5(5) x
5(e) x6(a) x
6(b) x
6(c) x
7(a) x
7(b) x
7(c) x
8(a) x8(5) x8(c) ×9(a) x
9(b) x
9(c) x
10(a) x
10(b) x
10(e) xll(a) x
ll(b) x
11(c) x i12 x
13 x J14 x
15 x
16(a) x
16(b) x
16(c) ] x
16(d) j x_
!
-2
X
X
inac, deg
-4 -6 -8 -10 x/c z/c0.60 10.25
0.6010.25
0.60 10.25
0.60 0.30
0.60 0.30
0.60t0.30
0.75 I 0.30
0.75 10.30
0.75 [0.30
0.75 10.250.75 I 0.25
- 0.75 [0.25
0.60 I 0.25
0.6010.25(}.60[0.25
0.60 I 0.30
_0-I 0.30
0.60[0.300.751 0.25
x --x x 0.75 i 0.25
X X
X
X X
ixX - X
X X X X
X X X X
X X -X- X
X
X
X
X
X
X
X
X
X
X
X
X
X
X
X
X
X
X
X
X X
X X
X X
X X
X X
X X
X X
X X
X X
X X
X X X X
X X X X
X X X
X
X X
X X
X X X
X X X
X X X
X X X
X X X
X X X
X X X
X X X
X X X
X X X
X X X
X X X
x xX
X
x I
0.7510.25
0.7510.30
0.75[0.30
0.75t0.30
0.60 T_0.60 ] 0.30 '
0.7510.301
o.751o.250.60 I 0.25
0.60 [0.30
0.75 J 0.300.75 [0.25
ConfigurationCruise
Cruise
Cruise
Cruise
Cruise
Cruise
Cruise
Cruise
Cruise
Cruise
Cruise
Cruise
Flaps
Flaps
Propeller
speed,
rpmWM
11000
14000
VVM
q_
lb/ft 215
15
15
15
11 000 15
14 000 15
WM 15
11000 15
14 000 15
WM 1511000
14 000
WM
15
15
11 000 15
Flaps 14 000 15
Flaps WM 1511 000
14 000
WM
Flaps
Flaps
Flaps
Flaps
Flaps
11000
14 000
Flaps WM
Flaps 11000
14000Flaps
Flaps + K
15
15
11000 [
11 000
11000
11 000
15
i5
15
15
15
15
15
Flaps + K 15
Flaps + K 15
Flaps +K
Flaps
Flaps
Flaps
15
Flaps
Range ! 15Range 15
Range 15
Range I 15
10

ORb_INAL PAOE'
F__._.."_,[email protected] WHITE PttOi-O(.".i'_t.,¢F{
L-90-09962
(a) Three-quarter view of trailing-edge flap configuration.
Figure 1. Photograph of semispan model installed in Langley 14- by 22-Foot Subsonic Tunnel.
11

(b)Bottomviewof trailing-edgeflapconfiguration.
Figure1. Conclud_d.
L-90-09965
12

,&0__/-Wing s- Center of
Kruegerflap_, I )/ _/ moments Engine_
___/-__Vane mount.,
]__ } (7_-T___2f_-_,K____ Fin p
5!0 _ Nacelle A 'r'__lr-Ilne
fastener -/
Air-line /fastener--"
l _ t End plate j
-Balance block
tl II !
ir ii I
iI- ] -II Lli
'I II }4. If J
L_' I I It i I+-_ - )l f !
1,-I1 , ,i --Sting
.; ,i;, q i
-Air-line fastener
/- Model balance
(a) Three-view sketch of semispan high-lift wing with propeller-nacelle assembly.
(b) High-lift configuration.
Figui'e 2.
20.0
(c) Cruise configuration.
Schematics of test model. All dimensions are in inches.
13

Thrust
Balance moment center (0.4c)
_x cz_I
-Ina cl Propeller pitch change axist
Figure 3. Schematic of propeller-nacelle position•
14

5
0
I
\
\
/
\\ |
0
o
0
II
II
L_
.2
c_
o
o
c_.,.-w
o_
L_
o
11
15
16
0
o
I \\
\
c_
0
0
0
_J
i
_ bJO
o r_
v

ODO<
F
L
I
J
i
L
\
A
"_o
l?
o_,_
on<>
5
(',I
fi
L
\
\
r.:
0
0_r
0
0c_
0
0
!
0
0
bO©
0
IIc_
11{J
L©
II
0
o_
•,...i
0
.oc_
_o"
18

..F
0_0
!___=
J
?
t
P
\
v
\\
_e
i •
0
i
0
•_ o0
o
a_
19

oo0
0
J
Z
\\\
_J
i•
!
i
HQ
2O

e.,
ODO_
!
I
!
: i!
' I
!
I •
I (
-q
.'-, 0
0
J
)
0
0
0
i
0
"0
o0
¢Q
0
I]_o
c5II
LO
II
0
0
0
o0
If
21

ODO_
IB
_J
L
_J
\
IIr
\
_e
i
|
0
!
d
o
22

i
_L
FE
\v
l
23
..-F
0 DO
{)
v
)
I
r_
Jo
o
0e'q
o
m
o
o
II
t,t
I"--
I1
¢.)
o
o
o
r_
o
_o"
24

on<>
i
\
/
\
i'
i•
i
0
JJ
0
25

ODO
J
)
\\
\
O1
0"
!
!
|
i
o!
i
"7
a
"7,
O1
O
C_
_x0
o
v
26

!
ODO<_
j d
'T
0
0ce_
0
0
0
i
e_
0
,,-q
00
er
c5tt
0
I1e_
_q
tl
0
0
0
"d
0
cD
2T

!
ooO_A
!
i -\O_
L_
(',1
C4
o.
!
o_
C4
i
i
28

i
FJ
%_
j'
o
!
!
o
o6
o
O_
%-
29

oDO_
°I !
#
8
0
0
0
0
H
II
II
0
Q
e_
30

ooO_Ao
i
ee_
It4
C_
i
i
C_
O
i
(D
_0
n_ o
bqO
P_
.o
31

ODO_
J
r_
\.i
_=_
_+!
II
0
32
!
OOO_
I,
i
i,
J
o
e_
C)
!
o
0
c5
11
_o
0
0
.o
= il
0
33

i
0
6
'T
i
! -
Ii
] -
I
I -
(N
\
|
0
0
0
i
_t 0
0
!
0
3c_ c_
34

I
!
_f
l
!
0
i
i
0
o
v
35

L.
!
r u
r"
J
X
\ !
q)
_b
,.o
L_
IJ
o_
36

.J=
o00_
]--
!
y_
_J
y_
_J
0
i
C:>
0
o!
0
°,._
©
0_
v
_7
"0
ooO_
---_'k
O0
\
!
0
i
i
.-I
_J
"0
d
_.>
o
v
38

o00_A n
E
I[
i
o.
0
0
0
0
0
0
0
!
II
N
L'D
11
00
0
,,--.-t
o
.,o II
39

_D _f
_J
C4
!
r__J
"0
ir
r_
L_D
rr
_o
O0
_J
cO
b_
4O

o oO<A _
-iJ
c_
&
C_
c_
C_
|
i
d
II
II
©
0
_ tt
o
a_ d
41

5
: I_f
J
P--4
0
\
cJ
0
0
0
0
0
i
0
0
i
II
_J
L©
II
0_
00
0
= II
_ o _
0_:_
L©
42

inac, deg
o 0
Tc
140
130
120
110
100
90
80
70
60
50
40
30
20
10
/o11
I I ,,, I I
0 2000 4000 6O00 8000
/
li
//
I I I I
10000 12000 14000 16000
rpm
Figure 16. Thrust variation with rpm for cruise configuration at static conditions.
43
0011
q
v
C4
C_
"_.L_'ou
o_
_8
o o
.-_
44
ODem
I
J
!
d
d
II
II
0
©
0
0
45

oDO_
dJ
\
0
0
\
0
0
0
i
0
_o
I
00
II
0
L_
II
,-_
0
©
=_ Jt
oo
46

OOO_A
\k
O
0
!
i
c_
©
47

omO_A
C_4
O
\ !
!
rl
0
0_
_=
L_
0_
0
48

!
ODO_
CJ
00
Q
"7
!
II
0
0
49

!
-J
D
t
Jl
II
©
_+_
5O

"0
..'4
I
If_
>-0
_J
l
i
"0
o
51
o DOrA _
_r
J
J
\
cJ
t'N
i
0
!
_0
"0
r
H
O
©
o_
52

o D 0.,_ zl ,_
Td_
.v,'f
d
00
c'..I
i
rj
ch
o "d
cq
,..0
53
8
,-, 0
oo0_
I
|
_J-IJ _J
q(-q
0
0
0
0
0
0
!
0
0
i
r
u-j
II
0
00
,.._ ,-_0
0
,x=
q_
.c5
54

ODO_
I I
B
i
!
O
O _
_o
O II
55

o _,_ _,_,__i
ooOazla
_J
_J
!
56

5
o rio _ .,,i ,,'1
!LI
{{J
!¢,1
,.1
o "88"
c,!
!
LO
II
_o
o tl
I'---
57

_J-IJ
_d
\
I
o
i "
0
0
C_
II
©
II
II
II
4.m
o
©
0
bid
©
b:
58

°ttl
7_
J_--'1
0 O<>_
J
r.=
o
!
o
t_
v
59

a, deg
-10
0
10
20
0
-.2
ACm -.4
f
-.6
-.8
AC D .4
.2
0 1 -- -1 ..... 1..... -1..... -.I..... -I...... ""_'_"_-
.6
.4
0
-.2-10 -9 -8 -7 -6 -5 -4 -3 -2 -1 0
Ainao deg
(a) Propeller speed = 11 000 rpm.
Figure 28. Relative effect of nacelle inclination on aerodynamic characteristics for q = 15 lb/ft 2, x/c = 0.60,
z/c = 0.25, and _y = 60 °.
60

0c,deg
-1001020
ACm
0
-.2
-.4
.8
ACD
.6
.4
.2
0
r T T _""'- ! .L_...
.6
ACL
.4
-.2-10 -9 -8 -7 -6 -5 -4 -3 -2 -1 0
Ainac, deg
(b) Propeller speed = 14 000 rpm.
Figure 28. Concluded.
61

a, deg
-10
0
10
20
ACm
-.2
-.4
i, S
.8
.6
ACD .4 ...... -"--
0i
.6
AC L
/"2=-----__L _L
0
-,2
-10 -9 -8 -7 -6 -5 -4 -3 -2 - 1 0
Ainac, deg
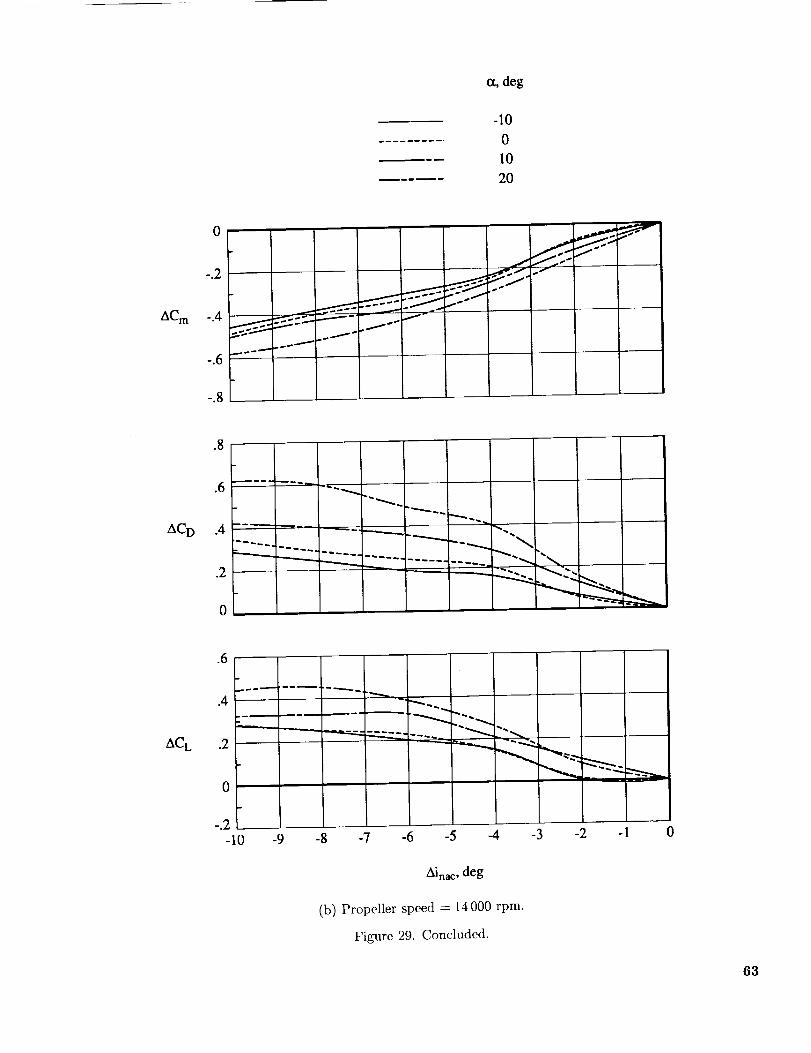
(a) Propeller speed = 11 000 rpm.
Figure 29. Relative effect of nacelle inclination on aerodynamic characteristics for q = 15 lb/ft 2, x/e = 0.60,z/c = 0.30, and 6f = 60 °.
62
IX,deg
-1001020
AC m
0
-.2
-.4
-.6
-.8
J
.8
AC D
.6
.4
.2
,5C L
.6
.4
.2
0
-.2
-10
z_..__..
.......
-9 -8 -7 -6 -5 -4 -3 -2 -1 0
Ainac, deg
(b) Propeller speed = 14 000 rpm.
Figure 29. Concluded.
63

Oqdeg
ACm
-.2
-.4
-10
0
10
20
.8
ACD
.6
.4
0
ACL
.6
.2
0
-9 -,8 -7 -6 :5 -4 -3 -2 - 1 0
Ainac, deg
(a) Propeller speed : 11 000 rpm.
Figure 30. Relative effect of nacelle ineiination on aerodynamic characteristics for q = 15 lb/ft 2, x/c = 0.75,z/e : 0.30, and 6f = 60 °.
64

_X,deg
-lO
0
10
2O
aCm
-.2
L
-.4
-.8
.8
.6
AC L
"4_:_ =_---_'_ ::-; "
o"_:z r.__22---"_ -'_
-.2
-I0 -9 -8 -7 -6 -5 -4 -3 -2 -I 0
Ainac, deg
(b) Propeller speed = 14 000 rpm.
Figure 30. Concluded.
65

a, deg
ACm -.4
-.6
-.8
.8
.6
AC D .4
°2 __I_
0
-- -- .--__....
.6
ACL
.4
.2
0
-,2
-10 -9 -8 -7 -6 -5 -4 -3 -2 -1 0
Ainac, deg
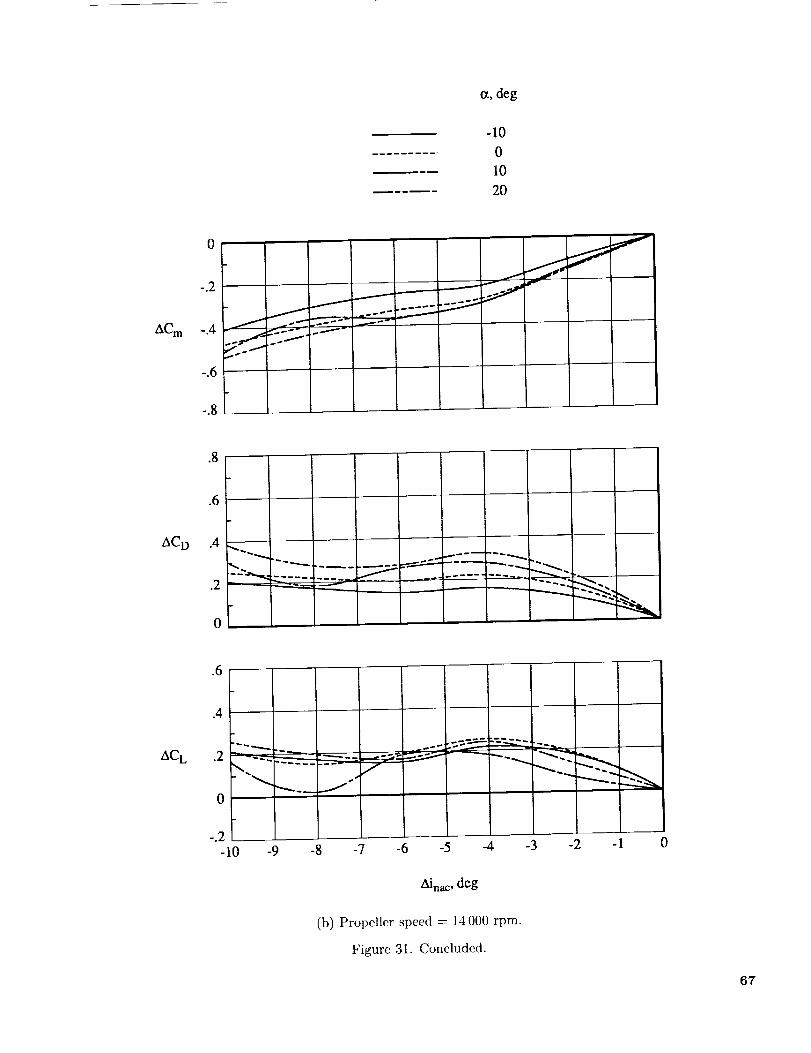
(a) Propeller speed = 11 000 rpm.
Figure 31. Relative effect of nacelle inclination on aerodynamic characteristics for q = 15 lb/ft 2, x/c = 0.75,z/c = 0.25, and _f = 60°.
66
_X,deg
-10010
2O
ACrn
0
-.2
-.4
-.6
-°8
j1 Jv
r I
f
.8
.6
ACD .4
.2
I
.6
AC L
.4
0
-.2
-10 -9 -8 -7 -6 -5 -4 -3 -2 -1 0
Ainac, deg
(b) Propeller speed = 14 000 rpm.
Figure 31. Concluded.
67


Form Approved
REPORT DOCUMENTATION PAGE OMB No 0704-0188
PuNic reporting burden for this collection of information is estimated to average 1 hour per response, including the time for reviewing instructions, searching existing data sources,gathering and maintaining the data needed, and completing and reviewing the collection of information. Send comments regarding this burden estimate or any other aspect of th;scollection of information, including suggestions for reducing this burden, to Washington Headquarters Services, Directorate for Information Operations and Reports, 1215 JeffersonDavis Highway, Suite 1204. Arlington, VA 22202-4302, and to the Office of Management and Budget. Paperwork Reduction Project (0704-0188), Washington, DC 20503
1. AGENCY USE ONLY(Leave blank) 2, REPORT DATE 3. REPORT TYPE AND DATES COVERED
April 1994 Technical Memorandum
4. TITLE AND SUBTITLE 5. FUNDING NUMBERS
Aerodynamic Characteristics of a Propeller-Powered
High-Lift Semispan Wing WU 535-03-10-02
6. AUTHOR(S)
Carl L. Gentry, Jr., M. A. Takallu, and Zachary T. Applin
7. PERFORMING ORGANIZATION NAME(S) AND ADDRESS(ES)
NASA Langley Research Center
Hampton, VA 23681-0001
9. SPONSORING/MONITORING AGENCY NAME(S) AND ADDRESS(ES)
National Aeronautics and Space Administration
Washington, DC 20546-0001
8. PERFORMING ORGANIZATION
• REPORT NUMBER
L- 17259
10. SPONSORING/MONITORING
AGENCY REPORT NUMBER
NASA TM-4541
1]. SUPPLEMENTARY NOTES
Gentry and Applin: Langley Research Center, Hampton, VA; Takallu: Lockheed Engineering & SciencesCompany, Hampton, VA.
12a. DISTRIBUTION/AVAILABILITY STATEMENT
Unclassified Unlimited
Subject Category 02
12b. DISTRIBUTION CODE
13. ABSTRACT (Maximum 200 words)
A small-scale semispan high-lift wing-flap system equipped under the wing with a turboprop engine assemblywas tested in the Langley 14- by 22-Foot Subsonic Tunnel. Experimental data were obtained for various
propeller rotational speeds, nacelle locations, amt nacelle inclinations. To isolate the effects of the high-lift system, data were obtained with and without the flaps and leading-edge device. The effects of the
propeller slipstream on the overall longitudinal aerodynamic characteristics of the wing-propeller assembly
were examined. Test results indicated that the lift coefficient of the wing could be increased by the propellerslipstream when the rotational speed was increased and high-lift devices were deployed. Decreasing the nacelIe
inclination (increased pitch down) enhanced the lift performance of the system much more than varying thevertical or horizontal location of the nacelle. Furthermore, decreasing the nacelle inclination led to higher lift
curve slope values, which indicated that the powered wing could sustain higher angles of attack near maximumlift performance. Any lift augmentation was accompanied by a drag penalty due to the increased wing lift.
14. SUBJECT TERMS
Turboprop; Propulsion integration; High lift
17. SECURITY CLASSIFICATION
OF REPORT
Unclassified
_JSN 7540-01-280-5500
18. SECURITY CLASSIFICATION 19. SECURITY CLASSIFICATION
OF THIS PAGE OF ABSTRACT
Unclassified
i15. NUMBER OF PAGES
68
16. PRICE CODE
A04
20. LIMITATION
OF ABSTRACT
Standard Form 298(Rev. 2-89_Prescribed by ANSI Std Z30-lB298-t02
