aeps ahmed khater, md, phd ass. prof. of audio-vestibular medicine consultant audiologist head of...
TRANSCRIPT

AEPs
Ahmed Khater, MD, PhDAss. Prof. of audio-vestibular
medicineConsultant audiologist
Head of cochlear implant Program

Evoked potentials (EPs), or evoked
responses, measure the
electrophysiological responses of the
neural cells to a variety of stimuli.


Audio-vestibular Evoked Potentials
From the vestibular
nerve
From the auditory nerve
From the OHCs
VEMP
OAEs
Early, middle & late AEPs

Auditory evoked potentials span
activity from the full length of the
auditory pathway, from cochlear hair
cells to cerebral cortex, as well as
activity associated with cognitive
processing auditory stimuli.

Indications Threshold detection
For intra-operative monitoring
Diagnosis of site-of-lesion.
Neonatal screening
CAPD
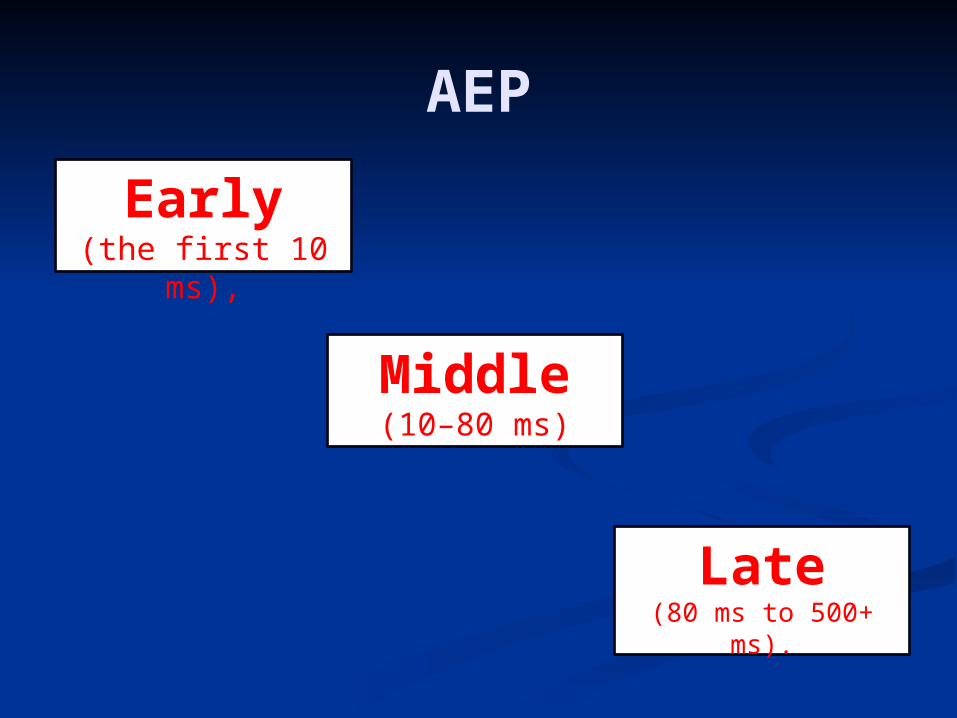
AEP
Early(the first 10 ms),
Middle(10–80 ms)
Late(80 ms to 500+ ms).


Auditory brainstem response (ABR) peaks denoted by Roman numerals; I, II, III, IV, V, VI, VII
Middle latency response (MLR) are indicated by Po, Na, Pa, Nb, and Pb
Auditory late response (ALR) are indicated by P1, N1, P2, and N2.

AEP
Exogenous
Endogenous
Mesogenous

Exogenous: conditions external to the listener (e.g. stimulus intensity or duration). Mesogenous AEPs fall somewhere in between exogenous and endogenous as both external and internal conditions can affect the response eg. MLR. Endogenous conditions internal to the listener (e.g. attention, vigilance)

Latency & Amplitude
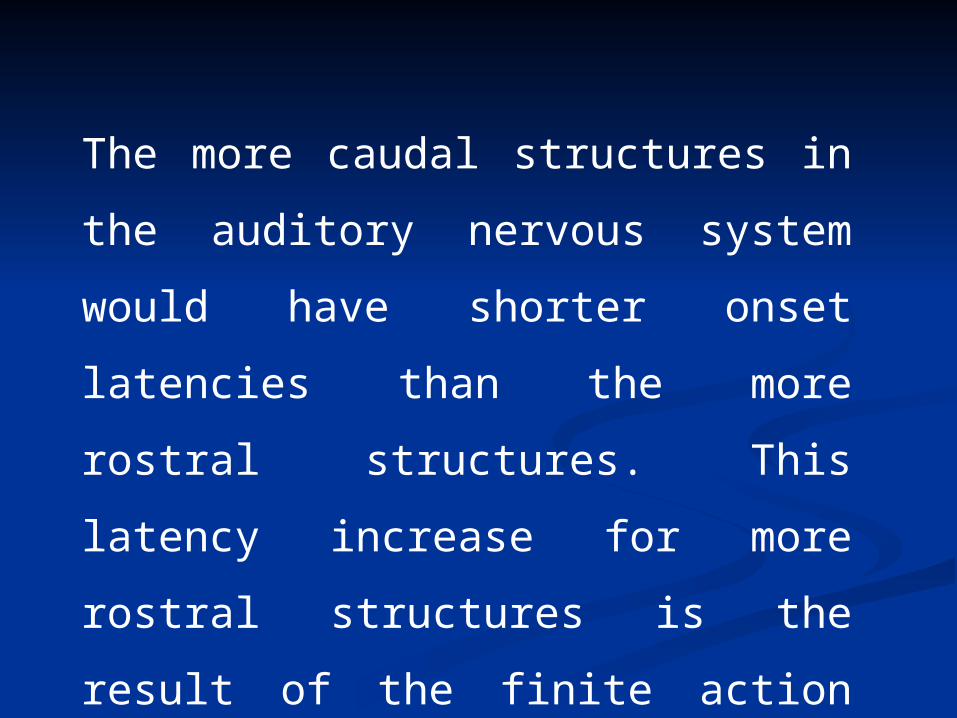
The more caudal structures in the
auditory nervous system would
have shorter onset latencies than
the more rostral structures. This
latency increase for more rostral
structures is the result of the finite
action potential conduction
velocity and the delay as the
activity passes through chemical
synapses.

Following presentation of an acoustic
stimulus, We can record activity in the
cochlea, auditory nerve, auditory
brainstem, medial geniculate body,
and auditory cortex.

Acoustic stimulus
Subject
Bioamplifier
4- Signal
Averaging
1- Filtering
2- Artifact
rejection
3- A-C converter
Computer
Traces
Diagram of AEP

Stimulus 1- Tone Burst
(long duration, long rise/fall times, and
a very narrow spectrum)
2- Click
(short duration, very fast rise/fall times,
and very broad spectrum).

Recording1- Scalp preparation (Water)2- Electrode connection: - Noninverting lead is the positive or the active lead. - Inverting lead is the negative or the reference lead - The common lead is the ground

All are measured through scalp
electrodes EXCEPT
electrocochleography, the ECoG
responses are typically NOT measured
with scalp electrodes, but rather from
electrodes placed in the ear canal, on
or near the tympanic membrane, or on
the promontory or round window of
the inner ear
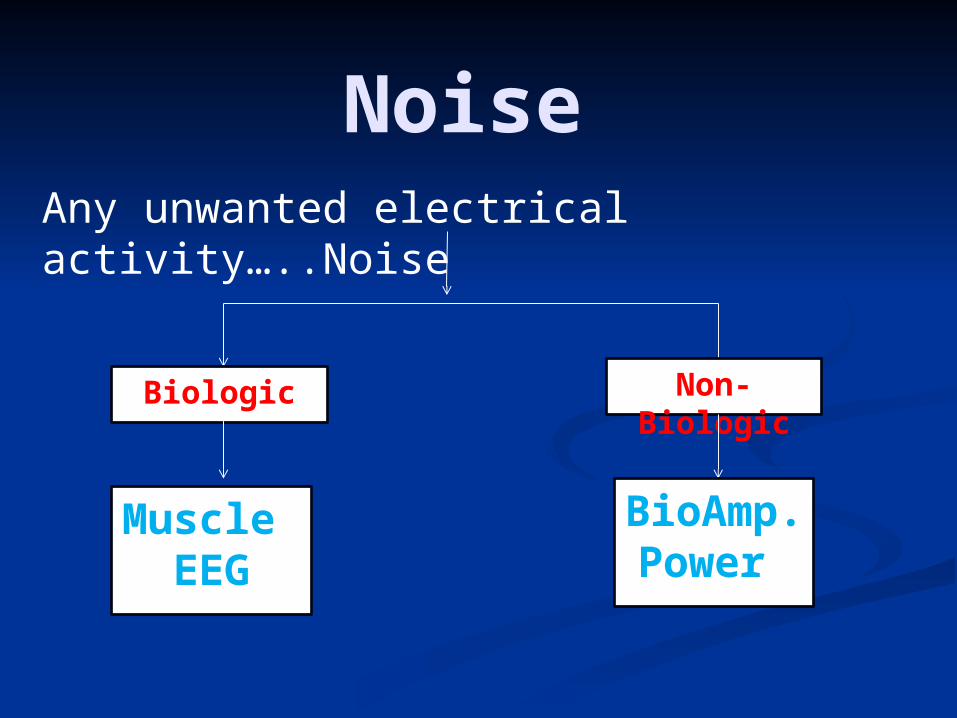
NoiseAny unwanted electrical activity…..Noise
Biologic Non-Biologic
Muscle EEG
BioAmp.
Power

Noise Reduction1- Low electrode impedances.2- Making the subject comfortable and encouraging them to sleep.3- Filtering the output of the bioamplifier can reduce noise. 4- Signal averaging reduces unwanted background noise.5- Light off.

Filters
Low pass filter
High pass filter
Band pass filter
Band rejectfilter

Electrocochleography (ECoG) refers to the responses from the cochlea and auditory nerve, using a recording electrode located in close proximity to the inner ear.
Labeling: CM, SP, AC


The auditory brainstem response
(ABR), as its name indicates, is a
series of five to seven peaks arising
from auditory nerve and brainstem
structures occurring within 10 ms of
the onset of a moderate-intensity click
stimulus.
Labeling: Wave I to VII


MLRs are usually recorded over a time window of 80 to 100 ms. Generators are thought to include thalamus and auditory cortex.
Labeling: (e.g., Pa, Nb, etc.).


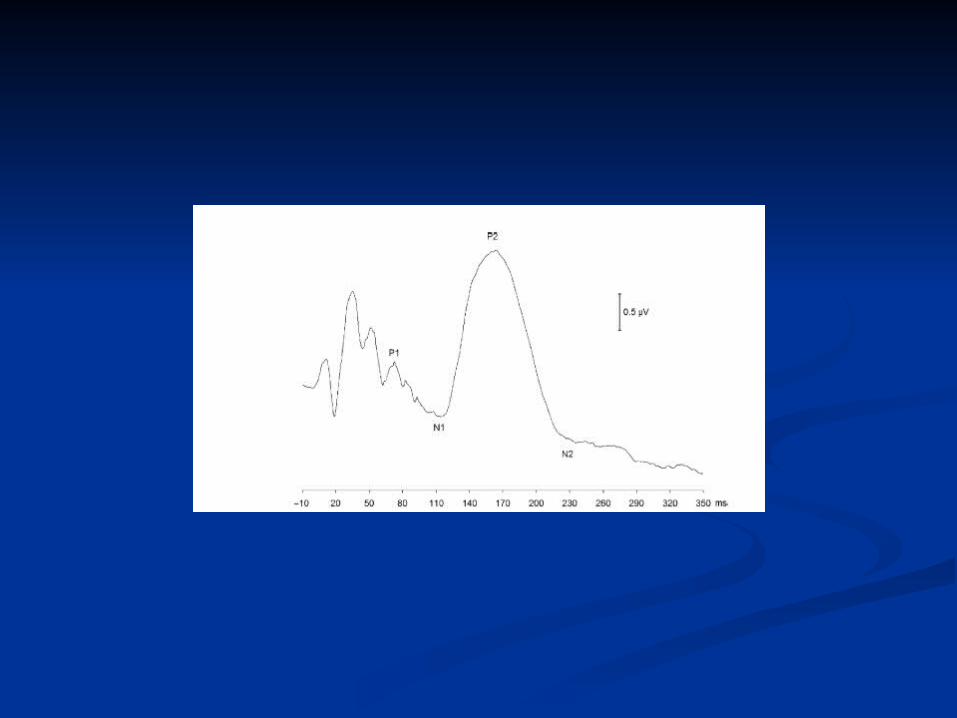
LLR: AEP responses occurring beyond roughly 75 ms. These responses are commonly labeled with a capital N or P (e.g., P1 is the first positive SVP peak). OR N200 would be the negative peak with a mean latency of 200 ms.
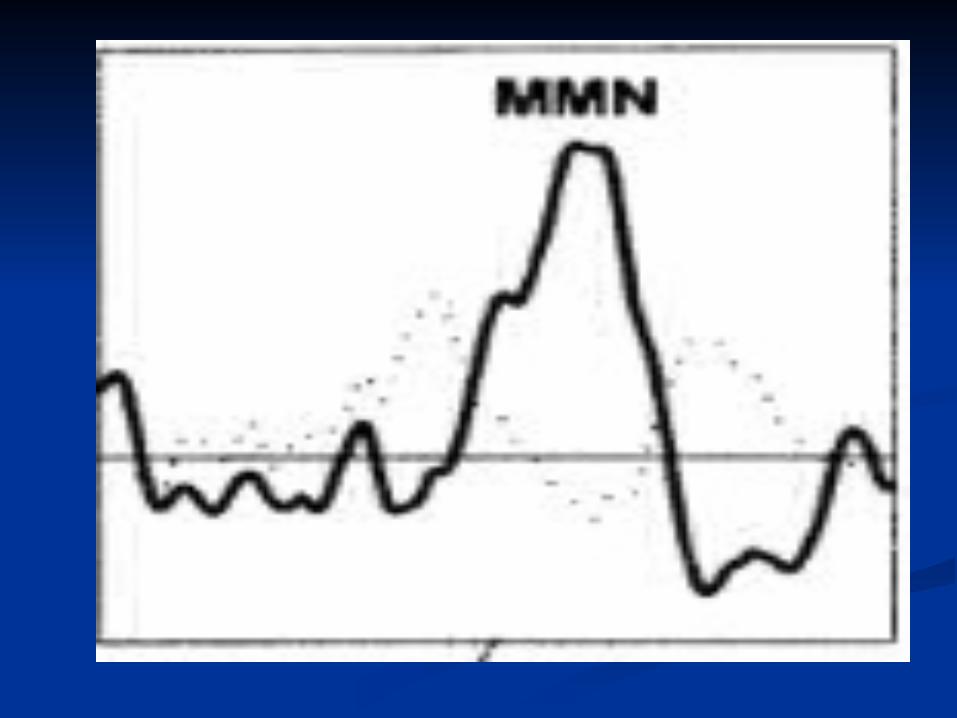
There are differences in the responses to the frequent and infrequent stimuli used as an index of a cognitive construct that is related to attention.
If attending………P300
If not attending….MMN


VEMP


OAEs
Otoacoustic emissions (OAEs) are sounds measured in the external ear canal that reflect movement of the outer hair cells in the cochlea.


EP & MRIThe basic difference between the 2
studies is as follows: MRI largely remains an imaging,
structural, or anatomic test and therefore gives more accurate information about structural problems
EP testing assesses functionality and thus supplies information about the physiology of a certain anatomic pathway.
In some circumstances, MRI and EP studies may be complementary.
