aeon credit (asia) - asian banks
TRANSCRIPT
.Top = 0 .16
.LEFT = 5 .84
hgh
Aeon Credit (Asia) has been all but abandoned by investors
due to (justifiable) fears about consumer credit losses in
Hong Kong. However, stable margins and scale in a
consolidating market make Aeon worth another look.
Initiating Coverage
Initiating coverage
Hong Kong
HK$2.38 2/10/02
7 October 2002
Buy
Share data
Market cap (US$m) 127.5
No of shares (m) 418.7
Daily turnover (US$m) 0.7
Free float (%) 34.8
52-week hi/lo (HK$) 2.30-3.45
Price performance (%)
Relative
Absolute to HSI
1m -7.7 0.6
3m -22.6 -8.8
12m -4.0 5.8
Aeon Credit (Asia)
Paul Sheehan
Hong Kong (852) 2913 8580
Christina Fok
Hong Kong (852) 2913 8042
Financial data
FY02 FY03F
ROE (%) 21.58 12.54
Core ROE (%) 15.25 10.43
ROA (%) 6.54 4.34
Core ROA (%) 4.62 3.61
BVPS (HK$) 2.52 2.70
Adj. BVPS (HK$) 2.52 2.70
More losses to come ... Aeon is a pure consumer finance company,
and as such, has been hit hard by rising customer delinquencies.
Charge-offs have risen from 240bp of average loans two years ago to
351bp in the most recent period, decimating core earnings.
... but momentum will resume. The company has taken steps to
improve its business by focusing on affiliate relationships and hire
purchase, while formulating an intriguing China strategy that offers
upside with very low risk. Core income will recover in FY04–05.
Valuation is attractive. The bad news about Aeon’s business is well
known, but credit costs are peaking and returns should improve. Aeon’s
valuation, at 0.9x book value and 5.9x FY04F EPS, is too low given an
ROE that consistently beats its cost of capital.
__
Forecasts and ratings
Yr to Feb 02 03F 04F 05F
Core income (HK$m) 149.1 117.9 167.7 208.3
Net profit (HK$m) 211.0 141.8 167.7 208.3
EPS (HK$) 0.50 0.34 0.40 0.50
EPS growth (%) 0.5 -32.8 18.3 24.2
PER (x) 4.71 7.02 5.93 4.77
Core PER (x) 6.67 8.44 5.93 4.77
P/BV (x) 0.94 0.88 0.81 0.73
DPS (HK$) 0.13 0.13 0.15 0.19
Yield (%) 5.5 5.5 6.3 7.9
Source: Company data, ING estimates
HK$2.94 (+23.5%)
900 HK/900.HK
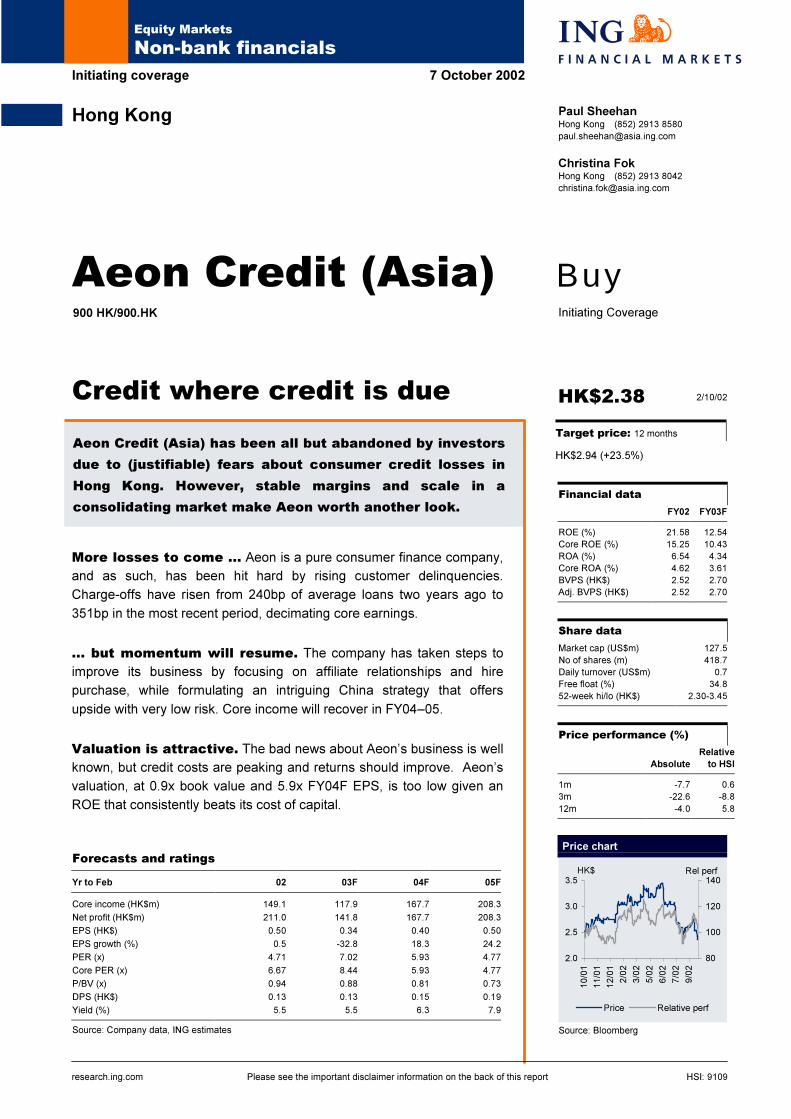
Price chart
2.0
2.5
3.0
3.5
10/01
11/01
12/01
2/02
3/02
5/02
6/02
7/02
9/02
HK$
80
100
120
140
Price Relative perf
Rel perf
Source: Bloomberg
research.ing.com HSI: 9109
Target price: 12 months
Credit where credit is due
Equity Markets
Non-bank financials
Please see the important disclaimer information on the back of this report
2
Aeon Credit (Asia)
October 2002
Contents
Executive summary 3
Consumer finance 4
Credit cards .............................................................................................................. 4
Hire purchase ........................................................................................................... 7
General instalment lending ....................................................................................... 9
Corporate strategy 10
Jusco – The China card.......................................................................................... 10
An outsourcing beneficiary ..................................................................................... 11
Potential M&A......................................................................................................... 12
History and structure 13
History..................................................................................................................... 13
Ownership............................................................................................................... 13
Network................................................................................................................... 13
Rates and margins 14
Asset quality 17
Reserve adequacy.................................................................................................. 18
Information sharing will benefit Aeon...................................................................... 20
Earnings and forecasts 21
Core versus non-core earnings .............................................................................. 23
Valuation 24
Valuation at current price........................................................................................ 24
High dividend yield.................................................................................................. 24
Valuation at target price.......................................................................................... 25
Sector comparison.................................................................................................. 25
3
Aeon Credit (Asia)
October 2002
Executive summaryExecutive summaryExecutive summaryExecutive summary
Pure consumer finance player.
Aeon is the #3 card issuer in Hong Kong, behind Standard Chartered and HSBC/Hang
Seng. All of the company’s other business is consumer-related as well, consisting
primarily of hire purchase and instalment lending. Although consumer finance in Hong
Kong has been hit hard by economic weakness and changes in the Bankruptcy Act, it is
important to bear in mind that the business is sustainable in the long term for players
with sufficient scale.
Asset quality is a major risk ...
Charge-offs on credit card portfolios in Hong Kong are at historic levels – at a 13%
annualised rate for the industry in 2Q02 – and we expect them to have risen through
the third quarter. By comparison, Korean card companies’ credit costs are less than
half of this level, but already high enough to spook investors. Are we, then, barking mad
to buy a pure play in this market?
... but one that is fully priced in.As to madness, clearly, we think not: losses on Aeon’s portfolio are being taken on the
P&L as incurred, reserves are adequate and increasing, and the portfolio of over-
levered borrowers is burning itself out. Meanwhile, a poor market has removed pricing
pressure and will force marginal competitors to exit.
Margins are stable.Interest margins are high and show little sign of deterioration – particularly since most
bank competitors are becoming more risk-averse and minimising their exposure to the
sector. Falling interest rates (and Aeon’s currently excessive funding costs) will cushion
the remaining competitive pressure to maintain strong net interest income.
Shift to middle-class lending lowers risk profile.
Aeon’s client base is increasingly middle class and acquired through hire purchase
accounts or affinity cards. This client base is more price sensitive, but is also
considerably more credit-worthy – and thus more profitable overall.
China strategy could be a winner.
The company is following its affiliate Jusco Stores into the mainland market, and will
earn fees by handling instalment loan servicing without taking credit risk, pending
Aeon’s approval for a licence. This is a low-risk entry into a potentially large market.
Valuation is low.
Aeon will more than earn its 12% cost of capital even at the bottom of the credit cycle
(and in a poor economy), yet the company trades at less than 1x book value. On PERs
of 7x for FY03F and 6x for FY04F, we see substantial upside to our target price of
HK$2.94, which is based on 1.08x book value.
4
Aeon Credit (Asia)
October 2002
Consumer financeAeon’s primary business is consumer finance, which the company offers through three
major product groupings: credit cards; hire purchase; and instalment finance.
Credit cardsAeon is the fourth-largest credit card issuer in Hong Kong (third-largest if HSBC and
Hang Seng are combined), with approximately 800,000 cards in issue.
Card receivables account for 79% of total loans, although the company has been
reducing its emphasis on some types of card extension as a consequence of the
parlous credit environment._
Fig 1 Hong Kong credit card market share: 2Q02
Credit card
Institution market share (%)
StanChart 23
HSBC (HongkongBank only) 18
Hang Seng 9
Aeon Credit 8
DSF 7
BEA 6
Source: Reuters, Company data, ING estimates
_
The company issues cards under three main programmes: house cards; affiliate cards;
and charity cards.
House cards. House cards are Aeon’s own branded MasterCard, Visa, and
American Express offerings, as well as the more fashion-oriented Batman and
Hello Kitty Mastercards. Customers use house cards mainly for cash advance
purposes, one reason why Aeon has de-emphasised marketing of these products.
Affiliate cards. Affiliate cards are issued in conjunction with retailers such as Jusco
(a corporate cousin of Aeon HK and the source of approximately half of the card
portfolio), and offer customers lower interest rates (see Figure 2) and special
discounts at the affiliated merchant. Merchants are happy to promote the cards, as
their customers can buy more with Aeon’s financing; however, they do not have
any direct stake in the card revenues nor do they have any role in credit approval.
Affiliate card customers have significantly better credit characteristics than house
card customers – one reason why this area is Aeon’s main focus.
Charity cards. Charity cards are a special type of affiliate programme under which
the designated charity receives 25% of the annual fee (which is, however, four
times the rate of Aeon’s house cards) and 0.1% of overall charge volume.
Aeon punches above its
weight in credit cards,
coming in behind Hang
Seng but ahead of Dah
Sing in market share
5
Aeon Credit (Asia)
October 2002
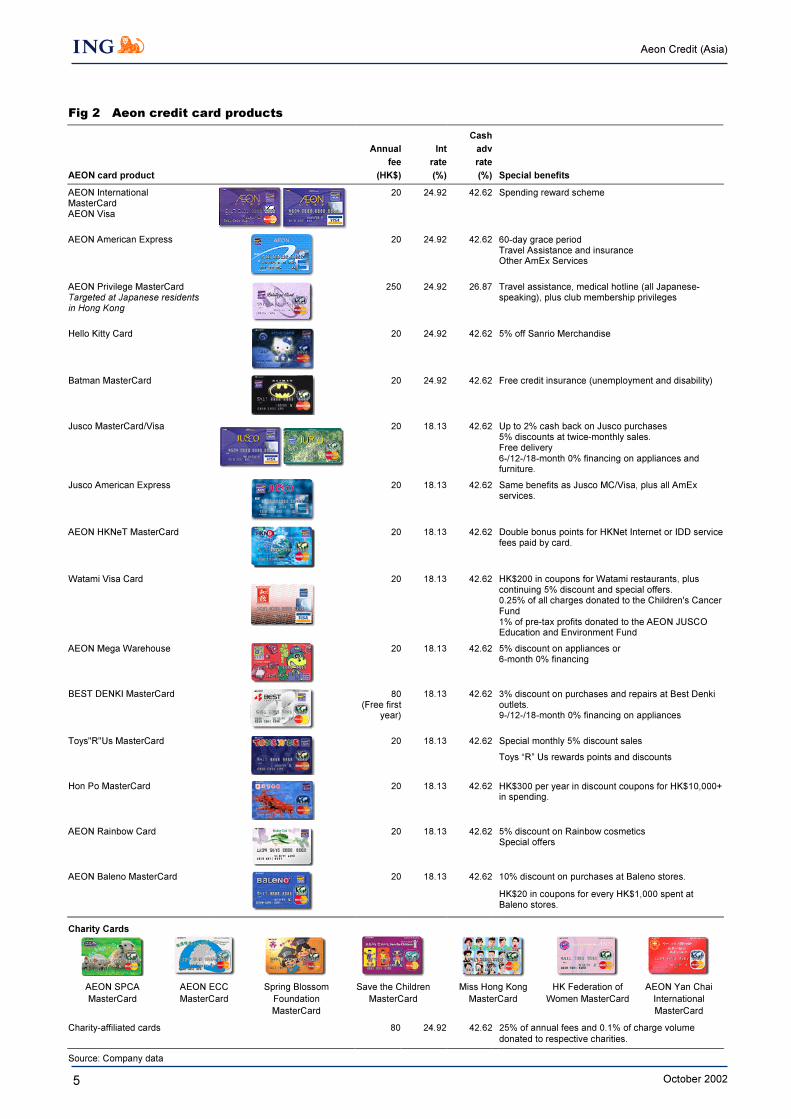
Fig 2 Aeon credit card products
AEON card product
Annual
fee
(HK$)
Int
rate
(%)
Cash
adv
rate
(%) Special benefits
AEON InternationalMasterCardAEON Visa
20 24.92 42.62 Spending reward scheme
AEON American Express 20 24.92 42.62 60-day grace periodTravel Assistance and insuranceOther AmEx Services
AEON Privilege MasterCardTargeted at Japanese residentsin Hong Kong
250 24.92 26.87 Travel assistance, medical hotline (all Japanese-speaking), plus club membership privileges
Hello Kitty Card 20 24.92 42.62 5% off Sanrio Merchandise
Batman MasterCard 20 24.92 42.62 Free credit insurance (unemployment and disability)
Jusco MasterCard/Visa 20 18.13 42.62 Up to 2% cash back on Jusco purchases5% discounts at twice-monthly sales.Free delivery6-/12-/18-month 0% financing on appliances andfurniture.
Jusco American Express 20 18.13 42.62 Same benefits as Jusco MC/Visa, plus all AmExservices.
AEON HKNeT MasterCard 20 18.13 42.62 Double bonus points for HKNet Internet or IDD servicefees paid by card.
Watami Visa Card 20 18.13 42.62 HK$200 in coupons for Watami restaurants, pluscontinuing 5% discount and special offers.0.25% of all charges donated to the Children's CancerFund1% of pre-tax profits donated to the AEON JUSCOEducation and Environment Fund
AEON Mega Warehouse 20 18.13 42.62 5% discount on appliances or6-month 0% financing
BEST DENKI MasterCard 80(Free first
year)
18.13 42.62 3% discount on purchases and repairs at Best Denkioutlets.9-/12-/18-month 0% financing on appliances
Toys"R"Us MasterCard 20 18.13 42.62 Special monthly 5% discount sales
Toys “R” Us rewards points and discounts
Hon Po MasterCard 20 18.13 42.62 HK$300 per year in discount coupons for HK$10,000+in spending.
AEON Rainbow Card 20 18.13 42.62 5% discount on Rainbow cosmeticsSpecial offers
AEON Baleno MasterCard 20 18.13 42.62 10% discount on purchases at Baleno stores.
HK$20 in coupons for every HK$1,000 spent atBaleno stores.
Charity Cards
AEON SPCA
MasterCard
AEON ECC
MasterCard
Spring Blossom
Foundation
MasterCard
Save the Children
MasterCard
Miss Hong Kong
MasterCard
HK Federation of
Women MasterCard
AEON Yan Chai
International
MasterCard
Charity-affiliated cards 80 24.92 42.62 25% of annual fees and 0.1% of charge volume
donated to respective charities.
Source: Company data
6
Aeon Credit (Asia)
October 2002
_
Card revenue sources
Interest and fees on credit cards account for 84% of Aeon’s gross revenues. Revenues
from customers are earned through annual card fees (ranging from HK$20-250) and
interest on revolving balances (18.13-42.62% APRs).
In addition, the company receives fees levied on merchants that accept the cards,
amounting to approximately 1% of gross charge volume. Although MasterCard, Visa,
and American Express all have different posted merchant fee schedules
(approximately 2.5% for the interbank associations versus 4% for AmEx), Aeon
management reports that discounting and special offers for specific classes of
merchants are so common that the company receives approximately the same
revenue from each type of card, and so has no incentive to prefer one over the others.
7
Aeon Credit (Asia)
October 2002
Hire purchase
Aeon’s hire purchase business is comprised of a legacy auto finance business and a
continuing appliance and computer HP effort that is one of the company’s main
customer acquisition tools._
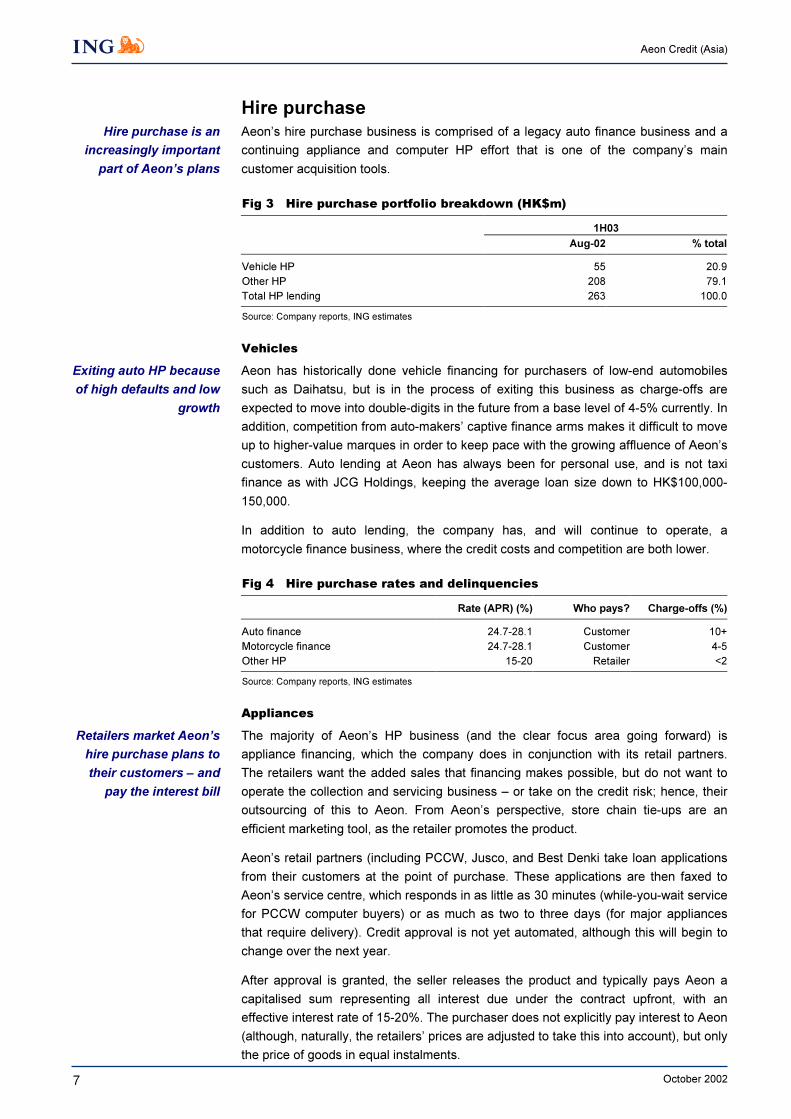
Fig 3 Hire purchase portfolio breakdown (HK$m)
1H03
Aug-02 % total
Vehicle HP 55 20.9
Other HP 208 79.1
Total HP lending 263 100.0
Source: Company reports, ING estimates
_
Vehicles
Aeon has historically done vehicle financing for purchasers of low-end automobiles
such as Daihatsu, but is in the process of exiting this business as charge-offs are
expected to move into double-digits in the future from a base level of 4-5% currently. In
addition, competition from auto-makers’ captive finance arms makes it difficult to move
up to higher-value marques in order to keep pace with the growing affluence of Aeon’s
customers. Auto lending at Aeon has always been for personal use, and is not taxi
finance as with JCG Holdings, keeping the average loan size down to HK$100,000-
150,000.
In addition to auto lending, the company has, and will continue to operate, a
motorcycle finance business, where the credit costs and competition are both lower._
Fig 4 Hire purchase rates and delinquencies
Rate (APR) (%) Who pays? Charge-offs (%)
Auto finance 24.7-28.1 Customer 10+
Motorcycle finance 24.7-28.1 Customer 4-5
Other HP 15-20 Retailer <2
Source: Company reports, ING estimates
_
Appliances
The majority of Aeon’s HP business (and the clear focus area going forward) is
appliance financing, which the company does in conjunction with its retail partners.
The retailers want the added sales that financing makes possible, but do not want to
operate the collection and servicing business – or take on the credit risk; hence, their
outsourcing of this to Aeon. From Aeon’s perspective, store chain tie-ups are an
efficient marketing tool, as the retailer promotes the product.
Aeon’s retail partners (including PCCW, Jusco, and Best Denki take loan applications
from their customers at the point of purchase. These applications are then faxed to
Aeon’s service centre, which responds in as little as 30 minutes (while-you-wait service
for PCCW computer buyers) or as much as two to three days (for major appliances
that require delivery). Credit approval is not yet automated, although this will begin to
change over the next year.
After approval is granted, the seller releases the product and typically pays Aeon a
capitalised sum representing all interest due under the contract upfront, with an
effective interest rate of 15-20%. The purchaser does not explicitly pay interest to Aeon
(although, naturally, the retailers’ prices are adjusted to take this into account), but only
the price of goods in equal instalments.
Hire purchase is an
increasingly important
part of Aeon’s plans
Exiting auto HP because
of high defaults and low
growth
Retailers market Aeon’s
hire purchase plans to
their customers – and
pay the interest bill
8
Aeon Credit (Asia)
October 2002
Any credit losses are Aeon’s responsibility; there are no retailer charge-backs.
However, the company reports that, due to the short term and zero interest rate of
these contracts, charge-offs are below 2% on this portfolio. Additionally, the customer
data gleaned from these contracts is fertile ground for cross-selling additional products,
and thus bolsters Aeon’s database.
We see this portfolio as a key growth area for Aeon, as rising delinquencies should
force retailers that have been operating their own instalment finance plans to consider
outsourcing.
9
Aeon Credit (Asia)
October 2002
General instalment lending
In addition to credit cards and hire purchase, Aeon offers a variety of special purpose
and general purpose lending plans, typically at quite high rates and with high charge-
offs (12% average for personal lending). This strategy of attracting customers with
narrowly targeted offers allows Aeon to segment the market effectively. A sampling of
plans:
Education lending: The company offers education loans for both local and
overseas study on a secondary and university level. These loans range in amount
from HK$5,000 to HK$100,000, with tenors of up to 36 months and effective
interest rates of 12.3% (for short-term overseas study) to 28% (for long-term local
study). There are no payment deferrals during the term of study, as with a typical
US loan, and this combined with the short repayment period means that they are
aimed mainly at parents of students rather than at the students themselves.
General instalment and privilege lending: Aeon lends up to 6x the monthly
salary to consumers for general purposes. These loans are mainly for 18 months or
less for new customers, but can go up to 24 months for existing customers with
good repayment histories. As with JCG, these repeat customers earn lower interest
rates.
Mortgage lending: Aeon is not competitive with bank lending in the mortgage
arena, with rates of Prime -0.5%, versus as low as Prime -2.6% for banks. Even so,
at a 4.7% yield (albeit one with virtually no credit losses given a maximum 70%
LTV), this is not an exceedingly attractive product for Aeon given an average 7%
cost of funds. Aeon’s selling point has been that the company will finance
properties of any age, something that banks were once loath to do, but this
distinction has been erased as banks have become more desperate for growth.
Narrowly targeted
lending products let
Aeon pursue market
segmentation
10
Aeon Credit (Asia)
October 2002
Corporate strategy
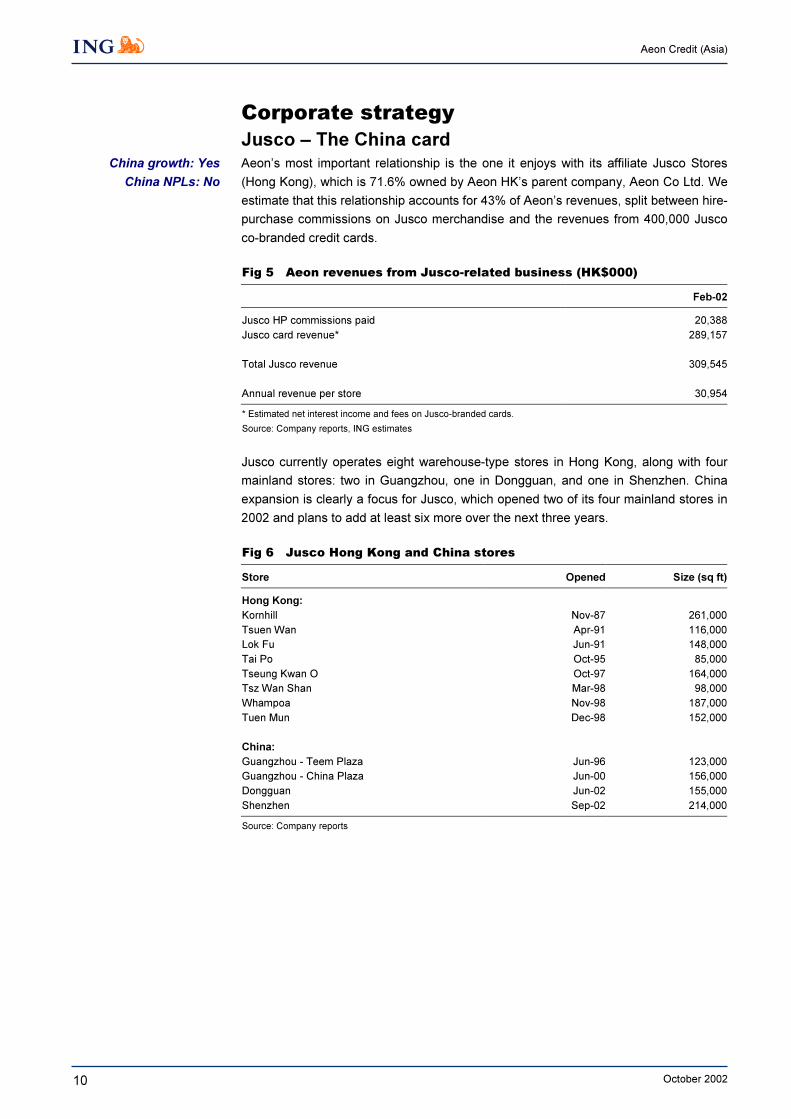
Jusco – The China cardAeon’s most important relationship is the one it enjoys with its affiliate Jusco Stores
(Hong Kong), which is 71.6% owned by Aeon HK’s parent company, Aeon Co Ltd. We
estimate that this relationship accounts for 43% of Aeon’s revenues, split between hire-
purchase commissions on Jusco merchandise and the revenues from 400,000 Jusco
co-branded credit cards._
Fig 5 Aeon revenues from Jusco-related business (HK$000)
Feb-02
Jusco HP commissions paid 20,388
Jusco card revenue* 289,157
Total Jusco revenue 309,545
Annual revenue per store 30,954
* Estimated net interest income and fees on Jusco-branded cards.
Source: Company reports, ING estimates
_
Jusco currently operates eight warehouse-type stores in Hong Kong, along with four
mainland stores: two in Guangzhou, one in Dongguan, and one in Shenzhen. China
expansion is clearly a focus for Jusco, which opened two of its four mainland stores in
2002 and plans to add at least six more over the next three years.
_
Fig 6 Jusco Hong Kong and China stores
Store Opened Size (sq ft)
Hong Kong:
Kornhill Nov-87 261,000
Tsuen Wan Apr-91 116,000
Lok Fu Jun-91 148,000
Tai Po Oct-95 85,000
Tseung Kwan O Oct-97 164,000
Tsz Wan Shan Mar-98 98,000
Whampoa Nov-98 187,000
Tuen Mun Dec-98 152,000
China:
Guangzhou - Teem Plaza Jun-96 123,000
Guangzhou - China Plaza Jun-00 156,000
Dongguan Jun-02 155,000
Shenzhen Sep-02 214,000
Source: Company reports
_
China growth: Yes
China NPLs: No
11
Aeon Credit (Asia)
October 2002
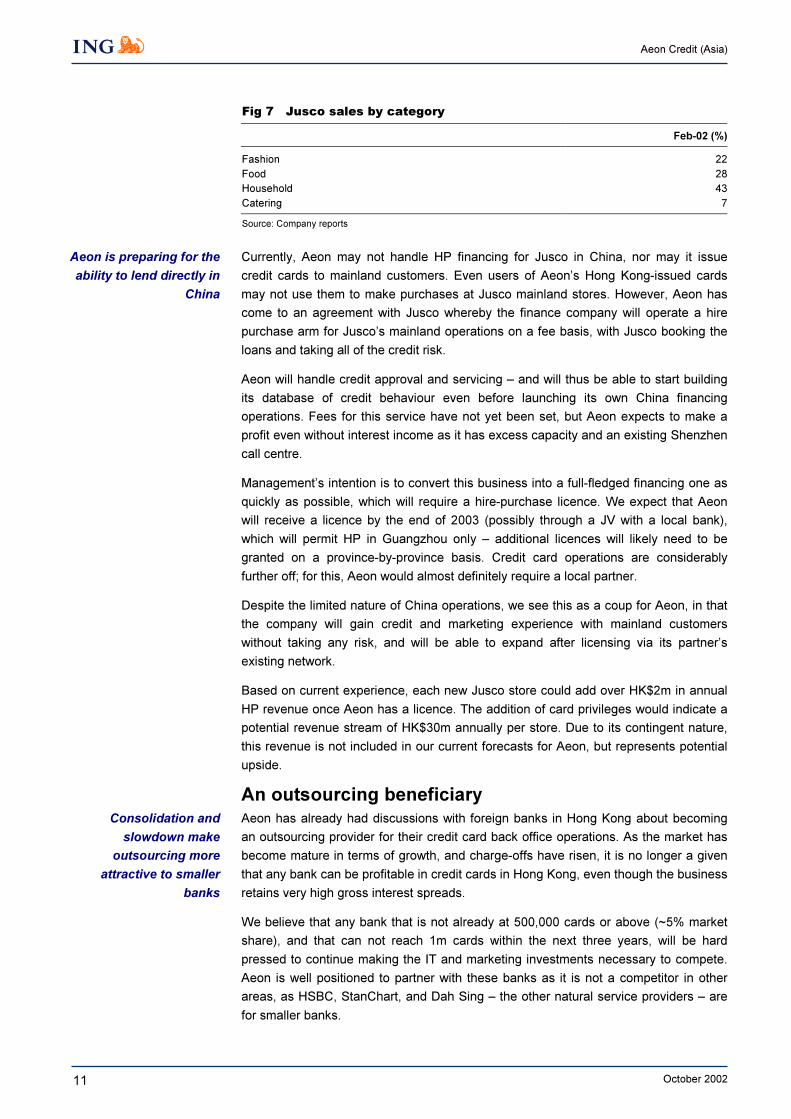
Fig 7 Jusco sales by category
Feb-02 (%)
Fashion 22
Food 28
Household 43
Catering 7
Source: Company reports
_
Currently, Aeon may not handle HP financing for Jusco in China, nor may it issue
credit cards to mainland customers. Even users of Aeon’s Hong Kong-issued cards
may not use them to make purchases at Jusco mainland stores. However, Aeon has
come to an agreement with Jusco whereby the finance company will operate a hire
purchase arm for Jusco’s mainland operations on a fee basis, with Jusco booking the
loans and taking all of the credit risk.
Aeon will handle credit approval and servicing – and will thus be able to start building
its database of credit behaviour even before launching its own China financing
operations. Fees for this service have not yet been set, but Aeon expects to make a
profit even without interest income as it has excess capacity and an existing Shenzhen
call centre.
Management’s intention is to convert this business into a full-fledged financing one as
quickly as possible, which will require a hire-purchase licence. We expect that Aeon
will receive a licence by the end of 2003 (possibly through a JV with a local bank),
which will permit HP in Guangzhou only – additional licences will likely need to be
granted on a province-by-province basis. Credit card operations are considerably
further off; for this, Aeon would almost definitely require a local partner.
Despite the limited nature of China operations, we see this as a coup for Aeon, in that
the company will gain credit and marketing experience with mainland customers
without taking any risk, and will be able to expand after licensing via its partner’s
existing network.
Based on current experience, each new Jusco store could add over HK$2m in annual
HP revenue once Aeon has a licence. The addition of card privileges would indicate a
potential revenue stream of HK$30m annually per store. Due to its contingent nature,
this revenue is not included in our current forecasts for Aeon, but represents potential
upside.
An outsourcing beneficiary
Aeon has already had discussions with foreign banks in Hong Kong about becoming
an outsourcing provider for their credit card back office operations. As the market has
become mature in terms of growth, and charge-offs have risen, it is no longer a given
that any bank can be profitable in credit cards in Hong Kong, even though the business
retains very high gross interest spreads.
We believe that any bank that is not already at 500,000 cards or above (~5% market
share), and that can not reach 1m cards within the next three years, will be hard
pressed to continue making the IT and marketing investments necessary to compete.
Aeon is well positioned to partner with these banks as it is not a competitor in other
areas, as HSBC, StanChart, and Dah Sing – the other natural service providers – are
for smaller banks.
Aeon is preparing for the
ability to lend directly in
China
Consolidation and
slowdown make
outsourcing more
attractive to smaller
banks
12
Aeon Credit (Asia)
October 2002
Potential M&A
If Aeon were to obtain a banking licence, funding costs could be dramatically lowered
due to improved interbank access and deposit-taking capabilities. In addition, the
acquisition of a bank with China branches and/or renminbi capabilities would facilitate
an early start to the Jusco mainland business.
Although we believe that Aeon’s parent would support such a move financially if it were
accretive, management has advised us that the HKMA will not countenance such a
move as the top tier parent is a non-bank and not a bank. As the HKMA does favour
consolidation, and as acquisitions of banks by non-bank financial companies are
permitted in many other jurisdictions, we see scope for this issue to be revisited in the
future.
Bank M&A not on the
cards barring regulatory
change
13
Aeon Credit (Asia)
October 2002
History and structure
HistoryAeon HK (then known as Nihon Credit Service (Asia) Co) was launched in 1988 as a
branch of its Japanese parent, providing hire purchase and supporting the operations
of Jusco. Aeon added vehicle finance in 1990 and proprietary credit cards in 1993,
switching to interbank cards (MasterCard and Visa) a year later. Aeon was listed in
Hong Kong in September 1995.
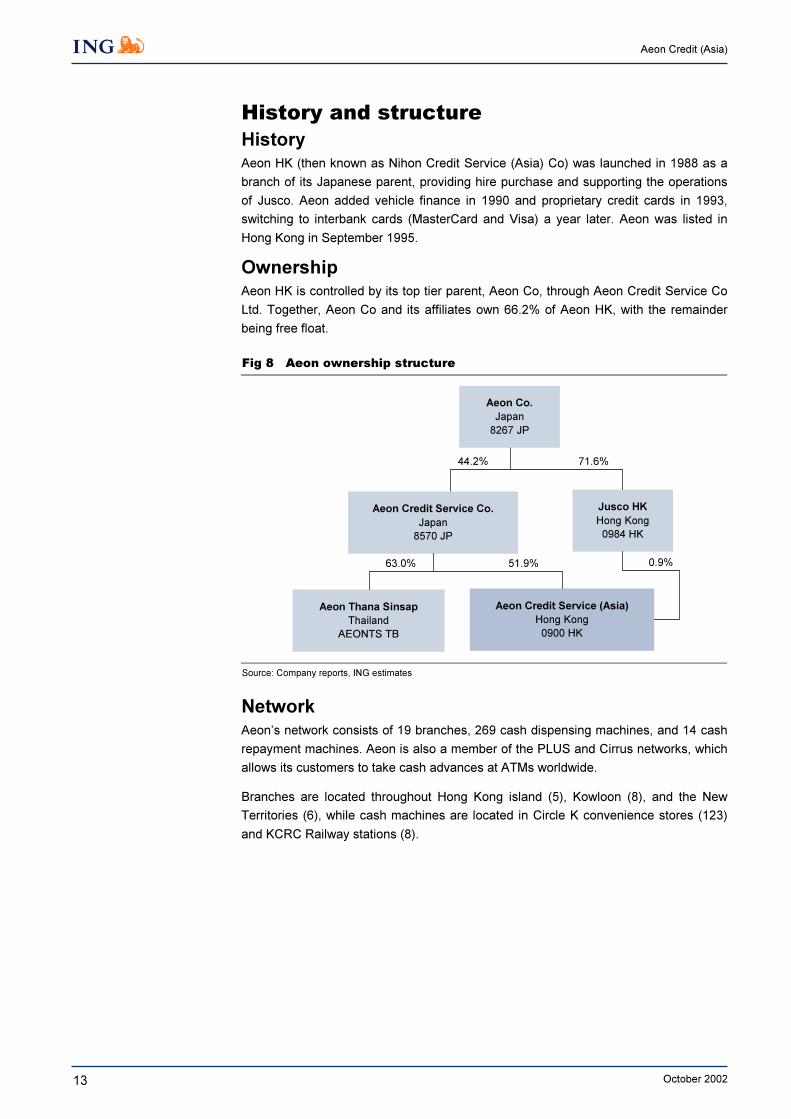
OwnershipAeon HK is controlled by its top tier parent, Aeon Co, through Aeon Credit Service Co
Ltd. Together, Aeon Co and its affiliates own 66.2% of Aeon HK, with the remainder
being free float.
_
Fig 8 Aeon ownership structure
Jusco HK
Hong Kong
0984 HK
Aeon Thana Sinsap
Thailand
AEONTS TB
Aeon Credit Service (Asia)
Hong Kong
0900 HK
Aeon Credit Service Co.
Japan
8570 JP
Aeon Co.
Japan
8267 JP
63.0% 51.9% 0.9%
44.2% 71.6%
Source: Company reports, ING estimates
_
Network
Aeon’s network consists of 19 branches, 269 cash dispensing machines, and 14 cash
repayment machines. Aeon is also a member of the PLUS and Cirrus networks, which
allows its customers to take cash advances at ATMs worldwide.
Branches are located throughout Hong Kong island (5), Kowloon (8), and the New
Territories (6), while cash machines are located in Circle K convenience stores (123)
and KCRC Railway stations (8).
14
Aeon Credit (Asia)
October 2002
Rates and marginsAeon’s is a very high-spread business, as one would expect from a predominantly
credit card company. Despite rising competition in the past few years, consumer
interest rates have remained high with no significant discounting below the 18% level
(18.6% APR), and most issuers at 24% or above. As Aeon’s market tends to be at the
low- to middle-income bracket, bank competition has not had much of an impact on
rates, and JCG Finance is more of a direct competitor for the company._
Fig 9 Aeon lending rates (%)
Product Rate type Rate (APR)
Mortgage Prime -0.5% 4.7
Credit card Fixed 18.1-42.6
Auto loan Fixed 24.7-28.1
Cash advance Fixed 48.4-50.5
Study loan Fixed 12.3-28.0
Privilege loan Fixed 12.3-18.4
Member's loan Fixed 24.7-39.2
Source: Company reports, ING estimates
_
Aeon’s loans are mainly made at rates of 18-43%, encompassing credit card loans,
non-card cash advances, and hire purchase. Although the company’s funding rate, at
7.07% in the most recent period, is considerably higher than that of a bank, high asset
yields mean that Aeon has kept a net interest margin of just over 20%._
Fig 10 Key interest margin components: 1H01-1H03 (%)
1H01 2H01 1H02 2H02 1H03
Aug-00 Feb-01 Aug-01 Feb-02 Aug-02
Yield on earning assets 25.88 25.91 26.68 26.05 24.87
Cost of interest-bearing liabilities 9.16 8.92 8.28 7.75 7.07
Interest spread 16.72 17.00 18.40 18.29 17.79
Net interest margin 19.58 19.73 21.08 20.63 20.03
Source: Company reports, ING estimates
_
_
Fig 11 Key interest margin components: FY00-04F (%)
Yr to Feb 00 01 02 03F 04F
Yield on earning assets 26.00 25.68 26.36 24.87 23.82
Cost of interest-bearing liabilities 8.63 8.98 8.00 6.91 6.22
Interest spread 17.38 16.70 18.35 17.96 17.60
Net interest margin 20.79 19.70 20.94 19.96 19.97
Source: Company reports, ING estimates
_
A high NIM is critical for a business such as Aeon’s, as interest income must be rich
enough to sustain the high cost of operating a high-transaction-volume, low-dollar-
amount business as well as large credit charge-offs. However, this margin has been
falling for the last 18 months as asset yields have come off. We attribute this decline to
three factors:
_
Rate competition is
ebbing as delinquencies
rise
15
Aeon Credit (Asia)
October 2002
Fig 12 Change in key interest margin components: 1H01-1H03 (bp)
1H01 2H01 1H02 2H02 1H03
Aug-00 Feb-01 Aug-01 Feb-02 Aug-02
Yield on earning assets -105 +4 +77 -64 -118
Cost of interest-bearing liabilities -31 -24 -63 -53 -68
Interest spread -73 +28 +140 -11 -50
Net interest margin -181 +15 +135 -45 -60
Source: Company reports, ING estimates
_
1. Increased competition from banks. Banks that disdained the mass consumer
market during the period of easy expansion have come around as mortgage
lending, their main product area, has become un- or marginally profitable. New
entrants have driven down effective prices (if not quoted interest rates) through
balance transfer programmes with low ‘teaser’ rates, and have contributed to rising
costs by marketing extensively.
Although we believe that the market will remain more crowded than it once was,
immediate pressure is declining as most banks pull back from their once
indiscriminate issuance. Smaller banks (ex-Dah Sing) do not have enough critical
mass to be able to make money at current default rates, which will limit their desire
and ability to compete on price over the next several years.
2. A shift in customer focus towards a more middle-class clientele. Aeon is
changing its focus from low-income customers who primarily use its cards for cash
advance purchases towards middle-class consumers who use its cards for
purchases; hence, the concentration of effort on marketing affinity cards and hire
purchase plans. These customers pay lower rates, but also have significantly
better credit loss experience and are thus more profitable.
Although this strategy will tend to lower interest margins over time, profitability
should improve.
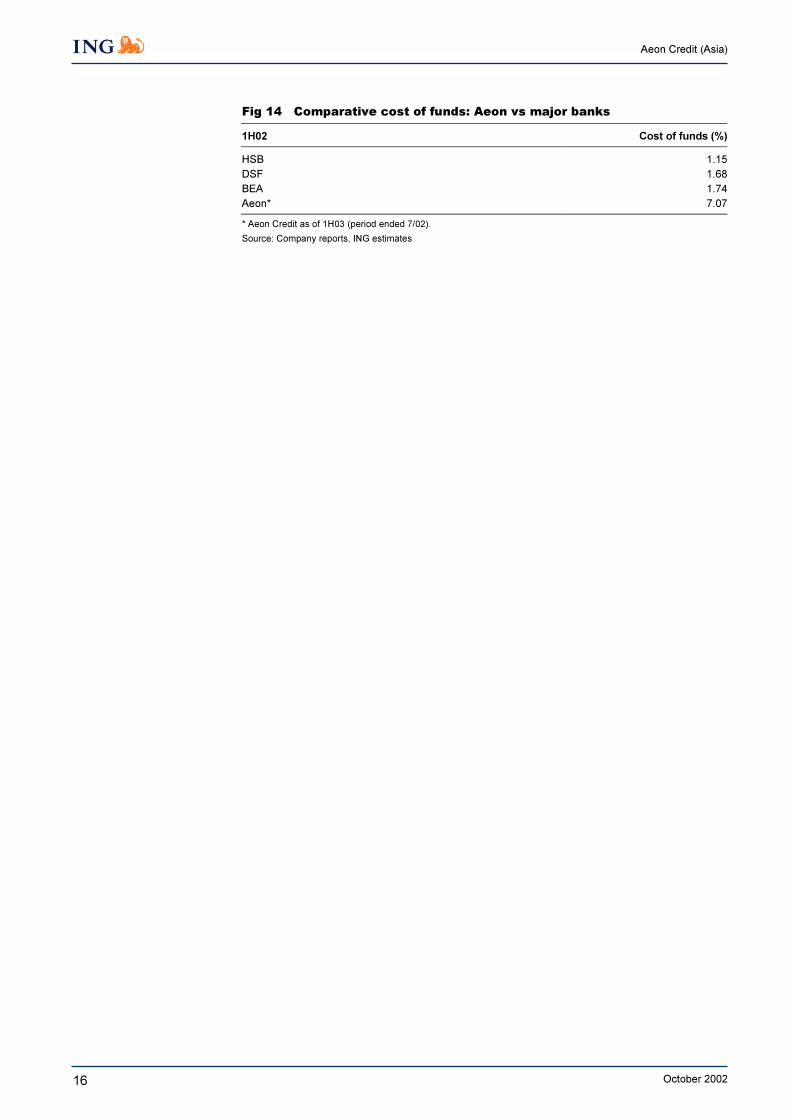
3. Long-term liability strategy during a falling rate environment. Our recent
meeting with Aeon management confirmed that its funding strategy continues to
be based around maintaining a large portion (target 80%) of long-term liabilities;
this directive originates with management of Aeon’s Japanese parent. This, along
with Aeon’s lack of a core deposit base, has resulted in high funding costs –
7.07% in the most recent period, compared with an average of 1.52% for its prime
Hong Kong bank competitors._
Fig 13 Aeon credit funding mix (HK$m)
End-2002 1H03
Feb-02 % Total Aug-02 % Total
Short-term bank borrowing 530 19 465 17
Long-term bank borrowing 560 20 560 20
Debt securities 524 19 527 19
Other liabilities 106 4 103 4
Equity 1,056 38 1,107 40
Source: Company reports, ING estimates
_
Aeon management has disclosed that the company would like to open a Deposit
Taking Company (DTC) in Hong Kong to lower its cost of funds; pending execution of
such a strategy, its potential effect on margins is not included in our forecasts.
_
16
Aeon Credit (Asia)
October 2002
Fig 14 Comparative cost of funds: Aeon vs major banks
1H02 Cost of funds (%)
HSB 1.15
DSF 1.68
BEA 1.74
Aeon* 7.07
* Aeon Credit as of 1H03 (period ended 7/02).
Source: Company reports, ING estimates
_
17
Aeon Credit (Asia)
October 2002
Asset qualityAsset quality at Aeon is poor and has been deteriorating – not a surprise given the
poor environment for retail lending in Hong Kong. As a substantial mitigating factor,
Aeon has been provisioning well against delinquent accounts, and exceeds our
required level of reserving given its NPLs.
Gross NPLs have risen 55% from a year ago, increasing from HK$235m to HK$365m
even as total loans have stagnated. On a percentage basis, impaired loans rose from
8.1% of total loans to 12.5% despite charge-offs during the period of over 7% of the
loan book. Although this experience is in line with the general delinquency and charge-
off experience in Hong Kong (and thus not a failing specific to Aeon), it is nonetheless
horrific in its impact on profitability._
Fig 15 Asset quality summary: 1H99-1H03 (HK$m)
1H99 2H99 1H00 2H00 1H01 2H01 1H02 2H02 1H03
Aug-98 Feb-99 Aug-99 Feb-00 Aug-00 Feb-01 Aug-01 Feb-02 Aug-02
Gross NPLs 160.3 147.2 179.0 160.7 162.2 192.3 235.6 276.3 365.8
% of total loans 7.01 5.94 6.96 6.10 6.09 7.01 8.13 9.45 12.49
Gross reserves 72.8 83.1 92.1 85.1 89.7 90.5 97.8 148.7 172.8
% of total loans 3.18 3.35 3.58 3.23 3.37 3.30 3.37 5.08 5.90
% of gross NPLs 45.41 56.44 51.46 52.99 55.30 47.06 41.49 53.81 47.25
Source: Company reports, ING estimates
_
Net charge-offs ran at 351bp of average loans in the most recent period, down slightly
from 2H02 but well above the loss experience of the 1H01-1H02 period. Most
important to us is that Aeon has fully provisioned against actual losses (unlike some
other Hong Kong lenders), with P&L charges for bad debts outpacing realised losses in
each of the past five halves. This has boosted the reserve from 327bp at end-2000 to
591bp currently – or, more importantly, from 174 days of charge-offs to 307 days,
despite the much higher rate of loss the company is now sustaining.
_
Fig 16 Net charge-offs and provisioning
2H00 1H01 2H01 1H02 2H02 1H03
bp on average loans Feb-00 Aug-00 Feb-01 Aug-01 Feb-02 Aug-02
Provisions 315.94 257.66 247.00 281.52 535.88 433.73
Net charge-offs 342.63 240.43 244.12 255.73 360.97 351.21
Provisions less charge-offs (26.69) 17.23 2.88 25.79 174.91 82.52
Accumulated reserves 327.09 338.55 334.84 346.67 510.65 590.67
Source: Company reports, ING estimates
_
Asset quality is poor, but
charges are taken to
income quickly and fully
18
Aeon Credit (Asia)
October 2002
Reserve adequacy
Reserve adequacy is less important for a pure consumer finance company as its NPLs
are all written off within 180 days. Additionally, the majority of losses now incurred
through bankruptcy occur without first becoming past due – the accounts are current
up until the arrival of a bankruptcy petition, and are then written off completely.
Nevertheless, we have run our standard regional reserve adequacy model for Aeon,
assigning loans 30-90 days past due to the Special Mention category and those 90-
180 days past due to the Substandard category. There are no Doubtful or Loss assets
under this method, as any loans that meet the 180+ days delinquent criteria are
already fully written down and do not appear on the balance sheet._
Fig 17 Reserve adequacy: 1H03 standard methodology (HK$000)
Gross Reserve Required
amount percentage (%) reserve
Pass 2,561,790 1 25,618
Special mention 216,715 5 10,836
Substandard 149,063 20 29,813
Doubtful - 50 -
Loss - 100 -
ORE - 20 -
Excess AIR - 20 -
Total 2,927,568 66,266
Actual reserves 172,822
Shortfall (106,556)
Actual/required (%) 261
Shortfall/capital (%) -10
Source: Company reports, ING estimates
_
Using the standard model shows that Aeon’s actual reserves exceed our required
figure by an additional 161%, clearly a good showing. However, this model output is
heavily driven by changes in the general provision we assess on performing (pass)
loans, which is 1% in our base-case methodology.
Given that Aeon is involved in pure consumer finance – a riskier business than most
other bank lending – we have also calculated required reserves using a 4% general
provision (equal to more than six months of actual losses on the entire portfolio at
current rates), with S/M and S/S provisioning bumped up to 10% and 25%,
respectively. Under this conservative scenario, Aeon still exceeds our required reserve
by 7%, giving us comfort that the company is fully provisioned against the current
asset base.
Reserves are adequate
19
Aeon Credit (Asia)
October 2002
Fig 18 Reserve adequacy: 1H03 severe methodology (HK$000)
Gross Reserve Required
amount percentage (%) reserve
Pass 2,561,790 4 102,472
Special mention 216,715 10 21,672
Substandard 149,063 25 37,266
Doubtful - 50 -
Loss - 100 -
ORE - 20 -
Excess AIR - 20 -
Total 2,927,568 161,409
Actual reserves 172,822
Shortfall (11,413)
Actual/required (%) 107
Shortfall/capital (%) -1
Source: Company reports, ING estimates
20
Aeon Credit (Asia)
October 2002
Information sharing will benefit Aeon
A long-awaited plan that would permit Hong Kong banks and finance companies to
share credit information about their consumer borrowers will likely be put into place,
despite fears that the institution of a credit database would spark another round of
personal loan defaults and give rise to privacy issues for consumers.
We continue to believe that a true shared credit information system is imperative to
avoid future large-scale defaults, and that purposeful ignorance will benefit neither
banks nor consumers. Smaller companies like Aeon will be primary beneficiaries of
such a move; while large banks like HSBC will still see lower credit costs, they will be
comparatively disadvantaged compared with their current strong positions.
The power of positive information
Hong Kong lenders currently have no organised means of sharing information about
consumer borrowers and potential borrowers, other than strictly specified negative
factors. In other words, lenders can only disclose information to each other about
delinquent customers – information that frequently comes too late as borrowers who
default tend to do so on all obligations around the same time.
On this basis, while your banker will ask you about your income and calculate your
ability to handle credit and properly repay before issuing you a credit card, she would
never know that you already have eight other cards with large balances issued by
other banks – as long as you are not in default on any of those loans.
An HKMA working paper informs us that the average defaulting individual in Hong
Kong has taken out borrowings from 12 financial institutions and owes an average of
55x his or her monthly salary.
Continuous re-rating is key
Of particular concern to consumer groups is a measure that will allow banks to access
data on customers when reviewing their existing loan portfolio, rather than only when
considering new credit lines.
We view the periodic updating of credit information and re-rating of borrowers as a
normal and prudent credit practice, and would find the credit bureau proposal
materially degraded without it.
Because consumer borrowers frequently give no warning before filing a bankruptcy
petition, and are thereafter allowed to discharge their unsecured debts, a large part of
managing risk well is to spot problem borrowers in time to cut off their credit before
they use it all – it is a banking truism that no borrower goes bankrupt without first using
100% of his/her available credit.
Aeon management is enthusiastic about the credit bureau system, but cautions that
investors should expect an additional inflow of bad debts once re-rating is permitted,
as lenders will cut off the remaining credit of marginal borrowers and force them into
default.
For further information on the credit bureau proposal, please refer to our note of 15
August 2002 entitled “Hong Kong banks: Will HK credit bureau lead to a credit
crunch?”
A Hong Kong credit
bureau will benefit
smaller players including
Aeon
Expect another round of
defaults when re-rating
is introduced
21
Aeon Credit (Asia)
October 2002
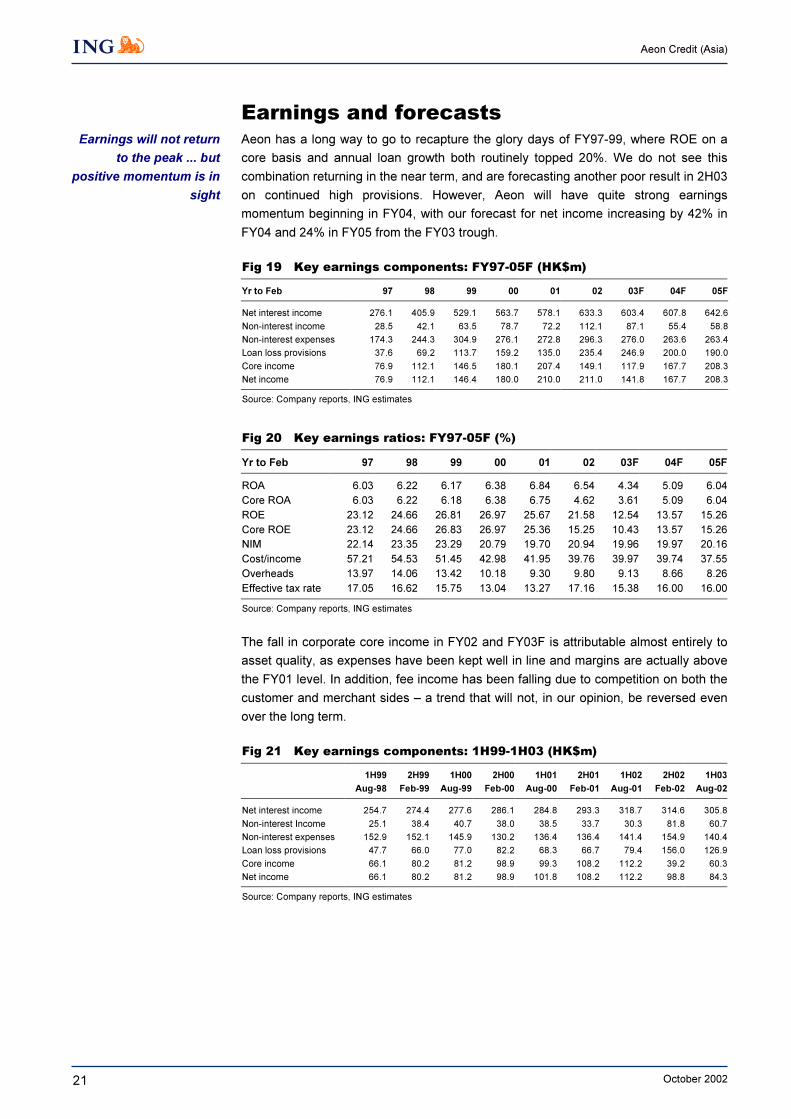
Earnings and forecastsAeon has a long way to go to recapture the glory days of FY97-99, where ROE on a
core basis and annual loan growth both routinely topped 20%. We do not see this
combination returning in the near term, and are forecasting another poor result in 2H03
on continued high provisions. However, Aeon will have quite strong earnings
momentum beginning in FY04, with our forecast for net income increasing by 42% in
FY04 and 24% in FY05 from the FY03 trough._
Fig 19 Key earnings components: FY97-05F (HK$m)
Yr to Feb 97 98 99 00 01 02 03F 04F 05F
Net interest income 276.1 405.9 529.1 563.7 578.1 633.3 603.4 607.8 642.6
Non-interest income 28.5 42.1 63.5 78.7 72.2 112.1 87.1 55.4 58.8
Non-interest expenses 174.3 244.3 304.9 276.1 272.8 296.3 276.0 263.6 263.4
Loan loss provisions 37.6 69.2 113.7 159.2 135.0 235.4 246.9 200.0 190.0
Core income 76.9 112.1 146.5 180.1 207.4 149.1 117.9 167.7 208.3
Net income 76.9 112.1 146.4 180.0 210.0 211.0 141.8 167.7 208.3
Source: Company reports, ING estimates
_
_
Fig 20 Key earnings ratios: FY97-05F (%)
Yr to Feb 97 98 99 00 01 02 03F 04F 05F
ROA 6.03 6.22 6.17 6.38 6.84 6.54 4.34 5.09 6.04
Core ROA 6.03 6.22 6.18 6.38 6.75 4.62 3.61 5.09 6.04
ROE 23.12 24.66 26.81 26.97 25.67 21.58 12.54 13.57 15.26
Core ROE 23.12 24.66 26.83 26.97 25.36 15.25 10.43 13.57 15.26
NIM 22.14 23.35 23.29 20.79 19.70 20.94 19.96 19.97 20.16
Cost/income 57.21 54.53 51.45 42.98 41.95 39.76 39.97 39.74 37.55
Overheads 13.97 14.06 13.42 10.18 9.30 9.80 9.13 8.66 8.26
Effective tax rate 17.05 16.62 15.75 13.04 13.27 17.16 15.38 16.00 16.00
Source: Company reports, ING estimates
_
The fall in corporate core income in FY02 and FY03F is attributable almost entirely to
asset quality, as expenses have been kept well in line and margins are actually above
the FY01 level. In addition, fee income has been falling due to competition on both the
customer and merchant sides – a trend that will not, in our opinion, be reversed even
over the long term.
_
Fig 21 Key earnings components: 1H99-1H03 (HK$m)
1H99 2H99 1H00 2H00 1H01 2H01 1H02 2H02 1H03
Aug-98 Feb-99 Aug-99 Feb-00 Aug-00 Feb-01 Aug-01 Feb-02 Aug-02
Net interest income 254.7 274.4 277.6 286.1 284.8 293.3 318.7 314.6 305.8
Non-interest Income 25.1 38.4 40.7 38.0 38.5 33.7 30.3 81.8 60.7
Non-interest expenses 152.9 152.1 145.9 130.2 136.4 136.4 141.4 154.9 140.4
Loan loss provisions 47.7 66.0 77.0 82.2 68.3 66.7 79.4 156.0 126.9
Core income 66.1 80.2 81.2 98.9 99.3 108.2 112.2 39.2 60.3
Net income 66.1 80.2 81.2 98.9 101.8 108.2 112.2 98.8 84.3
Source: Company reports, ING estimates
_
Earnings will not return
to the peak ... but
positive momentum is in
sight
22
Aeon Credit (Asia)
October 2002
_
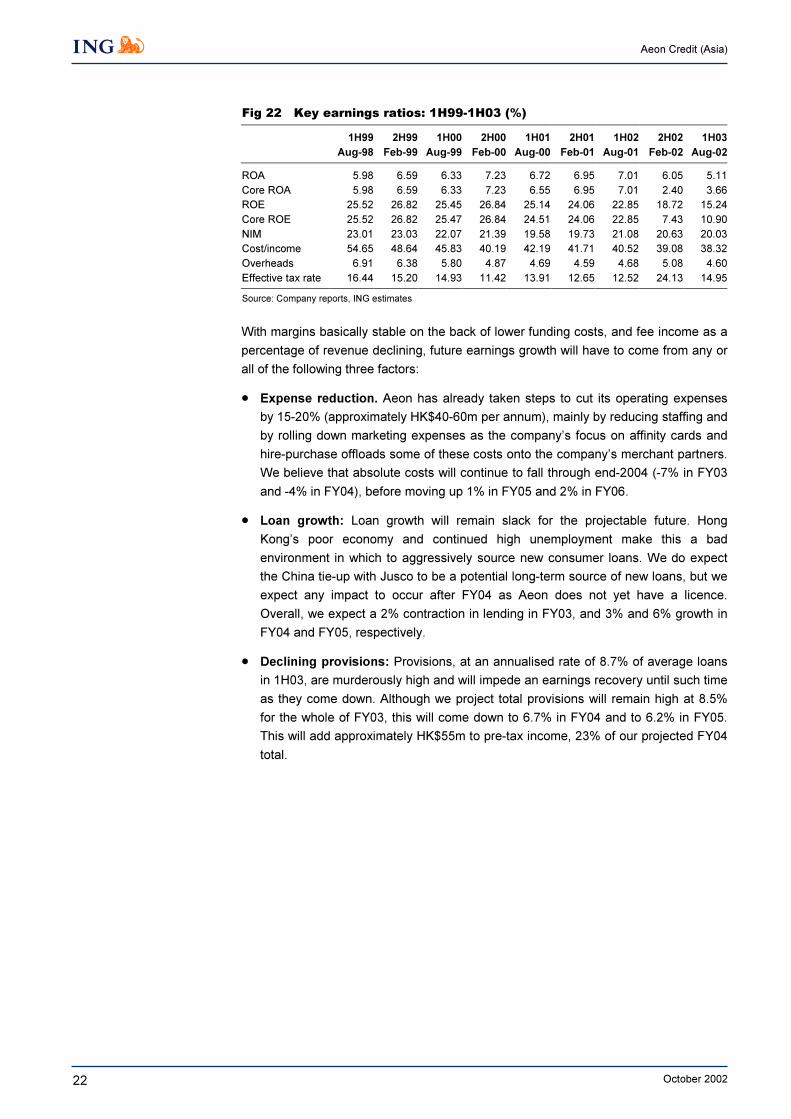
Fig 22 Key earnings ratios: 1H99-1H03 (%)
1H99 2H99 1H00 2H00 1H01 2H01 1H02 2H02 1H03
Aug-98 Feb-99 Aug-99 Feb-00 Aug-00 Feb-01 Aug-01 Feb-02 Aug-02
ROA 5.98 6.59 6.33 7.23 6.72 6.95 7.01 6.05 5.11
Core ROA 5.98 6.59 6.33 7.23 6.55 6.95 7.01 2.40 3.66
ROE 25.52 26.82 25.45 26.84 25.14 24.06 22.85 18.72 15.24
Core ROE 25.52 26.82 25.47 26.84 24.51 24.06 22.85 7.43 10.90
NIM 23.01 23.03 22.07 21.39 19.58 19.73 21.08 20.63 20.03
Cost/income 54.65 48.64 45.83 40.19 42.19 41.71 40.52 39.08 38.32
Overheads 6.91 6.38 5.80 4.87 4.69 4.59 4.68 5.08 4.60
Effective tax rate 16.44 15.20 14.93 11.42 13.91 12.65 12.52 24.13 14.95
Source: Company reports, ING estimates
_
With margins basically stable on the back of lower funding costs, and fee income as a
percentage of revenue declining, future earnings growth will have to come from any or
all of the following three factors:
Expense reduction. Aeon has already taken steps to cut its operating expenses
by 15-20% (approximately HK$40-60m per annum), mainly by reducing staffing and
by rolling down marketing expenses as the company’s focus on affinity cards and
hire-purchase offloads some of these costs onto the company’s merchant partners.
We believe that absolute costs will continue to fall through end-2004 (-7% in FY03
and -4% in FY04), before moving up 1% in FY05 and 2% in FY06.
Loan growth: Loan growth will remain slack for the projectable future. Hong
Kong’s poor economy and continued high unemployment make this a bad
environment in which to aggressively source new consumer loans. We do expect
the China tie-up with Jusco to be a potential long-term source of new loans, but we
expect any impact to occur after FY04 as Aeon does not yet have a licence.
Overall, we expect a 2% contraction in lending in FY03, and 3% and 6% growth in
FY04 and FY05, respectively.
Declining provisions: Provisions, at an annualised rate of 8.7% of average loans
in 1H03, are murderously high and will impede an earnings recovery until such time
as they come down. Although we project total provisions will remain high at 8.5%
for the whole of FY03, this will come down to 6.7% in FY04 and to 6.2% in FY05.
This will add approximately HK$55m to pre-tax income, 23% of our projected FY04
total.
23
Aeon Credit (Asia)
October 2002
Core versus non-core earnings
As a general rule, we avoid taking into account one-time factors when looking at a
bank’s historical and future earnings capacity. For this reason, we focus on measures
of core income, which excludes tax-affected securities gains, asset disposals, non-
cash charges such as goodwill amortisation, and other extraordinaries. We do consider
loan loss provisions as part of core income (unlike our calculation of underlying
profitability), as they are part of the ongoing business of being a credit intermediary.
Note that we do not project items such as securities gains or asset sales going forward
unless we have specific information about gains or losses that have already taken
place.
24
Aeon Credit (Asia)
October 2002
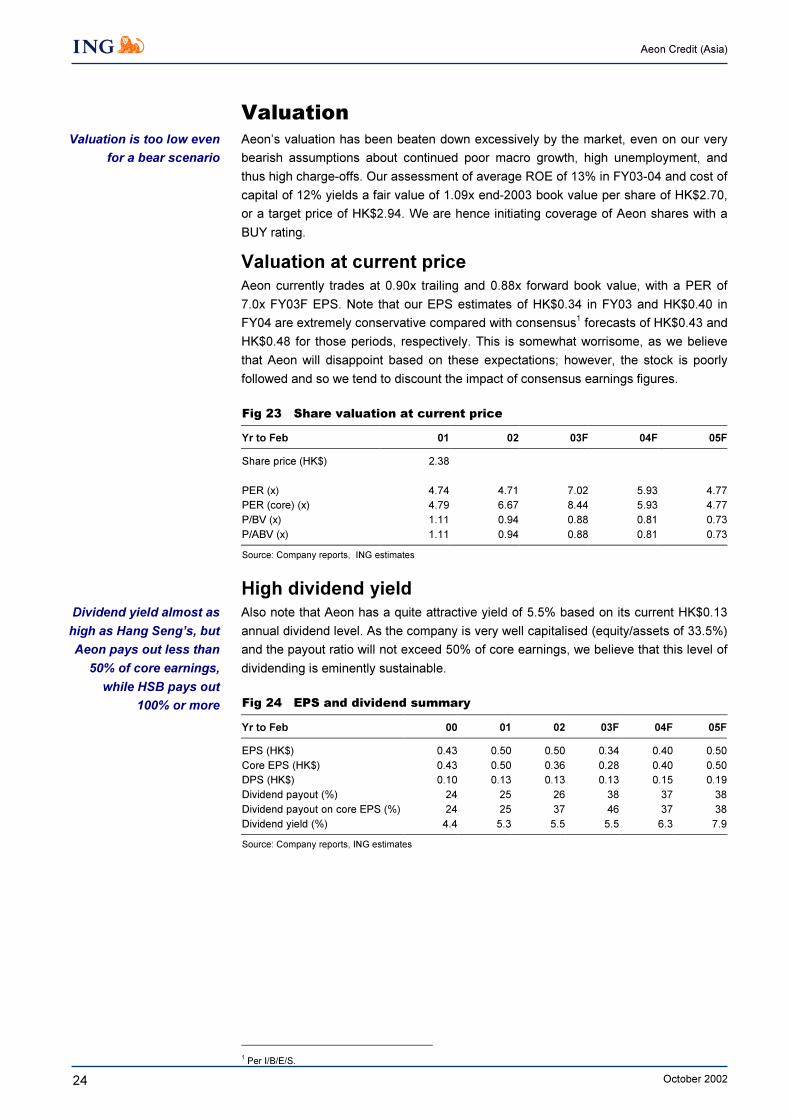
ValuationAeon’s valuation has been beaten down excessively by the market, even on our very
bearish assumptions about continued poor macro growth, high unemployment, and
thus high charge-offs. Our assessment of average ROE of 13% in FY03-04 and cost of
capital of 12% yields a fair value of 1.09x end-2003 book value per share of HK$2.70,
or a target price of HK$2.94. We are hence initiating coverage of Aeon shares with a
BUY rating.
Valuation at current price
Aeon currently trades at 0.90x trailing and 0.88x forward book value, with a PER of
7.0x FY03F EPS. Note that our EPS estimates of HK$0.34 in FY03 and HK$0.40 in
FY04 are extremely conservative compared with consensus1 forecasts of HK$0.43 and
HK$0.48 for those periods, respectively. This is somewhat worrisome, as we believe
that Aeon will disappoint based on these expectations; however, the stock is poorly
followed and so we tend to discount the impact of consensus earnings figures.
_
Fig 23 Share valuation at current price
Yr to Feb 01 02 03F 04F 05F
Share price (HK$) 2.38
PER (x) 4.74 4.71 7.02 5.93 4.77
PER (core) (x) 4.79 6.67 8.44 5.93 4.77
P/BV (x) 1.11 0.94 0.88 0.81 0.73
P/ABV (x) 1.11 0.94 0.88 0.81 0.73
Source: Company reports, ING estimates
_
High dividend yield
Also note that Aeon has a quite attractive yield of 5.5% based on its current HK$0.13
annual dividend level. As the company is very well capitalised (equity/assets of 33.5%)
and the payout ratio will not exceed 50% of core earnings, we believe that this level of
dividending is eminently sustainable._
Fig 24 EPS and dividend summary
Yr to Feb 00 01 02 03F 04F 05F
EPS (HK$) 0.43 0.50 0.50 0.34 0.40 0.50
Core EPS (HK$) 0.43 0.50 0.36 0.28 0.40 0.50
DPS (HK$) 0.10 0.13 0.13 0.13 0.15 0.19
Dividend payout (%) 24 25 26 38 37 38
Dividend payout on core EPS (%) 24 25 37 46 37 38
Dividend yield (%) 4.4 5.3 5.5 5.5 6.3 7.9
Source: Company reports, ING estimates
_
1 Per I/B/E/S.
Valuation is too low even
for a bear scenario
Dividend yield almost as
high as Hang Seng’s, but
Aeon pays out less than
50% of core earnings,
while HSB pays out
100% or more
25
Aeon Credit (Asia)
October 2002
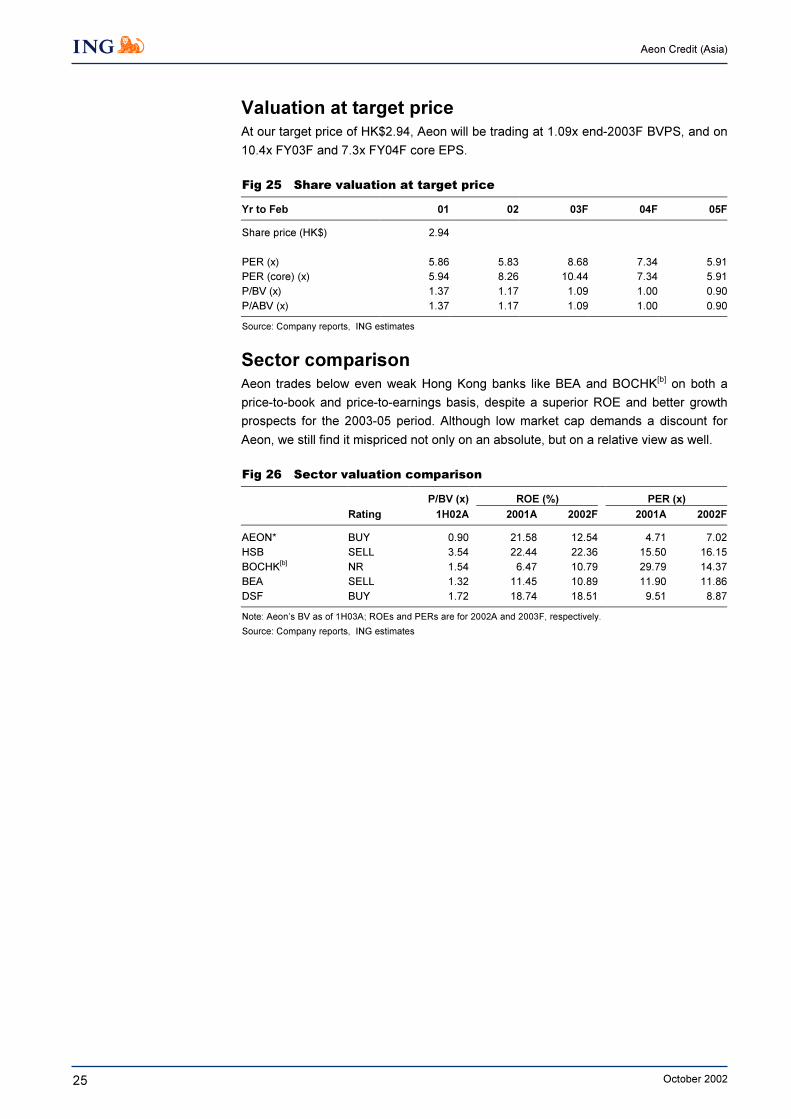
Valuation at target price
At our target price of HK$2.94, Aeon will be trading at 1.09x end-2003F BVPS, and on
10.4x FY03F and 7.3x FY04F core EPS._
Fig 25 Share valuation at target price
Yr to Feb 01 02 03F 04F 05F
Share price (HK$) 2.94
PER (x) 5.86 5.83 8.68 7.34 5.91
PER (core) (x) 5.94 8.26 10.44 7.34 5.91
P/BV (x) 1.37 1.17 1.09 1.00 0.90
P/ABV (x) 1.37 1.17 1.09 1.00 0.90
Source: Company reports, ING estimates
Sector comparison
Aeon trades below even weak Hong Kong banks like BEA and BOCHK[b] on both a
price-to-book and price-to-earnings basis, despite a superior ROE and better growth
prospects for the 2003-05 period. Although low market cap demands a discount for
Aeon, we still find it mispriced not only on an absolute, but on a relative view as well._
Fig 26 Sector valuation comparison
P/BV (x) ROE (%) PER (x)
Rating 1H02A 2001A 2002F 2001A 2002F
AEON* BUY 0.90 21.58 12.54 4.71 7.02
HSB SELL 3.54 22.44 22.36 15.50 16.15
BOCHK[b]
NR 1.54 6.47 10.79 29.79 14.37
BEA SELL 1.32 11.45 10.89 11.90 11.86
DSF BUY 1.72 18.74 18.51 9.51 8.87
Note: Aeon’s BV as of 1H03A; ROEs and PERs are for 2002A and 2003F, respectively.
Source: Company reports, ING estimates
_
26
Aeon Credit (Asia)
October 2002
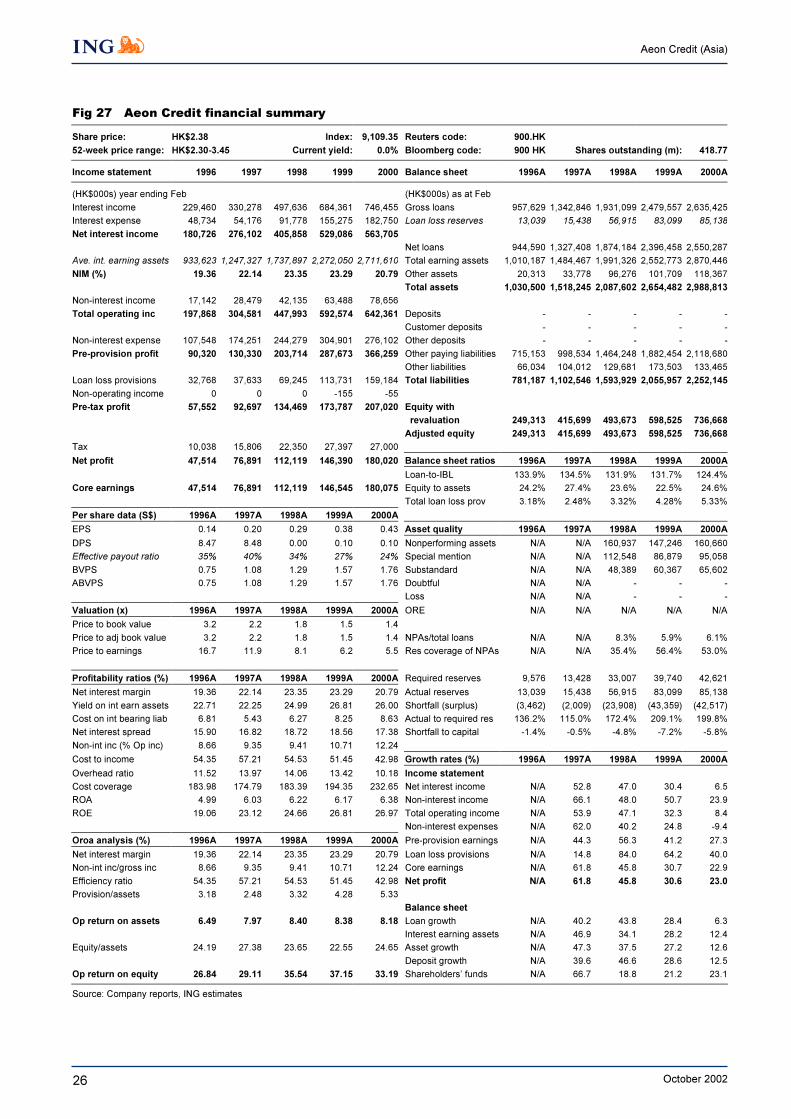
Fig 27 Aeon Credit financial summary
Share price: HK$2.38 Index: 9,109.35 Reuters code: 900.HK
52-week price range: HK$2.30-3.45 Current yield: 0.0% Bloomberg code: 900 HK Shares outstanding (m): 418.77
Income statement 1996 1997 1998 1999 2000 Balance sheet 1996A 1997A 1998A 1999A 2000A
(HK$000s) year ending Feb (HK$000s) as at Feb
Interest income 229,460 330,278 497,636 684,361 746,455 Gross loans 957,629 1,342,846 1,931,099 2,479,557 2,635,425
Interest expense 48,734 54,176 91,778 155,275 182,750 Loan loss reserves 13,039 15,438 56,915 83,099 85,138
Net interest income 180,726 276,102 405,858 529,086 563,705
Net loans 944,590 1,327,408 1,874,184 2,396,458 2,550,287
Ave. int. earning assets 933,623 1,247,327 1,737,897 2,272,050 2,711,610 Total earning assets 1,010,187 1,484,467 1,991,326 2,552,773 2,870,446
NIM (%) 19.36 22.14 23.35 23.29 20.79 Other assets 20,313 33,778 96,276 101,709 118,367
Total assets 1,030,500 1,518,245 2,087,602 2,654,482 2,988,813
Non-interest income 17,142 28,479 42,135 63,488 78,656
Total operating inc 197,868 304,581 447,993 592,574 642,361 Deposits - - - - -
Customer deposits - - - - -
Non-interest expense 107,548 174,251 244,279 304,901 276,102 Other deposits - - - - -
Pre-provision profit 90,320 130,330 203,714 287,673 366,259 Other paying liabilities 715,153 998,534 1,464,248 1,882,454 2,118,680
Other liabilities 66,034 104,012 129,681 173,503 133,465
Loan loss provisions 32,768 37,633 69,245 113,731 159,184 Total liabilities 781,187 1,102,546 1,593,929 2,055,957 2,252,145
Non-operating income 0 0 0 -155 -55
Pre-tax profit 57,552 92,697 134,469 173,787 207,020 Equity with
revaluation 249,313 415,699 493,673 598,525 736,668
Adjusted equity 249,313 415,699 493,673 598,525 736,668
Tax 10,038 15,806 22,350 27,397 27,000
Net profit 47,514 76,891 112,119 146,390 180,020 Balance sheet ratios 1996A 1997A 1998A 1999A 2000A
Loan-to-IBL 133.9% 134.5% 131.9% 131.7% 124.4%
Core earnings 47,514 76,891 112,119 146,545 180,075 Equity to assets 24.2% 27.4% 23.6% 22.5% 24.6%
Total loan loss prov 3.18% 2.48% 3.32% 4.28% 5.33%
Per share data (S$) 1996A 1997A 1998A 1999A 2000A
EPS 0.14 0.20 0.29 0.38 0.43 Asset quality 1996A 1997A 1998A 1999A 2000A
DPS 8.47 8.48 0.00 0.10 0.10 Nonperforming assets N/A N/A 160,937 147,246 160,660
Effective payout ratio 35% 40% 34% 27% 24% Special mention N/A N/A 112,548 86,879 95,058
BVPS 0.75 1.08 1.29 1.57 1.76 Substandard N/A N/A 48,389 60,367 65,602
ABVPS 0.75 1.08 1.29 1.57 1.76 Doubtful N/A N/A - - -
Loss N/A N/A - - -
Valuation (x) 1996A 1997A 1998A 1999A 2000A ORE N/A N/A N/A N/A N/A
Price to book value 3.2 2.2 1.8 1.5 1.4
Price to adj book value 3.2 2.2 1.8 1.5 1.4 NPAs/total loans N/A N/A 8.3% 5.9% 6.1%
Price to earnings 16.7 11.9 8.1 6.2 5.5 Res coverage of NPAs N/A N/A 35.4% 56.4% 53.0%
Profitability ratios (%) 1996A 1997A 1998A 1999A 2000A Required reserves 9,576 13,428 33,007 39,740 42,621
Net interest margin 19.36 22.14 23.35 23.29 20.79 Actual reserves 13,039 15,438 56,915 83,099 85,138
Yield on int earn assets 22.71 22.25 24.99 26.81 26.00 Shortfall (surplus) (3,462) (2,009) (23,908) (43,359) (42,517)
Cost on int bearing liab 6.81 5.43 6.27 8.25 8.63 Actual to required res 136.2% 115.0% 172.4% 209.1% 199.8%
Net interest spread 15.90 16.82 18.72 18.56 17.38 Shortfall to capital -1.4% -0.5% -4.8% -7.2% -5.8%
Non-int inc (% Op inc) 8.66 9.35 9.41 10.71 12.24
Cost to income 54.35 57.21 54.53 51.45 42.98 Growth rates (%) 1996A 1997A 1998A 1999A 2000A
Overhead ratio 11.52 13.97 14.06 13.42 10.18 Income statement
Cost coverage 183.98 174.79 183.39 194.35 232.65 Net interest income N/A 52.8 47.0 30.4 6.5
ROA 4.99 6.03 6.22 6.17 6.38 Non-interest income N/A 66.1 48.0 50.7 23.9
ROE 19.06 23.12 24.66 26.81 26.97 Total operating income N/A 53.9 47.1 32.3 8.4
Non-interest expenses N/A 62.0 40.2 24.8 -9.4
Oroa analysis (%) 1996A 1997A 1998A 1999A 2000A Pre-provision earnings N/A 44.3 56.3 41.2 27.3
Net interest margin 19.36 22.14 23.35 23.29 20.79 Loan loss provisions N/A 14.8 84.0 64.2 40.0
Non-int inc/gross inc 8.66 9.35 9.41 10.71 12.24 Core earnings N/A 61.8 45.8 30.7 22.9
Efficiency ratio 54.35 57.21 54.53 51.45 42.98 Net profit N/A 61.8 45.8 30.6 23.0
Provision/assets 3.18 2.48 3.32 4.28 5.33
Balance sheet
Op return on assets 6.49 7.97 8.40 8.38 8.18 Loan growth N/A 40.2 43.8 28.4 6.3
Interest earning assets N/A 46.9 34.1 28.2 12.4
Equity/assets 24.19 27.38 23.65 22.55 24.65 Asset growth N/A 47.3 37.5 27.2 12.6
Deposit growth N/A 39.6 46.6 28.6 12.5
Op return on equity 26.84 29.11 35.54 37.15 33.19 Shareholders’ funds N/A 66.7 18.8 21.2 23.1
Source: Company reports, ING estimates
_
_
27
Aeon Credit (Asia)
October 2002
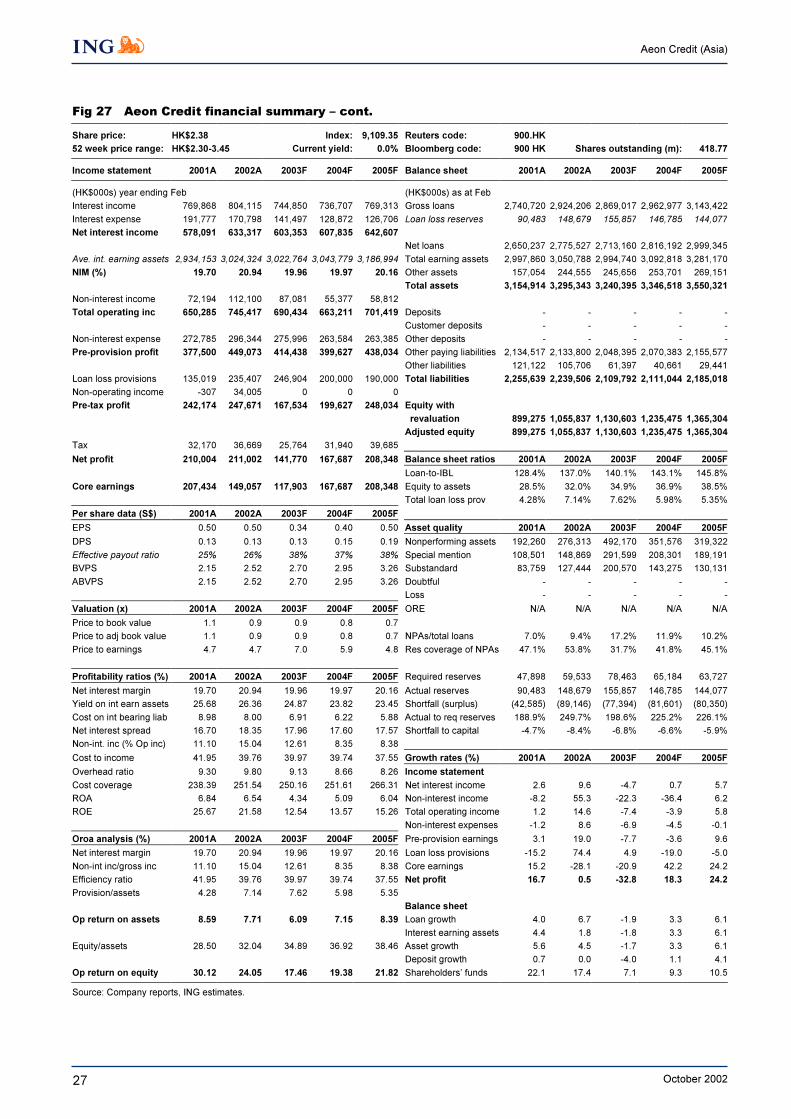
Fig 27 Aeon Credit financial summary – cont.
Share price: HK$2.38 Index: 9,109.35 Reuters code: 900.HK
52 week price range: HK$2.30-3.45 Current yield: 0.0% Bloomberg code: 900 HK Shares outstanding (m): 418.77
Income statement 2001A 2002A 2003F 2004F 2005F Balance sheet 2001A 2002A 2003F 2004F 2005F
(HK$000s) year ending Feb (HK$000s) as at Feb
Interest income 769,868 804,115 744,850 736,707 769,313 Gross loans 2,740,720 2,924,206 2,869,017 2,962,977 3,143,422
Interest expense 191,777 170,798 141,497 128,872 126,706 Loan loss reserves 90,483 148,679 155,857 146,785 144,077
Net interest income 578,091 633,317 603,353 607,835 642,607
Net loans 2,650,237 2,775,527 2,713,160 2,816,192 2,999,345
Ave. int. earning assets 2,934,153 3,024,324 3,022,764 3,043,779 3,186,994 Total earning assets 2,997,860 3,050,788 2,994,740 3,092,818 3,281,170
NIM (%) 19.70 20.94 19.96 19.97 20.16 Other assets 157,054 244,555 245,656 253,701 269,151
Total assets 3,154,914 3,295,343 3,240,395 3,346,518 3,550,321
Non-interest income 72,194 112,100 87,081 55,377 58,812
Total operating inc 650,285 745,417 690,434 663,211 701,419 Deposits - - - - -
Customer deposits - - - - -
Non-interest expense 272,785 296,344 275,996 263,584 263,385 Other deposits - - - - -
Pre-provision profit 377,500 449,073 414,438 399,627 438,034 Other paying liabilities 2,134,517 2,133,800 2,048,395 2,070,383 2,155,577
Other liabilities 121,122 105,706 61,397 40,661 29,441
Loan loss provisions 135,019 235,407 246,904 200,000 190,000 Total liabilities 2,255,639 2,239,506 2,109,792 2,111,044 2,185,018
Non-operating income -307 34,005 0 0 0
Pre-tax profit 242,174 247,671 167,534 199,627 248,034 Equity with
revaluation 899,275 1,055,837 1,130,603 1,235,475 1,365,304
Adjusted equity 899,275 1,055,837 1,130,603 1,235,475 1,365,304
Tax 32,170 36,669 25,764 31,940 39,685
Net profit 210,004 211,002 141,770 167,687 208,348 Balance sheet ratios 2001A 2002A 2003F 2004F 2005F
Loan-to-IBL 128.4% 137.0% 140.1% 143.1% 145.8%
Core earnings 207,434 149,057 117,903 167,687 208,348 Equity to assets 28.5% 32.0% 34.9% 36.9% 38.5%
Total loan loss prov 4.28% 7.14% 7.62% 5.98% 5.35%
Per share data (S$) 2001A 2002A 2003F 2004F 2005F
EPS 0.50 0.50 0.34 0.40 0.50 Asset quality 2001A 2002A 2003F 2004F 2005F
DPS 0.13 0.13 0.13 0.15 0.19 Nonperforming assets 192,260 276,313 492,170 351,576 319,322
Effective payout ratio 25% 26% 38% 37% 38% Special mention 108,501 148,869 291,599 208,301 189,191
BVPS 2.15 2.52 2.70 2.95 3.26 Substandard 83,759 127,444 200,570 143,275 130,131
ABVPS 2.15 2.52 2.70 2.95 3.26 Doubtful - - - - -
Loss - - - - -
Valuation (x) 2001A 2002A 2003F 2004F 2005F ORE N/A N/A N/A N/A N/A
Price to book value 1.1 0.9 0.9 0.8 0.7
Price to adj book value 1.1 0.9 0.9 0.8 0.7 NPAs/total loans 7.0% 9.4% 17.2% 11.9% 10.2%
Price to earnings 4.7 4.7 7.0 5.9 4.8 Res coverage of NPAs 47.1% 53.8% 31.7% 41.8% 45.1%
Profitability ratios (%) 2001A 2002A 2003F 2004F 2005F Required reserves 47,898 59,533 78,463 65,184 63,727
Net interest margin 19.70 20.94 19.96 19.97 20.16 Actual reserves 90,483 148,679 155,857 146,785 144,077
Yield on int earn assets 25.68 26.36 24.87 23.82 23.45 Shortfall (surplus) (42,585) (89,146) (77,394) (81,601) (80,350)
Cost on int bearing liab 8.98 8.00 6.91 6.22 5.88 Actual to req reserves 188.9% 249.7% 198.6% 225.2% 226.1%
Net interest spread 16.70 18.35 17.96 17.60 17.57 Shortfall to capital -4.7% -8.4% -6.8% -6.6% -5.9%
Non-int. inc (% Op inc) 11.10 15.04 12.61 8.35 8.38
Cost to income 41.95 39.76 39.97 39.74 37.55 Growth rates (%) 2001A 2002A 2003F 2004F 2005F
Overhead ratio 9.30 9.80 9.13 8.66 8.26 Income statement
Cost coverage 238.39 251.54 250.16 251.61 266.31 Net interest income 2.6 9.6 -4.7 0.7 5.7
ROA 6.84 6.54 4.34 5.09 6.04 Non-interest income -8.2 55.3 -22.3 -36.4 6.2
ROE 25.67 21.58 12.54 13.57 15.26 Total operating income 1.2 14.6 -7.4 -3.9 5.8
Non-interest expenses -1.2 8.6 -6.9 -4.5 -0.1
Oroa analysis (%) 2001A 2002A 2003F 2004F 2005F Pre-provision earnings 3.1 19.0 -7.7 -3.6 9.6
Net interest margin 19.70 20.94 19.96 19.97 20.16 Loan loss provisions -15.2 74.4 4.9 -19.0 -5.0
Non-int inc/gross inc 11.10 15.04 12.61 8.35 8.38 Core earnings 15.2 -28.1 -20.9 42.2 24.2
Efficiency ratio 41.95 39.76 39.97 39.74 37.55 Net profit 16.7 0.5 -32.8 18.3 24.2
Provision/assets 4.28 7.14 7.62 5.98 5.35
Balance sheet
Op return on assets 8.59 7.71 6.09 7.15 8.39 Loan growth 4.0 6.7 -1.9 3.3 6.1
Interest earning assets 4.4 1.8 -1.8 3.3 6.1
Equity/assets 28.50 32.04 34.89 36.92 38.46 Asset growth 5.6 4.5 -1.7 3.3 6.1
Deposit growth 0.7 0.0 -4.0 1.1 4.1
Op return on equity 30.12 24.05 17.46 19.38 21.82 Shareholders’ funds 22.1 17.4 7.1 9.3 10.5
Source: Company reports, ING estimates.
_
28
Aeon Credit (Asia)
October 2002
ING Financial Markets
AMSTERDAM LONDON NEW YORK HONG KONG TOKYO
Tel: 31 20 563 87 98 Tel: 44 20 7767 1000 Tel: 1 646 424 6000 Tel: 852 2848 8488 Tel: 813 5210 1500Fax: 31 20 563 87 66 Fax: 44 20 7767 7777 Fax: 1 646 424 6060 Fax: 852 2522 8640 Fax: 813 5210 1555
Bangkok Caracas Johannesburg Mexico City Sao Paulo
Tel: 662 263 2888-9 Tel: 58 212 263 8233 Tel: 27 11 302 3000 Tel: 52 55 5258 2000 Tel: 55 11 3847 6000
Bogota Dublin Kiev Milan Seoul
Tel: 571 317 6162 Tel: 353 1 638 4000 Tel: 380 44 230 3030 Tel: 39 02 4762 1 Tel: 822 317 1500
Bratislava Edinburgh Kuala Lumpur Moscow Shanghai
Tel: 421 2 5934 61 11 Tel: 44 131 527 3000 Tel: 603 2166 8803 Tel: 7095 755 5400 Tel: 86 21 6841 3355
Brussels Frankfurt Lima Paris Singapore
Tel: 32 2 547 70 60 Tel: 49 69 718 2701 Tel: 511 422 8565 Tel: 33 1 56 39 31 41 Tel: 65 6535 3688
Bucharest Geneva Liverpool Prague Sofia
Tel: 401 222 1600 Tel: 41 22 818 77 77 Tel: 44 151 472 5555 Tel: 420 2 232 0000 Tel: 359 2 917 6400
Budapest Istanbul Madrid Quito Taipei
Tel: 36 1 268 0140 Tel: 90 212 258 8770 Tel: 34 91 789 0030 Tel: 593 2 298 1650 Tel: 886 2 2734 7500
Buenos Aires Jakarta Manila Santiago Warsaw
Tel: 54 11 4310 4700 Tel: 62 21 515 1818 Tel: 632 840 8888 Tel: 562 330 0600 Tel: 48 22 820 5018
Disclaimer & Disclosures
This publication has been prepared on behalf of ING (being for this purpose the wholesale and investment banking business of ING Bank NV and
certain of its subsidiary companies) solely for the information of its clients. ING forms part of ING Group (being for this purpose ING Groep NV and
its subsidiary and affiliated companies). It is not investment advice or an offer or solicitation for the purchase or sale of any financial instrument.
While reasonable care has been taken to ensure that the information contained herein is not untrue or misleading at the time of publication, ING
makes no representation that it is accurate or complete. The information contained herein is subject to change without notice.
The following conflicts of interest or potential conflicts of interest are disclosed:
1. ING Group and any of its officers, employees, related accounts and/or discretionary accounts may, to the extent permitted by law, have
long or short positions, which could be substantial, or otherwise be interested in any transactions, in any investments (including
derivatives) referred to in this publication. In addition, ING may purchase, sell, or trade the investments referred to herein from time to time
in the open market or otherwise.
2. ING Group may provide banking or other services (including acting as adviser, manager or lender or liquidity provider) for, or solicit
banking or other business from, any company referred to in this publication.
3. In particular, as at or within 30 days prior to, the date of publication, one or more members of ING Group in relation specifically to the
company/ies covered in this publication where the following designations appear next to the company name:
[a] holds 1% or more of the share capital
[b] has lead managed or co-lead managed a public offering of the securities of the company in the last 12 months
[c] has lead managed or co-lead managed a public offering of the securities of the company in the last 5 years
[d] is a liquidity provider, or acts as designated sponsor or market maker on a German, French, Dutch or US stock exchange.
Neither ING nor any of its officers or employees accepts any liability for any direct or consequential loss arising from any use of this publication or its
contents. Copyright and database rights protection exists in this publication and it may not be reproduced, distributed or published by any person for
any purpose without the prior express consent of ING. All rights are reserved.
Any investments referred to herein may involve significant risk, are not necessarily available in all jurisdictions, may be illiquid and may not be
suitable for all investors. The value of, or income from, any investments referred to herein may fluctuate and/or be affected by changes in exchange
rates. Past performance is not indicative of future results. Investors should make their own investment decisions without relying on this publication.
Only investors with sufficient knowledge and experience in financial matters to evaluate the merits and risks should consider an investment in any
issuer or market discussed herein and other persons should not take any action on the basis of this publication.
This publication is issued:1) in the United Kingdom only to persons described in Articles 19, 47 and 49 of the Financial Services and Markets Act
2000 (Financial Promotion) Order 2001 and is not intended to be distributed, directly or indirectly, to any other class of persons (including private
investors); 2) in Italy only to persons described in Article No. 31 of Consob Regulation No. 11522/98.
Clients should contact analysts at, and execute transactions through, an ING entity in their home jurisdiction unless governing law permits otherwise.
ING Bank N.V., London branch is regulated for the conduct of investment business in the UK by the Financial Services Authority. It is incorporated in
the Netherlands and its London branch is registered in the UK (number BR000341) at 60 London Wall, London EC2M 5TQ.
ING Financial Markets LLC, which is a member of the NYSE, NASD and SIPC and part of ING, has accepted responsibility for the distribution of this
report in the United States under applicable requirements.
NYSE and NASD regulations will require that by November 6, 2002 ING disclose whether it has engaged in certain investment banking activity with
the subject company/ies of this report. Until implementation, please note that a member of ING Group may have received compensation for
investment banking services from the company/ies within the last 12 months or in the next 3 months expects to receive or intends to seek
compensation (in circumstances where it has a publicly announced mandate) for investment banking services from the company/ies.
Additional information is available on request. A0695HKRCFSL/HK.MA