aegon general account investments
TRANSCRIPT

Local knowledge. Global power. 1
Eric Goodman CIO AEGON USA
AEGON General account investments
Analyst and Investor Conference, London, 9 -10 June 2009

Local knowledge. Global power. 2
Key messages
o The debt crisis has created enormous stress in the credit markets, driving spreads to unprecedented levels, particularly in real estate-related sectors. Recently, credit spreads have begun to tighten, but they remain at stressed levels.
o Ratings Migration in Q1 was abnormally high, driven by Moody’s downgrades of RMBS. We expect migration for the remainder of 2009 to be well under Q1 levels.
o Q1 earnings were hurt by another quarter of high credit impairments. Alternative investment results were poor.
o The outlook for credit for the remainder of 2009 remains poor, although recently there have been signs that the debt crisis is decelerating, and systemic risk is fading.
o USA portfolio market value changes in Q1 were relatively modest, and generally consistent with broad market changes

Local knowledge. Global power. 3
Credit spreads by sector
Index spreads (%)

Local knowledge. Global power. 4
Bond prices by sector
Subprime crisis begins
Lehman failure
Index prices
Local knowledge. Global power. 5
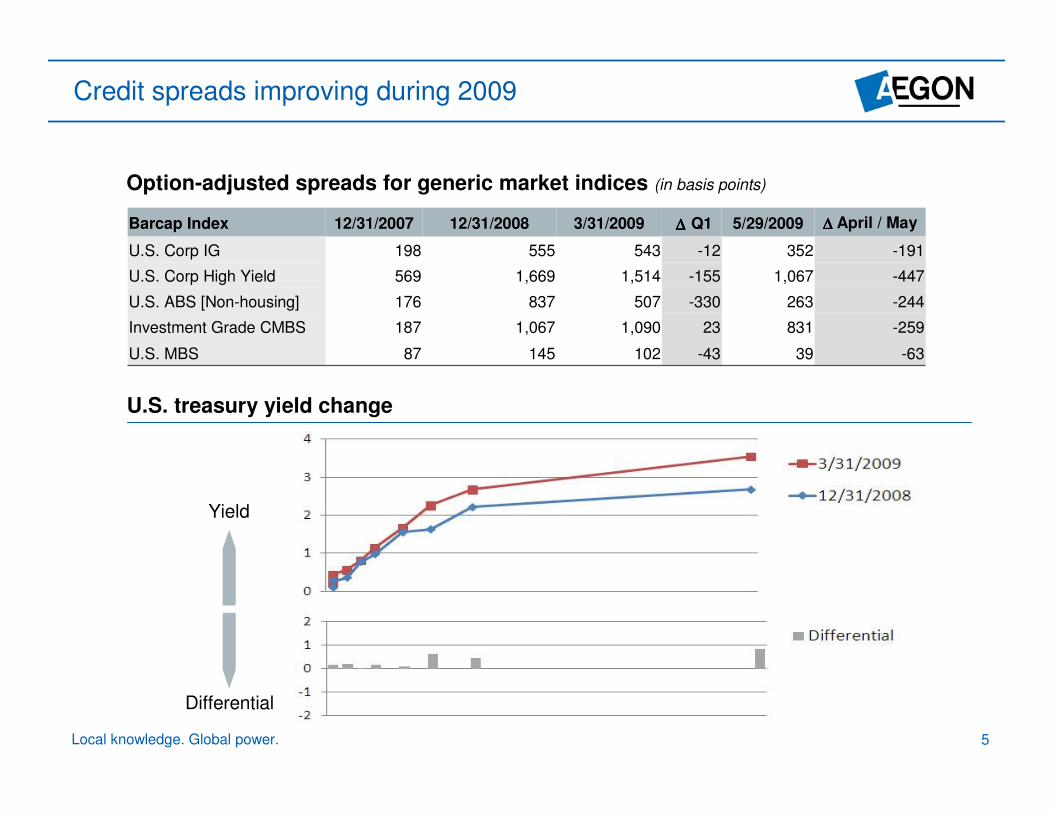
Credit spreads improving during 2009
Option-adjusted spreads for generic market indices (in basis points)
U.S. treasury yield change
Yield
Differential
Barcap Index 12/31/2007 12/31/2008 3/31/2009 ∆∆∆∆ Q1 5/29/2009 ∆ ∆ ∆ ∆ April / May
U.S. Corp IG 198 555 543 -12 352 -191
U.S. Corp High Yield 569 1,669 1,514 -155 1,067 -447
U.S. ABS [Non-housing] 176 837 507 -330 263 -244
Investment Grade CMBS 187 1,067 1,090 23 831 -259
U.S. MBS 87 145 102 -43 39 -63

Local knowledge. Global power. 6
75
90
105
120
135
150
165
180
195
210
225
jan/0
0
jul/00
jan/0
1
jul/01
jan/0
2
jul/02
jan/0
3
jul/03
jan/0
4
jul/04
jan/0
5
jul/05
jan/0
6
jul/06
jan/0
7
jul/07
jan/0
8
jul/08
jan/0
9
-40%
Housing stress: how low can it go?
S&P/Case-Shiller composite home price index
-30%
-35%
-45%

Local knowledge. Global power. 7
US general account positioned more defensively
Dec 31, 2007 Dec 31, 2008 Mar 31, 2009Change since
’07
Cash/Treasuries/Agency 8.6% 12.6% 16.5% �IG Corporate & Preferred 43.8% 41.6% 38.3% �High yield Corporate 3.6% 3.8% 4.5% �Emerging Markets Debt 2.1% 1.9% 1.6% �ABS 10.8% 10.1% 9.6% �MBS & CMO 5.8% 6.0% 5.8% -
Commercial MBS 5.5% 6.7% 6.8% �
Mortgage loans 13.2% 12.5% 12.5% �
Convertible Bonds & Pref Stock 0.5% 0.2% 0.2% �Common Equity 0.5% 0.5% 0.5% -
Private Equity & Real Estate 2.0% 1.9% 2.0% -
Hedge Funds 1.9% 0.9% 0.9% �Other 1.6% 1.4% 0.8% �Total 100% 100% 100%
USD billions* 127.4 130.0 127.5
EUR billions* 91.5 93.4 95.8
All numbers are for AEGON USA only and are on an IFRS amortized cost basis, excluding policy loans

Local knowledge. Global power. 8
8.4% 11.5%
31.5%31.3%
60.1% 57.2%
YE 2008 Q1 2009
Ratings migration peaked in Q1, expected to slow
o Ratings migration primarily due to downgrades of RMBS by Moody’s
o Majority of downgrades in structured investment portfolio were from A or above to below investment grade
o Ratings migration expected to be lower in remaining quarters of 2009
� NAIC 1 (AAA, AA, A)� NAIC 2 (BBB)� NAIC 3 – 6 (Below investment grade)
Ratings distribution of US fixed
income securities* (EUR 67 billion)
* Amortized cost, excluding interest rate hedges

Local knowledge. Global power. 9
44 4437
27
9
25
1 2 48
17
64
82
48
17
-6 -2
2
91
35
1990 1991 1992 1993 1994 1995 1996 1997 1998 1999 2000 2001 2002 2003 2004 2005 2006 2007 2008 Q12009
Credit losses in the US
Credit losses in bps of fixed income assets
o During Q1, impairments in the US totaled EUR 328 million, of which credit impairments were EUR 325 million
o Almost all fixed income instruments are held as Available For Sale securities and as such are only impaired through earnings if
1) we don't have the ability to hold, or 2) we intend to sell them, or3) we expect to receive less than full principal and interest
o Under IFRS, OTTI assets are marked to market. Under new GAAP standards now used by US peers, losses would have been about EUR 170 million (~18 basis points)

Local knowledge. Global power. 10
US impairments Q1 2009
EUR million IFRS US GAAP
ABS 133
CMBS -
RMBS 72
Subtotal structured assets 205
Corporate – private 2
Corporate – public 91
Subtotal corporate 93
Commercial mortgage loans 27
Subtotal net credit impairments 325
Common equity impairments 5
Total recoveries -2
Total net impairments 328 ~170
Under IFRS, assets are impaired to market value. Under new US GAAP rules – as applied by US peers – impairments reflect expected economic losses

Local knowledge. Global power. 11
US fair value items: alternative investments
o Alternative investment returns were disappointing in Q1, as real estate and private equity incurred losses.
o Hedge fund allocation was capped in early 2007, and more is being withdrawn as part of our risk reduction initiative.
Asset Class (EUR million)
Mar 31, 2009 Asset Balance
Expected Earnings Q1
2009
Actual Earnings Q1 2009
Hedge Funds 887 21 23
Private Equity 579 15 (24)
Mezzanine1 220 5 3
Real Estate2 1,141 28 (86)
Total 2,827 70 (84)
1 Mezzanine assets are available for sale assets; mark to market adjustments go through equity2 Transamerica Pyramid Property is marked to market through realized gains/losses vs. operating income

Local knowledge. Global power. 12
Market value changes by sector – US AFS portfolio
Percentage of portfolio
amortized cost
US AFS bond portfolioQ1 09
Market value / amortized cost
Q4 08Market value / amortized cost
9.6% Commercial MBS 70.9% 70.9%
1.8% Agency RMBS 102.3% 101.5%
10.0% Non-agency RMBS and subprime1 53.6% 59.1%
9.9% Non-housing related asset-backed securities 78.2% 70.6%
2.2% Emerging Markets 84.2% 85.3%
14.5% Financial IG 73.4% 78.0%
31.2% Industrial IG 91.6% 91.9%
7.6% Utility IG 92.2% 91.2%
6.3% High yield corporate 64.3% 70.9%
6.8% Sovereign 104.9% 112.4%
100% Total AFS Bond portfolio 81.1% 82.3%
88.8 Value in USD billion
66.7 Value in EUR billion
1 Includes manufactured housing ABS

Local knowledge. Global power. 13
Policyholder
account
31%
Off balance
sheet
29%
General
account
40%
General account mainly in Americas
Total investments
EUR 334 billion
General account
EUR 131 billion
As of March 31, 2009
Americas
67%
The
Netherlands
25%
Other
countries
4%
United
Kingdom
4%
Holding
0%

Local knowledge. Global power. 14
Commercial
mortgage loans, 9%
Residential
mortgage loans, 7%
Real estate, 2%
Other, 3%
Total equity like, 3%Total bonds, 76%
Portfolio composition by major asset class
4.4%5,792 0 401 749 4,642 Non-housing related ABS3.8%4,946 216 13 1,072 3,645 Residential MBS
0.2%201 79 0 34 88 Corporate other
100.0%130,601 5,693 5,541 32,835 86,466 Total
2.9%3,786 62 11 2,895 818 Other
2.4%3,163 --2,044 1,119 Real estate
3.1%4,065 233 106 902 2,826 Total equity like1.5%1,969 25 0 248 1,696 Private equity & hedge funds1.4%1,851 180 106 644 923 Common equity & bond funds0.2%245 28 0 10 207 Convertible bonds & preferred stock
16.1%21,048 250 0 8,798 12,000 Total mortgages9.2%12,008 0 0 86 11,922 Commercial mortgage loans6.9%9,040 250 0 8,712 78 Residential mortgage loans
75.5%98,539 5,148 5,424 18,196 69,703 Total bonds0.6%811 11 0 151 649 CDO1.2%1,621 58 119 0 1,444 Housing related ABS
3.8%4,973 0 311 45 4,617 Commercial MBS1.2%1,629 0 50 295 1,284 Emerging markets debt
2.5%3,217 20 98 315 2,777 High yield corporate32.1%41,879 1,751 4,159 3,163 32,766 IG corporates25.6%
Total (%)
33,470
Total1
3,013 273 12,372 17,791 Cash / Treasuries / Agencies
OCUKNLUSAsset class as of
March 31, 2009 (EUR million)
1 Includes Holding, excluding policy loans
Total General Account (market value)
Local knowledge. Global power. 15
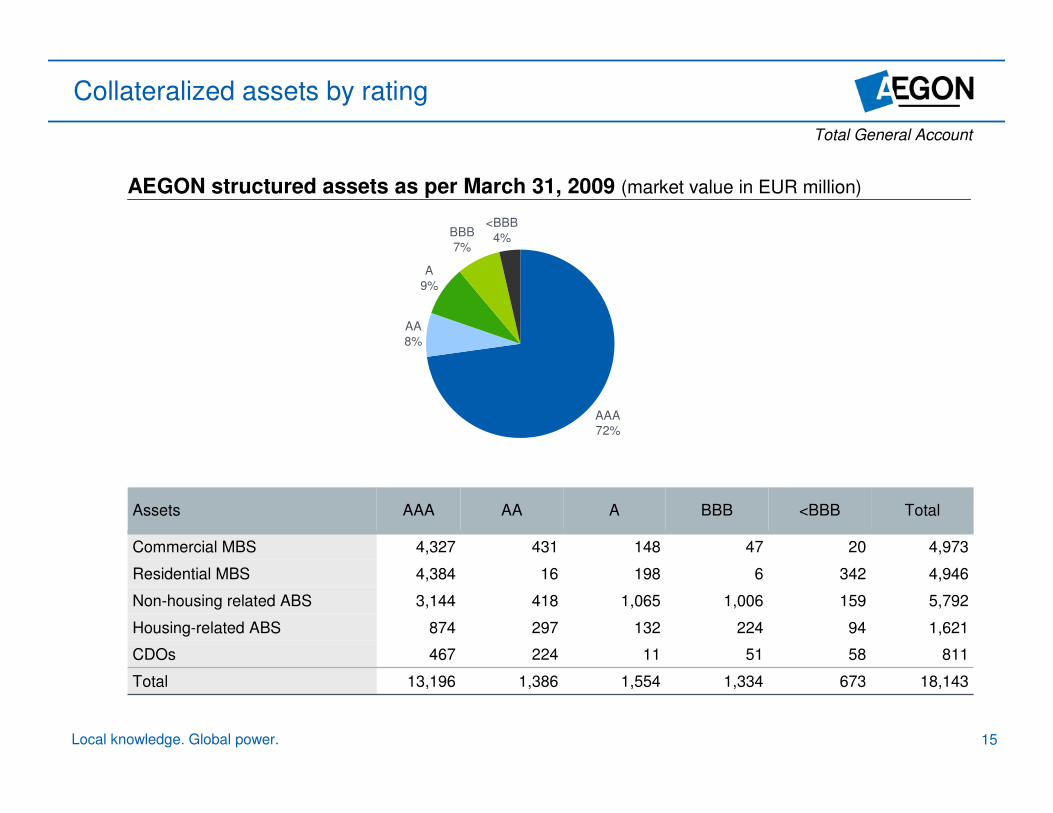
Collateralized assets by rating
AEGON structured assets as per March 31, 2009 (market value in EUR million)
18,143 673 1,334 1,554 1,386 13,196 Total
811 58 51 11 224 467 CDOs
1,621 94 224 132 297 874 Housing-related ABS
5,792 159 1,006 1,065 418 3,144 Non-housing related ABS
4,946 342 6 198 16 4,384 Residential MBS
4,973 20 47 148 431 4,327 Commercial MBS
Total<BBBA BBBAAAAAAssets
AA8%
A9%
AAA72%
<BBB4%BBB
7%
Total General Account

Local knowledge. Global power. 16
Corporate bonds by rating
AA
9.1%
A
43.3%
BBB
37.8%
NR
0.2%<BBB
8.0%
AAA
1.6%
Credits by rating as per March 31, 2009
201 62 108 16 15 0 0 Corporate other
100.0%0.2%8.0%37.8%43.3%9.1%1.6%Total %
1,629 3 499 776 331 20 0 Emerging markets debt
3,217 33 3,158 11 3 12 0 High yield
41,879 0 10 16,957 19,949 4,217 746 Investment grade
46,926
Total
98
NR
3,775
<BBB
20,298
A
17,760 4,249 746 Total
BBBAAAAAExternal ratings hierarchy of S&P, Moody’s, Fitch(all figures in EUR million)
Total General Account

Local knowledge. Global power. 17
Q&A
For questions please contact Investor Relations+31 70 344 8305
Local knowledge. Global power. 18
AppendixUS general account information (Q1 2009)
Starting Q1 2009, a break down of general account investments will be published in the Financial Supplement on a quarterly basis

Local knowledge. Global power. 1919
BB
5.1%
B
2.0%
Below B
1.7%
BBB
30.4%
A & above
60.8%
1 Based on amortized cost of bonds – IFRS Basis; includes AFS and FVTPL assets. Ratings based on a hierarchy of S&P, Moody’s, Fitch, Internal, NAIC.
US bond portfolio quality profile
EUR 68 billion1 - March 31, 2009
91% of US bond portfolio is investment grade
US investment portfolio detail

Local knowledge. Global power. 20
US corporate bonds by sector
US corporate bond portfolioMarch 31, 2009
IFRS Basis – Includes AFS and FVTPL assets.
Corporate bond sector (EUR million)
Market value
Amortized cost
Gross unrealized Net unrealized gain (loss)
% Market value to amortized
cost
Gain Loss
Financial Banking 4,514 6,513 10 (2,009) (1,999) 69.3%Brokerage 130 190 1 (61) (60) 68.5%Insurance 1,565 2,177 1 (613) (613) 71.9%Other – Finance 631 924 2 (295) (293) 68.3%REIT’s 857 1,184 1 (328) (327) 72.4%
Financial
Total7,696 10,988 14 (3,306) (3,292) 70.0%
Industrial Basic industry 1,756 2,095 16 (356) (340) 83.8%
Capital goods 2,596 2,915 35 (354) (319) 89.1%
Communications 3,466 3,888 17 (439) (422) 89.1%
Consumer cyclical 2,855 3,303 27 (475) (448) 86.4%
Consumer non-cyclical 5,744 6,028 97 (380) (283) 95.3%
Energy 2,461 2,823 15 (378) (362) 87.2%
Other industry 178 200 1 (22) (21) 89.4%
Technology 1,226 1,401 12 (187) (175) 87.5%
Transportation 1,209 1,365 13 (169) (156) 88.5%
Industry total 21,491 24,018 233 (2,760) (2,527) 89.5%
Sovereign 243 218 25 (0) 25 111.7%Sovereign
total243 218 25 (0) 25 111.7%
Utility Electric 3,423 3,698 37 (312) (275) 92.6%
Natural gas 1,654 1,832 8 (186) (178) 90.3%
Utility Other 165 182 3 (20) (17) 90.7%
Utility total 5,242 5,712 48 (518) (470) 91.8%
Grand total 34,673 40,936 321 (6,584) (6,263) 84.7%
US investment portfolio detail

Local knowledge. Global power. 21
US structured assets detail
Mortgage-backed and Asset-backed Securities Amortized costs March 31, 2009
(EUR million)Market value
Amortized costs
Net unrealized gain/loss
% Market value to
amortized costs
CMBS 4,544 6,309 (1,765) 72.0%RMBS - GSE Guaranteed 1,407 1,387 19 101.4%RMBS - Jumbo 549 816 (266) 67.4%RMBS - Alt-A 739 1,210 (471) 61.1%RMBS - Negative Amortization Floaters 654 1,720 (1,065) 38.1%RMBS - Reverse Mortgage Floaters 294 398 (105) 73.9%ABS - Credit Cards 2,364 2,921 (557) 80.9%ABS - Auto Loans 660 903 (243) 73.1%ABS - Other ABS 20 31 (11) 63.7%ABS - Student Loans 257 316 (59) 81.2%ABS - Rate Reduction 11 11 0 102.6%ABS - Small Business Loans 446 530 (84) 84.1%ABS - Timeshare 265 322 (57) 82.2%ABS - Aircraft 65 119 (53) 55.2%ABS - Equipment Lease 126 144 (18) 87.3%ABS - Franchise Loans 192 318 (126) 60.5%ABS - Structured Settlements 156 183 (28) 84.9%Subprime Residential Mtg Loans - fixed 836 1,545 (708) 54.1%Subprime Residential Mtg Loans - floating 388 843 (455) 46.0%ABS - Manufactured Housing 131 166 (34) 79.3%ABS - Other Housing Related 24 32 (8) 75.0%CDOs backed by ABS, Corp Bonds, Bank Loans 648 858 (210) 75.5%CDOs backed by CRE & CMBS 74 177 (103) 41.6%Grand Total 14,850 21,256 (6,406) 69.9%
US investment portfolio detail
IFRS Basis – Includes AFS and FVTPL assets.

Local knowledge. Global power. 22
Prime and near-prime residential MBS
o Almost all of AEGON’s Prime and Near-prime Residential MBS were rated AAA at the time of purchase
o The Near-prime portfolio is composed of primarily Fixed-rate Alt-A and Negative Amortization Floating-rate mortgage securitizations
o A majority of the “near prime” portfolio is supersenior
o In the current stressed environment, the risk of impairment on these securities has been growing as the margin of safety diminishes
Ratings hierarchy of S&P, Moody’s, Fitch, Internal (EUR million)
AAA SSNR
AAA SNR
AAA MEZZ
AAA SSUP
AA A BBB <BBBAmortized
costMarket value
GSE Guaranteed - 1,387 - - - - - - 1,387 1,407
Insured - - - 32 16 16 2 36 101 14
Prime Jumbo 233 358 8 9 13 72 5 116 814 549
Alt-A 661 197 - - - 17 - 337 1,210 739
Neg. am. floaters 1,446 31 8 16 3 - - 116 1,619 642
Rev. mortgage floaters - 398 - - - - - - 398 294
Residential mortgage-backed securities
2,340 2,372 16 56 32 104 7 604 5,531 3,644
SSNR = Super Senior; SNR = Senior; MEZZ = Mezzanine; SSUP = Senior Support
US investment portfolio detail
Figures per March 31, 2009

Local knowledge. Global power. 23
Subprime and near prime second lien collateral
o Ratings migration has been experienced in the mezzanine tranches of securitizations collateralized by Hybrid / ARM 1st Lien collateral
o Securitizations collateralized by near prime 2nd Lien collateral that are insured by monoline insurance companies have also experienced ratings migration, due to downgrades in the insurers financial strength ratings
US investment portfolio detail
Amortized costs / (unrealized loss)March 31, 2009
(EUR million)
Collateral
Insured Senior Subordinated Sub/residual TotalAmortized
costsUnrealized
lossAmortized
costsUnrealized
lossAmortized
costsUnrealized
lossAmortized
costsUnrealized
lossAmortized
costsUnrealized
loss
Fixed rate1st lien
262 (106) 789 (288) 178 (83) 0 0 1,229 (477)
Hybrid / ARM 1st lien
65 (36) 199 (75) 323 (236) 0 0 588 (347)
Closed end 2nd lien
491 (317) 68 (18) 10 (3) 2 (0) 571 (339)
Total 819 (460) 1,055 (381) 511 (322) 2 (0) 2,387 (1,163)
(1) Second lien collateral composed primarily of loans and alt-a borrowers.(2) Data in millions as of March 31, 2009 by collateral type and capital structure.

Local knowledge. Global power. 24
Subprime and second lien exposure
US investment portfolio detail
Amortized costs Fair value
Sub-prime first lien mortgages
Second lien
Sub-prime first lien mortgages
Second lien
(EUR million)Fixed rate
Floating rate
Fixed rate
Floating rate
Total amortized
cost
Total fair value
Unrealized gain / (loss)
AAA 641 195 66 420 151 48 902 618 (285)
AA 72 219 6 35 94 4 297 133 (165)
A 0 38 4 0 14 3 42 17 (24)
BBB 27 65 2 9 15 2 94 26 (68)
BIG 45 186 2 21 48 2 233 71 (162)
Wrapped 240 88 491 140 45 174 818 359 (459)
Total 1,025 790 571 625 367 232 2,387 1,224 (1,163)
(1) Second lien collateral composed primarily of loans and alt-a borrowers.(2) Ratings based on hierarchy of S&P, Moody’s, Fitch, Internal, NAIC.(3) Data in millions as of March 31, 2009 by coupon type.

Local knowledge. Global power. 25
US investment portfolio detail
Sub-prime and second lien by vintage
(EUR million) 2008 2007 2006 2005 Pre-2005 Amortized cost Fair value Unrealized lossAAA - 69 78 157 337 641 420 (221)AA - 17 1 10 45 72 35 (38)A - - - - 0 0 0 (0)BBB - 27 - - - 27 9 (18)BIG - 21 24 - - 45 21 (23)Wrapped - 123 19 - 98 240 140 (100)Total - 256 121 167 481 1,025 625 (400)
Subprime mortgages fixed rate - March 31, 2009
(1) Second lien collateral composed primarily of loans and alt-a borrowers.(2) Ratings based on hierarchy of S&P, Moody’s, Fitch, Internal, NAIC.(3) Data in millions as of March 31, 2009 by coupon type.
(EUR million) 2008 2007 2006 2005 Pre-2005 Amortized cost Fair value Unrealized loss
AAA - 53 44 77 20 195 151 (45)
AA - 45 88 74 12 219 94 (125)A - 23 4 - 11 38 14 (23)BBB - 8 56 - 1 65 15 (49)BIG - 92 71 24 - 186 48 (138)Wrapped 22 21 11 0 33 88 45 (43)Total 22 240 274 176 78 790 367 (424)
Subprime mortgages floating rate - March 31, 2009
(EUR million) 2008 2007 2006 2005 Pre-2005 Amortized cost Fair value Unrealized lossAAA - - - 3 63 66 48 (18)AA - - - - 6 6 4 (2)A - - - - 4 4 3 (1)BBB - - - - 2 2 2 (0)BIG - 2 1 - - 2 2 (0)Wrapped - 236 133 62 60 491 174 (317)Total - 237 134 65 135 571 232 (339)
Second lien - March 31, 2009
Local knowledge. Global power. 26
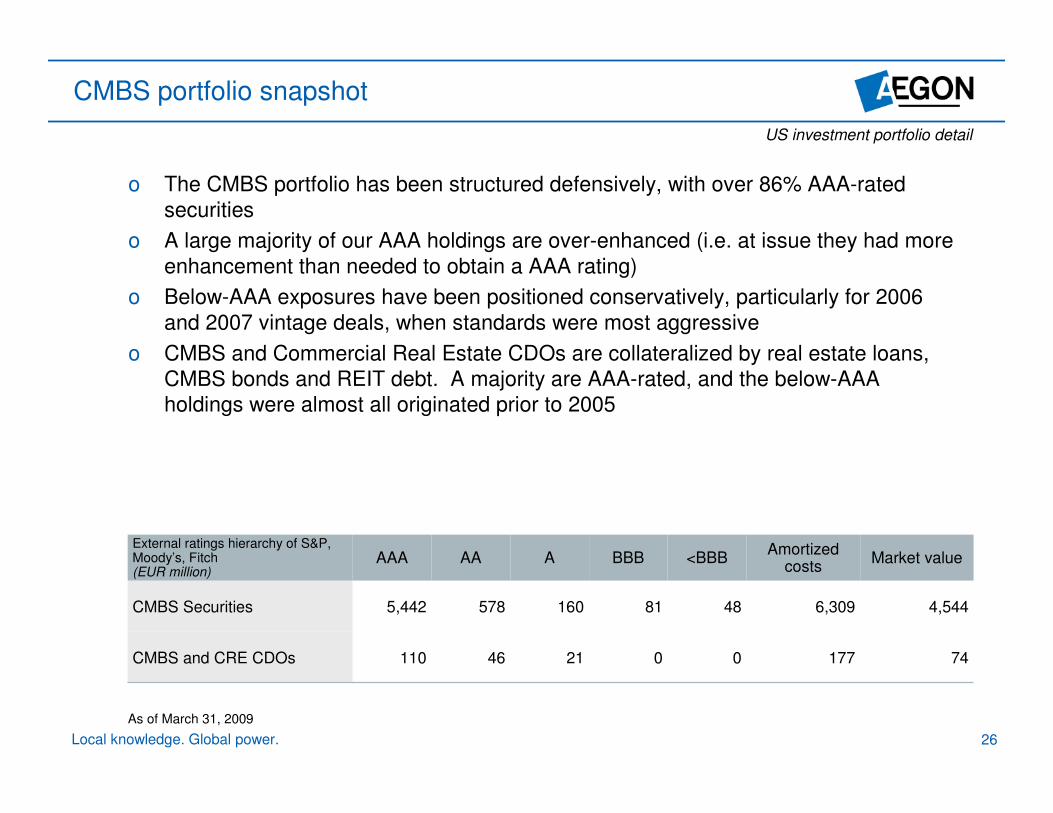
CMBS portfolio snapshot
External ratings hierarchy of S&P, Moody’s, Fitch(EUR million)
AAA AA A BBB <BBBAmortized
costsMarket value
CMBS Securities 5,442 578 160 81 48 6,309 4,544
CMBS and CRE CDOs 110 46 21 0 0 177 74
o The CMBS portfolio has been structured defensively, with over 86% AAA-rated securities
o A large majority of our AAA holdings are over-enhanced (i.e. at issue they had more enhancement than needed to obtain a AAA rating)
o Below-AAA exposures have been positioned conservatively, particularly for 2006 and 2007 vintage deals, when standards were most aggressive
o CMBS and Commercial Real Estate CDOs are collateralized by real estate loans, CMBS bonds and REIT debt. A majority are AAA-rated, and the below-AAA holdings were almost all originated prior to 2005
US investment portfolio detail
As of March 31, 2009
Local knowledge. Global power. 27
US investment portfolio detail
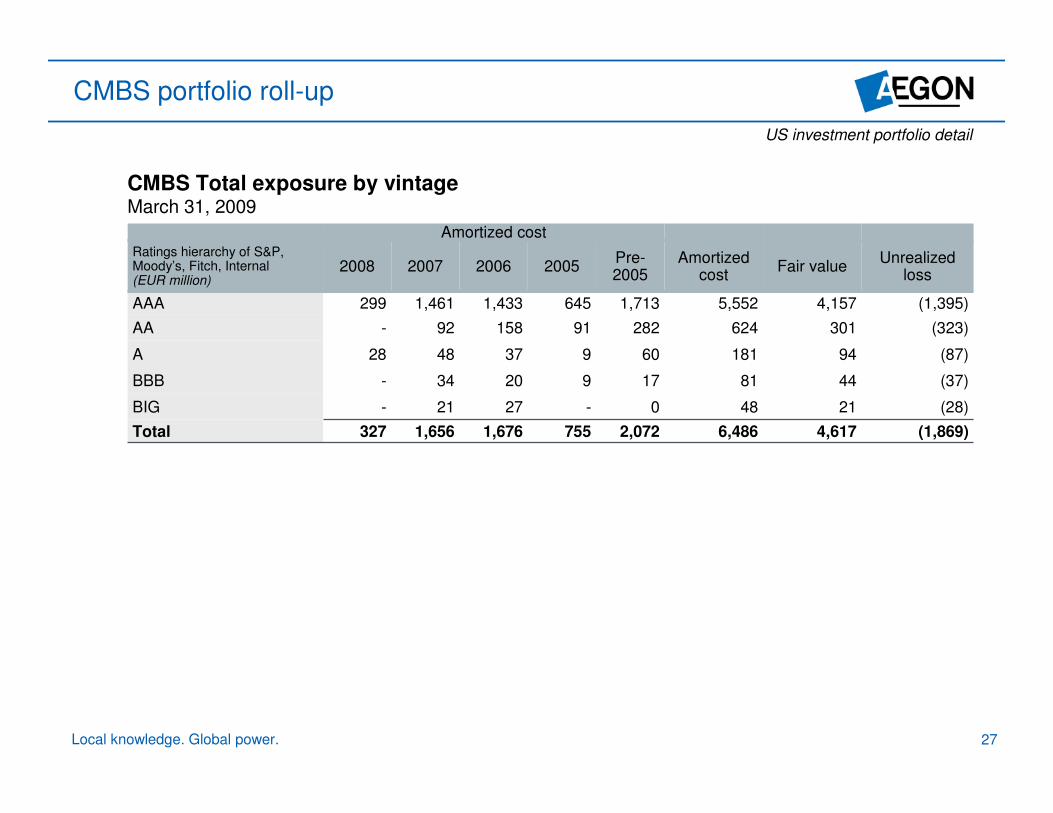
CMBS portfolio roll-up
Amortized costRatings hierarchy of S&P, Moody’s, Fitch, Internal(EUR million)
2008 2007 2006 2005Pre-2005
Amortized cost
Fair valueUnrealized
loss
AAA 299 1,461 1,433 645 1,713 5,552 4,157 (1,395)
AA - 92 158 91 282 624 301 (323)
A 28 48 37 9 60 181 94 (87)
BBB - 34 20 9 17 81 44 (37)
BIG - 21 27 - 0 48 21 (28)
Total 327 1,656 1,676 755 2,072 6,486 4,617 (1,869)
CMBS Total exposure by vintage March 31, 2009

Local knowledge. Global power. 28
Non-housing asset-backed securities
o Credit Card issuers in our portfolio are major financial institutions who have historically managed their Master Trusts successfully through several recessions
o Auto exposure is a mixture of consumer and commercial loans. Some corporate event risk
o CDOs are predominantly backed by senior secured bank loans
As of March 31, 2009
Ratings hierarchy of S&P, Moody’s, Fitch, Internal (EUR million)
AAA AA A BBB <BBBCost price
(EUR million)
Market value
(EUR million)
Credit Cards 1,338 285 439 755 104 2,921 2,364
Autos 282 37 244 284 56 903 660
Small Business Loans 471 10 13 35 1 530 446
CDOs (excl. CRE CDOs) 560 203 11 32 52 858 648
Other ABS 771 159 442 215 53 1,641 1,246
Non-housing ABS 3,423 695 1,149 1,321 265 6,854 5,365
US investment portfolio detail

Local knowledge. Global power. 29
High quality commercial mortgages
0
0.5
1
1.5
2
2.5
3
3.5
0%
- 9
%
10
% -
19
%
20
% -
29
%
30
% -
39
%
40
% -
49
%
50
% -
59
%
60
% -
69
%
70
% -
79
%
80
% -
89
%
90
%-1
00
+%
Dec '07 Dec '08 Mar '09
< 65% LTV 63.4% 61.4% 58.4%
65-75% LTV 26.3% 20.3% 20.7%
>75% LTV 10.4% 18.4% 20.9%
Total 100% 100% 100%
$16.8 Billion $15.1 Billion $14.9 Billion
Denomination in U.S. Dollars
2009 balance (USD billion)
LTV distribution(USD billion)
US investment portfolio detail

Local knowledge. Global power. 30
Cautionary note regarding forward-looking statements
The statements contained in this presentation that are not historical facts are forward-looking statements as defined in the US Private Securities Litigation Reform Act of 1995. The following are words that identify such forward-looking statements: believe, estimate, target, intend, may, expect, anticipate, predict, project, counting on, plan, continue, want, forecast, should, would, is confident, will, and similar expressions as they relate to our company. These statements are not guarantees of future performance and involve risks, uncertainties and assumptions that are difficult to predict. We undertake no obligation to publicly update or revise any forward-looking statements. Readers are cautioned not to place undue reliance on these forward-looking statements, which merely reflect company expectations at the time of writing. Actual results may differ materially from expectations conveyed in forward-looking statements due to changes caused by various risks and uncertainties. Such risks and uncertainties include but are not limited to the following:
• Changes in general economic conditions, particularly in the United States, the Netherlands and the United Kingdom;
• Changes in the performance of financial markets, including emerging markets, such as with regard to:
– The frequency and severity of defaults by issuers in our fixed income investment portfolios; and
– The effects of corporate bankruptcies and/or accounting restatements on the financial markets and the resulting decline in the value of equity and debt securities we hold;
• The frequency and severity of insured loss events;
• Changes affecting mortality, morbidity and other factors that may impact the profitability of our insurance products;
• Changes affecting interest rate levels and continuing low or rapidly changing interest rate levels;
• Changes affecting currency exchange rates, in particular the EUR/USD and EUR/GBP exchange rates;
• Increasing levels of competition in the United States, the Netherlands, the United Kingdom and emerging markets;
• Changes in laws and regulations, particularly those affecting our operations, the products we sell, and the attractiveness of certain products to our consumers;
• Regulatory changes relating to the insurance industry in the jurisdictions in which we operate;
• Acts of God, acts of terrorism, acts of war and pandemics;
• Changes in the policies of central banks and/or governments;
• Litigation or regulatory action that could require us to pay significant damages or change the way we do business;
• Customer responsiveness to both new products and distribution channels;
• Competitive, legal, regulatory, or tax changes that affect the distribution cost of or demand for our products;
• Our failure to achieve anticipated levels of earnings or operational efficiencies as well as other cost saving initiatives; and
• The impact our adoption of the International Financial Reporting Standards may have on our reported financial results and financial condition.
Further details of potential risks and uncertainties affecting the company are described in the company’s filings with Euronext Amsterdam and the US Securities and Exchange Commission, including the Annual Report on Form 20-F. These forward-looking statements speak only as of the date of this document. Except as required by any applicable law or regulation, the company expressly disclaims any obligation or undertaking to release publicly any updates or revisions to any forward-looking statements contained herein to reflect any change in the company’s expectations with regard thereto or any change in events, conditions or circumstances on which any such statement is based.
Cautionary note regarding Regulation G (non-GAAP measure)
This presentation includes certain non-GAAP financial measures: net operating earnings, operating earnings before tax, (net) underlying earnings, value of new business and
embedded value. Value of new business and embedded value are not based on IFRS, which are used to prepare and report AEGON’s financial statements and should not be
viewed as a substitute for IFRS financial measures. AEGON believes the non-GAAP measures shown herein, together with GAAP information, provides a meaningful measure
for the investment community to evaluate AEGON’s business relative to the businesses of our peers.
Cautionary note regarding forward-looking statements

Local knowledge. Global power. 31