aegon fund management inc. audited annual financial statements … · aegon fund management inc....
TRANSCRIPT

AEGON Fund Management Inc.
AUDITED ANNUAL FINANCIAL STATEMENTS
as at December 31, 2008

Dear imaxxFunds™ Investor, For most investors, 2008 proved to be a difficult year. Global stock markets posted significant declines in the second half of the year, driven by the expanding U.S. credit crisis. The surprising failures of several major American and European financial institutions in the latter part of the year led to the seizure of credit markets and panic selling in equity markets around the world. This reversal in equity markets was especially shocking for Canadian investors. In June the TSX had hit an all-time high, primarily due to the strong demand for oil and gas and other commodities. However, as the credit crisis deepened, concerns were raised about the continued global economic growth and this in turn led to a decline in commodity prices, the value of the Canadian dollar and the TSX. The speed and extent of the downturn surprised even the most seasoned of investors. As we enter a new year, the general consensus is that the global economy will remain sluggish for at least the first half of 2009. However, there are many factors that may provide support for a turnaround. These include the coordinated actions by central banks and governments around the world to stimulate economic activity, and an environment of low inflation and interest rates. While these are challenging times for all investors, from a long-term perspective history teaches us that economies and stock markets are generally resilient and inevitably recover from such downturns. At AEGON Fund Management, our core investment belief is that a balanced portfolio is the best way for investors to achieve their long-term financial goals; our lineup of mutual funds continues to be an excellent investment choice. Our funds are managed by some of the finest Canadian and international investment managers, all with proven, long term track records. While our product line is strong, we derive tremendous benefit from our relationship with our global parent company – AEGON N.V. As one the world’s largest financial institutions, AEGON’s businesses serve millions of customers in over twenty markets throughout the Americas, Europe and Asia. Respect, quality, transparency, and trust constitute AEGON’s core values as the company continually strives to meet the expectations of customers, shareholders, employees and business partners. Creating a better future for all its stakeholders is central to AEGON’s overall mission. We believe your advisor can assist you to structure an investment portfolio that can help you meet your long-term financial goals. AEGON Fund Management’s fund offering, in partnership with your advisor, can be an integral part of your investment planning. We hope you find this report useful, and if you have any questions or would like more information about imaxxFunds, please contact us at 1-866-imaxx-go (1-866-462-9946) or visit our website at imaxxwealth.com. We welcome your comments. On behalf of AEGON Fund Management, thank you for your continued support and we look forward to serving you in the years to come. Sincerely yours,
Doug Brooks Chairman, President and Chief Executive Officer AEGON Fund Management Inc.
A U D I T O R S’ R E P O R T
To the Unitholders of: imaxx Money Market Fund imaxx TOP Conservative Portfolio imaxx Canadian Balanced Fund imaxx TOP Balanced Portfolio imaxx Canadian Bond Fund imaxx TOP Income Portfolio imaxx Canadian Dividend Fund imaxx TOP Growth Portfolio imaxx Canadian Fixed Pay Fund imaxx TOP Aggressive Growth Portfolio imaxx Canadian Equity Growth Fund (collectively, the “Funds”) imaxx Canadian Equity Value Fund imaxx Canadian Small Cap Fund imaxx U.S. Equity Growth Fund imaxx U.S. Equity Value Fund imaxx Global Equity Value Fund imaxx Global Equity Growth Fund We have audited the Portfolio Holdings of each of the Funds as at December 31, 2008 and each of the Funds’ Statements of Net Assets as at December 31, 2008 and 2007, and each of their Statements of Operations and Statements of Changes in Net Assets for the years then ended. These financial statements are the responsibility of the Funds’ Manager. Our responsibility is to express an opinion on these financial statements based on our audits. We conducted our audits in accordance with Canadian generally accepted auditing standards. Those standards require that we plan and perform an audit to obtain reasonable assurance whether the financial statements are free of material misstatement. An audit includes examining, on a test basis, evidence supporting the amounts and disclosures in the financial statements. An audit also includes assessing the accounting principles used and significant estimates made by the Funds’ Manager, as well as evaluating the overall financial statement presentation. In our opinion, these financial statements present fairly, in all material respects, the portfolio investments as at December 31, 2008, the financial position as at December 31, 2008 and 2007, and the results of operations and changes in net assets for the years then ended in accordance with Canadian generally accepted accounting principles.
Toronto, Canada February 27, 2009

STATEMENT OF INVESTMENT PORTFOLIO as at December 31, 2008imaxx Money Market Fund
Shares/Par Value
Fair Value % of Fair Value
Average Cost % of Average Cost
CASH AND OTHER NET ASSETS ($5,813) (0.07%) ($5,813) (0.07%)
SHORT-TERM --CANADIANBearer Deposit NotesAlberta Treasury Branch 13 Jan 09 225,000 224,856 223,983 Total 224,856 2.65% 223,983 2.65%
Provincial Treasury BillsProvince of British Columbia 27 Mar 09 125,000 124,349 123,666 Province of British Columbia 06 May 09 150,000 148,979 148,631 Province of New Brunswick 22 Jan 09 240,000 239,704 238,889 Province of New Brunswick 02 Jun 09 125,000 124,239 124,120 Province of Nova Scotia 20 Jan 09 145,000 144,814 144,189 Province of Ontario 11 Feb 09 220,000 219,482 218,854 Province of Ontario 20 Feb 09 125,000 124,531 123,309 Total 1,126,098 13.25% 1,121,658 13.24%
Treasury BillsGovernment of Canada 05 Feb 09 1,365,000 1,362,579 1,358,915 Government of Canada 19 Feb 09 110,000 109,603 107,424 Government of Canada 05 Mar 09 1,545,000 1,540,410 1,536,765 Government of Canada 19 Mar 09 660,000 657,102 653,167 Government of Canada 02 Apr 09 555,000 552,650 550,664 Government of Canada 16 Apr 09 620,000 616,371 611,520 Government of Canada 30 Apr 09 350,000 348,040 347,364 Government of Canada 28 May 09 1,255,000 1,249,893 1,249,389 Government of Canada 25 Jun 09 425,000 423,220 423,202 Government of Canada 06 Aug 09 100,000 98,358 97,396 Government of Canada 03 Sep 09 150,000 147,212 146,081 Government of Canada 01 Oct 09 50,000 49,253 49,074 Total 7,154,691 84.17% 7,130,961 84.18%
Total: SHORT-TERM -- CANADIAN $8,505,645 100.07% $8,476,602 100.07%
Total $8,499,832 $8,470,789Transaction Costs (Note 2) - - 0.00%
Total Net Assets $8,499,832 100.00% $8,470,789 100.00%See accompanying notes to the financial statements.

A0406YTD
STATEMENTS OF NET ASSETS as at December 31
A0206YTD2008 2007
Assets Investments at fair value (Note 2) 8,505,645$ 3,793,130$ Cash 149 665 Dividends and interest receivable - - Subscriptions receivable - 14,616 Receivable for securities sold 69,947 150,000 Other receivables - 1,195 Total assets 8,575,741$ 3,959,606 Liabilities Bank overdraft - - Accrued expenses and other liabilities 5,097 4,505 Payable for units redeemed 6,080 4,872 Payable for investment purchases 64,732 148,263 Other payables - - Total liabilities 75,909 157,640 Net assets representing unitholders' equity 8,499,832$ 3,801,966$
Net assetsClass A 6,723,061$ 2,260,080$ Class F - - Class I 1,776,771 1,541,886 Class I - seed - - Number of units outstanding (Note 4)Class A 672,306 226,008 Class F - - Class I 177,677 154,189 Class I - seed - - Net assets per unit (Note 9)Class A 10.00$ 10.00$ Class F - - Class I 10.00 10.00 Class I - seed - -
See accompanying notes to the financial statements.
Approved by AEGON Fund Management Inc. on behalf of the Funds:
Approved by:
Doug Brooks Glenn DanielsPresident and CEO SVP, General Counsel and Corporate Secretary
imaxx Money Market Fund

STATEMENTS OF OPERATIONS for the years ended December 31
A0206YTD2008 2007
Investment income Interest on bonds and debentures -$ -$ Dividends - - Short-term interest 161,164 251,876 Distribution from underlying funds - - Other income 801 349 Less foreign withholding taxes - - Total investment income 161,965 252,225 Expenses Management and advisory fees (Note 5) 35,958 15,256 Administration and recordkeeping 25,003 25,552 Audit fees 5,005 5,431 Custodian fees 3,744 4,662 Goods and Services Tax 1,850 1,267 Other - - Total expenses 71,560 52,168 Expenses absorbed by manager (Note 5) (32,709) (28,608) Net expenses 38,851 23,560 Net invesment income (loss) 123,114$ 228,665$ Realized and unrealized gain (loss) on investmentsRealized gain (loss) on sale of investments -$ -$ Exchange gain (loss) on foreign currencies & other net assets - - Net realized gain (loss) on sale of investments - - Change in unrealized appreciation (depreciation) of investments - - Exchange gain (loss) on foreign currencies & other net assets - - Net unrealized gain (loss) on investments - - Transaction Cost - - Net gain (loss) on investments -$ -$
Increase (decrease) in net assets from operations 123,114$ 228,665$
Increase (decrease) in net assets from operations Class A 70,794$ 62,034$ Class F - - Class I 52,320 166,631 Class I - seed - - Increase (decrease) in net assets from operations per daily average number of units Class A 0.20$ 0.33$ Class F - - Class I 0.31 0.42 Class I - seed - -
See accompanying notes to the financial statements.
imaxx Money Market Fund

STATEMENTS OF CHANGES IN NET ASSETS
For the year ended December 31, 2008
Increase (decrease) in net assets from operations $ 70,794 $ - $ 52,320 $ - $ 123,114
Capital transactions (Note 4)Proceeds from units issued 8,052,154 - 394,025 - 8,446,179 Reinvested distributions 60,990 - 56,744 - 117,734 Amounts paid for units redeemed (3,655,014) - (213,672) - (3,868,686) Net capital transactions 4,458,130 - 237,097 - 4,695,227
Distributions to unitholders From net investment income (65,943) - (54,532) - (120,475) From capital gains - - - - - Return of capital - - - - - Net distributions to unitholders (65,943) - (54,532) - (120,475)
Total increase (decrease) in net assets 4,462,981 - 234,885 - 4,697,866
Net assets, beginning of the year 2,260,080 - 1,541,886 - 3,801,966 Total net assets, end of the year $ 6,723,061 $ $ 1,776,771 $ $ 8,499,832
For the year ended December 31, 2007
Increase (decrease) in net assets from operations $ 62,034 $ - $ 166,631 $ - $ 228,665
Capital transactions (Note 4)Proceeds from units issued 2,857,512 - 1,357,801 - 4,215,313 Reinvested distributions 60,392 - 177,274 - 237,666 Amounts paid for units redeemed (2,894,535) - (4,424,434) - (7,318,969) Net capital transactions 23,369 - (2,889,359) - (2,865,990)
Distributions to unitholders From net investment income (60,012) - (176,539) - (236,551) From capital gains - - - - - Return of capital - - - - - Net distributions to unitholders (60,012) - (176,539) (236,551)
Total increase (decrease) in net assets 25,391 - (2,899,267) - (2,873,876)
Net assets, beginning of the year 2,234,689 - 4,441,153 - - Total net assets, end of the year $ 2,260,080 $ - $ 1,541,886 $ - $ 3,801,966
See accompanying notes to the financial statements.
imaxx Money Market FundClass A Class F Class I Class I - Seed Total Fund

STATEMENT OF INVESTMENT PORTFOLIO as at December 31, 2008imaxx Canadian Bond Fund
Shares/Par Value
Fair Value % of Fair Value
Average Cost % of Average Cost
CASH AND OTHER NET ASSETS $10,663 0.08% $10,663 0.08%
SHORT-TERM --CANADIANTreasury BillsGovernment of Canada 05 Feb 09 125,000 124,775 124,507 Government of Canada 05 Mar 09 25,000 24,929 24,893 Total 149,704 1.12% 149,400 1.10%
Total: SHORT-TERM -- CANADIAN $149,704 1.12% $149,400 1.10%
BONDS --CANADIANAsset BackedAlgonquin Credit Card Trust 5.459% 15 Jul 11 200,000 197,260 200,000 Canada Mortgage Accept. Corp. 4.500% 15 Apr 09 52,000 51,893 48,523 Canadian Credit Card Trust 4.813% 26 Apr 10 200,000 201,070 200,000 Canadian Credit Card Trust 5.263% 24 Apr 12 350,000 363,444 350,000 Falcon Trust Commercial Mtge. 5.057% 15 Jan 14 79,000 77,945 76,714 Genesis Trust 4.202% 15 Mar 10 153,000 151,750 151,972 Genesis Trust 4.434% 15 Sep 11 152,000 148,924 152,000 Gloucester Credit Card Trust 5.377% 15 Jun 10 150,000 150,978 150,000 Gloucester Credit Card Trust 6.486% 15 May 14 388,000 386,495 414,481 Merrill Lynch Fin. Assets Inc. 5.600% 12 Jun 09 40,000 40,043 38,935 Merrill Lynch Fin. Assets Inc. 6.450% 12 Oct 13 50,000 46,246 47,070 Merrill Lynch Fin. Assets Inc. 5.653% 12 Mar 15 300,000 224,516 294,347 Merrill Lynch Fin. Assets Inc. 5.840% 12 Mar 15 43,000 32,632 40,844 Merrill Lynch Fin. Assets Inc. 5.317% 12 Jul 15 100,000 68,610 99,197 Merrill Lynch Fin. Assets Inc. 4.942% 12 May 17 125,000 95,559 124,991 Merrill Lynch Fin. Assets Inc. 5.139% 12 May 17 100,000 73,220 99,993 Merrill Lynch Fin. Assets Inc. 6.005% 12 Apr 14 42,000 33,872 39,468 Real Est. Asset Liquid. Trust 5.976% 12 Oct 14 67,000 60,982 66,331 Real Est. Asset Liquid. Trust 5.314% 12 Apr 17 381,000 299,382 376,096 Real Est. Asset Liquid. Trust 5.039% 12 Mar 17 144,000 116,788 143,989 Score Trust 5.629% 20 Feb 14 150,000 147,682 150,000 Xceed Mortgage Trust 5.925% 17 Feb 11 204,000 193,461 204,000 Total 3,162,752 23.66% 3,468,951 25.54%
Canadian Federal GovernmentGovernment of Canada 6.000% 01 Jun 11 706,000 785,940 764,367 Government of Canada 3.750% 01 Jun 12 100,000 107,425 103,040 Government of Canada 3.500% 01 Jun 13 52,000 55,982 53,236 Government of Canada 5.000% 01 Jun 14 271,000 313,509 285,914 Government of Canada 4.500% 01 Jun 15 107,000 122,167 115,207 Government of Canada 4.000% 01 Jun 16 456,000 507,346 474,313 Government of Canada 4.250% 01 Jun 18 2,144,000 2,421,434 2,273,891 Government of Canada 5.750% 01 Jun 33 254,000 345,587 312,508 Government of Canada 5.000% 01 Jun 37 115,000 147,034 132,825 Total 4,806,424 35.96% 4,515,301 33.24%
Corporate BankBMO Capital Trust 10.221% 31 Dec 18 400,000 415,508 400,000 Total 415,508 3.11% 400,000 2.95%
Corporate FinanceDaimlerChrysler Canada Finance 4.700% 10 Nov 09 114,000 113,129 113,877 Erac Canada Finance Ltd. 5.380% 26 Feb 16 169,000 158,865 168,885 Honda Canada Finance Inc. 5.076% 09 May 13 325,000 308,051 325,000 Total 580,045 4.34% 607,762 4.47%

STATEMENT OF INVESTMENT PORTFOLIO as at December 31, 2008imaxx Canadian Bond Fund
Shares/Par Value
Fair Value % of Fair Value
Average Cost % of Average Cost
Corporate Health CareLeisureworld Senior Care LP 4.814% 24 Nov 15 200,000 187,602 200,000 Total 187,602 1.40% 200,000 1.47%
Corporate Industrial ProductFinning International Inc. 6.020% 01 Jun 18 390,000 355,727 389,750 Holcim Finance (Canada) Inc. 5.900% 21 Jun 13 200,000 192,520 199,722 Total 548,247 4.10% 589,472 4.34%
Corporate Infrastructure407 International Inc. 5.750% 14 Feb 36 101,000 73,189 100,871 Blue Water Bridge Authority 6.410% 09 Jul 27 87,142 114,727 89,632 Greater Toronto Airports Auth. 5.260% 17 Apr 18 299,000 275,983 298,976 Greater Toronto Airports Auth. 6.980% 15 Oct 32 69,000 66,540 79,580 NAV Canada 4.713% 24 Feb 16 250,000 247,738 250,836 Total 778,177 5.82% 819,895 6.04%
Corporate MerchandisingLoblaw Companies Ltd. 6.540% 17 Feb 33 309,000 240,430 319,852 Total 240,430 1.80% 319,852 2.35%
Corporate PipelinesAlliance Pipeline L.P. 6.765% 31 Dec 25 61,705 69,714 61,758 Enbridge Pipelines Inc. 6.620% 19 Nov 18 300,000 321,057 299,871 Total 390,771 2.93% 361,629 2.66%
Corporate Real EstateBoardwalk REIT 5.610% 23 Jan 12 150,000 150,224 149,929 Royal Office Finance LP 5.209% 12 Nov 32 207,683 205,399 207,681 Total 355,623 2.66% 357,610 2.63%
Corporate UtilitiesCU Inc. 5.556% 30 Oct 37 150,000 127,983 150,000 CU Inc. 5.580% 26 May 38 351,000 300,849 351,000 Electricity Distrib. Fin. Co. 6.450% 15 Aug 12 170,000 181,033 180,510 Hydro One Inc. 5.000% 12 Nov 13 375,000 386,441 374,588 Hydro Ottawa Holding Inc. 4.930% 09 Feb 15 170,000 169,660 171,594 Total 1,165,966 8.72% 1,227,692 9.04%
Provincial GovernmentProvince of Ontario 3.000% 08 Mar 09 61,000 69,178 61,927 Province of Ontario 4.200% 08 Mar 18 500,000 505,180 493,715 Total 574,358 4.30% 555,642 4.09%
Total: BONDS -- CANADIAN $13,205,903 98.80% $13,423,806 98.82%
Total $13,366,270 $13,583,869Transaction Costs (Note 2) - - 0.00%
Total Net Assets $13,366,270 100.00% $13,583,869 100.00%See accompanying notes to the financial statements.

A0406YTD
STATEMENTS OF NET ASSETS as at December 31
A0206YTD2008 2007
Assets Investments at fair value (Note 2) 13,355,607$ 10,845,673$ Cash 13,293 8,587 Dividends and interest receivable 107,418 101,457 Subscriptions receivable 12,635 1,903 Receivable for securities sold 70,810 20,868 Other receivables 4,636 1,486 Total assets 13,564,399$ 10,979,974$ Liabilities Bank overdraft - - Accrued expenses and other liabilities 15,833 12,165 Payable for units redeemed 420 19,339 Payable for investment purchases 181,876 - Other payables - - Total liabilities 198,129 31,504 Net assets representing unitholders' equity 13,366,270$ 10,948,470$
Net assetsClass A 4,622,629$ 3,218,161$ Class F - - Class I 8,743,641 7,730,309 Class I - seed - - Number of units outstanding (Note 4)Class A 463,679 319,008 Class F - - Class I 816,101 723,733 Class I - seed - - Net assets per unit (Note 9)Class A 9.97$ 10.09$ Class F - - Class I 10.71 10.68 Class I - seed - -
See accompanying notes to the financial statements.
Approved by AEGON Fund Management Inc. on behalf of the Funds:
Approved by:
Doug Brooks Glenn DanielsPresident and CEO SVP, General Counsel and Corporate Secretary
imaxx Canadian Bond Fund

STATEMENTS OF OPERATIONS for the years ended December 31
A0206YTD2008 2007
Investment income Interest on bonds and debentures 632,020$ 494,540$ Dividends - - Short-term interest 6,814 5,008 Distribution from underlying funds - - Other income 1,197 - Less foreign withholding taxes - - Total investment income 640,031 499,548 Expenses Management and advisory fees (Note 5) 95,862 68,346 Administration and recordkeeping 33,891 28,736 Audit fees 5,990 5,431 Custodian fees 3,871 4,881 Goods and Services Tax 6,098 5,265 Other - 174 Total expenses 145,712 112,833 Expenses absorbed by manager (Note 5) (17,662) (19,646) Net expenses 128,050 93,187 Net invesment income (loss) 511,981$ 406,361$ Realized and unrealized gain (loss) on investmentsRealized gain (loss) on sale of investments 118,647$ (66,196)$ Exchange gain (loss) on foreign currencies & other net assets - - Net realized gain (loss) on sale of investments 118,647 (66,196) Change in unrealized appreciation (depreciation) of investments (152,521) (264,508) Exchange gain (loss) on foreign currencies & other net assets - - Net unrealized gain (loss) on investments (152,521) (264,508) Transaction Cost - - Net gain (loss) on investments (33,874)$ (330,704)$
Increase (decrease) in net assets from operations 478,107$ 75,657$
Increase (decrease) in net assets from operations Class A 109,470$ (8,296)$ Class F - - Class I 368,637 83,953 Class I - seed - - Increase (decrease) in net assets from operations per daily average number of units Class A 0.25$ (0.03)$ Class F - - Class I 0.48 0.13 Class I - seed - -
See accompanying notes to the financial statements.
imaxx Canadian Bond Fund

STATEMENTS OF CHANGES IN NET ASSETS
For the year ended December 31, 2008
Increase (decrease) in net assets from operations $ 109,470 $ - $ 368,637 $ - $ 478,107
Capital transactions (Note 4)Proceeds from units issued 3,345,211 - 2,071,251 - 5,416,462 Reinvested distributions 195,560 - 340,459 - 536,019 Amounts paid for units redeemed (2,049,580) - (1,426,557) - (3,476,137) Net capital transactions 1,491,191 - 985,153 - 2,476,344
Distributions to unitholders From net investment income (185,725) - (321,983) - (507,708) From capital gains (10,468) - (18,475) - (28,943) Return of capital - - - - - Net distributions to unitholders (196,193) - (340,458) - (536,651)
Total increase (decrease) in net assets 1,404,468 - 1,013,332 - 2,417,800
Net assets, beginning of the year 3,218,161 $ - $ 7,730,309 - 10,948,470 Total net assets, end of the year $ 4,622,629 $ $ 8,743,641 $ $ 13,366,270
For the year ended December 31, 2007
Increase (decrease) in net assets from operations $ (8,296) $ - $ 83,953 $ - $ 75,657
Capital transactions (Note 4)Proceeds from units issued 1,853,149 - 2,466,555 - 4,319,704 Reinvested distributions 115,071 - 285,184 - 400,255 Amounts paid for units redeemed (645,258) - (1,439,223) - (2,084,481) Net capital transactions 1,322,962 - 1,312,516 - 2,635,478
Distributions to unitholders From net investment income (115,138) - (285,184) - (400,322) From capital gains - - - - Return of capital - - - - Net distributions to unitholders (115,138) - (285,184) - (400,322)
Total increase (decrease) in net assets 1,199,528 - 1,111,285 - 2,310,813
Net assets, beginning of the year 2,018,633 - 6,619,024 - 8,637,657 Total net assets, end of the year $ 3,218,161 $ - $ 7,730,309 $ - $ 10,948,470
See accompanying notes to the financial statements.
imaxx Canadian Bond FundClass A Class F Class I Class I - Seed Total Fund

STATEMENT OF INVESTMENT PORTFOLIO as at December 31, 2008imaxx Canadian Fixed Pay Fund
Shares/Par Value
Fair Value % of Fair Value
Average Cost % of Average Cost
CASH AND OTHER NET ASSETS $1,594,341 1.02% $1,594,341 0.80%
BONDS --CANADIANAsset BackedAlgonquin Credit Card Trust 4.799% 15 Oct 10 256,000 251,095 256,000 Algonquin Credit Card Trust 5.459% 15 Jul 11 846,000 834,410 846,000 Canada Mortgage Accept. Corp. 4.760% 15 Jun 10 927,000 916,905 907,171 Canada Mortgage Accept. Corp. 4.568% 15 Jun 10 1,000,000 984,790 999,968 Canadian Credit Card Trust 4.813% 26 Apr 10 800,000 804,280 800,000 Canadian Credit Card Trust 5.263% 24 Apr 12 350,000 363,444 350,000 Eagle Credit Card Trust 4.981% 17 Mar 11 328,000 322,732 328,000 Eagle Credit Card Trust 4.701% 17 Mar 11 327,000 326,369 327,000 Falcon Trust Commercial Mtge. 5.057% 15 Jan 14 182,000 179,570 177,297 Genesis Trust 4.202% 15 Mar 10 586,000 581,212 582,062 Glacier Credit Card Trust 4.674% 20 Nov 09 1,000,000 997,810 1,000,000 Gloucester Credit Card Trust 6.486% 15 May 14 1,847,000 1,839,834 1,992,348 Merrill Lynch Fin. Assets Inc. 5.600% 12 Jun 09 74,000 74,079 72,946 Merrill Lynch Fin. Assets Inc. 6.450% 12 Oct 13 86,000 79,543 84,510 Merrill Lynch Fin. Assets Inc. 5.317% 12 Jul 15 1,000,000 686,104 991,968 Merrill Lynch Fin. Assets Inc. 6.005% 12 Apr 14 119,000 95,971 113,404 Real Est. Asset Liquid. Trust 5.093% 12 Oct 15 1,000,000 837,020 966,721 Real Est. Asset Liquid. Trust 4.618% 12 Sep 16 1,500,000 1,368,240 1,499,921 Real Est. Asset Liquid. Trust 4.872% 12 Mar 16 1,000,000 932,060 999,921 Score Trust 5.629% 20 Feb 14 280,000 275,674 280,358 Total 12,751,142 8.15% 13,575,595 6.83%
Canadian Federal GovernmentGovernment of Canada 4.250% 01 Sep 09 1,250,000 1,278,750 1,251,000 Government of Canada 6.000% 01 Jun 11 516,000 574,427 560,097 Government of Canada 3.500% 01 Jun 13 1,537,000 1,654,703 1,541,380 Government of Canada 5.000% 01 Jun 14 510,000 589,999 551,718 Government of Canada 4.000% 01 Jun 16 2,564,000 2,852,706 2,653,610 Government of Canada 4.250% 01 Jun 18 449,000 507,101 471,660 Government of Canada 5.750% 01 Jun 29 206,000 271,108 253,277 Government of Canada 5.000% 01 Jun 37 687,000 878,371 746,167 Total 8,607,165 5.50% 8,028,909 4.04%
Corporate FinanceErac Canada Finance Ltd. 5.380% 26 Feb 16 1,000,000 940,030 999,320 Total 940,030 0.60% 999,320 0.50%
Corporate Health CareLeisureworld Senior Care LP 4.814% 24 Nov 15 1,500,000 1,407,015 1,500,000 Total 1,407,015 0.90% 1,500,000 0.76%
Corporate Industrial ProductFinning International Inc. 6.020% 01 Jun 18 300,000 273,636 299,808 New Gold Inc. 10.000% 28 Jun 17 1,250,000 800,000 1,057,500 Total 1,073,636 0.69% 1,357,308 0.68%
Corporate Infrastructure407 International Inc. 5.750% 14 Feb 36 607,000 439,856 606,223 Blue Water Bridge Authority 6.410% 09 Jul 27 131,153 172,670 140,479 Greater Toronto Airports Auth. 5.260% 17 Apr 18 718,000 662,728 717,943 NAV Canada 4.713% 24 Feb 16 1,000,000 990,950 1,000,000 Total 2,266,204 1.45% 2,464,645 1.24%

STATEMENT OF INVESTMENT PORTFOLIO as at December 31, 2008imaxx Canadian Fixed Pay Fund
Shares/Par Value
Fair Value % of Fair Value
Average Cost % of Average Cost
Corporate MerchandisingLoblaw Companies Ltd. 6.540% 17 Feb 33 1,088,000 846,562 1,154,117 Total 846,562 0.54% 1,154,117 0.58%
Corporate Oil and GasKeyera Facilities Income Fund 8.250% 31 Dec 13 1,700,000 1,598,000 1,598,000 Total 1,598,000 1.02% 1,598,000 0.80%
Corporate PipelinesAlliance Pipeline L.P. 6.765% 31 Dec 25 90,934 102,739 98,620 Total 102,739 0.07% 98,620 0.05%
Corporate Real EstateHuntingdon REIT 8.000% 22 Mar 10 1,000,000 813,500 1,000,000 Huntingdon REIT 8.000% 28 Jun 10 750,000 584,400 750,000 Lanesborough REIT 8.000% 17 Feb 10 1,000,000 825,900 1,000,000 Whiterock REIT 8.000% 28 Jun 10 1,403,500 1,333,325 1,403,500 Total 3,557,125 2.27% 4,153,500 2.09%
Corporate UtilitiesCU Inc. 5.580% 26 May 38 715,000 612,841 715,000 Electricity Distrib. Fin. Co. 6.450% 15 Aug 12 372,000 396,143 397,506 Hydro Ottawa Holding Inc. 4.930% 09 Feb 15 1,171,000 1,168,658 1,181,533 Total 2,177,642 1.39% 2,294,039 1.15%
Provincial GovernmentProvince of Ontario 3.000% 08 Mar 09 151,000 171,244 152,657 Total 171,244 0.11% 152,657 0.08%
Total: BONDS -- CANADIAN $35,498,504 22.69% $37,376,710 18.80%
EQUITIES --CANADIANConsumer DiscretionaryCineplex Galaxy Income Fund 220,122 3,009,068 3,502,798 Groupe Aeroplan Inc. 236,145 2,047,377 3,574,470 Keg Royalties Income Fund 54,886 364,992 725,026 North West Company Fund 128,640 2,162,438 2,484,310 Yellow Pages Income Fund 233,961 1,551,161 2,803,565 Total 9,135,036 5.84% 13,090,169 6.59%
Consumer StaplesLiquor Stores Income Fund 186,451 1,940,955 3,262,329 Rogers Sugar Income Fund 278,477 1,058,213 1,446,237 Total 2,999,168 1.92% 4,708,566 2.37%
EnergyAdvantage Energy Income Fund 293,849 1,480,999 3,581,897 ARC Energy 49,100 984,455 1,045,098 Baytex Energy Ltd. 262,972 3,807,835 5,855,222 Canadian Oil Sands Trust 215,092 4,523,385 7,051,897 Crescent Point Energy Trust 343,282 8,238,768 6,512,865 Fairborne Energy Ltd. 184,265 1,077,950 1,965,882 Inter Pipeline Fund 202,400 1,426,920 1,924,127 Keyera Facilities Income Fund 222,300 3,948,048 4,018,114 Paramount Energy Trust 166,955 824,758 1,401,214

STATEMENT OF INVESTMENT PORTFOLIO as at December 31, 2008imaxx Canadian Fixed Pay Fund
Shares/Par Value
Fair Value % of Fair Value
Average Cost % of Average Cost
Precision Drilling Corp. 167,447 1,684,517 3,090,345 Progress Energy Trust 180,745 1,601,401 2,231,113 Trilogy Energy Trust 162,800 939,356 1,604,931 Vermilion Energy Trust 229,204 5,736,976 6,032,314 Zargon Energy Trust 52,800 911,856 1,394,782 Total 37,187,224 23.77% 47,709,801 24.01%
FinancialAllied Properties 206,071 2,557,341 4,405,044 Altus Group Income Fund 210,049 1,575,368 2,316,650 Boardwalk REIT 135,600 3,464,580 4,572,251 Calloway REIT 322,200 3,647,304 6,435,928 Cominar REIT 102,668 1,643,715 1,500,858 First Capital Realty Inc. 170,931 3,223,759 3,181,234 H&R REIT 235,968 1,746,163 4,646,018 Killam Properties Inc. 140,572 607,271 701,051 Lakeview Hotel REIT 114,950 91,960 480,491 Lanesborough REIT 154,300 347,175 824,131 Morguard REIT 173,455 1,994,732 1,498,901 Total 20,899,368 13.36% 30,562,557 15.38%
Health CareAlaris Royalty Corp 122,600 1,103,400 1,471,200 Futuremed Healthcare Inc. Fund 196,000 1,426,880 1,783,600 Medical Facilities Corp. 137,800 1,039,012 1,601,240 Total 3,569,292 2.28% 4,856,040 2.44%
Income Trust UnitsLabrador Iron Ore Royalty 70,242 1,494,750 3,007,908 RioCan REIT 214,056 2,924,005 5,146,912 Total 4,418,755 2.83% 8,154,820 4.10%
IndustrialAG Growth Income Fund 230,527 4,469,919 4,227,179 Armtec Infrastructure Income 58,840 999,692 1,418,619 Badger Income Fund 87,721 1,394,764 1,468,392 Bird Construction Income Fund 156,758 3,105,376 2,112,774 Canadian Helicopters Inc. Fund 360,050 3,028,020 3,600,500 Cervus LP Trust Units 130,223 1,119,918 2,482,125 Genivar Income Fund 109,826 2,751,141 2,900,380 IBI Income Fund 216,142 2,595,865 2,161,420 Total 19,464,695 12.44% 20,371,389 10.25%
Information TechnologyThe Data Group Income Fund 685,869 2,777,769 6,760,338 Total 2,777,769 1.78% 6,760,338 3.40%
MaterialsBarrick Gold Corporation 83,000 3,708,440 2,704,161 New Gold Inc. Warrants 2017/06/28 146,887 44,066 192,502 Total 3,752,506 2.40% 2,896,663 1.46%
Telecommunication ServicesBell Aliant Reg. Comm. 22,871 536,782 750,116 Total 536,782 0.34% 750,116 0.38%

STATEMENT OF INVESTMENT PORTFOLIO as at December 31, 2008imaxx Canadian Fixed Pay Fund
Shares/Par Value
Fair Value % of Fair Value
Average Cost % of Average Cost
UtilitiesAltaGas Utlity Group Inc. 253,915 4,331,790 6,114,612 Energy Savings Income Fund 303,429 2,630,729 4,573,256 Innergex Power Income Fund 396,638 3,649,070 5,249,690 Northland Power Income Trust 314,650 3,627,914 4,116,434 Total 14,239,503 9.10% 20,053,992 10.09%
Total: EQUITIES -- CANADIAN $118,980,098 76.06% $159,914,451 80.47%
EQUITIES -- FOREIGNMaterialsSPDR Gold Trust 3,450 364,013 301,275 Total 364,013 0.23% 301,275 0.15%
Total: EQUITIES -- FOREIGN $364,013 0.23% $301,275 0.15%
Total $156,436,956 $199,186,777Transaction Costs (Note 2) - (440,354) (0.22%)
Total Net Assets $156,436,956 100.00% $198,746,423 100.00%See accompanying notes to the financial statements.

A0406YTD
STATEMENTS OF NET ASSETS as at December 31
A0206YTD2008 2007
Assets Investments at fair value (Note 2) 154,842,615$ 238,762,915$ Cash - 189,383 Dividends and interest receivable 1,703,844 1,882,279 Subscriptions receivable 17,447 240,799 Receivable for securities sold 617,216 173,805 Other receivables 27,810 - Total assets 157,208,932$ 241,249,181$ Liabilities Bank overdraft 451,547 - Accrued expenses and other liabilities 186,537 366,134 Payable for units redeemed 133,890 413,280 Payable for investment purchases 2 582,000 Other payables - - Total liabilities 771,976 1,361,414 Net assets representing unitholders' equity 156,436,956$ 239,887,767$
Net assetsClass A 59,442,844$ 94,083,368$ Class F 81,477 32,656 Class I 96,912,635 145,771,743 Class I - seed - - Number of units outstanding (Note 4)Class A 7,630,815 8,106,907 Class F 10,825 2,924 Class I 11,284,076 11,686,598 Class I - seed - - Net assets per unit (Note 9)Class A 7.79$ 11.61$ Class F 7.53 11.17 Class I 8.59 12.47 Class I - seed - -
See accompanying notes to the financial statements.
Approved by AEGON Fund Management Inc. on behalf of the Funds:
Approved by:
Doug Brooks Glenn DanielsPresident and CEO SVP, General Counsel and Corporate Secretary
imaxx Canadian Fixed Pay Fund

STATEMENTS OF OPERATIONS for the years ended December 31
A0206YTD2008 2007
Investment income Interest on bonds and debentures 2,157,501$ 2,264,176$ Dividends 14,949,446 16,137,044 Short-term interest 94,377 95,014 Distribution from underlying funds - - Other income 1,895 - Less foreign withholding taxes 1,401 - Total investment income 17,204,620 18,496,234 Expenses Management and advisory fees (Note 5) 2,437,236 2,774,357 Administration and recordkeeping 645,291 756,227 Audit fees 5,990 5,431 Custodian fees 17,784 21,278 Goods and Services Tax 152,015 213,438 Other - 71,540 Total expenses 3,258,316 3,842,271 Expenses absorbed by manager (Note 5) (65,998) - Net expenses 3,192,318 3,842,271 Net invesment income (loss) 14,012,302$ 14,653,963$ Realized and unrealized gain (loss) on investmentsRealized gain (loss) on sale of investments (6,735,144)$ (1,506,133)$ Exchange gain (loss) on foreign currencies & other net assets 302,935 2,565 Net realized gain (loss) on sale of investments (6,432,209) (1,503,568) Change in unrealized appreciation (depreciation) of investments (64,390,783) 15,551,255 Exchange gain (loss) on foreign currencies & other net assets 44,128 (1,334) Net unrealized gain (loss) on investments (64,346,655) 15,549,921 Transaction Cost (206,828) (545,036) Net gain (loss) on investments (70,985,692)$ 13,501,317$
Increase (decrease) in net assets from operations (56,973,390)$ 28,155,280$
Increase (decrease) in net assets from operations Class A (23,661,883)$ 10,009,697$ Class F (7,504) 3,474 Class I (33,304,003) 18,142,109 Class I - seed - - Increase (decrease) in net assets from operations per daily average number of units Class A (2.93)$ 1.19$ Class F -1.92 1.19 Class I -2.90 1.49 Class I - seed - -
See accompanying notes to the financial statements.
imaxx Canadian Fixed Pay Fund

STATEMENTS OF CHANGES IN NET ASSETS
For the year ended December 31, 2008
Increase (decrease) in net assets from operations $ (23,661,883) $ (7,504) $ (33,304,003) $ - $ (56,973,390)
Capital transactions (Note 4)Proceeds from units issued 17,210,915 61,848 7,116,953 - 24,389,716 Reinvested distributions 2,922,192 1,318 10,967,846 - 13,891,356 Amounts paid for units redeemed (23,371,367) (2,717) (22,671,768) - (46,045,852) Net capital transactions (3,238,260) 60,449 (4,586,969) - (7,764,780)
Distributions to unitholders From net investment income (7,740,381) (4,124) (10,968,136) - (18,712,641) From capital gains - - - - - Return of capital - - - - - Net distributions to unitholders (7,740,381) (4,124) (10,968,136) - (18,712,641)
Total increase (decrease) in net assets (34,640,524) 48,821 (48,859,108) - (83,450,811)
Net assets, beginning of the year 94,083,368 32,656 145,771,743 239,887,767 Total net assets, end of the year $ 59,442,844 $ 81,477 $ 96,912,635 $ - $ 156,436,956
For the year ended December 31, 2007
Increase (decrease) in net assets from operations $ 10,009,697 $ 3,474 $ 18,142,109 $ - $ 28,155,280
Capital transactions (Note 4)Proceeds from units issued 16,048,435 - 5,371,715 - 21,420,150 Reinvested distributions 3,315,014 - 11,648,504 - 14,963,518 Amounts paid for units redeemed (33,431,338) - (43,617,403) - (77,048,741) Net capital transactions (14,067,889) - (26,597,184) - (40,665,073)
Distributions to unitholders From net investment income (8,022,151) (2,870) (11,648,503) - (3,629,222) From capital gains - - - - - Return of capital - - - - - Net distributions to unitholders (8,022,151) (2,870) (11,648,503) - (3,629,222)
Total increase (decrease) in net assets (12,080,343) 667 (20,103,578) - (8,022,568)
Net assets, beginning of the year 106,163,711 31,989 165,875,321 - 272,071,021 Total net assets, end of the year $ 94,083,368 $ 32,656 $ 145,771,743 $ - $ 239,887,767
See accompanying notes to the financial statements.
imaxx Canadian Fixed Pay FundClass A Class F Class I Class I - Seed Total Fund

STATEMENT OF INVESTMENT PORTFOLIO as at December 31, 2008imaxx Canadian Balanced Fund
Shares/Par Value
Fair Value % of Fair Value
Average Cost % of Average Cost
CASH AND OTHER NET ASSETS $9,637 0.25% $9,637 0.23%
SHORT-TERM --CANADIANTreasury BillsGovernment of Canada 19 Feb 09 20,000 19,953 19,921 Government of Canada 05 Mar 09 100,000 99,757 99,665 Total 119,710 3.09% 119,586 2.89%
Total: SHORT-TERM -- CANADIAN $119,710 3.09% $119,586 2.89%
BONDS --CANADIANAsset BackedAlgonquin Credit Card Trust 5.092% 15 Jun 12 60,000 62,072 60,000 Broadway Credit Card Trust 5.234% 17 Jun 11 40,000 40,642 40,000 Merrill Lynch Fin. Assets Inc. 4.942% 12 May 17 25,000 19,112 24,998 Merrill Lynch Fin. Assets Inc. 5.139% 12 May 17 25,000 18,305 24,998 Total 140,131 3.62% 149,996 3.63%
Canadian Federal GovernmentGovernment of Canada 4.000% 01 Sep 10 16,000 16,782 16,310 Government of Canada 6.000% 01 Jun 11 345,000 384,064 374,484 Government of Canada 3.500% 01 Jun 13 103,000 110,888 103,841 Government of Canada 5.000% 01 Jun 14 125,000 144,608 132,100 Government of Canada 4.250% 01 Jun 18 381,000 430,301 399,645 Government of Canada 5.750% 01 Jun 29 37,000 48,694 44,207 Government of Canada 5.750% 01 Jun 33 69,000 93,880 85,591 Total 1,229,217 31.75% 1,156,178 27.98%
Corporate Industrial ProductFinning International Inc. 6.020% 01 Jun 18 40,000 36,485 39,974 Total 36,485 0.94% 39,974 0.97%
Corporate InfrastructureGreater Toronto Airports Auth. 5.260% 17 Apr 18 42,000 38,767 41,997 Greater Toronto Airports Auth. 6.980% 15 Oct 32 9,000 8,679 10,380 Total 47,446 1.23% 52,377 1.27%
Corporate MerchandisingLoblaw Companies Ltd. 6.540% 17 Feb 33 48,000 37,348 49,614 Total 37,348 0.96% 49,614 1.20%
Corporate UtilitiesCU Inc. 5.580% 26 May 38 49,000 41,999 49,000 Total 41,999 1.08% 49,000 1.18%
Total: BONDS -- CANADIAN $1,532,626 39.58% $1,497,139 36.23%
EQUITIES --CANADIANConsumer DiscretionaryCelestica Inc. 3,805 21,004 24,898 Cogeco Cable Inc. 75 2,584 2,670 Rogers Communications Inc. 1,632 59,715 56,292 Shaw Communications Inc. 2,897 62,546 64,451 Total 145,849 3.77% 148,311 3.59%
Consumer StaplesEmpire Co. Ltd. 582 28,227 27,033 Shoppers Drug Mart Inc. 719 34,534 34,780 Total 62,761 1.62% 61,813 1.50%

STATEMENT OF INVESTMENT PORTFOLIO as at December 31, 2008imaxx Canadian Balanced Fund
Shares/Par Value
Fair Value % of Fair Value
Average Cost % of Average Cost
EnergyCanadian Natural Res. Ltd. 2,045 99,694 131,951 EnCana Corporation 2,397 136,533 134,005 Highpine Oil & Gas Limited 3,179 16,404 22,196 Husky Energy Inc. 1,428 44,054 52,130 Imperial Oil Limited 1,339 54,859 52,432 Nuvista Energy Ltd. 1,180 9,782 13,400 Petro-Canada 374 9,993 10,760 Suncor Energy Inc. 3,673 87,124 116,106 TriStar Oil & Gas Ltd. 1,645 18,588 17,721 Total 477,031 12.32% 550,701 13.33%
FinancialBank of Montreal 650 20,293 25,837 Bank of Nova Scotia 2,086 69,151 95,947 Cdn Imperial Bank of Commerce 489 24,924 30,301 Fairfax Financial Holdgs Ltd. 101 38,569 35,145 Laurentian Bank Of Canada 611 20,963 26,892 Manulife Financial Corporation 2,932 60,868 105,342 National Bank of Canada 923 28,890 34,437 Power Corporation of Canada 1,851 41,111 52,099 Power Financial Corporation 1,411 33,427 43,294 Royal Bank of Canada 3,737 134,532 186,752 Sun Life Financial Inc. 562 15,933 26,842 Toronto-Dominion Bank 2,495 108,333 147,656 Total 596,994 15.42% 810,544 19.61%
IndustrialBombardier Inc. 13,505 59,692 82,147 Canadian National Railway Co. 181 8,098 9,339 Canadian Pacific Railway Ltd. 1,073 43,843 60,466 Onex Corporation 1,375 24,764 38,163 Total 136,397 3.52% 190,115 4.60%
Information TechnologyCGI Group Inc. 561 5,330 5,482 Research in Motion Limited 752 37,194 49,209 SXC Health Solution Corp. 282 6,390 5,723 Total 48,914 1.26% 60,414 1.46%
MaterialsAgnico-Eagle Mines Ltd. 1,137 71,369 43,725 Barrick Gold Corporation 3,436 153,520 137,295 Blue Note Mining Inc. Warrants 2009/11/08 5,425 - - Coalcorp Mining Inc. Warrants 2011/08/17 499 2 699 Coalcorp Mining Inc. Warrants 2011/02/08 1,100 6 3,099 Goldcorp Inc. 935 35,867 25,681 IAMGOLD Corporation 5,691 42,398 25,892 Kinross Gold Corp. 3,213 72,292 51,226 Potash Corporation of Saskatchewan Inc. 360 32,227 49,143 Red Back Mining Inc. 7,020 59,740 39,574 Total 467,421 12.07% 376,334 9.11%
Telecommunication ServicesBCE Inc. 1,964 49,198 67,198 TELUS Corporation 824 28,428 38,735 Total 77,626 2.01% 105,933 2.56%

STATEMENT OF INVESTMENT PORTFOLIO as at December 31, 2008imaxx Canadian Balanced Fund
Shares/Par Value
Fair Value % of Fair Value
Average Cost % of Average Cost
UtilitiesAtco Ltd. 118 4,445 4,583 Emera Incorporated 673 14,927 14,753 Enbridge Inc. 1,598 63,121 67,724 Fortis Inc. 648 15,934 16,621 TransCanada Corp. 2,204 73,107 80,873 Total 171,534 4.43% 184,554 4.47%
Total: EQUITIES -- CANADIAN $2,184,527 56.42% $2,488,719 60.23%
EQUITIES -- FOREIGNConsumer DiscretionaryTim Hortons Inc. 728 25,378 24,422 Total 25,378 0.66% 24,422 0.59%
Total: EQUITIES -- FOREIGN $25,378 0.66% $24,422 0.59%
Total $3,871,878 $4,139,503Transaction Costs (Note 2) - (7,348) (0.17%)
Total Net Assets $3,871,878 100.00% $4,132,155 100.00%See accompanying notes to the financial statements.

A0406YTD
STATEMENTS OF NET ASSETS as at December 31
A0206YTD2008 2007
Assets Investments at fair value (Note 2) 3,862,241$ 4,979,463$ Cash 18,287 35,443 Dividends and interest receivable 15,018 15,911 Subscriptions receivable 60 - Receivable for securities sold 41,336 4,561 Other receivables - 888 Total assets 3,936,942$ 5,036,266$ Liabilities Bank overdraft - - Accrued expenses and other liabilities 3,880 8,819 Payable for units redeemed - - Payable for investment purchases 61,184 29,707 Other payables - - Total liabilities 65,064 38,526 Net assets representing unitholders' equity 3,871,878$ 4,997,740$
Net assetsClass A 1,957,982$ 2,718,976$ Class F - - Class I - - Class I - seed 1,913,896 2,278,764 Number of units outstanding (Note 4)Class A 227,247 253,486 Class F - - Class I - - Class I - seed 211,174 206,192 Net assets per unit (Note 9)Class A 8.62$ 10.73$ Class F - - Class I - - Class I - seed 9.06 11.05
See accompanying notes to the financial statements.
Approved by AEGON Fund Management Inc. on behalf of the Funds:
Approved by:
Doug Brooks Glenn DanielsPresident and CEO SVP, General Counsel and Corporate Secretary
imaxx Canadian Balanced Fund

STATEMENTS OF OPERATIONS for the years ended December 31
A0206YTD2008 2007
Investment income Interest on bonds and debentures 80,502$ 62,237$ Dividends 57,842 42,709 Short-term interest 12,749 17,180 Distribution from underlying funds - - Other income - 1,547 Less foreign withholding taxes (48) (223) Total investment income 151,045 123,450 Expenses Management and advisory fees (Note 5) 48,460 37,893 Administration and recordkeeping 23,504 24,212 Audit fees 5,005 5,431 Custodian fees 4,600 10,658 Goods and Services Tax 2,811 2,784 Other 184 - Total expenses 84,564 80,978 Expenses absorbed by manager (Note 5) (25,355) (30,307) Net expenses 59,209 50,671 Net invesment income (loss) 91,836$ 72,779$ Realized and unrealized gain (loss) on investmentsRealized gain (loss) on sale of investments (426,569)$ (4,542)$ Exchange gain (loss) on foreign currencies & other net assets (5,995) 200 Net realized gain (loss) on sale of investments (432,564) (4,342) Change in unrealized appreciation (depreciation) of investments (463,089) 56,482 Exchange gain (loss) on foreign currencies & other net assets 6,754 (7,402) Net realized gain (loss) on sale of investments (456,335) 49,080 Transaction Cost (10,664) (10,720) Net gain (loss) on investments (899,563)$ 34,018$
Increase (decrease) in net assets from operations (807,727)$ 106,797$
Increase (decrease) in net assets from operations Class A (442,859)$ 6,606$ Class F - - Class I - - Class I - seed (364,868) 100,191 Increase (decrease) in net assets from operations per daily average number of units Class A (1.80)$ 0.04$ Class F - - Class I - - Class I - seed (1.77) 0.49
See accompanying notes to the financial statements.
imaxx Canadian Balanced Fund

STATEMENTS OF CHANGES IN NET ASSETS
For the year ended December 31, 2008
Increase (decrease) in net assets from operations $ (442,859) $ - $ - $ (364,868) $ (807,727)
Capital transactions (Note 4)Proceeds from units issued 724,547 - - - 724,547 Reinvested distributions 41,390 - - 42,974 84,364 Amounts paid for units redeemed (1,037,888) - - - (1,037,888) Net capital transactions (271,951) - - 42,974 (228,977)
Distributions to unitholders From net investment income (46,184) - - (42,974) (89,158) From capital gains - - - - - Return of capital - - - - - Net distributions to unitholders (46,184) - - (42,974) (89,158)
Total increase (decrease) in net assets (760,994) - - (364,868) (1,125,862)
Net assets, beginning of the year 2,718,976 - - 2,278,764 4,997,740 Total net assets, end of the year $ 1,957,982 $ $ $ 1,913,896 $ 3,871,878
For the year ended December 31, 2007
Increase (decrease) in net assets from operations $ 6,606 $ - $ - $ 100,191 $ 106,797
Capital transactions (Note 4)Proceeds from units issued 3,007,605 - - - 3,007,605 Reinvested distributions 33,656 - - 30,602 64,258 Amounts paid for units redeemed (543,241) - - - (543,241) Net capital transactions 2,498,020 - - 30,602 2,528,622
Distributions to unitholders From net investment income (36,913) - - (29,994) (66,907) From capital gains (747) - - (607) (1,354) Return of capital - - - - - Net distributions to unitholders (37,660) - - (30,601) (68,261)
Total increase (decrease) in net assets 2,466,966 - - 100,192 2,567,158
Net assets, beginning of the year 252,010 - - 2,178,572 2,430,582 Total net assets, end of the year $ 2,718,976 $ - $ - $ 2,278,764 $ 4,997,740
See accompanying notes to the financial statements.
imaxx Canadian Balanced FundClass A Class F Class I Class I - Seed Total Fund

STATEMENT OF INVESTMENT PORTFOLIO as at December 31, 2008imaxx Canadian Small Cap Fund
Shares/Par Value
Fair Value % of Fair Value
Average Cost % of Average Cost
CASH AND OTHER NET ASSETS $35,318 5.83% $35,318 5.42%
EQUITIES --CANADIANConsumer DiscretionaryCelestica Inc. 645 3,560 4,221 Cogeco Cable Inc. 471 16,231 17,421 Dorel Industries Inc. 150 4,200 3,619 Indigo Books & Music Inc. 549 6,456 7,568 Keg Royalties Income Fund 1,470 9,776 19,600 Leon's Furniture Limited 400 3,552 3,328 Sears Canada Inc. 175 3,062 2,889 Sigma Industries Inc. Warrants 2012/03/15 6,750 - - Torstar Corporation 650 5,337 5,005 Total 52,174 8.61% 63,651 9.78%
Consumer StaplesAlimentation Couche-Tard Inc. 225 3,157 2,684 Empire Co. Ltd. 481 23,328 22,694 Maple Leaf Foods Inc. 275 3,042 2,747 The Jean Coutu Group PJC Inc. 900 7,371 5,956 Total 36,898 6.09% 34,081 5.23%
EnergyAkita Drilling Ltd 571 3,626 4,256 Bankers Petroleum Ltd 3,851 2,773 10,719 Birchcliff Energy Ltd. 1,600 7,872 7,648 Celtic Exploration Ltd. 511 6,301 6,275 Compton Petroleum Corp. 6,500 5,980 7,456 Connacher Oil & Gas Limited 2,100 1,533 2,373 Corridor Resources 1,409 3,114 3,762 Crew Energy Inc. 1,841 9,665 19,305 Fairborne Energy Ltd. 1,000 5,850 5,662 Flint Energy Services Ltd. 1,600 11,200 9,496 Galleon Energy Inc. 1,813 7,216 13,133 Highpine Oil & Gas Limited 1,974 10,186 10,074 Interoil 150 2,422 2,291 Iteration Energy Ltd. 1,700 2,261 3,256 Ivanhoe Energy Inc. 3,435 1,992 2,274 Nuvista Energy Ltd. 1,178 9,766 13,377 Paramount Resources Ltd. 450 3,042 3,598 Pason Systems Inc. 650 9,068 7,237 ProEx Energy Ltd. 725 7,982 8,330 Questerre Energy Corporation 1,102 2,226 1,902 Savanna Energy Services Corp 825 6,567 8,480 Shore Gold inc. 2,600 1,118 992 Storm Exploration Inc. 486 6,687 6,985 Trinidad Drilling Ltd. 1,700 7,412 7,909 TriStar Oil & Gas Ltd. 321 3,627 2,602 Vero Energy Inc. 466 2,521 3,355 West Energy Ltd 5,100 9,435 12,137 Total 151,442 24.99% 184,884 28.39%
FinancialAGF Management Ltd. 350 3,283 2,779 Canadian Western Bank 811 10,000 17,640 Ceres Global AG Corp. Warrants 2010/12/21 1,200 72 921 Dundee Corporation 1,721 10,326 10,963 First Capital Realty Inc. 100 1,886 1,778 Home Capital Group Inc. 421 8,197 10,248 ING Canada Inc. 75 2,370 2,222 Laurentian Bank Of Canada 469 16,091 20,292 Total 52,225 8.62% 66,843 10.26%

STATEMENT OF INVESTMENT PORTFOLIO as at December 31, 2008imaxx Canadian Small Cap Fund
Shares/Par Value
Fair Value % of Fair Value
Average Cost % of Average Cost
Health CareBradmer Pharmaceuticals Inc. Warrants 2011/06/22 2,450 - 735 Isotechnika Inc. Warrants 2009/02/15 2,700 - - MonoGen Inc. Warrants 2009/05/15 6,981 - 1,955 Patheon Inc. 3,800 8,360 3,924 Total 8,360 1.38% 6,614 1.02%
IndustrialAecon Group Inc. 406 4,454 3,900 Air Canada 3,800 6,650 7,590 BFI Canada Limited 1,018 10,546 13,418 Boralex Inc. 425 3,209 3,557 Onex Corporation 176 3,170 4,149 Russel Metals Inc. 150 2,846 2,510 Stantec Inc. 400 11,952 9,172 Transcontinental Inc. 1,212 11,914 14,504 Vector Aerospace Corporation 1,455 4,729 7,741 Total 59,470 9.81% 66,541 10.22%
Information TechnologyCGI Group Inc. 410 3,895 4,098 MacDonald, Dettwiler & Assoc. 594 12,813 12,202 SXC Health Solution Corp. 383 8,679 7,316 Total 25,387 4.19% 23,616 3.63%
MaterialsAlamos Gold Inc. 2,642 22,827 14,749 Aquiline Resources Inc 7,851 13,504 10,347 Blue Note Mining Inc. Warrants 2009/11/08 5,774 - - Canfor Corporation 1,137 8,528 8,058 Cascades Inc. 1,100 3,784 3,918 Catalyst Paper Corporation 4,339 1,280 2,191 Coalcorp Mining Inc. Warrants 2011/02/08 1,317 7 3,724 Detour Gold Corporation 323 2,739 1,898 Forsys Metals Corp. 1,000 5,820 5,420 Gabriel Resources Limited 8,531 12,796 13,505 Grande Cache Coal Corporation 1,400 1,176 1,015 Harry Winston Diamond Corp. 611 3,391 7,371 International Minerals Corp. 1,904 5,312 5,214 Jaguar Mining Inc. 1,775 11,023 4,729 Mega Uranium Ltd. 2,739 2,082 2,552 Minefinders Corp. 400 2,432 1,588 New Gold Inc. 11,449 19,578 20,951 Northgate Minerals Corp. 6,526 6,657 6,365 Quadra Mining Ltd. 650 1,762 1,820 Red Back Mining Inc. 3,636 30,942 25,224 Redcorp Ventures Ltd. Warrants 2009/07/10 8,967 45 538 Semafo Inc. 12,000 14,280 13,080 Sprott Molybdenum Part. Corp. Warrants 2009/04/16 4,499 22 1,764 Stingray Resources Inc. Warrants 2009/04/24 5,938 30 304 Taseko Mines Ltd. 2,000 1,420 1,670 Western Canadian Coal Corp 1,640 1,164 1,058 Total 172,601 28.48% 159,053 24.42%
Telecommunication ServicesCogeco Inc. 140 3,417 4,454 COM DEV International Ltd. 1,350 4,266 3,899 Total 7,683 1.27% 8,353 1.28%
UtilitiesAtco Ltd. 42 1,582 1,727

STATEMENT OF INVESTMENT PORTFOLIO as at December 31, 2008imaxx Canadian Small Cap Fund
Shares/Par Value
Fair Value % of Fair Value
Average Cost % of Average Cost
Canadian Hydro Developers Inc. 960 2,851 3,178 EarthFirst Canada Inc. Warrants 2009/12/09 1,400 7 457 Total 4,440 0.73% 5,362 0.82%
Total: EQUITIES -- CANADIAN $570,680 94.17% $618,998 95.05%
Total $605,998 $654,316Transaction Costs (Note 2) - (3,062) (0.47%)
Total Net Assets $605,998 100.00% $651,254 100.00%See accompanying notes to the financial statements.

A0406YTD
STATEMENTS OF NET ASSETS as at December 31
A0206YTD2008 2007
Assets Investments at fair value (Note 2) 570,680$ 1,463,628$ Cash 34,491 43,105 Dividends and interest receivable 1,447 3,702 Subscriptions receivable 60 201,344 Receivable for securities sold - 25,196 Other receivables - 1,324 Total assets 606,678$ 1,738,299$ Liabilities Bank overdraft - - Accrued expenses and other liabilities 680 5,281 Payable for units redeemed - 201,344 Payable for investment purchases - 53,165 Other payables - - Total liabilities 680 259,790 Net assets representing unitholders' equity 605,998$ 1,478,509$
Net assetsClass A 259,948$ 835,134$ Class F - - Class I - - Class I - seed 346,050 643,375 Number of units outstanding (Note 4)Class A 44,184 73,792 Class F - - Class I - - Class I - seed 55,336 54,882 Net assets per unit (Note 9)Class A 5.88$ 11.32$ Class F - - Class I - - Class I - seed 6.25 11.72
See accompanying notes to the financial statements.
Approved by AEGON Fund Management Inc. on behalf of the Funds:
Approved by:
Doug Brooks Glenn DanielsPresident and CEO SVP, General Counsel and Corporate Secretary
imaxx Canadian Small Cap Fund

STATEMENTS OF OPERATIONS for the years ended December 31
A0206YTD2008 2007
Investment income Interest on bonds and debentures -$ -$ Dividends 26,643 24,428 Short-term interest 4,491 4,663 Distribution from underlying funds - - Other income 492 1,375 Less foreign withholding taxes - - Total investment income 31,626 30,466 Expenses Management and advisory fees (Note 5) 14,358 20,399 Administration and recordkeeping 19,493 22,136 Audit fees 5,005 5,431 Custodian fees 3,472 7,447 Goods and Services Tax 817 1,485 Other - - Total expenses 43,145 56,898 Expenses absorbed by manager (Note 5) (25,994) (29,474) Net expenses 17,151 27,424 Net invesment income (loss) 14,475$ 3,042$ Realized and unrealized gain (loss) on investmentsRealized gain (loss) on sale of investments (442,616)$ 81,893$ Exchange gain (loss) on foreign currencies & other net assets - 49 Net realized gain (loss) on sale of investments (442,616) 81,942 Change in unrealized appreciation (depreciation) of investments (107,902) (24,111) Exchange gain (loss) on foreign currencies & other net assets - - Net unrealized gain (loss) on investments (107,902) (24,111) Transaction Cost (13,981) (22,993) Net gain (loss) on investments (564,499)$ 34,838$
Increase (decrease) in net assets from operations (550,024)$ 37,880$
Increase (decrease) in net assets from operations Class A (252,699)$ (5,807)$ Class F - - Class I - - Class I - seed (297,325) 43,687 Increase (decrease) in net assets from operations per daily average number of units Class A (4.45)$ (0.09)$ Class F - - Class I - - Class I - seed (5.42) 0.82
See accompanying notes to the financial statements.
imaxx Canadian Small Cap Fund

STATEMENTS OF CHANGES IN NET ASSETS
For the year ended December 31, 2008
Increase (decrease) in net assets from operations $ (252,699) $ - $ - $ (297,325) $ (550,024)
Capital transactions (Note 4)Proceeds from units issued 99,670 - - - 99,670 Reinvested distributions 1,975 - - 2,517 4,492 Amounts paid for units redeemed (422,118) - - - (422,118) Net capital transactions (320,473) - - 2,517 (317,956)
Distributions to unitholders From net investment income (2,014) - - (2,517) (4,531) From capital gains - - - - - Return of capital - - - - - Net distributions to unitholders (2,014) - - (2,517) (4,531)
Total increase (decrease) in net assets (575,186) - - (297,325) (872,511)
Net assets, beginning of the year 835,134 - - 643,375 1,478,509 Total net assets, end of the year $ 259,948 $ - $ - $ 346,050 $ 605,998
For the year ended December 31, 2007
Increase (decrease) in net assets from operations $ (5,807) $ - $ - $ 43,687 $ 37,880
Capital transactions (Note 4)Proceeds from units issued 1,368,052 - - - 1,368,052 Reinvested distributions 24,747 - - 18,665 43,412 Amounts paid for units redeemed (694,609) - - - (694,609) Net capital transactions 698,190 - - 18,665 716,855
Distributions to unitholders From net investment income - - - - - From capital gains (25,078) - - (18,665) (43,743) Return of capital - - - - - Net distributions to unitholders (25,078) - - (18,665) (43,743)
Total increase (decrease) in net assets 667,305 - - 43,687 710,992
Net assets, beginning of the year 167,829 - - 599,688 767,517 Total net assets, end of the year $ 835,134 $ - $ - $ 643,375 $ 1,478,509
See accompanying notes to the financial statements.
imaxx Canadian Small Cap FundClass A Class F Class I Class I - Seed Total Fund

STATEMENT OF INVESTMENT PORTFOLIO as at December 31, 2008imaxx Canadian Dividend Fund
Shares/Par Value
Fair Value % of Fair Value
Average Cost % of Average Cost
CASH AND OTHER NET ASSETS $14,197 0.40% $14,197 0.34%
SHORT-TERM --CANADIANTreasury BillsGovernment of Canada 05 Mar 09 125,000 124,827 124,800 Government of Canada 02 Apr 09 185,000 184,595 184,582 Total 309,422 8.61% 309,382 7.33%
Total: SHORT-TERM -- CANADIAN $309,422 8.61% $309,382 7.33%
BONDS --CANADIANCorporate FinanceThe Data Group Income Fund 6.750% 31 Dec 11 10,000 6,800 10,000 Total 6,800 0.19% 10,000 0.23%
Corporate Industrial ProductNew Gold Inc. 10.000% 28 Jun 17 30,000 19,200 25,380 Total 19,200 0.53% 25,380 0.60%
Total: BONDS -- CANADIAN $26,000 0.72% $35,380 0.83%
EQUITIES --CANADIANConsumer DiscretionaryCelestica Inc. 5,117 28,246 33,483 North West Company Fund 2,858 48,043 57,008 Rogers Communications Inc. 3,184 116,503 133,307 Shaw Communications Inc. 2,977 64,273 62,119 Total 257,065 7.15% 285,917 6.77%
Consumer StaplesEmpire Co. Ltd. 950 46,075 44,126 Shoppers Drug Mart Inc. 1,109 53,265 58,986 Total 99,340 2.76% 103,112 2.44%
EnergyAddax Petroleum Corp. 1,677 35,368 60,413 Canadian Natural Res. Ltd. 2,860 139,425 157,971 Canadian Oil Sands Trust 2,750 57,832 98,517 Crescent Point Energy Trust 3,400 81,600 87,133 EnCana Corporation 3,644 207,562 234,716 Husky Energy Inc. 2,061 63,582 77,651 Imperial Oil Limited 1,672 68,502 65,471 Inter Pipeline Fund 2,160 15,228 19,921 Keyera Facilities Income Fund 2,050 36,408 36,626 Suncor Energy Inc. 4,014 95,212 155,243 Vermilion Energy Trust 1,400 35,042 52,553 Total 835,761 23.26% 1,046,215 24.78%
FinancialBank of Montreal 666 20,793 22,805 Bank of Nova Scotia 3,191 105,782 139,272 Fairfax Financial Holdgs Ltd. 160 61,099 49,225 Manulife Financial Corporation 4,659 96,721 167,121 National Bank of Canada 1,210 37,873 45,146 Power Corporation of Canada 2,889 64,165 83,024 Royal Bank of Canada 5,071 182,556 251,294 Toronto-Dominion Bank 3,761 163,303 217,058 Total 732,292 20.38% 974,945 23.09%

STATEMENT OF INVESTMENT PORTFOLIO as at December 31, 2008imaxx Canadian Dividend Fund
Shares/Par Value
Fair Value % of Fair Value
Average Cost % of Average Cost
IndustrialAG Growth Income Fund 3,226 62,552 80,323 Bombardier Inc. 19,471 86,062 114,339 Canadian Pacific Railway Ltd. 1,706 69,707 63,360 Total 218,321 6.08% 258,022 6.11%
Information TechnologyResearch in Motion Limited 1,250 61,825 132,980 Total 61,825 1.72% 132,980 3.15%
MaterialsAgnico-Eagle Mines Ltd. 1,590 99,804 61,773 Barrick Gold Corporation 4,866 217,413 192,123 Cameco Corp. 1,558 32,640 64,254 Goldcorp Inc. 2,180 83,625 73,977 Kinross Gold Corp. 3,745 84,262 67,550 New Gold Inc. Warrants 2017/06/28 3,525 1,058 4,621 Potash Corporation of Saskatchewan Inc. 561 50,221 52,713 Red Back Mining Inc. 6,700 57,017 23,450 Timminco Ltd. 1,800 6,300 23,485 Total 632,340 17.60% 563,946 13.36%
Telecommunication ServicesBCE Inc. 1,378 34,519 41,076 Total 34,519 0.96% 41,076 0.97%
UtilitiesAltaGas Utlity Group Inc. 5,317 90,708 134,933 Atco Ltd. 1,280 48,218 75,961 Canadian Utilities Limited 967 39,076 48,173 Fortis Inc. 1,700 41,803 49,188 TransCanada Corp. 2,931 97,221 100,409 Total 317,026 8.82% 408,664 9.68%
Total: EQUITIES -- CANADIAN $3,188,489 88.73% $3,814,877 90.35%
EQUITIES -- FOREIGNConsumer DiscretionaryTim Hortons Inc. 1,590 55,427 52,687 Total 55,427 1.54% 52,687 1.25%
Total: EQUITIES -- FOREIGN $55,427 1.54% $52,687 1.25%
Total $3,593,535 $4,226,523Transaction Costs (Note 2) - (4,407) (0.10%)
Total Net Assets $3,593,535 100.00% $4,222,116 100.00%See accompanying notes to the financial statements.

A0406YTD
STATEMENTS OF NET ASSETS as at December 31
A0206YTD2008 2007
Assets Investments at fair value (Note 2) 3,579,338$ 3,267,340$ Cash 5,229 41,878 Dividends and interest receivable 13,647 15,882 Subscriptions receivable - - Receivable for securities sold - - Other receivables 11 633 Total assets 3,598,225$ 3,325,733$ Liabilities Bank overdraft - - Accrued expenses and other liabilities 3,526 5,667 Payable for units redeemed 1,162 111 Payable for investment purchases 2 61,965 Other payables - - Total liabilities 4,690 67,744 Net assets representing unitholders' equity 3,593,535$ 3,257,990$
Net assetsClass A 1,181,521$ 1,144,652$ Class F - - Class I 1,542,316 942,761 Class I - seed 869,698 1,170,577 Number of units outstanding (Note 4)Class A 157,207 106,530 Class F - - Class I 197,412 85,804 Class I - seed 109,426 105,549 Net assets per unit (Note 9)Class A 7.52$ 10.74$ Class F - - Class I 7.81 10.99 Class I - seed 7.95 11.09
See accompanying notes to the financial statements.
Approved by AEGON Fund Management Inc. on behalf of the Funds:
Approved by:
Doug Brooks Glenn DanielsPresident and CEO SVP, General Counsel and Corporate Secretary
imaxx Canadian Dividend Fund

STATEMENTS OF OPERATIONS for the years ended December 31
A0206YTD2008 2007
Investment income Interest on bonds and debentures 6,879$ 6,978$ Dividends 125,313 63,566 Short-term interest 6,355 5,223 Distribution from underlying funds - - Other income 1,458 894 Less foreign withholding taxes (43) (42) Total investment income 139,962 76,619 Expenses Management and advisory fees (Note 5) 38,061 20,737 Administration and recordkeeping 16,704 19,208 Audit fees 3,258 4,478 Custodian fees 1,918 6,806 Goods and Services Tax 2,293 1,507 Other - - Total expenses 62,234 52,736 Expenses absorbed by manager (Note 5) (13,635) (25,025) Net expenses 48,599 27,711 Net invesment income (loss) 91,363$ 48,908$ Realized and unrealized gain (loss) on investmentsRealized gain (loss) on sale of investments (470,150)$ 58,333$ Exchange gain (loss) on foreign currencies & other net assets - (2,643) Net realized gain (loss) on sale of investments (470,150) 55,690 Change in unrealized appreciation (depreciation) of investments (801,143) 77,968 Exchange gain (loss) on foreign currencies & other net assets - - Net unrealized gain (loss) on investments (801,143) 77,968 Transaction Cost (7,321) (5,133) Net gain (loss) on investments (1,278,614)$ 128,525$
Increase (decrease) in net assets from operations (1,187,251)$ 177,433$
Increase (decrease) in net assets from operations Class A (412,552)$ 44,735$ Class F - - Class I (473,820) 25,783 Class I - seed (300,879) 106,915 Increase (decrease) in net assets from operations per daily average number of units Class A (3.02)$ 0.58$ Class F - - Class I -3.47 0.66 Class I - seed -2.80 1.03
See accompanying notes to the financial statements.
imaxx Canadian Dividend Fund

STATEMENTS OF CHANGES IN NET ASSETS
For the year ended December 31, 2008
Increase (decrease) in net assets from operations $ (412,552) $ - $ (473,820) $ (300,879) $ (1,187,251)
Capital transactions (Note 4)Proceeds from units issued 711,167 - 1,415,197 - 2,126,364 Reinvested distributions 49,304 - 49,869 38,570 137,743 Amounts paid for units redeemed (261,773) - (341,822) - (603,595) Net capital transactions 498,698 - 1,123,244 38,570 1,660,512
Distributions to unitholders From net investment income (49,277) - (49,869) (38,570) (137,716) From capital gains - - - - - Return of capital - - - - - Net distributions to unitholders (49,277) - (49,869) (38,570) (137,716)
Total increase (decrease) in net assets 36,869 - 599,555 (300,879) 335,545
Net assets, beginning of the year 1,144,652 - 942,761 1,170,577 3,257,990 Total net assets, end of the year $ 1,181,521 $ $ 1,542,316 $ 869,698 $ 3,593,535
For the year ended December 31, 2007
Increase (decrease) in net assets from operations $ 44,735 $ - $ 25,783 $ 106,915 $ 177,433
Capital transactions (Note 4)Proceeds from units issued 1,025,473 - 940,724 - 1,966,197 Reinvested distributions 28,211 - 14,476 37,335 80,022 Amounts paid for units redeemed (263,912) - (68,445) - (332,357) Net capital transactions 789,772 - 886,755 37,335 1,713,862
Distributions to unitholders From net investment income (28,211) - (14,476) (37,334) (80,021) From capital gains - - - - - Return of capital - - - - - Net distributions to unitholders (28,211) - (14,476) (37,334) (80,021)
Total increase (decrease) in net assets 806,296 - 898,062 106,916 1,811,274
Net assets, beginning of the year 338,356 - 44,699 1,063,661 1,446,716 Total net assets, end of the year $ 1,144,652 $ - $ 942,761 $ 1,170,577 $ 3,257,990
See accompanying notes to the financial statements.
imaxx Canadian Dividend FundClass A Class F Class I Class I - Seed Total Fund

STATEMENT OF INVESTMENT PORTFOLIO as at December 31, 2008imaxx TOP Conservative Portfolio
Shares/Par Value
Fair Value % of Fair Value
Average Cost % of Average Cost
CASH AND OTHER NET ASSETS $91,785 0.86% $91,785 0.75%
Mutual Fund Units
AGF International Stock Class - 444 Class O 45,409 520,389 592,889 AGF Global Government Bond - 455 Class O 65,158 781,891 680,729 Trimark Canadian Bond - 1653 Class A 270,572 1,569,320 1,611,924 CI Value Trust Corporate Class - 5301 Class I 82,105 474,566 862,516 CI Signature High Income - 5100 Class I 96,331 919,964 1,255,809 CI American Managers Corporate Class - 0969 Class I 66,159 641,738 782,508 Fidelity NorthStar® - 0953 Class O 44,070 486,830 677,974 Fidelity Canadian Bond Fund - 933 Class I 87,225 1,120,895 1,115,025 Fidelity TrueNorth® - 0925 Class O 39,838 914,195 1,074,293 Mackenzie Cundill Value - 0781 Class O 100,076 526,961 662,873 Mackenzie Cundill Canadian Security - 1443 Class O 49,779 488,099 655,911 TD Short-Term Bond - 0625 Class O 57,446 576,757 570,486 TD Canadian Bond - 0989 Class O 163,234 1,575,210 1,636,712 Total 10,596,815 99.14% 12,179,649 99.25%
Total: MUTUAL FUND UNITS $10,596,815 99.14% $12,179,649 99.25%
Total $10,688,600 $12,271,434Transaction Costs (Note 2) - - 0.00%
Total Net Assets $10,688,600 100.00% $12,271,434 100.00%See accompanying notes to the financial statements.

A0406YTD
STATEMENTS OF NET ASSETS as at December 31
A0206YTD2008 2007
Assets Investments at fair value (Note 2) 10,596,815$ 13,096,336$ Cash 100,279 - Dividends and interest receivable - - Subscriptions receivable 1 417 Receivable for securities sold 8,159 4,487 Other receivables 5,752 2,659 Total assets 10,711,006 13,103,899 Liabilities Bank overdraft - 1,451 Accrued expenses and other liabilities 17,883 20,550 Payable for units redeemed 4,523 39,352 Payable for investment purchases - 5,905 Other payables - - Total liabilities 22,406 67,258 Net assets representing unitholders' equity 10,688,600$ 13,036,641$
Net assetsClass A 2,610,077$ 3,125,953$ Class F - - Class I 8,078,523 9,910,688 Class I - seed - - Number of units outstanding (Note 4)Class A 269,895 268,171 Class F - - Class I 774,158 801,774 Class I - seed - - Net assets per unit (Note 9)Class A 9.67$ 11.66$ Class F - - Class I 10.44 12.36 Class I - seed - -
See accompanying notes to the financial statements.
Approved by AEGON Fund Management Inc. on behalf of the Funds:
Approved by:
Doug Brooks Glenn DanielsPresident and CEO SVP, General Counsel and Corporate Secretary
imaxx TOP Conservative Portfolio

STATEMENTS OF OPERATIONS for the years ended December 31
A0206YTD2008 2007
Investment income Interest on bonds and debentures -$ -$ Dividends - - Short-term interest - - Distribution from underlying funds 456,706 519,767 Other income - 442 Less foreign withholding taxes - - Total investment income 456,706 520,209 Expenses Management and advisory fees (Note 5) 188,092 143,053 Administration and recordkeeping 34,042 31,002 Audit fees 5,990 5,431 Custodian fees 3,905 4,807 Goods and Services Tax 8,211 9,537 Other 974 - Total expenses 241,214 193,830 Expenses absorbed by manager (Note 5) (81,371) (26,074) Net expenses 159,843 167,756 Net invesment income (loss) 296,863$ 352,453$ Realized and unrealized gain (loss) on investmentsRealized gain (loss) on sale of investments 15,638$ 230,036$ Exchange gain (loss) on foreign currencies & other net assets - - Net realized gain (loss) on sale of investments 15,638 230,036 Change in unrealized appreciation (depreciation) of investments (1,973,384) (645,005) Exchange gain (loss) on foreign currencies & other net assets - - Net unrealized gain (loss) on investments (1,973,384) (645,005) Net gain (loss) on investments (1,957,746)$ (414,969)$
Increase (decrease) in net assets from operations (1,660,883)$ (62,516)$
Increase (decrease) in net assets from operations Class A (421,996)$ (49,421)$ Class F - - Class I (1,238,887) (13,095) Class I - seed - - Increase (decrease) in net assets from operations per daily average number of units Class A (1.58)$ (0.18)$ Class F - - Class I (1.53) (0.02) Class I - seed - -
See accompanying notes to the financial statements.
imaxx TOP Conservative Portfolio

STATEMENTS OF CHANGES IN NET ASSETS
For the year ended December 31, 2008-
Increase (decrease) in net assets from operations $ (421,996) $ - $ (1,238,887) $ - $ (1,660,883)
Capital transactions (Note 4)Proceeds from units issued 711,874 - 1,829,791 - 2,541,665 Reinvested distributions 96,000 - 276,846 - 372,846 Amounts paid for units redeemed (805,755) - (2,423,067) - (3,228,822) Net capital transactions 2,119 - (316,430) - (314,311)
Distributions to unitholders From net investment income (93,001) - (268,201) - (361,202) From capital gains (2,998) - (8,647) - (11,645) Return of capital - - - - - Net distributions to unitholders (95,999) - (276,848) - (372,847)
Total increase (decrease) in net assets (515,876) - (1,832,165) - (2,348,041)
Net assets, beginning of the year 3,125,953 - 9,910,688 - 13,036,641 Total net assets, end of the year $ 2,610,077 $ - $ 8,078,523 $ - $ 10,688,600
For the year ended December 31, 2007
Increase (decrease) in net assets from operations $ (49,421) $ - $ (13,095) $ - $ (62,516)
Capital transactions (Note 4)Proceeds from units issued 696,475 - 3,294,397 - 3,990,872 Reinvested distributions 152,596 - 451,615 - 604,211 Amounts paid for units redeemed (828,424) - (1,438,780) - (2,267,204) Net capital transactions 20,647 - 2,307,232 - 2,327,879
Distributions to unitholders From net investment income (60,075) - (177,795) - (237,870) From capital gains (92,521) - (273,820) - (366,341) Return of capital - - - - - Net distributions to unitholders (152,596) - (451,615) - (604,211)
Total increase (decrease) in net assets (181,370) - 1,842,522 - 1,661,152
Net assets, beginning of the year 3,307,323 - 8,068,166 - 11,375,489 Total net assets, end of the year $ 3,125,953 $ - $ 9,910,688 $ - $ 13,036,641
See accompanying notes to the financial statements.
imaxx TOP Conservative PortfolioClass A Class F Class I Class I - Seed Total Fund
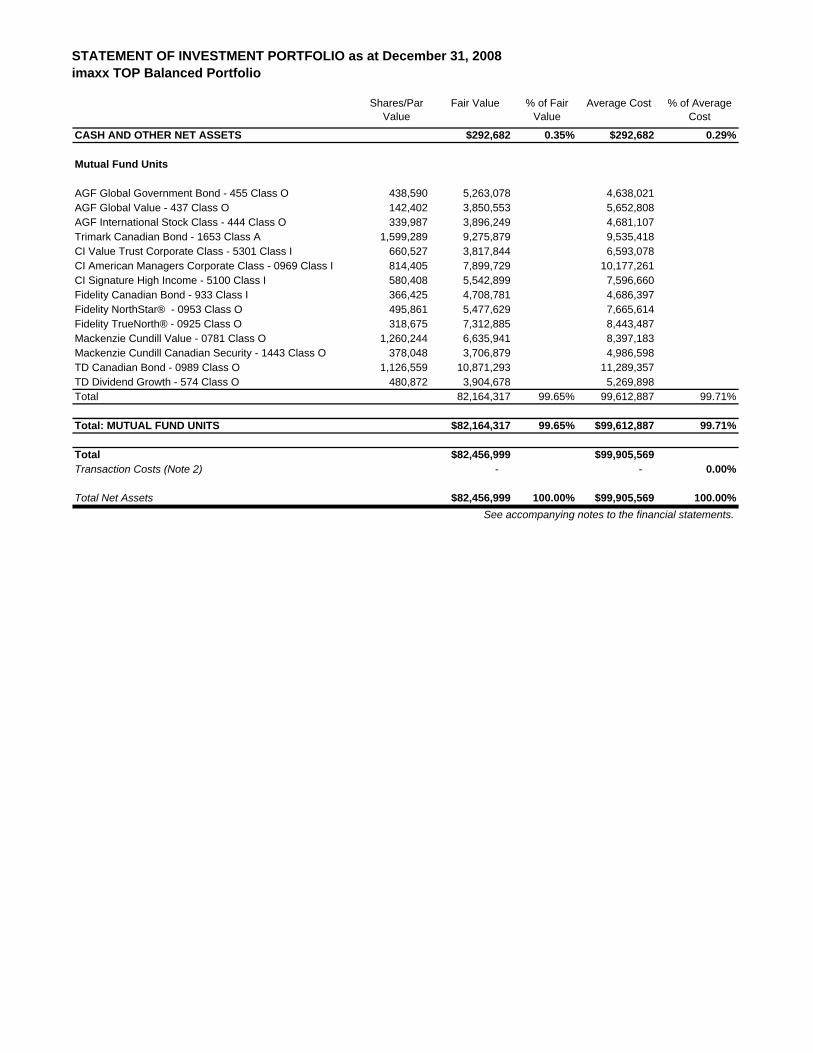
STATEMENT OF INVESTMENT PORTFOLIO as at December 31, 2008imaxx TOP Balanced Portfolio
Shares/Par Value
Fair Value % of Fair Value
Average Cost % of Average Cost
CASH AND OTHER NET ASSETS $292,682 0.35% $292,682 0.29%
Mutual Fund Units
AGF Global Government Bond - 455 Class O 438,590 5,263,078 4,638,021 AGF Global Value - 437 Class O 142,402 3,850,553 5,652,808 AGF International Stock Class - 444 Class O 339,987 3,896,249 4,681,107 Trimark Canadian Bond - 1653 Class A 1,599,289 9,275,879 9,535,418 CI Value Trust Corporate Class - 5301 Class I 660,527 3,817,844 6,593,078 CI American Managers Corporate Class - 0969 Class I 814,405 7,899,729 10,177,261 CI Signature High Income - 5100 Class I 580,408 5,542,899 7,596,660 Fidelity Canadian Bond - 933 Class I 366,425 4,708,781 4,686,397 Fidelity NorthStar® - 0953 Class O 495,861 5,477,629 7,665,614 Fidelity TrueNorth® - 0925 Class O 318,675 7,312,885 8,443,487 Mackenzie Cundill Value - 0781 Class O 1,260,244 6,635,941 8,397,183 Mackenzie Cundill Canadian Security - 1443 Class O 378,048 3,706,879 4,986,598 TD Canadian Bond - 0989 Class O 1,126,559 10,871,293 11,289,357 TD Dividend Growth - 574 Class O 480,872 3,904,678 5,269,898 Total 82,164,317 99.65% 99,612,887 99.71%
Total: MUTUAL FUND UNITS $82,164,317 99.65% $99,612,887 99.71%
Total $82,456,999 $99,905,569Transaction Costs (Note 2) - - 0.00%
Total Net Assets $82,456,999 100.00% $99,905,569 100.00%See accompanying notes to the financial statements.

A0406YTD
STATEMENTS OF NET ASSETS as at December 31
A0206YTD2008 2007
Assets Investments at fair value (Note 2) 82,164,317$ 95,990,163$ Cash 368,338 226,299 Dividends and interest receivable - - Subscriptions receivable 44,084 28,609 Receivable for securities sold 98,619 32,802 Other receivables 6,825 591 Total assets 82,682,183 96,278,464 Liabilities Bank overdraft - - Accrued expenses and other liabilities 92,742 123,389 Payable for units redeemed 5,809 60 Payable for investment purchases 126,633 274,162 Other payables - - Total liabilities 225,184 397,611 Net assets representing unitholders' equity 82,456,999$ 95,880,853$
Net assetsClass A 10,235,717$ 14,271,218 Class F - - Class I 72,221,282 81,663,635 Class I - seed - - Number of units outstanding (Note 4)Class A 1,121,616 1,210,803 Class F - - Class I 7,451,095 6,656,157 Class I - seed - - Net assets per unit (Note 9)Class A 9.13$ 11.74$ Class F - - Class I 9.69 12.27 Class I - seed - -
See accompanying notes to the financial statements.
Approved by AEGON Fund Management Inc. on behalf of the Funds:
Approved by:
Doug Brooks Glenn DanielsPresident and CEO SVP, General Counsel and Corporate Secretary
imaxx TOP Balanced Portfolio
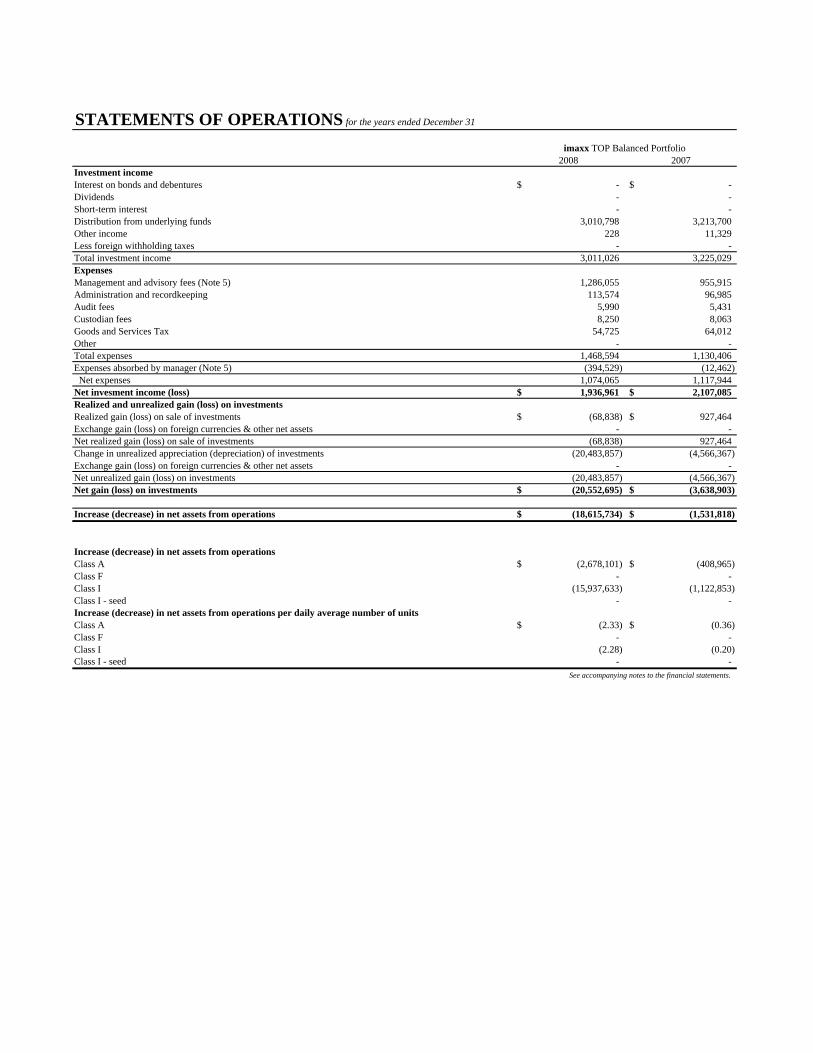
STATEMENTS OF OPERATIONS for the years ended December 31
A0206YTD2008 2007
Investment income Interest on bonds and debentures -$ -$ Dividends - - Short-term interest - - Distribution from underlying funds 3,010,798 3,213,700 Other income 228 11,329 Less foreign withholding taxes - - Total investment income 3,011,026 3,225,029 Expenses Management and advisory fees (Note 5) 1,286,055 955,915 Administration and recordkeeping 113,574 96,985 Audit fees 5,990 5,431 Custodian fees 8,250 8,063 Goods and Services Tax 54,725 64,012 Other - - Total expenses 1,468,594 1,130,406 Expenses absorbed by manager (Note 5) (394,529) (12,462) Net expenses 1,074,065 1,117,944 Net invesment income (loss) 1,936,961$ 2,107,085$ Realized and unrealized gain (loss) on investmentsRealized gain (loss) on sale of investments (68,838)$ 927,464$ Exchange gain (loss) on foreign currencies & other net assets - - Net realized gain (loss) on sale of investments (68,838) 927,464 Change in unrealized appreciation (depreciation) of investments (20,483,857) (4,566,367) Exchange gain (loss) on foreign currencies & other net assets - - Net unrealized gain (loss) on investments (20,483,857) (4,566,367) Net gain (loss) on investments (20,552,695)$ (3,638,903)$
Increase (decrease) in net assets from operations (18,615,734)$ (1,531,818)$
Increase (decrease) in net assets from operations Class A (2,678,101)$ (408,965)$ Class F - - Class I (15,937,633) (1,122,853) Class I - seed - - Increase (decrease) in net assets from operations per daily average number of units Class A (2.33)$ (0.36)$ Class F - - Class I (2.28) (0.20) Class I - seed - -
See accompanying notes to the financial statements.
imaxx TOP Balanced Portfolio

STATEMENTS OF CHANGES IN NET ASSETS
For the year ended December 31, 2008
Increase (decrease) in net assets from operations $ (2,678,101) $ - $ (15,937,633) $ - $ (18,615,734)
Capital transactions (Note 4)Proceeds from units issued 1,708,544 - 15,665,578 - 17,374,122 Reinvested distributions 286,182 - 1,915,917 - 2,202,099 Amounts paid for units redeemed (3,009,208) - (9,170,298) - (12,179,506) Net capital transactions (1,014,482) - 8,411,197 - 7,396,715
Distributions to unitholders From net investment income (288,918) - (1,915,917) - (2,204,835) From capital gains - - - - - Return of capital - - - - - Net distributions to unitholders (288,918) - (1,915,917) - (2,204,835)
Total increase (decrease) in net assets (3,981,501) - (9,442,353) - (13,423,854) -
Net assets, beginning of the year 14,217,218 81,663,635 95,880,853 Total net assets, end of the year $ 10,235,717 $ - $ 72,221,282 $ - $ 82,456,999
For the year ended December 31, 2007
Increase (decrease) in net assets from operations $ (408,965) $ - $ (1,122,853) $ - $ (1,531,818)
Capital transactions (Note 4)Proceeds from units issued 4,710,076 - 21,325,115 - 26,035,191 Reinvested distributions 437,350 - 2,410,933 - 2,848,283 Amounts paid for units redeemed (2,912,242) - (2,070,966) - (4,983,208) Net capital transactions 2,235,184 - 21,665,082 - 23,900,266
Distributions to unitholders From net investment income (171,104) - (938,544) - (1,109,648) From capital gains (268,429) - (1,472,389) - (1,740,818) Return of capital - - - - - Net distributions to unitholders (439,533) - (2,410,933) - (2,850,466)
Total increase (decrease) in net assets 1,386,686 - 18,131,296 - 19,517,982
Net assets, beginning of the year 12,830,532 - 63,532,339 - 76,362,871 Total net assets, end of the year $ 14,217,218 $ - $ 81,663,635 $ - $ 95,880,853
See accompanying notes to the financial statements.
imaxx TOP Balanced PortfolioClass A Class F Class I Class I - Seed Total Fund

STATEMENT OF INVESTMENT PORTFOLIO as at December 31, 2008imaxx TOP Growth Portfolio
Shares/Par Value
Fair Value % of Fair Value
Average Cost % of Average Cost
CASH AND OTHER NET ASSETS $58,522 0.10% $58,522 0.07%
Mutual Fund Units
AGF Global Value - 437 Class O 106,106 2,869,093 4,104,376 AGF International Stock Class - 444 Class O 248,478 2,847,555 3,442,550 Trimark Canadian Bond Fund - 1653 Class A 1,202,914 6,976,900 7,178,738 Brandes US Small Cap - 0642 Class I 709,580 2,998,258 6,034,254 Brandes Emerging Markets - 671 Class I 271,363 3,064,587 4,699,525 CI Can-Am Small Cap - 6504 Class I 295,779 2,937,085 3,507,944 CI Value Trust Corporate Class - 5301 Class I 482,007 2,786,003 4,865,530 CI Signature High Income - 5100 Class I 300,437 2,869,173 3,995,766 CI American Managers Corporate Class - 0969 Class I 610,087 5,917,841 7,698,206 Fidelity TrueNorth® - 0925 Class O 240,999 5,530,398 6,266,039 Fidelity NorthStar® - 0953 Class O 379,103 4,187,840 5,789,188 Mackenzie Cundill Value - 0781 Class O 916,252 4,824,615 6,114,784 Mackenzie Cundill Canadian Security - 1443 Class O 295,755 2,899,966 3,838,760 TD Canadian Bond Fund - 0989 Class O 739,427 7,135,470 7,415,468 TD Dividend Growth - 574 Class O 365,777 2,970,108 4,065,931 Total 60,814,892 99.90% 79,017,059 99.93%
Total: MUTUAL FUND UNITS $60,814,892 99.90% $79,017,059 99.93%
Total $60,873,414 $79,075,581Transaction Costs (Note 2) - - 0.00%
Total Net Assets $60,873,414 100.00% $79,075,581 100.00%See accompanying notes to the financial statements.

A0406YTD
STATEMENTS OF NET ASSETS as at December 31
A0206YTD2008 2007
Assets Investments at fair value (Note 2) 60,814,892$ 73,015,178$ Cash 133,253 162,614 Dividends and interest receivable - - Subscriptions receivable 99,484 45,487 Receivable for securities sold 21,488 - Other receivables 6,580 893 Total assets 61,075,697 73,224,172 Liabilities Bank overdraft - - Accrued expenses and other liabilities 76,098 98,143 Payable for units redeemed 3,461 1,537 Payable for investment purchases 122,724 173,188 Other payables - - Total liabilities 202,283 272,868 Net assets representing unitholders' equity 60,873,414$ 72,951,304$
Net assetsClass A 10,343,046$ 15,434,769$ Class F - - Class I 50,530,368 57,516,535 Class I - seed - - Number of units outstanding (Note 4)Class A 1,300,550 1,392,258 Class F - - Class I 5,698,995 4,738,171 Class I - seed - - Net assets per unit (Note 9)Class A 7.95$ 11.09$ Class F - - Class I 8.87 12.14 Class I - seed - -
See accompanying notes to the financial statements.
Approved by AEGON Fund Management Inc. on behalf of the Funds:
Approved by:
Doug Brooks Glenn DanielsPresident and CEO SVP, General Counsel and Corporate Secretary
imaxx TOP Growth Portfolio

STATEMENTS OF OPERATIONS for the years ended December 31
A0206YTD2008 2007
Investment income Interest on bonds and debentures -$ -$ Dividends - - Short-term interest - - Distribution from underlying funds 1,988,902 2,644,042 Other income 1,945 9,872 Less foreign withholding taxes - - Total investment income 1,990,847 2,653,914 Expenses Management and advisory fees (Note 5) 1,064,279 833,896 Administration and recordkeeping 91,221 79,525 Audit fees 5,990 5,431 Custodian fees 7,124 6,951 Goods and Services Tax 46,086 55,258 Other - - Total expenses 1,214,700 981,061 Expenses absorbed by manager (Note 5) (305,050) (14,091) Net expenses 909,650 966,970 Net invesment income (loss) 1,081,197$ 1,686,944$ Realized and unrealized gain (loss) on investmentsRealized gain (loss) on sale of investments (213,815)$ 667,576$ Exchange gain (loss) on foreign currencies & other net assets - - Net realized gain (loss) on sale of investments (213,815) 667,576 Change in unrealized appreciation (depreciation) of investments (19,893,060) (5,167,960) Exchange gain (loss) on foreign currencies & other net assets - - Net unrealized gain (loss) on investments (19,893,060) (5,167,960) Net gain (loss) on investments (20,106,875)$ (4,500,384)$
Increase (decrease) in net assets from operations (19,025,678)$ (2,813,440)$
Increase (decrease) in net assets from operations Class A (3,728,922)$ (759,758)$ Class F - - Class I (15,296,756) (2,053,682) Class I - seed - - Increase (decrease) in net assets from operations per daily average number of units Class A (2.82)$ (0.58)$ Class F - - Class I (2.97) (0.51) Class I - seed - -
See accompanying notes to the financial statements.
imaxx TOP Growth Portfolio

STATEMENTS OF CHANGES IN NET ASSETS
For the year ended December 31, 2008
Increase (decrease) in net assets from operations $ (3,728,922) $ - $ (15,296,756) $ - $ (19,025,678)
Capital transactions (Note 4)Proceeds from units issued 1,330,890 - 13,108,339 - 14,439,229 Reinvested distributions 307,429 - 1,375,800 - 1,683,229 Amounts paid for units redeemed (2,686,513) - (4,797,750) - (7,484,263) Net capital transactions (1,048,194) - 9,686,389 - 8,638,195
Distributions to unitholders From net investment income (314,607) - (1,375,800) - (1,690,407) From capital gains - - - - - Return of capital - - - - - Net distributions to unitholders (314,607) - (1,375,800) - (1,690,407)
Total increase (decrease) in net assets (5,091,723) - (6,986,167) - (12,077,890)
Net assets, beginning of the year 15,434,769 - 57,516,535 72,951,304 Total net assets, end of the year $ 10,343,046 $ - $ 50,530,368 $ - $ 60,873,414
For the year ended December 31, 2007
Increase (decrease) in net assets from operations $ (759,758) $ - $ (2,053,682) $ - $ (2,813,440)
Capital transactions (Note 4)Proceeds from units issued 4,912,576 - 17,595,786 - 22,508,362 Reinvested distributions 446,149 - 1,544,629 - 1,990,778 Amounts paid for units redeemed (3,606,392) - (663,293) - (4,269,685) Net capital transactions 1,752,333 - 18,477,122 - 20,229,455
Distributions to unitholders From net investment income (82,458) - (280,459) - (362,917) From capital gains (371,682) - (1,264,170) - (1,635,852) Return of capital - - - - - Net distributions to unitholders (454,140) - (1,544,629) - (1,998,769)
Total increase (decrease) in net assets 538,435 - 14,878,811 - 15,417,246
Net assets, beginning of the year 14,896,334 - 42,637,724 - 57,534,058 Total net assets, end of the year $ 15,434,769 $ - $ 57,516,535 $ - $ 72,951,304
See accompanying notes to the financial statements.
imaxx TOP Growth PortfolioClass A Class F Class I Class I - Seed Total Fund

STATEMENT OF INVESTMENT PORTFOLIO as at December 31, 2008imaxx TOP Aggressive Growth Portfolio
Shares/Par Value
Fair Value % of Fair Value
Average Cost % of Average Cost
CASH AND OTHER NET ASSETS $64,333 0.24% $64,333 0.17%
Mutual Fund Units
AGF International Stock Class - 444 Class O 208,310 2,387,228 2,888,290 Brandes Emerging Markets - 671 Class I 215,356 2,432,080 3,869,887 Brandes US Small Cap - 0642 Class I 325,850 1,376,848 2,710,359 CI Canadian Investment - 7986 Class I 66,581 1,295,670 1,738,117 CI Value Trust Corporate Class - 5301 Class I 225,352 1,302,534 2,311,550 CI Can-Am Small Cap - 6504 Class I 138,266 1,372,986 1,633,992 CI Global - 0858 Class I 136,740 1,340,053 1,883,366 CI American Managers Corporate Class - 0969 Class I 270,539 2,624,232 3,472,562 Fidelity TrueNorth® - 0925 Class O 141,587 3,249,102 3,886,900 Fidelity NorthStar® - 0953 Class O 194,345 2,146,866 3,071,152 Mackenzie Cundill Value - 0781 Class O 470,230 2,476,043 3,197,240 Mackenzie Cundill Canadian Security - 1443 Class O 220,073 2,157,881 2,983,645 Mackenzie Universal Canadian Resource - 1424 Class O 97,865 1,384,471 2,208,078 TD US Small Cap Equity - 0712 Class I 151,082 1,371,829 1,894,476 Total 26,917,823 99.76% 37,749,614 99.83%
Total: MUTUAL FUND UNITS $26,917,823 99.76% $37,749,614 99.83%
Total $26,982,156 $37,813,947Transaction Costs (Note 2) - - 0.00%
Total Net Assets $26,982,156 100.00% $37,813,947 100.00%See accompanying notes to the financial statements.

A0406YTD
STATEMENTS OF NET ASSETS as at December 31
A0206YTD2008 2007
Assets Investments at fair value (Note 2) 26,917,823$ 34,539,603$ Cash 37,276 97,617 Dividends and interest receivable - - Subscriptions receivable 83,403 31,663 Receivable for securities sold 10,767 - Other receivables 6,323 1,719 Total assets 27,055,592 34,670,602 Liabilities Bank overdraft - - Accrued expenses and other liabilities 37,009 46,058 Payable for units redeemed - - Payable for investment purchases 36,427 97,616 Other payables - - Total liabilities 73,436 143,674 Net assets representing unitholders' equity 26,982,156$ 34,526,928$
Net assetsClass A 2,354,809$ 3,760,480 Class F - - Class I 24,627,347 30,766,448 Class I - seed - - Number of units outstanding (Note 4)Class A 296,996 304,511 Class F - - Class I 2,753,133 2,253,109 Class I - seed - - Net assets per unit (Note 9)Class A 7.93$ 12.35$ Class F - - Class I 8.95 13.66 Class I - seed - -
See accompanying notes to the financial statements.
Approved by AEGON Fund Management Inc. on behalf of the Funds:
Approved by:
Doug Brooks Glenn DanielsPresident and CEO SVP, General Counsel and Corporate Secretary
imaxx TOP Aggressive Growth Portfolio

STATEMENTS OF OPERATIONS for the years ended December 31
A0206YTD2008 2007
Investment income Interest on bonds and debentures -$ -$ Dividends - - Short-term interest - - Distribution from underlying funds 483,675 1,526,824 Other income 898 7,043 Less foreign withholding taxes - - Total investment income 484,573 1,533,867 Expenses Management and advisory fees (Note 5) 467,995 404,426 Administration and recordkeeping 53,250 46,117 Audit fees 5,990 5,431 Custodian fees 4,742 5,303 Goods and Services Tax 21,076 26,339 Other - - Total expenses 553,053 487,616 Expenses absorbed by manager (Note 5) (113,247) (22,295) Net expenses 439,806 465,321 Net invesment income (loss) 44,767$ 1,068,546$ Realized and unrealized gain (loss) on investmentsRealized gain (loss) on sale of investments (239,951)$ 414,622$ Exchange gain (loss) on foreign currencies & other net assets - - Net realized gain (loss) on sale of investments (239,951) 414,622 Change in unrealized appreciation (depreciation) of investments (11,586,087) (2,961,572) Exchange gain (loss) on foreign currencies & other net assets - - Net unrealized gain (loss) on investments (11,586,087) (2,961,572) Net gain (loss) on investments (11,826,038)$ (2,546,950)$
Increase (decrease) in net assets from operations (11,781,271)$ (1,478,404)$
Increase (decrease) in net assets from operations Class A (1,167,966)$ (213,510)$ Class F - - Class I (10,613,305) (1,264,894) Class I - seed - - Increase (decrease) in net assets from operations per daily average number of units Class A (3.95)$ (0.72)$ Class F - - Class I (4.34) (0.66) Class I - seed - -
See accompanying notes to the financial statements.
imaxx TOP Aggressive Growth Portfolio

STATEMENTS OF CHANGES IN NET ASSETS
For the year ended December 31, 2008
Increase (decrease) in net assets from operations $ (1,167,966) $ - $ (10,613,305) $ - $ (11,781,271)
Capital transactions (Note 4)Proceeds from units issued 570,064 7,424,164 - 7,994,228 Reinvested distributions 94,715 887,028 - 981,743 Amounts paid for units redeemed (806,741) (2,949,960) - (3,756,701) Net capital transactions (141,962) - 5,361,232 - 5,219,270
Distributions to unitholders From net investment income (95,743) (887,028) - (982,771) From capital gains - - - - Return of capital - - - - - Net distributions to unitholders (95,743) - (887,028) - (982,771)
Total increase (decrease) in net assets (1,405,671) - (6,139,101) - (7,544,772)
Net assets, beginning of the year 3,760,480 - 30,766,448 34,526,928 Total net assets, end of the year $ 2,354,809 $ - $ 24,627,347 $ - $ 26,982,156
For the year ended December 31, 2007
Increase (decrease) in net assets from operations $ (213,510) $ - $ (1,264,894) $ - $ (1,478,404)
Capital transactions (Note 4)Proceeds from units issued 1,373,204 - 9,541,772 - 10,914,976 Reinvested distributions 102,867 - 770,200 - 873,067 Amounts paid for units redeemed (990,076) - (891,719) - (1,881,795) Net capital transactions 485,995 - 9,420,253 - 9,906,248
Distributions to unitholders From net investment income - - - - - From capital gains (103,942) - (770,200) - (874,142) Return of capital - - - - - Net distributions to unitholders (103,942) - (770,200) - (874,142)
Total increase (decrease) in net assets 168,543 - 7,385,159 - 7,553,702
Net assets, beginning of the year 3,591,937 - 23,381,289 - 26,973,226 Total net assets, end of the year $ 3,760,480 $ - $ 30,766,448 $ - $ 34,526,928
See accompanying notes to the financial statements.
imaxx TOP Aggressive Growth PortfolioClass A Class F Class I Class I - Seed Total Fund

STATEMENT OF INVESTMENT PORTFOLIO as at December 31, 2008imaxx TOP Income Portfolio
Shares/Par Value
Fair Value % of Fair Value
Average Cost % of Average Cost
CASH AND OTHER NET ASSETS $6,161 0.26% $6,161 0.19%
Mutual Fund Units
AGF Canadian High Yield Bond - 370 Class O 22,178 118,652 138,588 AGF Dividend Income - 330 Class O 37,553 376,652 575,982 Trimark Canadian Bond - 1653 Class A 20,051 116,295 119,015 CI Signature High Income - 5100 Class I 36,987 353,224 514,647 Fidelity Canadian Bond - 933 Class I 8,027 103,147 103,471 Bissett Income - 115 Class O 30,404 372,151 529,434 Mackenzie Maxxum Dividend - 1561 Class O 29,325 240,937 354,364 TD Canadian Bond Fund - 0989 Class O 35,197 339,647 352,662 TD Dividend Income - 575 Class O 48,125 380,669 537,105 Total 2,401,374 99.74% 3,225,268 99.81%
Total: MUTUAL FUND UNITS $2,401,374 99.74% $3,225,268 99.81%
Total $2,407,535 $3,231,429Transaction Costs (Note 2) - - 0.00%
Total Net Assets $2,407,535 100.00% $3,231,429 100.00%See accompanying notes to the financial statements.

A0406YTD
STATEMENTS OF NET ASSETS as at December 31
A0206YTD2008 2007
Assets Investments at fair value (Note 2) 2,401,374$ 4,212,086$ Cash 6,744 - Dividends and interest receivable - - Subscriptions receivable 1,130 91,164 Receivable for securities sold 16,569 1,587 Other receivables 4,919 2,247 Total assets 2,430,736 4,307,084 Liabilities Bank overdraft - 1,587 Accrued expenses and other liabilities 10,575 12,416 Payable for units redeemed 8,798 90,890 Payable for investment purchases 3,828 319 Other payables - - Total liabilities 23,201 105,212 Net assets representing unitholders' equity 2,407,535$ 4,201,872$
Net assetsClass A 2,407,535$ 3,929,983$ Class F - - Class I - - Class I - seed - 271,889 Number of units outstanding (Note 4)Class A 339,494 408,526 Class F - - Class I - - Class I - seed - 27,465 Net assets per unit (Note 9)Class A 7.09$ 9.62$ Class F - - Class I - - Class I - seed - 9.90
See accompanying notes to the financial statements.
Approved by AEGON Fund Management Inc. on behalf of the Funds:
Approved by:
Doug Brooks Glenn DanielsPresident and CEO SVP, General Counsel and Corporate Secretary
imaxx TOP Income Portfolio

STATEMENTS OF OPERATIONS for the years ended December 31
A0206YTD2008 2007
Investment income Interest on bonds and debentures -$ -$ Dividends - - Short-term interest - - Distribution from underlying funds 221,338 301,837 Other income - - Less foreign withholding taxes - - Total investment income 221,338 301,837 Expenses Management and advisory fees (Note 5) 87,661 80,944 Administration and recordkeeping 24,024 23,981 Audit fees 5,616 5,431 Custodian fees 2,710 4,773 Goods and Services Tax 4,144 5,178 Other 947 364 Total expenses 125,102 120,671 Expenses absorbed by manager (Note 5) (38,620) (28,975) Net expenses 86,482 91,696 Net invesment income (loss) 134,856$ 210,141$ Realized and unrealized gain (loss) on investmentsRealized gain (loss) on sale of investments (221,248)$ 15,009$ Exchange gain (loss) on foreign currencies & other net assets - - Net realized gain (loss) on sale of investments (221,248) 15,009 Change in unrealized appreciation (depreciation) of investments (663,190) (188,257) Exchange gain (loss) on foreign currencies & other net assets - - Net unrealized gain (loss) on investments (663,190) (188,257) Net gain (loss) on investments (884,438)$ (173,248)$
Increase (decrease) in net assets from operations (749,582)$ 36,893$
Increase (decrease) in net assets from operations Class A (692,984)$ 27,214$ Class F - - Class I - - Class I - seed (56,598) 9,679 Increase (decrease) in net assets from operations per daily average number of units Class A (1.74)$ 0.08$ Class F - - Class I - - Class I - seed (1.97) 0.36
See accompanying notes to the financial statements.
imaxx TOP Income Portfolio

STATEMENTS OF CHANGES IN NET ASSETS
For the year ended December 31, 2008-
Increase (decrease) in net assets from operations $ (692,984) $ - $ - $ (56,598) $ (749,582)
Capital transactions (Note 4)Proceeds from units issued 1,221,827 - - - 1,221,827 Reinvested distributions 162,268 - - 20,784 183,052 Amounts paid for units redeemed (1,903,489) - - (215,291) (2,118,780) Net capital transactions (519,394) - - (194,507) (713,901)
Distributions to unitholders From net investment income (310,070) - - (20,784) (330,854) From capital gains - - - - - Return of capital - - - - - Net distributions to unitholders (310,070) - - (20,784) (330,854)
Total increase (decrease) in net assets (1,522,448) - - (271,889) (1,794,337) -
Net assets, beginning of the year 3,929,983 - - 271,889 4,201,872 Total net assets, end of the year $ 2,407,535 $ - $ - $ - $ 2,407,535
For the year ended December 31, 2007
Increase (decrease) in net assets from operations $ 27,214 $ - $ - $ 9,679 $ 36,893
Capital transactions (Note 4)Proceeds from units issued 3,120,622 - - - 3,120,622 Reinvested distributions 118,548 - - 15,957 134,505 Amounts paid for units redeemed (1,562,932) - - - (1,562,932) Net capital transactions 1,676,238 - - 15,957 1,692,195
Distributions to unitholders From net investment income (216,167) - - (15,957) (232,124) From capital gains - - - - - Return of capital - - - - - Net distributions to unitholders (216,167) - - (15,957) (232,124)
Total increase (decrease) in net assets 1,487,285 - - 9,679 1,496,964
Net assets, beginning of the year 2,442,698 - - 262,210 2,704,908 Total net assets, end of the year $ 3,929,983 $ - $ - $ 271,889 $ 4,201,872
See accompanying notes to the financial statements.
imaxx TOP Income PortfolioClass A Class F Class I Class I - Seed Total Fund

STATEMENT OF INVESTMENT PORTFOLIO as at December 31, 2008imaxx Canadian Equity Value Fund
Shares/Par Value
Fair Value % of Fair Value
Average Cost % of Average Cost
CASH AND OTHER NET ASSETS $113,000 0.41% $113,000 0.31%
SHORT-TERM --CANADIANTreasury BillsGovernment of Canada 22 Jan 09 330,000 329,716 329,165 Government of Canada 19 Mar 09 320,000 319,450 319,411 Total 649,166 2.34% 648,576 1.77%
Total: SHORT-TERM -- CANADIAN $649,166 2.34% $648,576 1.77%
EQUITIES --CANADIANConsumer DiscretionaryCanadian Tire Corporation Ltd. 19,700 855,965 1,062,039 Magna International Inc. 20,200 739,724 1,528,255 Rogers Communications Inc. 15,900 581,781 600,347 Total 2,177,470 7.85% 3,190,641 8.69%
Consumer StaplesLoblaw Companies Ltd. 19,000 663,860 931,897 Metro Inc A 5,300 195,835 124,005 Total 859,695 3.10% 1,055,902 2.88%
EnergyCanadian Natural Res. Ltd. 30,200 1,472,250 1,600,213 EnCana Corporation 15,000 854,400 1,058,913 Ensign Energy Services Inc. 61,700 812,589 920,225 Husky Energy Inc. 43,800 1,351,230 1,067,328 Imperial Oil Limited 27,600 1,130,772 957,795 Petro-Canada 36,000 961,920 1,354,803 Precision Drilling Corp. 42,600 428,556 831,933 Talisman Energy Inc. 108,600 1,322,748 1,454,729 Total 8,334,465 30.03% 9,245,939 25.19%
FinancialBank of Nova Scotia 41,400 1,372,410 1,576,469 Cdn Imperial Bank of Commerce 21,300 1,085,661 1,281,882 ING Canada Inc. 13,200 417,120 554,116 Manulife Financial Corporation 52,600 1,091,976 1,506,628 Sun Life Financial Inc. 46,750 1,325,362 1,905,876 Toronto-Dominion Bank 35,300 1,532,726 1,999,566 Total 6,825,255 24.59% 8,824,537 24.04%
IndustrialCanadian National Railway Co. 14,990 670,653 780,193 Finning International Inc. 18,700 265,914 237,167 Total 936,567 3.37% 1,017,360 2.77%
Information TechnologyCGI Group Inc. 52,100 494,950 433,730 Total 494,950 1.78% 433,730 1.18%
MaterialsAgrium Inc. 13,900 576,433 571,391 Inmet Mining Corporation 13,800 270,204 854,883 Norbord Inc. 54,700 37,196 528,978 Nova Chemicals Corporation 20,500 119,720 652,989 Teck Cominco Ltd. 113,200 678,068 2,050,713 Total 1,681,621 6.06% 4,658,954 12.70%

STATEMENT OF INVESTMENT PORTFOLIO as at December 31, 2008imaxx Canadian Equity Value Fund
Shares/Par Value
Fair Value % of Fair Value
Average Cost % of Average Cost
Telecommunication ServicesBell Aliant Reg. Comm. 18,997 445,860 575,253 TELUS Corporation 47,000 1,621,500 2,143,352 Total 2,067,360 7.45% 2,718,605 7.41%
Total: EQUITIES -- CANADIAN $23,377,383 84.23% $31,145,668 84.86%
EQUITIES -- FOREIGNConsumer DiscretionaryHome Depot Inc. 15,200 426,708 578,516 Total 426,708 1.54% 578,516 1.58%
EnergyExelon Corporation 9,800 664,601 630,988 Weatherford Intl. 11,900 157,020 342,913 Total 821,621 2.96% 973,901 2.65%
Health CareCardinal Health Inc. 9,900 416,158 460,778 Merck and Co. Inc. 5 185 318 Wellpoint Inc. 6,600 339,092 331,404 Total 755,435 2.72% 792,500 2.16%
IndustrialEaton Corporation 5,600 339,480 420,980 General Electric Co. 22,250 433,871 804,169 Total 773,351 2.78% 1,225,149 3.34%
Information TechnologyCorning Incorporated 26,700 310,303 462,656 Total 310,303 1.12% 462,656 1.26%
MaterialsDu Pont (EI) de Nemours 12,900 398,008 575,185 Freeport - McMoran Copper 4,312 128,517 229,796 Total 526,525 1.90% 804,981 2.19%
Total: EQUITIES -- FOREIGN $3,613,943 13.02% $4,837,703 13.18%
Total $27,753,492 $36,744,947Transaction Costs (Note 2) - (43,988) (0.12%)
Total Net Assets $27,753,492 100.00% $36,700,959 100.00%See accompanying notes to the financial statements.
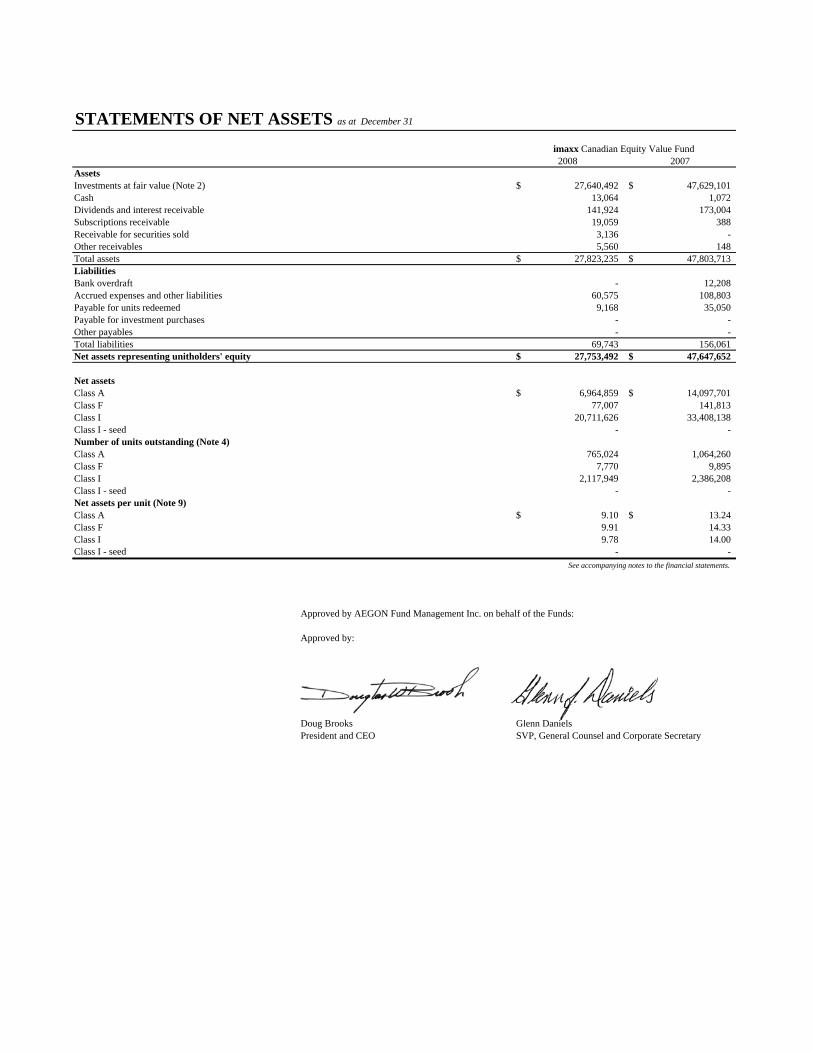
A0406YTD
STATEMENTS OF NET ASSETS as at December 31
A0206YTD2008 2007
Assets Investments at fair value (Note 2) 27,640,492$ 47,629,101$ Cash 13,064 1,072 Dividends and interest receivable 141,924 173,004 Subscriptions receivable 19,059 388 Receivable for securities sold 3,136 - Other receivables 5,560 148 Total assets 27,823,235$ 47,803,713$ Liabilities Bank overdraft - 12,208 Accrued expenses and other liabilities 60,575 108,803 Payable for units redeemed 9,168 35,050 Payable for investment purchases - - Other payables - - Total liabilities 69,743 156,061 Net assets representing unitholders' equity 27,753,492$ 47,647,652$
Net assetsClass A 6,964,859$ 14,097,701$ Class F 77,007 141,813 Class I 20,711,626 33,408,138 Class I - seed - - Number of units outstanding (Note 4)Class A 765,024 1,064,260 Class F 7,770 9,895 Class I 2,117,949 2,386,208 Class I - seed - - Net assets per unit (Note 9)Class A 9.10$ 13.24$ Class F 9.91 14.33 Class I 9.78 14.00 Class I - seed - -
See accompanying notes to the financial statements.
Approved by AEGON Fund Management Inc. on behalf of the Funds:
Approved by:
Doug Brooks Glenn DanielsPresident and CEO SVP, General Counsel and Corporate Secretary
imaxx Canadian Equity Value Fund

STATEMENTS OF OPERATIONS for the years ended December 31
A0206YTD2008 2007
Investment income Interest on bonds and debentures -$ -$ Dividends 1,090,918 1,182,058 Short-term interest 19,491 63,235 Distribution from underlying funds - - Other income 11,489 2,296 Less foreign withholding taxes (40,157) (47,293) Total investment income 1,081,741 1,200,296 Expenses Management and advisory fees (Note 5) 447,777 573,997 Administration and recordkeeping 76,197 90,369 Audit fees 5,990 5,431 Custodian fees 12,620 10,329 Goods and Services Tax 25,497 40,761 Other - - Total expenses 568,081 720,887 Expenses absorbed by manager (Note 5) (32,632) (780) Net expenses 535,449 720,107 Net invesment income (loss) 546,292$ 480,189$ Realized and unrealized gain (loss) on investmentsRealized gain (loss) on sale of investments (1,176,393)$ 3,988,256$ Exchange gain (loss) on foreign currencies & other net assets 317,113 (411,231) Net realized gain (loss) on sale of investments (859,280) 3,577,025 Change in unrealized appreciation (depreciation) of investments (13,678,138) (4,774,720) Exchange gain (loss) on foreign currencies & other net assets 2,194,950 (1,472,970) Net unrealized gain (loss) on investments (11,483,188) (6,247,690) Transaction Cost (68,386) (41,947) Net gain (loss) on investments (12,410,854)$ (2,712,612)$
Increase (decrease) in net assets from operations (11,864,562)$ (2,232,423)$
Increase (decrease) in net assets from operations Class A (3,249,168)$ (718,009)$ Class F (45,466) (5,245) Class I (8,569,928) (1,509,169) Class I - seed - - Increase (decrease) in net assets from operations per daily average number of units Class A (3.75)$ (0.69)$ Class F (4.64) (0.42) Class I (3.89) (0.74) Class I - seed - -
See accompanying notes to the financial statements.
imaxx Canadian Equity Value Fund

STATEMENTS OF CHANGES IN NET ASSETS
For the year ended December 31, 2008
Increase (decrease) in net assets from operations $ (3,249,168) $ (45,466) $ (8,569,928) $ - $ (11,864,562)
Capital transactions (Note 4)Proceeds from units issued 1,837,623 6,333 2,832,056 - 4,676,012 Reinvested distributions 85,553 866 234,789 - 321,208 Amounts paid for units redeemed (5,721,203) (25,673) (6,958,640) - (12,705,516) Net capital transactions (3,798,027) (18,474) (3,891,795) - (7,708,296)
Distributions to unitholders From net investment income (85,647) (866) (234,789) - (321,302) From capital gains - - - - - Return of capital - - - - - Net distributions to unitholders (85,647) (866) (234,789) - (321,302)
Total increase (decrease) in net assets (7,132,842) (64,806) (12,696,512) - (19,894,160)
Net assets, beginning of the year 14,097,701 141,813 33,408,138 47,647,652 Total net assets, end of the year $ 6,964,859 $ 77,007 $ 20,711,626 $ $ 27,753,492
For the year ended December 31, 2007
Increase (decrease) in net assets from operations $ (718,009) $ (5,245) $ (1,509,169) $ - $ (2,232,423)
Capital transactions (Note 4)Proceeds from units issued 3,025,197 4,712 7,236,530 - 10,266,439 Reinvested distributions 1,020,130 9,872 2,307,057 - 3,337,059 Amounts paid for units redeemed (4,831,700) (74,070) (3,473,614) - (8,379,384) Net capital transactions (786,373) (59,486) 6,069,973 - 5,224,114
Distributions to unitholders From net investment income (74,542) (715) (167,187) - (242,444) From capital gains (954,082) (9,156) (2,139,870) - (3,103,108) Return of capital - - - - - Net distributions to unitholders (1,028,624) (9,871) (2,307,057) - (3,345,552)
Total increase (decrease) in net assets (2,533,006) (74,602) 2,253,747 - (353,861)
Net assets, beginning of the year 16,630,707 216,415 31,154,391 - 48,001,513 Total net assets, end of the year $ 14,097,701 $ 141,813 $ 33,408,138 $ - $ 47,647,652
See accompanying notes to the financial statements.
imaxx Canadian Equity Value FundClass A Class F Class I Class I - Seed Total Fund

STATEMENT OF INVESTMENT PORTFOLIO as at December 31, 2008imaxx Canadian Equity Growth Fund
Shares/Par Value
Fair Value % of Fair Value
Average Cost % of Average Cost
CASH AND OTHER NET ASSETS $208,149 1.32% $208,149 1.10%
SHORT-TERM --CANADIANTreasury BillsGovernment of Canada 22 Jan 09 25,000 24,972 24,907 Government of Canada 05 Mar 09 65,000 64,742 64,347 Government of Canada 19 Mar 09 350,000 349,113 348,890 Total 438,827 2.79% 438,144 2.30%
Total: SHORT-TERM -- CANADIAN $438,827 2.79% $438,144 2.30%
EQUITIES --CANADIANConsumer DiscretionaryCelestica Inc. 23,606 130,305 154,465 Rogers Communications Inc. 19,682 720,164 724,716 Shaw Communications Inc. 13,732 296,474 286,536 Total 1,146,943 7.30% 1,165,717 6.13%
Consumer StaplesEmpire Co. Ltd. 4,382 212,527 203,537 GLG Life Tech Corporation Warrants 2009/06/10 20,250 - - Shoppers Drug Mart Inc. 5,115 245,673 254,983 Total 458,200 2.91% 458,520 2.41%
EnergyAddax Petroleum Corp. 7,736 163,152 288,464 Bankers Petroleum Ltd 64,673 46,565 162,058 Canadian Natural Res. Ltd. 17,008 829,140 928,735 Challenger Energy Corp. Warrants 2010/03/06 10,300 1,236 4,120 EnCana Corporation 16,811 957,555 1,007,062 Husky Energy Inc. 12,900 397,965 545,815 Imperial Oil Limited 7,715 316,084 302,101 Petrobank Energy & Res. Ltd. 12,803 257,340 683,293 Sterling Resources Ltd. Warrants 2008/08/06 26,000 - - Storm Exploration Inc. 8,058 110,878 128,387 Suncor Energy Inc. 18,517 439,223 741,949 TriStar Oil & Gas Ltd. 20,522 231,899 291,470 Total 3,751,037 23.86% 5,083,454 26.72%
FinancialBank of Nova Scotia 14,722 488,034 592,708 Cdn Imperial Bank of Commerce 3,144 160,250 170,306 Fairfax Financial Holdgs Ltd. 737 281,438 231,910 Manulife Financial Corporation 28,986 601,749 933,769 National Bank of Canada 5,481 171,555 245,674 Power Corporation of Canada 13,327 295,993 468,607 Royal Bank of Canada 27,639 995,004 1,371,956 Toronto-Dominion Bank 17,348 753,250 1,005,874 Total 3,747,273 23.83% 5,020,804 26.40%
Health CareAllon Therapeutics Inc. Warrants 2009/05/29 14,500 - 1,197 Bradmer Pharmaceuticals Inc. Warrants 2011/06/22 27,050 - 8,115 Total - 0.00% 9,312 0.05%
IndustrialAG Growth Income Fund 14,883 288,581 390,733 Bombardier Inc. 102,026 450,955 637,849 Canadian Pacific Railway Ltd. 7,871 321,609 353,835 OSI Geospatial Inc Warrants 2009/07/31 30,500 - - Sonic Technology Solutions Inc Warrants 2009/04/30 82,500 - - Total 1,061,145 6.75% 1,382,417 7.27%

STATEMENT OF INVESTMENT PORTFOLIO as at December 31, 2008imaxx Canadian Equity Growth Fund
Shares/Par Value
Fair Value % of Fair Value
Average Cost % of Average Cost
Information TechnologyResearch in Motion Limited 9,754 482,433 631,397 Total 482,433 3.07% 631,397 3.32%
MaterialsAgnico-Eagle Mines Ltd. 7,335 460,418 284,971 Barrick Gold Corporation 22,449 1,003,021 883,619 Blue Note Mining Inc. Warrants 2009/11/08 98,153 - - Cameco Corp. 9,446 197,894 389,451 Coalcorp Mining Inc. Warrants 2011/08/17 2,143 11 3,000 Eastern Platinum Ltd. Warrants 2009/03/28 62,500 625 - Franco-Nevada Corporation 15,944 339,288 273,634 Goldcorp Inc. 10,058 385,825 409,688 Kinross Gold Corp. 17,277 388,732 311,634 Norsemont Mining Inc. Warrants 2009/11/14 43,055 - - Osisko Mining Corporation Warrants 2009/11/15 3,450 690 3,634 Potash Corporation of Saskatchewan Inc. 2,590 231,857 359,743 Red Back Mining Inc. 15,300 130,203 53,550 Redcorp Ventures Ltd. Warrants 2009/07/10 108,148 541 6,489 Sprott Molybdenum Part. Corp. Warrants 2009/04/16 11,050 55 4,332 Stingray Resources Inc. Warrants 2009/04/24 54,600 273 2,791 Timminco Ltd. 24,522 85,827 306,012 Vaaldiam Resources Ltd. Warrants 2009/08/15 37,500 - - Total 3,225,260 20.51% 3,292,548 17.31%
Telecommunication ServicesBCE Inc. 6,357 159,243 139,408 BSM Technologies Inc. Warrants 2009/01/09 75,000 - 4,200 Total 159,243 1.01% 143,608 0.75%
UtilitiesEarthFirst Canada Inc. Warrants 2009/12/09 14,500 72 4,731 TransCanada Corp. 13,523 448,558 482,230 Total 448,630 2.85% 486,961 2.56%
Total: EQUITIES -- CANADIAN $14,480,164 92.09% $17,674,738 92.92%
EQUITIES -- FOREIGNConsumer DiscretionaryTim Hortons Inc. 7,337 255,768 241,814 Total 255,768 1.63% 241,814 1.27%
IndustrialLLX Logistica S.A. 10,951 8,681 27,049 Total 8,681 0.06% 27,049 0.14%
MaterialsMMX Mineracao e Metalicos S.A. 10,951 15,835 218,312 SPDR Gold Trust 3,000 316,533 261,978 Total 332,368 2.11% 480,290 2.53%
UtilitiesU.S. Geothermal Inc. Warrants 2010/04/28 55,000 - - Total - 0.00% - 0.00%
Total: EQUITIES -- FOREIGN $596,817 3.80% $749,153 3.94%
Total $15,723,957 $19,070,184Transaction Costs (Note 2) - (49,058) (0.26%)
Total Net Assets $15,723,957 100.00% $19,021,126 100.00%See accompanying notes to the financial statements.

A0406YTD
STATEMENTS OF NET ASSETS as at December 31
A0206YTD2008 2007
Assets Investments at fair value (Note 2) 15,515,808$ 21,932,384$ Cash 11,805 78,829 Dividends and interest receivable 44,170 21,134 Subscriptions receivable 30,120 89,156 Receivable for securities sold 151,567 119,705 Other receivables 7,533 1,166 Total assets 15,761,003$ 22,242,374$ Liabilities Bank overdraft - - Accrued expenses and other liabilities 28,989 39,913 Payable for units redeemed 8,057 27,849 Payable for investment purchases - 219,865 Other payables - - Total liabilities 37,046 287,627 Net assets representing unitholders' equity 15,723,957$ 21,954,747$
Net assetsClass A 7,075,957$ 11,029,169$ Class F 42,401 67,166 Class I 8,605,599 10,858,412 Class I - seed - - Number of units outstanding (Note 4)Class A 573,227 534,892 Class F 8,894 8,146 Class I 722,489 555,279 Class I - seed - - Net assets per unit (Note 9)Class A 12.34$ 20.62$ Class F 4.77 8.25 Class I 11.91 19.55 Class I - seed - -
See accompanying notes to the financial statements.
Approved by AEGON Fund Management Inc. on behalf of the Funds:
Approved by:
Doug Brooks Glenn DanielsPresident and CEO SVP, General Counsel and Corporate Secretary
imaxx Canadian Equity Growth Fund
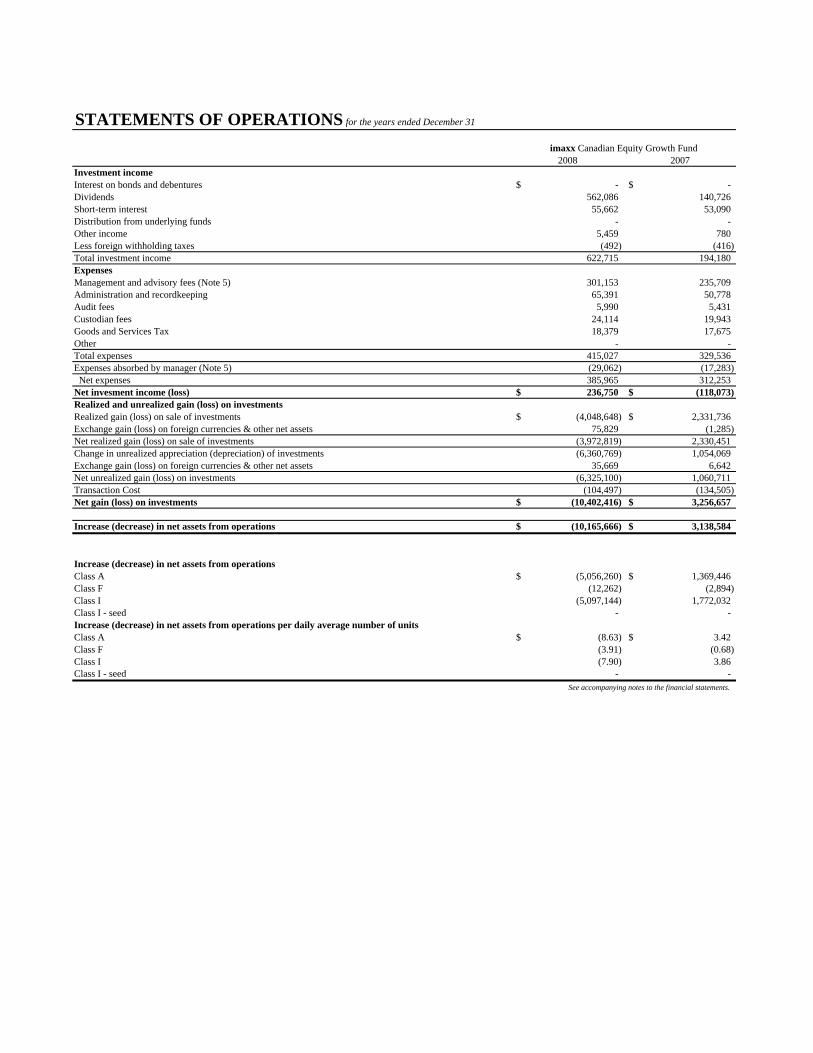
STATEMENTS OF OPERATIONS for the years ended December 31
A0206YTD2008 2007
Investment income Interest on bonds and debentures -$ -$ Dividends 562,086 140,726 Short-term interest 55,662 53,090 Distribution from underlying funds - - Other income 5,459 780 Less foreign withholding taxes (492) (416) Total investment income 622,715 194,180 Expenses Management and advisory fees (Note 5) 301,153 235,709 Administration and recordkeeping 65,391 50,778 Audit fees 5,990 5,431 Custodian fees 24,114 19,943 Goods and Services Tax 18,379 17,675 Other - - Total expenses 415,027 329,536 Expenses absorbed by manager (Note 5) (29,062) (17,283) Net expenses 385,965 312,253 Net invesment income (loss) 236,750$ (118,073)$ Realized and unrealized gain (loss) on investmentsRealized gain (loss) on sale of investments (4,048,648)$ 2,331,736$ Exchange gain (loss) on foreign currencies & other net assets 75,829 (1,285) Net realized gain (loss) on sale of investments (3,972,819) 2,330,451 Change in unrealized appreciation (depreciation) of investments (6,360,769) 1,054,069 Exchange gain (loss) on foreign currencies & other net assets 35,669 6,642 Net unrealized gain (loss) on investments (6,325,100) 1,060,711 Transaction Cost (104,497) (134,505) Net gain (loss) on investments (10,402,416)$ 3,256,657$
Increase (decrease) in net assets from operations (10,165,666)$ 3,138,584$
Increase (decrease) in net assets from operations Class A (5,056,260)$ 1,369,446$ Class F (12,262) (2,894) Class I (5,097,144) 1,772,032 Class I - seed - - Increase (decrease) in net assets from operations per daily average number of units Class A (8.63)$ 3.42$ Class F (3.91) (0.68) Class I (7.90) 3.86 Class I - seed - -
See accompanying notes to the financial statements.
imaxx Canadian Equity Growth Fund

STATEMENTS OF CHANGES IN NET ASSETS
For the year ended December 31, 2008
Increase (decrease) in net assets from operations $ (5,056,260) $ (12,262) $ (5,097,144) $ - $ (10,165,666)
Capital transactions (Note 4)Proceeds from units issued 5,148,555 85,768 4,097,717 - 9,332,040 Reinvested distributions 45,671 119 58,658 - 104,448 Amounts paid for units redeemed (4,044,256) (97,660) (1,253,386) - (5,395,302) Net capital transactions 1,149,970 (11,773) 2,902,989 - 4,041,186
Distributions to unitholders From net investment income (46,922) (730) (58,658) - (106,310) From capital gains - - - - - Return of capital - - - - - Net distributions to unitholders (46,922) (730) (58,658) - (106,310)
Total increase (decrease) in net assets (3,953,212) (24,765) (2,252,813) - (6,230,790)
Net assets, beginning of the year 11,029,169 67,166 10,858,412 - 21,954,747 Total net assets, end of the year $ 7,075,957 $ 42,401 $ 8,605,599 $ - $ 15,723,957
For the year ended December 31, 2007
Increase (decrease) in net assets from operations $ 1,369,446 $ (2,894) $ 1,772,032 $ - $ 3,138,584
Capital transactions (Note 4)Proceeds from units issued 6,615,352 79,536 3,384,562 - 10,079,450 Reinvested distributions 714,593 10,364 772,287 - 1,497,244 Amounts paid for units redeemed (2,087,747) (9,476) (1,182,482) - (3,279,705) Net capital transactions 5,242,198 80,424 2,974,367 - 8,296,989
Distributions to unitholders From net investment income - - - - - From capital gains (748,849) (10,364) (772,287) - (1,531,500) Return of capital - - - - - Net distributions to unitholders (748,849) (10,364) (772,287) - (1,531,500)
Total increase (decrease) in net assets 5,862,795 67,166 3,974,112 - 9,904,073
Net assets, beginning of the year 5,166,374 - 6,884,300 - 12,050,674 Total net assets, end of the year $ 11,029,169 $ 67,166 $ 10,858,412 $ - $ 21,954,747
See accompanying notes to the financial statements.
imaxx Canadian Equity Growth FundClass A Class F Class I Class I - Seed Total Fund

STATEMENT OF INVESTMENT PORTFOLIO as at December 31, 2008imaxx US Equity Value Fund
Shares/Par Value
Fair Value % of Fair Value
Average Cost % of Average Cost
CASH AND OTHER NET ASSETS $191,722 5.27% $191,722 4.38%
EQUITIES -- FOREIGNConsumer DiscretionaryComcast Corporation 10,200 209,222 210,745 Home Depot Inc. 4,850 136,154 198,466 Timberland Company 3,300 46,481 60,145 Viacom Inc. 2,845 66,128 106,194 Total 457,985 12.60% 575,550 13.15%
Consumer StaplesArcher Daniels Midland Co 1,000 35,158 23,187 Hubbell Incorporated 1,000 39,853 36,709 Int. Flavors & Fragrances Inc. 1,400 50,741 57,835 Kimberly-Clark Corp. 600 38,253 40,923 Total 164,005 4.51% 158,654 3.63%
EnergyApache Corp. 1,200 109,067 127,021 Chevron Corporation 600 54,124 51,779 Duke Energy Corporation 11,000 201,352 205,036 Exelon Corporation 2,200 149,196 135,967 Nabors Industries Ltd. 5,600 81,472 148,653 Valero Energy Corporation 2,900 76,531 94,503 Weatherford Intl. 4,600 60,697 113,855 Total 732,439 20.14% 876,814 20.04%
FinancialAFLAC Inc. 1,300 72,672 73,165 AllianceBernstein Holding LP 3,500 88,737 135,701 Bank of America Corp. 3,540 60,784 133,720 Moody's Corporation 2,000 49,000 69,898 Progressive Corporation 3,700 66,825 68,424 Total 338,018 9.30% 480,908 10.99%
Health CareCardinal Health Inc. 2,500 105,090 121,534 Merck and Co. Inc. 3,100 114,926 103,863 Wellpoint Inc. 2,900 148,995 143,626 Wyeth 2,600 118,933 105,904 Total 487,944 13.42% 474,927 10.86%
Industrial3M Company 500 35,085 39,211 Eaton Corporation 1,800 109,118 105,118 General Electric Co. 8,525 166,236 303,795 Johnson Controls Inc. 2,300 50,936 73,338 Manpower Inc. 1,400 58,031 62,720 Total 419,406 11.54% 584,182 13.35%
Information TechnologyAmdocs Ltd. 2,100 46,840 60,439 Corning Incorporated 14,000 162,706 208,802 Intel Corporation 5,700 101,904 111,302 KLA-Tencor Corporation 1,500 39,859 31,587 Total 351,309 9.66% 412,130 9.42%

STATEMENT OF INVESTMENT PORTFOLIO as at December 31, 2008imaxx US Equity Value Fund
Shares/Par Value
Fair Value % of Fair Value
Average Cost % of Average Cost
MaterialsAir Products & Chemicals Inc 2,300 141,000 160,964 Du Pont (EI) de Nemours 5,400 166,608 231,243 Freeport - McMoran Copper 1,800 53,648 86,255 Precision Castparts Corp. 1,400 101,550 99,087 Total 462,806 12.73% 577,549 13.20%
Telecommunications ServicesCox Radio Inc. 4,100 30,050 46,185 Total 30,050 0.83% 46,185 1.06%
Total: EQUITIES -- FOREIGN $3,443,962 94.73% $4,186,899 95.70%
Total $3,635,684 $4,378,621Transaction Costs (Note 2) - (3,547) (0.08%)
Total Net Assets $3,635,684 100.00% $4,375,074 100.00%See accompanying notes to the financial statements.

A0406YTD
STATEMENTS OF NET ASSETS as at December 31
A0206YTD2008 2007
Assets Investments at fair value (Note 2) 3,443,962$ 5,837,835$ Cash 191,401 434,345 Dividends and interest receivable 4,531 5,397 Subscriptions receivable 3,044 217 Receivable for securities sold - - Other receivables 4,346 1,090 Total assets 3,647,284$ 6,278,884$ Liabilities Bank overdraft - - Accrued expenses and other liabilities 11,500 14,060 Payable for units redeemed 100 1,994 Payable for investment purchases - - Other payables - - Total liabilities 11,600 16,054 Net assets representing unitholders' equity 3,635,684$ 6,262,830$
Net assetsClass A 327,340$ 476,109$ Class F - - Class I 3,308,344 4,457,762 Class I - seed - 1,328,959 Number of units outstanding (Note 4)Class A 59,336 57,358 Class F - - Class I 592,676 539,455 Class I - seed - 157,768 Net assets per unit (Note 9)Class A 5.52$ 8.30$ Class F - - Class I 5.58 8.26 Class I - seed - 8.42
See accompanying notes to the financial statements.
Approved by AEGON Fund Management Inc. on behalf of the Funds:
Approved by:
Doug Brooks Glenn DanielsPresident and CEO SVP, General Counsel and Corporate Secretary
imaxx U.S. Equity Value Fund

STATEMENTS OF OPERATIONS for the years ended December 31
A0206YTD2008 2007
Investment income Interest on bonds and debentures -$ -$ Dividends 145,125 142,513 Short-term interest - - Distribution from underlying funds - - Other income 55,419 - Less foreign withholding taxes (22,528) (22,424) Total investment income 178,016 120,089 Expenses Management and advisory fees (Note 5) 47,259 55,142 Administration and recordkeeping 22,275 26,465 Audit fees 4,871 5,431 Custodian fees 1,926 2,474 Goods and Services Tax 2,826 4,183 Other - 53,819 Total expenses 79,157 147,514 Expenses absorbed by manager (Note 5) (19,816) (19,266) Net expenses 59,341 128,248 Net invesment income (loss) 118,675$ (8,159)$ Realized and unrealized gain (loss) on investmentsRealized gain (loss) on sale of investments (1,698,029)$ (25,544)$ Exchange gain (loss) on foreign currencies & other net assets (284,290) (148,329) Net realized gain (loss) on sale of investments (1,982,319) (173,873) Change in unrealized appreciation (depreciation) of investments (1,604,907) (667,286) Exchange gain (loss) on foreign currencies & other net assets 1,473,731 (749,763) Net unrealized gain (loss) on investments (131,176) (1,417,049) Transaction Cost (11,214) (4,106) Net gain (loss) on investments (2,124,709)$ (1,595,028)$
Increase (decrease) in net assets from operations (2,006,034)$ (1,603,187)$
Increase (decrease) in net assets from operations Class A (147,937)$ (141,483)$ Class F - - Class I (1,393,281) (1,110,076) Class I - seed (464,816) (351,628) Increase (decrease) in net assets from operations per daily average number of units Class A (2.62)$ (2.51)$ Class F - - Class I (2.47) (2.33) Class I - seed (2.95) (2.23)
See accompanying notes to the financial statements.
imaxx U.S. Equity Value Fund

STATEMENTS OF CHANGES IN NET ASSETS
For the year ended December 31, 2008
Increase (decrease) in net assets from operations $ (147,937) $ - $ (1,393,281) $ (464,816) $ (2,006,034)
Capital transactions (Note 4)Proceeds from units issued 204,080 - 1,283,001 - 1,487,081 Reinvested distributions 8,384 - 89,618 - 98,002 Amounts paid for units redeemed (204,336) - (1,039,138) (864,143) (2,107,617) Net capital transactions 8,128 - 333,481 (864,143) (522,534)
Distributions to unitholders From net investment income (8,960) - (89,618) - (98,578) From capital gains - - - - - Return of capital - - - - - Net distributions to unitholders (8,960) - (89,618) - (98,578)
Total increase (decrease) in net assets (148,769) - (1,149,418) (1,328,959) (2,627,146)
Net assets, beginning of the year 476,109 - 4,457,762 1,328,959 6,262,830 Total net assets, end of the year $ 327,340 $ - $ 3,308,344 $ - $ 3,635,684
For the year ended December 31, 2007
Increase (decrease) in net assets from operations $ (141,483) $ - $ (1,110,076) $ (351,628) $ (1,603,187)
Capital transactions (Note 4)Proceeds from units issued 309,530 - 1,817,356 - 2,126,886 Reinvested distributions - - - - - Amounts paid for units redeemed (147,435) - (577,321) 1 (724,755) Net capital transactions 162,095 - 1,240,035 1 1,402,131
Distributions to unitholders From net investment income - - - - - From capital gains - - - - - Return of capital - - - - - Net distributions to unitholders - - - - -
Total increase (decrease) in net assets 20,612 - 129,959 (351,627) (201,056)
Net assets, beginning of the year 455,497 - 4,327,803 1,680,586 6,463,886 Total net assets, end of the year $ 476,109 $ - $ 4,457,762 $ 1,328,959 $ 6,262,830
See accompanying notes to the financial statements.
imaxx U.S. Equity Value FundClass A Class F Class I Class I - Seed Total Fund

STATEMENT OF INVESTMENT PORTFOLIO as at December 31, 2008imaxx US Equity Growth Fund
Shares/Par Value
Fair Value % of Fair Value
Average Cost % of Average Cost
CASH AND OTHER NET ASSETS $166,024 5.29% $166,024 4.73%
EQUITIES -- FOREIGNConsumer DiscretionaryAmazon.com Inc. 1,910 119,304 144,673 Daimler AG 775 36,179 74,216 The Walt Disney Co. 3,110 86,055 89,259 Total 241,538 7.70% 308,148 8.78%
FinancialAmerican Express Co. 1,900 42,981 89,904 Charles Schwab Corp. 4,070 80,208 91,993 CME Group Inc. 200 50,665 46,473 T. Rowe Price Group Inc. 2,304 99,408 120,240 Wells Fargo & Co. 3,130 112,526 106,678 Total 385,788 12.30% 455,288 12.97%
Health CareAdvanced Medical Optics Inc. 1 8 16 Allergan Inc. 1,250 61,463 67,390 Becton Dickinson and Company 1,400 116,762 121,074 Ecolab Inc. 1,830 78,444 85,873 Gilead Sciences Inc. 2,800 174,452 131,268 Sigma-Aldrich Corp. 2,060 105,988 108,899 Varian Medical Systems Inc. 1,670 71,361 91,258 Total 608,478 19.40% 605,778 17.26%
IndustrialBoeing Co. 855 43,657 89,346 BorgWarner Inc. 2,110 56,017 101,362 Caterpillar Inc. 1,480 80,623 96,549 Emerson Electric Co. 1,482 66,165 62,273 Expeditors Intl of Wash Inc. 2,290 92,744 72,858 General Electric Co. 4,570 89,114 164,418 Jacobs Engineering Group Inc. 1,850 108,517 81,103 Johnson Controls Inc. 3,240 71,753 128,043 PACCAR Inc. 2,765 96,403 140,249 Raytheon Company 2,530 157,321 158,136 Union Pacific Corp. 1,965 114,544 131,958 Total 976,858 31.15% 1,226,295 34.94%
Information TechnologyApple Inc. 1,100 114,493 65,978 Cisco Systems Inc. 3,800 75,443 80,364 Google Inc. 285 106,829 143,613 Tyco Electronics Ltd. 4,775 94,393 160,590 Total 391,158 12.48% 450,545 12.84%
MaterialsPraxair Inc. 1,980 143,331 94,324 Total 143,331 4.57% 94,324 2.69%
Telecommunications ServicesAT&T Inc. 2,300 79,938 99,385 QUALCOMM Inc. 3,275 142,980 106,327 Total 222,918 7.11% 205,712 5.86%

STATEMENT OF INVESTMENT PORTFOLIO as at December 31, 2008imaxx US Equity Growth Fund
Shares/Par Value
Fair Value % of Fair Value
Average Cost % of Average Cost
Total: EQUITIES -- FOREIGN $2,970,069 94.71% $3,346,090 95.34%
Total $3,136,093 $3,512,114Transaction Costs (Note 2) - (2,414) (0.07%)
Total Net Assets $3,136,093 100.00% $3,509,700 100.00%See accompanying notes to the financial statements.

A0406YTD
STATEMENTS OF NET ASSETS as at December 31
A0206YTD2008 2007
Assets Investments at fair value (Note 2) 2,970,069$ 3,850,707$ Cash 335,184 70,382 Dividends and interest receivable 5,801 4,364 Subscriptions receivable 4,293 384 Receivable for securities sold - - Other receivables - 1,181 Total assets 3,315,347$ 3,927,018$ Liabilities Bank overdraft - - Accrued expenses and other liabilities 3,939 7,353 Payable for units redeemed 100 - Payable for investment purchases 174,439 - Other payables 776 - Total liabilities 179,254 7,353 Net assets representing unitholders' equity 3,136,093$ 3,919,665$
Net assetsClass A 355,581$ 357,986$ Class F - - Class I 1,943,708 2,349,488 Class I - seed 836,804 1,212,191 Number of units outstanding (Note 4)Class A 45,042 30,169 Class F - - Class I 243,529 199,545 Class I - seed 101,912 100,675 Net assets per unit (Note 9)Class A 7.89$ 11.87$ Class F - - Class I 7.98 11.78 Class I - seed 8.21 12.04
See accompanying notes to the financial statements.
Approved by AEGON Fund Management Inc. on behalf of the Funds:
Approved by:
Doug Brooks Glenn DanielsPresident and CEO SVP, General Counsel and Corporate Secretary
imaxx U.S. Equity Growth Fund

STATEMENTS OF OPERATIONS for the years ended December 31
A0206YTD2008 2007
Investment income Interest on bonds and debentures -$ -$ Dividends 47,553 32,943 Short-term interest - - Distribution from underlying funds - - Other income 45,963 - Less foreign withholding taxes (6,816) (4,661) Total investment income 86,700 28,282 Expenses Management and advisory fees (Note 5) 25,703 25,005 Administration and recordkeeping 22,332 23,844 Audit fees 5,005 5,431 Custodian fees 3,337 2,651 Goods and Services Tax 1,601 1,964 Other - 14,630 Total expenses 57,978 73,525 Expenses absorbed by manager (Note 5) (24,361) (23,430) Net expenses 33,617 50,095 Net invesment income (loss) 53,083$ (21,813)$ Realized and unrealized gain (loss) on investmentsRealized gain (loss) on sale of investments (308,070)$ 273,630$ Exchange gain (loss) on foreign currencies & other net assets (18,804) (199,842) Net realized gain (loss) on sale of investments (326,874) 73,788 Change in unrealized appreciation (depreciation) of investments (1,728,298) 122,161 Exchange gain (loss) on foreign currencies & other net assets 685,663 (233,501) Net unrealized gain (loss) on investments (1,042,635) (111,340) Transaction Cost (2,457) (2,289) Net gain (loss) on investments (1,371,966)$ (39,841)$
Increase (decrease) in net assets from operations (1,318,883)$ (61,654)$
Increase (decrease) in net assets from operations Class A (139,302)$ (14,543)$ Class F - - Class I (804,194) (33,465) Class I - seed (375,387) (13,646) Increase (decrease) in net assets from operations per daily average number of units Class A (3.98)$ (0.53)$ Class F - - Class I (3.65) (0.18) Class I - seed (3.73) (0.14)
See accompanying notes to the financial statements.
imaxx U.S. Equity Growth Fund

STATEMENTS OF CHANGES IN NET ASSETS
For the year ended December 31, 2008
Increase (decrease) in net assets from operations $ (139,302) $ - $ (804,194) $ (375,387) $ (1,318,883)
Capital transactions (Note 4)Proceeds from units issued 255,388 - 536,819 - 792,207 Reinvested distributions 4,105 - 23,256 9,752 37,113 Amounts paid for units redeemed (118,198) - (138,405) - (256,603) Net capital transactions 141,295 - 421,670 9,752 572,717
Distributions to unitholders From net investment income (4,398) - (23,256) (9,752) (37,406) From capital gains - - - - - Return of capital - - - - - Net distributions to unitholders (4,398) - (23,256) (9,752) (37,406)
Total increase (decrease) in net assets (2,405) - (405,780) (375,387) (783,572)
Net assets, beginning of the year 357,986 - 2,349,488 1,212,191 3,919,665 Total net assets, end of the year $ 355,581 $ - $ 1,943,708 $ 836,804 $ 3,136,093
For the year ended December 31, 2007
Increase (decrease) in net assets from operations $ (14,543) $ - $ (33,465) $ (13,646) $ (61,654)
Capital transactions (Note 4)Proceeds from units issued 125,977 - 602,001 - 727,978 Reinvested distributions - - - - - Amounts paid for units redeemed (116,820) - (305,512) - (422,332) Net capital transactions 9,157 - 296,489 - 305,646
Distributions to unitholders From net investment income - - - - - From capital gains - - - - - Return of capital - - - - - Net distributions to unitholders - - - - -
Total increase (decrease) in net assets (5,386) - 263,024 (13,646) 243,992
Net assets, beginning of the year 363,372 - 2,086,464 1,225,837 3,675,673 Total net assets, end of the year $ 357,986 $ - $ 2,349,488 $ 1,212,191 $ 3,919,665
See accompanying notes to the financial statements.
imaxx U.S. Equity Growth FundClass A Class F Class I Class I - Seed Total Fund

STATEMENT OF INVESTMENT PORTFOLIO as at December 31, 2008imaxx Global Equity Value Fund
Shares/Par Value
Fair Value % of Fair Value
Average Cost % of Average Cost
CASH AND OTHER NET ASSETS $162,037 3.59% $162,037 3.06%
EQUITIES -- FOREIGNConsumer DiscretionaryComcast Corporation 6,100 125,123 157,337 Home Depot Inc. 1,570 44,074 60,424 Toyota Motor Corp. 1,260 99,892 121,437 Wolters Kluwer NV 3,800 88,511 115,055 Total 357,600 7.92% 454,253 8.58%
Consumer StaplesArcher Daniels Midland Co 1,260 44,299 44,963 Coca-Cola Femsa SAB-SP ADR 510 27,005 17,718 Foster's Group Ltd. 14,000 63,853 66,766 Hubbell Incorporated 1,200 47,824 63,911 Kimberly-Clark Corp. 800 51,004 57,697 Nestle SA 3,323 160,856 128,718 Tesco Inc. 4,300 83,115 95,320 Total 477,956 10.59% 475,093 8.97%
EnergyApache Corp. 325 29,539 24,759 Chevron Corporation 1,140 102,835 88,092 CNOOC Ltd. 480 55,633 46,884 Duke Energy Corporation 3,270 59,856 61,088 Exelon Corporation 940 63,747 62,322 Nabors Industries Ltd. 2,000 29,097 59,599 Petroleo Brasileiro S.A. 1,750 52,265 72,263 RWE Aktiengesellschaf 420 45,841 35,969 Sasol Ltd. 1,430 52,753 46,148 Statoil ASA 6,020 121,940 183,052 Tenaris SA 1,000 25,585 25,148 Total SA 1,520 102,043 117,654 Weatherford Intl. 1,670 22,036 60,202 Total 763,170 16.91% 883,180 16.67%
FinancialAFLAC Inc. 950 53,107 54,995 AllianceBernstein Holding LP 2,800 70,990 159,324 Moody's Corporation 1,700 41,650 83,961 Progressive Corporation 2,400 43,346 56,557 Total 209,093 4.63% 354,837 6.70%
Health CareAstraZeneca PLC 1,790 89,259 91,304 Cardinal Health Inc. 2,350 98,785 115,418 GlaxoSmithKline plc 3,405 152,850 204,062 Merck and Co. Inc. 2,500 92,682 103,709 Roche Holdings Inc. 750 69,621 64,747 Sanofi-Synthelabo SA 3,550 138,968 175,621 Wellpoint Inc. 3,000 154,133 147,936 Wyeth 1,940 88,742 76,850 Total 885,040 19.60% 979,647 18.49%
Industrial3M Company 540 37,892 46,409 Eaton Corporation 770 46,678 40,730 General Electric Co. 4,300 83,849 165,658

STATEMENT OF INVESTMENT PORTFOLIO as at December 31, 2008imaxx Global Equity Value Fund
Shares/Par Value
Fair Value % of Fair Value
Average Cost % of Average Cost
Johnson Controls Inc. 2,000 44,292 67,482 Siemens AG-Spons 1,000 92,255 98,173 TNT NV 2,600 60,719 79,177 Total 365,685 8.10% 497,629 9.40%
Information TechnologyCanon Inc. 2,230 85,011 94,921 Corning Incorporated 7,500 87,164 127,642 Intel Corporation 2,430 43,443 52,593 KLA-Tencor Corporation 2,000 53,146 42,116 Telecomunicacoes De S.P. 1,600 37,756 41,363 Total 306,520 6.79% 358,635 6.77%
MaterialsAir Products & Chemicals Inc 700 42,913 67,901 Du Pont (EI) de Nemours 2,700 83,304 126,674 Freeport - McMoran Copper 2,900 86,433 99,523 Precision Castparts Corp. 1,200 87,043 86,285 Unilever PLC 4,500 125,121 149,256 Yanzhou Coal Mining Co. 5,400 49,060 43,727 Total 473,874 10.50% 573,366 10.82%
Telecommunications ServicesEricsson (LM) TEL-SP 10,140 96,329 122,285 France Telecom SA 3,270 111,019 103,839 Nokia Corp. 4,900 93,099 127,729 Telefonica SA - SPON 1,420 116,699 112,269 Turkcell Iletisim Hizmet 2,710 47,788 41,296 Vodafone Group PLC - SP - 6 7 Total 464,940 10.30% 507,425 9.58%
UtilitiesE.ON AG 500 24,847 23,042 Enel SPA 3,080 23,363 33,788 Total 48,210 1.07% 56,830 1.07%
Total: EQUITIES -- FOREIGN $4,352,088 96.41% $5,140,895 97.05%
Total $4,514,125 $5,302,932Transaction Costs (Note 2) - (5,957) (0.11%)
Total Net Assets $4,514,125 100.00% $5,296,975 100.00%See accompanying notes to the financial statements.

A0406YTD
STATEMENTS OF NET ASSETS as at December 31
A0206YTD2008 2007
Assets Investments at fair value (Note 2) 4,352,088$ 6,148,599$ Cash 162,859 291,413 Dividends and interest receivable 4,562 13,800 Subscriptions receivable 4,337 - Receivable for securities sold - 286 Other receivables 4,250 825 Total assets 4,528,096$ 6,454,923$ Liabilities Bank overdraft - 16,711 Accrued expenses and other liabilities 13,845 6,049 Payable for units redeemed 126 - Payable for investment purchases - - Other payables - - Total liabilities 13,971 22,760 Net assets representing unitholders' equity 4,514,125$ 6,432,163$
Net assetsClass A 1,071,021$ 1,842,638$ Class F 20,835 27,052 Class I 3,422,269 3,574,115 Class I - seed - 988,358 Number of units outstanding (Note 4)Class A 173,848 219,797 Class F 3,264 3,134 Class I 486,493 382,040 Class I - seed - 105,289 Net assets per unit (Note 9)Class A 6.16$ 8.38$ Class F 6.38 8.63 Class I 7.03 9.36 Class I - seed - 9.39
See accompanying notes to the financial statements.
Approved by AEGON Fund Management Inc. on behalf of the Funds:
Approved by:
Doug Brooks Glenn DanielsPresident and CEO SVP, General Counsel and Corporate Secretary
imaxx Global Equity Value Fund

STATEMENTS OF OPERATIONS for the years ended December 31
A0206YTD2008 2007
Investment income Interest on bonds and debentures -$ -$ Dividends 216,334 178,144 Short-term interest - - Distribution from underlying funds - - Other income 61,600 - Less foreign withholding taxes (32,544) (21,891) Total investment income 245,390 156,253 Expenses Management and advisory fees (Note 5) 66,867 75,957 Administration and recordkeeping 24,990 28,777 Audit fees 5,179 5,431 Custodian fees 1,452 2,384 Goods and Services Tax 4,137 5,857 Other - 56,951 Total expenses 102,625 175,357 Expenses absorbed by manager (Note 5) (15,743) (14,548) Net expenses 86,882 160,809 Net invesment income (loss) 158,508$ (4,556)$ Realized and unrealized gain (loss) on investmentsRealized gain (loss) on sale of investments (1,491,383)$ 584,327$ Exchange gain (loss) on foreign currencies & other net assets 96,914 (254,120) Net realized gain (loss) on sale of investments (1,394,469) 330,207 Change in unrealized appreciation (depreciation) of investments (1,556,421) (524,867) Exchange gain (loss) on foreign currencies & other net assets 1,274,212 (659,276) Net unrealized gain (loss) on investments (282,209) (1,184,143) Transaction Cost (7,901) (10,158) Net gain (loss) on investments (1,684,579)$ (864,094)$
Increase (decrease) in net assets from operations (1,526,071)$ (868,650)$
Increase (decrease) in net assets from operations Class A (375,510)$ (306,644)$ Class F (6,217) (3,858) Class I (874,122) (437,716) Class I - seed (270,222) (120,432) Increase (decrease) in net assets from operations per daily average number of units Class A (1.96)$ (1.52)$ Class F (1.98) (1.27) Class I (2.04) (1.32) Class I - seed (2.57) (1.18)
See accompanying notes to the financial statements.
imaxx Global Equity Value Fund

STATEMENTS OF CHANGES IN NET ASSETS
For the year ended December 31, 2008
Increase (decrease) in net assets from operations $ (375,510) $ (6,217) $ (874,122) $ (270,222) $ (1,526,071)
Capital transactions (Note 4)Proceeds from units issued 336,881 - 1,234,164 - 1,571,045 Reinvested distributions 39,537 798 118,884 - 159,219 Amounts paid for units redeemed (729,847) - (511,888) (718,136) (1,959,871) Net capital transactions (353,429) 798 841,160 (718,136) (229,607)
Distributions to unitholders From net investment income (42,678) (798) (118,884) - (162,360) From capital gains - - - - - Return of capital - - - - - Net distributions to unitholders (42,678) (798) (118,884) - (162,360)
Total increase (decrease) in net assets (771,617) (6,217) (151,846) (988,358) (1,918,038)
Net assets, beginning of the year 1,842,638 27,052 3,574,115 988,358 6,432,163 Total net assets, end of the year $ 1,071,021 $ 20,835 $ 3,422,269 $ - $ 4,514,125
For the year ended December 31, 2007
Increase (decrease) in net assets from operations $ (306,644) $ (3,858) $ (437,716) $ (120,432) $ (868,650)
Capital transactions (Note 4)Proceeds from units issued 1,383,316 - 1,370,664 - 15,203,780 Reinvested distributions 61,597 921 112,254 31,007 205,779 Amounts paid for units redeemed (645,588) - (477,058) - (1,122,646) Net capital transactions 799,325 921 1,005,860 31,007 1,837,113
Distributions to unitholders From net investment income - - - - - From capital gains (64,707) (920) (112,253) (31,007) (208,887) Return of capital - - - - - Net distributions to unitholders (64,707) (920) (112,253) (31,007) (208,887)
Total increase (decrease) in net assets 427,974 (3,857) 455,891 (120,432) 759,576
Net assets, beginning of the year 1,414,664 30,909 3,118,224 1,108,790 5,672,587 Total net assets, end of the year $ 1,842,638 $ 27,052 $ 3,574,115 $ 988,358 $ 6,432,163
See accompanying notes to the financial statements.
imaxx Global Equity Value FundClass A Class F Class I Class I - Seed Total Fund

STATEMENT OF INVESTMENT PORTFOLIO as at December 31, 2008imaxx Global Equity Growth Fund
Shares/Par Value
Fair Value % of Fair Value
Average Cost % of Average Cost
CASH AND OTHER NET ASSETS $175,679 2.51% $175,679 2.25%
EQUITIES --CANADIANEnergySuncor Energy Inc. 5,200 123,344 146,459 Total 123,344 1.76% 146,459 1.87%
Total: EQUITIES -- CANADIAN $123,344 1.76% $146,459 1.87%
EQUITIES -- FOREIGNConsumer DiscretionaryFastenal Co. 3,400 143,835 134,768 Hennes & Mauritz AB 16,000 155,511 166,352 L'Oreal SA 4,500 96,310 86,838 Total 395,656 5.65% 387,958 4.97%
Consumer StaplesGroupe Danone 12,000 175,901 176,638 Heineken NV 7,800 146,011 171,587 Nestle SA 3,400 164,608 114,653 Sysco Corporation 5,200 145,472 198,913 Walgreen Co. 4,500 135,383 212,949 Total 767,375 10.96% 874,740 11.20%
EnergyAnadarko Petroleum Corporation 2,970 139,625 131,728 BG Group PLC 1,800 151,242 98,960 CNOOC Ltd. 1,400 162,262 90,326 EOG Resources Inc. 1,270 103,117 65,434 Schlumberger Ltd. 2,400 123,891 108,024 Total 680,137 9.72% 494,472 6.33%
FinancialDBS Group Holdings Limited 3,800 108,531 237,518 HSBC Holdings PLC 2,100 124,309 203,442 Mitsubishi Estate Co. Ltd. 800 158,047 118,182 Tokio Marine Holdings Inc. 4,700 166,562 165,309 Total 557,449 7.96% 724,451 9.27%
Health CareAbbott Laboratories 2,200 143,186 114,612 Alcon Inc. 1,280 139,144 224,005 C R Bard 1,350 138,719 115,875 Eisai Co. Ltd. 3,300 168,017 128,712 Essilor International 3,800 108,253 121,535 GlaxoSmithKline plc 3,400 152,625 220,544 Johnson&Johnson 2,300 167,562 167,243 Medtronic Inc. 4,100 157,098 251,345 Novartis AG 3,100 187,737 188,865 Total 1,362,341 19.46% 1,532,736 19.62%
Income Trust UnitsLend Lease Corporation Limited 14,800 87,536 190,233 Total 87,536 1.25% 190,233 2.43%
IndustrialDenso Corporation 1,400 113,945 180,973 Honda Motor Co. Ltd. 5,000 130,121 166,553

STATEMENT OF INVESTMENT PORTFOLIO as at December 31, 2008imaxx Global Equity Growth Fund
Shares/Par Value
Fair Value % of Fair Value
Average Cost % of Average Cost
SGC Soc Gen Sureveillance 7,800 97,975 112,758 Woodside Petroleum Ltd. 5,300 169,340 68,565 Total 511,381 7.31% 528,849 6.77%
Information TechnologyAutomatic Data Processing Inc. 3,400 162,535 153,494 Canon Inc. 4,000 152,486 170,831 Cisco Systems Inc. 6,900 136,989 165,004 Hoya Corporation 8,300 175,614 277,337 Intel Corporation 9,000 160,901 196,783 Microsoft Corp. 5,500 130,389 179,807 Oracle Corporation 7,000 151,096 168,440 SECOM Co. Ltd. 1,150 143,258 131,740 Total 1,213,268 17.33% 1,443,436 18.48%
MaterialsRio Tinto PLC 485 52,581 86,847 Total 52,581 0.75% 86,847 1.11%
Telecommunications ServicesAmerica Movil 4,400 165,803 226,841 China Mobile HK Limited 2,400 148,477 68,886 Ericsson (LM) TEL-SP 15,800 150,098 251,367 Hutchison Whampoa Ltd. 4,600 141,421 219,206 Telstra Corp. 9,300 154,809 185,944 Total 760,608 10.87% 952,244 12.19%
UtilitiesCLP Holdings Ltd. 19,300 160,518 126,492 Hong Kong&China Gas Co. Ltd. 82,000 151,998 160,309 Total 312,516 4.47% 286,801 3.67%
Total: EQUITIES -- FOREIGN $6,700,848 95.73% $7,502,767 96.04%
Total $6,999,871 $7,824,905Transaction Costs (Note 2) - (12,921) (0.16%)
Total Net Assets $6,999,871 100.00% $7,811,984 100.00%See accompanying notes to the financial statements.

A0406YTD
STATEMENTS OF NET ASSETS as at December 31
A0206YTD2008 2007
Assets Investments at fair value (Note 2) 6,824,192$ 10,830,563$ Cash 187,445 394,112 Dividends and interest receivable 12,231 10,868 Subscriptions receivable 5,051 1,035 Receivable for securities sold - - Other receivables 6,909 550 Total assets 7,035,828$ 11,237,128$ Liabilities Bank overdraft - - Accrued expenses and other liabilities 26,311 32,947 Payable for units redeemed 9,646 1,414 Payable for investment purchases - - Other payables - - Total liabilities 35,957 34,361 Net assets representing unitholders' equity 6,999,871$ 11,202,767$
Net assetsClass A 3,949,340$ 6,153,626$ Class F 142,590 201,289 Class I 2,907,941 3,055,568 Class I - seed - 1,792,284 Number of units outstanding (Note 4)Class A 445,004 566,180 Class F 13,218 15,299 Class I 302,708 263,583 Class I - seed - 150,316 Net assets per unit (Note 9)Class A 8.87$ 10.86$ Class F 10.79 13.15 Class I 9.61 11.59 Class I - seed - 11.93
See accompanying notes to the financial statements.
Approved by AEGON Fund Management Inc. on behalf of the Funds:
Approved by:
Doug Brooks Glenn DanielsPresident and CEO SVP, General Counsel and Corporate Secretary
imaxx Global Equity Growth Fund

STATEMENTS OF OPERATIONS for the years ended December 31
A0206YTD2008 2007
Investment income Interest on bonds and debentures -$ -$ Dividends 239,079 223,765 Short-term interest - - Distribution from underlying funds - - Other income - - Less foreign withholding taxes (17,404) (17,569) Total investment income 221,675 206,196 Expenses Management and advisory fees (Note 5) 154,193 184,820 Administration and recordkeeping 31,698 46,690 Audit fees 5,094 5,431 Custodian fees 18,688 16,522 Goods and Services Tax 9,553 14,400 Other 3,064 22,979 Total expenses 222,290 290,842 Expenses absorbed by manager (Note 5) (18,604) (12,874) Net expenses 203,686 277,968 Net invesment income (loss) 17,989$ (71,772)$ Realized and unrealized gain (loss) on investmentsRealized gain (loss) on sale of investments 166,636$ 477,771$ Exchange gain (loss) on foreign currencies & other net assets (251,919) (317,749) Net realized gain (loss) on sale of investments (85,283) 160,022 Change in unrealized appreciation (depreciation) of investments (4,021,118) 49,558 Exchange gain (loss) on foreign currencies & other net assets 2,109,837 (1,078,717) Net unrealized gain (loss) on investments (1,911,281) (1,029,159) Transaction Cost (8,760) (8,263) Net gain (loss) on investments (2,005,324)$ (877,400)$
Increase (decrease) in net assets from operations (1,987,335)$ (949,172)$
Increase (decrease) in net assets from operations Class A (997,015)$ (594,265)$ Class F (35,390) (23,607) Class I (577,316) (212,749) Class I - seed (377,614) (118,551) Increase (decrease) in net assets from operations per daily average number of units Class A (1.95)$ (0.10)$ Class F (2.37) (1.14) Class I (2.04) (0.09) Class I - seed (2.51) (0.79)
See accompanying notes to the financial statements.
imaxx Global Equity Growth Fund

STATEMENTS OF CHANGES IN NET ASSETS
For the year ended December 31, 2008
Increase (decrease) in net assets from operations $ (997,015) $ (35,390) $ (577,316) $ (377,614) $ (1,987,335)
Capital transactions (Note 4)Proceeds from units issued 1,067,268 22,409 1,058,497 - 2,148,174 Reinvested distributions - - - - - Amounts paid for units redeemed (2,274,539) (45,718) (628,808) (1,414,670) (4,363,735) Net capital transactions (1,207,271) (23,309) 429,689 (1,414,670) (2,215,561)
Distributions to unitholders From net investment income - - - - - From capital gains - - - - - Return of capital - - - - - Net distributions to unitholders - - - - -
Total increase (decrease) in net assets (2,204,286) (58,699) (147,627) (1,792,284) (4,202,896)
Net assets, beginning of the year 6,153,626 201,289 3,055,568 1,792,284 11,202,767 Total net assets, end of the year $ 3,949,340 $ 142,590 $ 2,907,941 $ - $ 6,999,871
For the year ended December 31, 2007
Increase (decrease) in net assets from operations $ (594,265) $ (23,607) $ (212,749) $ (118,551) $ (949,172)
Capital transactions (Note 4)Proceeds from units issued 2,207,794 63,601 992,082 - 3,263,477 Reinvested distributions - - - - - Amounts paid for units redeemed (2,605,680) (144,498) (633,912) - (3,384,090) Net capital transactions (397,886) (80,897) 358,170 - (120,613)
Distributions to unitholders From net investment income - - - - - From capital gains - - - - - Return of capital - - - - - Net distributions to unitholders - - - - -
Total increase (decrease) in net assets (992,151) (104,504) 145,421 (118,551) (1,069,785)
Net assets, beginning of the year 7,145,777 305,793 2,910,147 1,910,835 12,272,552 Total net assets, end of the year $ 6,153,626 $ 201,289 $ 3,055,568 $ 1,792,284 $ 11,202,767
See accompanying notes to the financial statements.
imaxx Global Equity Growth FundClass A Class F Class I Class I - Seed Total Fund
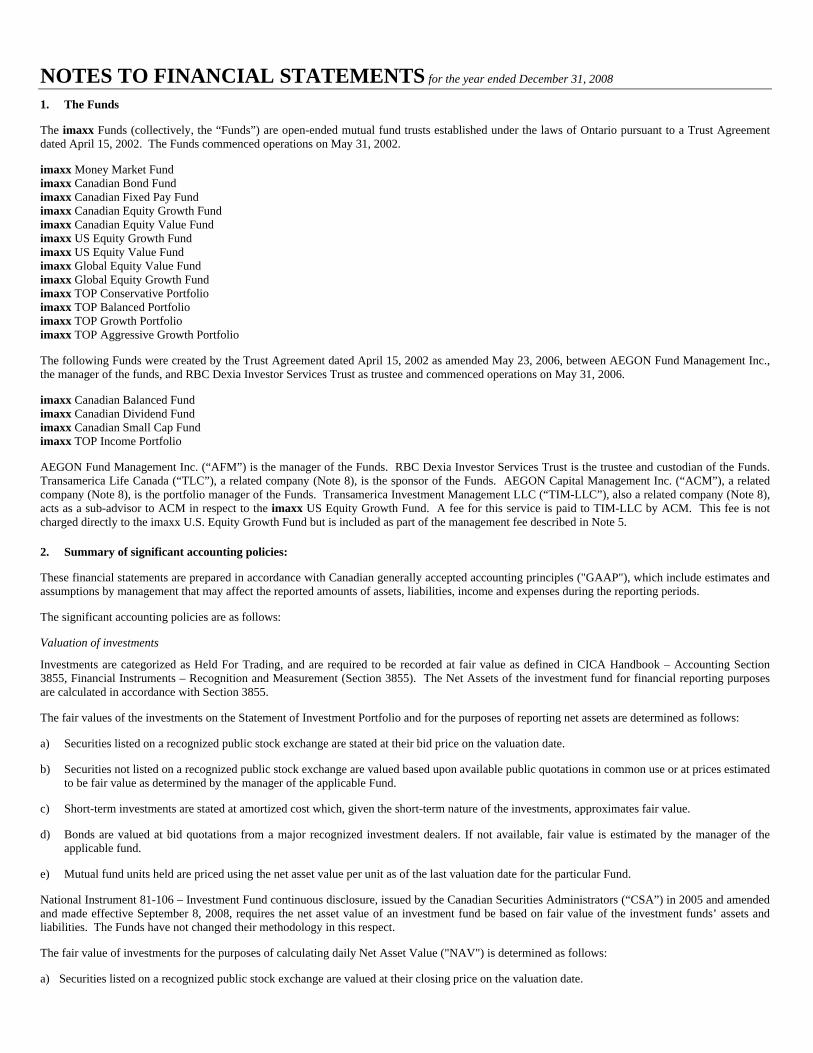
NOTES TO FINANCIAL STATEMENTS for the year ended December 31, 2008
1. The Funds
The imaxx Funds (collectively, the “Funds”) are open-ended mutual fund trusts established under the laws of Ontario pursuant to a Trust Agreement dated April 15, 2002. The Funds commenced operations on May 31, 2002.
imaxx Money Market Fund imaxx Canadian Bond Fund imaxx Canadian Fixed Pay Fund imaxx Canadian Equity Growth Fund imaxx Canadian Equity Value Fund imaxx US Equity Growth Fund imaxx US Equity Value Fund imaxx Global Equity Value Fund imaxx Global Equity Growth Fund imaxx TOP Conservative Portfolio imaxx TOP Balanced Portfolio imaxx TOP Growth Portfolio imaxx TOP Aggressive Growth Portfolio
The following Funds were created by the Trust Agreement dated April 15, 2002 as amended May 23, 2006, between AEGON Fund Management Inc., the manager of the funds, and RBC Dexia Investor Services Trust as trustee and commenced operations on May 31, 2006.
imaxx Canadian Balanced Fund imaxx Canadian Dividend Fund imaxx Canadian Small Cap Fund imaxx TOP Income Portfolio
AEGON Fund Management Inc. (“AFM”) is the manager of the Funds. RBC Dexia Investor Services Trust is the trustee and custodian of the Funds. Transamerica Life Canada (“TLC”), a related company (Note 8), is the sponsor of the Funds. AEGON Capital Management Inc. (“ACM”), a related company (Note 8), is the portfolio manager of the Funds. Transamerica Investment Management LLC (“TIM-LLC”), also a related company (Note 8), acts as a sub-advisor to ACM in respect to the imaxx US Equity Growth Fund. A fee for this service is paid to TIM-LLC by ACM. This fee is not charged directly to the imaxx U.S. Equity Growth Fund but is included as part of the management fee described in Note 5.
2. Summary of significant accounting policies:
These financial statements are prepared in accordance with Canadian generally accepted accounting principles ("GAAP"), which include estimates and assumptions by management that may affect the reported amounts of assets, liabilities, income and expenses during the reporting periods.
The significant accounting policies are as follows:
Valuation of investments
Investments are categorized as Held For Trading, and are required to be recorded at fair value as defined in CICA Handbook – Accounting Section 3855, Financial Instruments – Recognition and Measurement (Section 3855). The Net Assets of the investment fund for financial reporting purposes are calculated in accordance with Section 3855.
The fair values of the investments on the Statement of Investment Portfolio and for the purposes of reporting net assets are determined as follows:
a) Securities listed on a recognized public stock exchange are stated at their bid price on the valuation date.
b) Securities not listed on a recognized public stock exchange are valued based upon available public quotations in common use or at prices estimated to be fair value as determined by the manager of the applicable Fund.
c) Short-term investments are stated at amortized cost which, given the short-term nature of the investments, approximates fair value.
d) Bonds are valued at bid quotations from a major recognized investment dealers. If not available, fair value is estimated by the manager of the applicable fund.
e) Mutual fund units held are priced using the net asset value per unit as of the last valuation date for the particular Fund.
National Instrument 81-106 – Investment Fund continuous disclosure, issued by the Canadian Securities Administrators (“CSA”) in 2005 and amended and made effective September 8, 2008, requires the net asset value of an investment fund be based on fair value of the investment funds’ assets and liabilities. The Funds have not changed their methodology in this respect.
The fair value of investments for the purposes of calculating daily Net Asset Value ("NAV") is determined as follows:
a) Securities listed on a recognized public stock exchange are valued at their closing price on the valuation date.

b) Securities not listed on a recognized public stock exchange are valued based upon available public quotations in common use or at prices estimated
to be fair value as determined by the manager of the applicable Fund.
c) Short-term investments are stated at amortized cost which, given the short-term nature of the investments, approximates fair value.
d) Bonds are valued at closing price from major recognized investment dealers. If not available, fair value is estimated by the manager of the applicable fund.
e) Mutual fund units held are priced using the net asset value per unit as of the last valuation date for the particular Fund.
Investment transactions and income recognition
Investment transactions are recorded on the trade dates. Interest income is accrued daily and dividend income is recognized on the ex-dividend date. Distributions from underlying Funds are recorded on the distribution date. Realized gains and losses from investment transactions are calculated on an average cost basis. Unrealized gains and losses are determined using the difference between the market value and average cost. Stock dividends are recorded as income based on the market value of the security.
Brokerage commissions and other trading fees are included in the cost of investments purchased or are a reduction in the proceeds received on the sale of an investment. The transaction costs capitalized in the cost of investments have been re-classed on the Statement of Investment Portfolio to unrealized gain and loss on Investments.
Transaction costs
Transaction costs incurred in the purchase and sale of securities are recognized immediately in net income and as a result these costs are expensed and are reflected in the Statement of Operations.
Other assets and liabilities
Dividend and interest receivable, subscriptions receivable, receivable for securities sold and other receivables are categorized as loans and receivables and recorded at cost or amortized cost. Accrued expenses and other liabilities, payable for units redeemed, payable for investment purchases and other payables are categorized as other liabilities and recorded at cost or amortized cost. Other assets and liabilities are short-term in nature cost or amortized cost approximates fair value.
Translation of foreign currencies
The financial statements of all the Funds are expressed in Canadian dollars.
a) The market value of investments and other assets and liabilities denominated in foreign currencies are translated into Canadian dollars at the rates prevailing on each valuation date. Foreign currency gains and losses resulting from this translation are separately disclosed in the Statement of Operations.
b) Purchases and sales of investments, dividends and interest income denominated in foreign currencies are translated into Canadian dollars at the rates of exchange prevailing on the dates of the related transactions.
Unitholder transactions
For each unit sold, the Fund receives an amount equal to the net asset value per unit at the valuation date, which is included in unitholders’ equity. Units are redeemable at the option of unitholders at their net asset value per unit on the valuation date as determined in Note 7. For each unit redeemed, unitholders’ equity is reduced by the net asset value of the unit on the redemption date.
Increase (decrease) in net assets from operations per unit
Increase (decrease) in net assets from operations per daily average number of units in the Statement of Operations represents the increase (decrease) in net assets from operations, divided by the average daily number of units outstanding.
Unit valuation
A different net asset value is calculated on every valuation date for each class of units. A valuation date is each day that AFM is open for business and on which the Toronto Stock Exchange is open for trading. The net asset value of a particular class of units is computed by calculating the value of that class’ proportionate share of the assets and liabilities of the Fund attributable only to that class. Expenses directly attributable to a class are charged directly to that class. Other expenses, income and realized and unrealized capital gains and losses are allocated proportionately to each class based upon the relative net asset value of each class.
Adoption of New Accounting Standards
Effective January 1, 2008, the Funds adopted the Canadian Institute of Chartered Accountants (CICA) Handbook – Accounting Section 3862, “Financial Instruments – Disclosures” (Section 3862) and Section 3863, “Financial Instruments – Presentation” (Section 3863). These sections establish enhanced disclosure and presentation requirements for financial instruments. The standards include new requirements to quantify certain risk exposures and to provide sensitivity analysis for certain risks. For a description of risks and a presentation of sensitivity analysis, please refer to Note 10.

Effective January 1, 2008, the Funds adopted Section 1535, “Capital Disclosures” which establishes standards for disclosing information about an entity’s capital and how it is managed. Refer to Note 4 for the details.
Future Accounting Standards
The Canadian Accounting Standards Board in February 2008, confirmed January 1, 2011 as the date International Financial Reporting Standards ("IFRS") will replace current GAAP for publicly accountable enterprises which include investment funds. AFM will adopt IFRS standards for the publishing of 2011 interim and annual financial statements for the mutual funds. AFM is currently assessing the impact of the adoption of these new standards on the Funds’ financial statements.
3. Taxation:
The Funds qualify as mutual funds, as defined by the Income Tax Act (Canada), effective from their date of inception and at all times thereafter, and accordingly, are subject to taxes on their income, including net realized capital gains, for the period which is not paid or payable to unitholders as at the end of the tax period. The net income, including net realized capital gains is to be distributed in accordance with the terms of the trust agreement in a manner that optimizes the tax payable at both the unitholder and fund level. The Income Tax Act (Canada) does not permit net realized capital losses to be distributed to unitholders.
Management has elected December 15 as the tax period end for the Funds.
Capital losses may be carried forward indefinitely to reduce future realized capital gains. Non-capital losses may be carried forward to reduce future taxable income but are subject to expiry. As at December 15, 2008, the Funds had capital losses as follows:
Expiring in Fund Capital Losses Non-Capital
Losses 2009 2010 2011 2012 and thereafter
imaxx Canadian Dividend Fund 489,641 - imaxx Canadian Balanced Fund 448,394 - imaxx Canadian Equity Growth Fund 3,916,088 - imaxx Canadian Equity Value Fund 517,400 - imaxx Canadian Fixed Pay Fund 17,594,126 - imaxx Canadian Small Cap Fund 442,534 - imaxx Global Equity Value Fund 1,404,309 - imaxx Global Equity Growth Fund 184,162 15,356 - 3,526 - 11,830 imaxx US Equity Growth Fund 441,415 - imaxx US Equity Value Fund 2,276,333 - imaxx TOP Aggressive Growth Portfolio 202,077 - imaxx TOP Growth Portfolio 209,345 imaxx TOP Income Portfolio 121,976 - imaxx TOP Balanced Portfolio 82,923 -
4. Units issued and outstanding:
The capital of each fund is represented by the number of issued units. The units are issued with no par value. Each fund is authorized to issue an unlimited number of Class A, Class F, and Class I units, which do not have any nominal or par value. The fund has no restrictions or specific capital requirements on the subscriptions and redemptions of units. The units are entitled to participate in the distribution of the fund, if declared. If the unitholder redeems units, they are entitled to the proportionate share of net asst value, represented by the fund’s Net Asset Value Per Unit. The relevant movements are shown in the Statement of Changes in Net Assets. The funds’ capital is managed according to the investment objectives of the fund. To ensure the liquidity of the fund, fund activity may involve the disposal of investments.
Class A units are available to retail investors on an initial or deferred sales charge basis. Class F units are available for investors who are enrolled in a fee-for-service account or program and who are subject to a fee based on assets rather than a commission charged on transactions. Class I units are available to institutional clients and investors who have been approved by AFM and who have invested a negotiated minimum amount pursuant to a Class I account agreement. The Class I-seed units are held by TLC and it is the intention of TLC to redeem these units once the respective funds have achieved critical mass.
Class A, Class F, and Class I unitholders of each fund are entitled to participate in the distribution of net income, net capital gains and in the distributions on the liquidation of the fund as provided for in the Trust Agreement.
Unit transactions for the periods ended December 31 were as follows:
Fund Units outstanding, beginning of period
Units sold, including reinvested distributions
Units redeemed, including transfers to other classes
Units outstanding, end of period
2008 2007 2008 2007 2008 2007 2008 2007 imaxx Money Market Class A 226,008 223,469 825,752 292,205 (379,454) (289,666) 672,306 226,008 Fund Class F - - - - - - - - Class I 154,189 444,115 44,856 152,485 (21,368) (442,411) 177,677 154,189 Class I-seed - - - - - - - -

Fund Units outstanding, beginning of period
Units sold, including reinvested distributions
Units redeemed, including transfers to other classes
Units outstanding, end of period
2008 2007 2008 2007 2008 2007 2008 2007 imaxx Canadian Class A 253,486 23,780 74,386 280,278 (100,625) (50,572) 227,247 253,486 Balanced Fund Class F - - - - - - - - Class I - - - - - - - - Class I-seed 206,192 203,432 4,982 2,760 - - 211,174 206,192 imaxx Canadian Bond Class A 319,008 191,662 352,584 195,819 (207,913) (68,473) 463,679 319,008 Fund Class F - - - - - - - - Class I 723,733 601,975 224,235 256,371 (131,867) (134,613) 816,101 723,733 Class I-seed - - - - - - - - imaxx Canadian Class A 106,530 32,841 79,142 102,859 (28,465) (29,170) 157,207 106,530 Dividend Fund Class F - - - - - - - - Class I 85,804 4,321 143,384 87,617 (31,776) (6,134) 197,412 85,804 Class I-seed 105,549 102,134 3,877 3,415 - - 109,426 105,549 imaxx Canadian Fixed Class A 8,106,907 9,301,086 2,460,054 2,142,408 (2,936,146) (3,336,587) 7,630,815 8,106,907 Pay Fund Class F 2,924 2,924 8,527 250 (626) (250) 10,825 2,924 Class I 11,686,598 13,831,424 1,616,877 1,364,509 (2,019,399) (3,509,335) 11,284,076 11,686,598 Class I-seed - - - - - - - - imaxx Canadian Equity Class A 534,892 285,458 288,534 355,188 (250,199) (105,754) 573,227 534,892 Growth Fund Class F 8,146 - 23,872 9,146 (23,124) (1,000) 8,894 8,146 Class I 555,279 406,784 239,900 208,336 (72,690) (59,841) 722,489 555,279 Class I-seed - - - - - - - - imaxx Canadian Equity Class A 1,064,260 1,104,940 174,233 287,483 (473,469) (328,163) 765,024 1,064,260 Value Fund Class F 9,895 13,430 533 968 (2,658) (4,503) 7,770 9,895 Class I 2,386,208 1,996,469 250,049 606,495 (518,308) (216,756) 2,117,949 2,386,208 Class I-seed - - - - - - - - imaxx Canadian Small Class A 73,792 15,061 10,524 117,850 (40,132) (59,119) 44,184 73,792 Cap Fund Class F - - - - - - - - Class I - - - - - - - - Class I-seed 54,882 53,259 454 1,623 - - 55,336 54,882 imaxx US Equity Class A 30,169 29,563 26,655 10,332 (11,782) (9,726) 45,042 30,169 Growth Fund Class F - - - - - - - - Class I 199,545 174,345 57,773 50,971 (13,789) (25,771) 243,529 199,545 Class I-seed 100,675 100,675 1,237 - - - 101,912 100,675 imaxx US Equity Class A 57,358 42,490 30,473 32,625 (28,495) (17,757) 59,336 57,358 Value Fund Class F - - - - - - - - Class I 539,455 412,209 199,500 187,854 (146,279) (60,608) 592,676 539,455 Class I-seed 157,768 157,768 - - (157,768) - - 157,768 imaxx Global Equity Class A 219,797 141,872 67,126 159,345 (113,075) (81,420) 173,848 219,797 Value Fund Class F 3,134 3,028 130 106 - - 3,264 3,134 Class I 382,040 286,315 163,841 140,346 (59,388) (44,621) 486,493 382,040 Class I-seed 105,289 102,005 - 3,284 (105,289) - - 105,289 imaxx Global Equity Class A 566,180 602,943 103,378 195,592 (224,554) (232,355) 445,004 566,180 Growth Fund Class F 15,299 21,401 2,127 4,433 (4,208) (10,535) 13,218 15,299 Class I 263,583 233,687 96,018 82,280 (56,893) (52,384) 302,708 263,583 Class I-seed 150,316 150,316 - - (150,316) - - 150,316 imaxx TOP Class A 268,171 266,148 124,688 72,491 (122,964) (70,468) 269,895 268,171 Conservative Portfolio Class F - - - - - - - - Class I 801,774 623,163 179,595 289,177 (207,211) (110,566) 774,158 801,774 Class I-seed - - - - - - - - imaxx TOP Balanced Class A 1,210,803 1,031,175 210,295 428,815 (299,482) (249,187) 1,121,616 1,210,803 Portfolio Class F - - - - - - - - Class I 6,656,157 4,966,362 1,584,611 1,849,838 (789,673) (160,043) 7,451,095 6,656,157 Class I-seed - - - - - - - - imaxx TOP Income Class A 408,526 243,418 191,720 369,090 (260,752) (203,982) 339,494 408,526 Portfolio Class F - - - - - - - - Class I - - - - - - - - Class I-seed 27,465 25,889 2,313 1,576 (29,778) - - 27,465 imaxx TOP Growth Class A 1,392,258 1,244,232 236,910 471,240 (328,618) (323,214) 1,300,550 1,392,258 Portfolio Class F - - - - - - - - Class I 4,738,171 3,309,630 1,374,240 1,479,174 (413,416) (50,633) 5,698,995 4,738,171 Class I-seed - - - - - - - - imaxx TOP Aggressive Class A 304,511 268,585 72,577 112,018 (80,092) (76,092) 296,996 304,511 Growth Portfolio Class F - - - - - - - -

Fund Units outstanding, beginning of period
Units sold, including reinvested distributions
Units redeemed, including transfers to other classes
Units outstanding, end of period
2008 2007 2008 2007 2008 2007 2008 2007 imaxx TOP Aggressive Class I 2,253,109 1,609,933 734,383 703,906 (234,359) (60,730) 2,753,133 2,253,109 Growth Portfolio Class I-seed - - - - - - - -
As at December 31, 2008, TLC, or related parties of TLC, held 100% of all issued Class I and Class I-seed units, which have not been offered to the public.
5. Investment management fees:
Pursuant to a management agreement between AFM and ACM, ACM is responsible for the day-to-day investment management of the Funds. ACM either serves as the investment manager itself or hires an external investment sub-advisor to manage the investment portfolio of each of the Funds. Under this management agreement, AFM, on behalf of the Funds, pays ACM management and advisory fees, which are calculated daily and payable monthly, based on the net asset value of the respective Funds.
Class I units are held by related parties and are subject to management fee and expense charges.
The annual investment management and advisory fees applicable to the respective class of each Fund are as follows:
Fund Class A units Class F units imaxx Money Market Fund 1.00% 0.75% imaxx Canadian Balanced Fund 1.75% 0.95% imaxx Canadian Bond Fund 1.40% 0.85% imaxx Canadian Dividend Fund 2.00% 1.00% imaxx Canadian Fixed Pay Fund 1.95% 1.00% imaxx Canadian Equity Growth Fund 2.00% 1.00% imaxx Canadian Equity Value Fund 2.00% 1.00% imaxx Canadian Small Cap Fund 2.35% 1.35% imaxx US Equity Growth Fund 2.00% 1.00% imaxx US Equity Value Fund 2.00% 1.00% imaxx Global Equity Value Fund 2.10% 1.10% imaxx Global Equity Growth Fund 2.10% 1.10% imaxx TOP Conservative Portfolio 2.65% N/A imaxx TOP Balanced Portfolio 2.70% N/A imaxx TOP Income Portfolio 2.50% N/A imaxx TOP Growth Portfolio 2.75% N/A imaxx TOP Aggressive Growth Portfolio 2.85% N/A
As at December 31, 2008, TLC, or related parties, held all issued Class I units. It is management’s intention to sell Class I units to institutional investors.
AFM, at its discretion, waived a portion of the management and operating expenses as disclosed in the Statement of Operations. These waivers may be terminated at any time by AFM or, at AFM’s discretion, may be continued indefinitely.
6. Brokerage commissions on securities transactions:
Brokerage commissions paid for securities transactions for the period ended December 31 were as follows:
Fund Broker
Commissions 2008
Broker Commissions
2007
Soft Dollars 2008
Soft Dollars 2007*
imaxx Canadian Fixed Pay Fund $ 206,828 $ 545,036 $ 4,089 imaxx Canadian Equity Growth Fund 104,497 134,505 310 imaxx Canadian Equity Value Fund 68,386 41,947 - imaxx US Equity Growth Fund 2,457 2,289 - imaxx US Equity Value Fund 11,214 4,106 - imaxx Global Equity Value Fund 7,901 10,158 - imaxx Global Equity Growth Fund 8,760 8,263 - imaxx Canadian Balanced Fund 10,664 10,720 120 imaxx Canadian Dividend Fund 7,321 5,133 - imaxx Canadian Small Cap Fund 13,981 22,993 5
*The total soft dollar commission amount for 2007 was $33,593.
7. Redemption of units:
Unitholders may, on any valuation date, redeem all or any part of their units at the then current net asset value per unit as follows:

a) Complete a redemption order along with all necessary supporting documentation (“redemption application”) and send the redemption application
to their dealer or broker who will forward it to AFM.
b) Place a wire order through a dealer or broker (“redemption request”). The same documents as described above must be provided in order to complete the redemption process.
Certain documents, including all certificates representing units of the Funds redeemed, are required to have signatures guaranteed by a Canadian chartered bank or trust company or by a member of a recognized stock exchange or any other guarantor acceptable to AFM.
The net asset value per unit is calculated on the same day if the redemption request or redemption application is received at or prior to 4:00 p.m. (Toronto time). Payment for units redeemed will be made by the Funds within five business days from the date the redemption order is processed.
8. Related parties:
AFM, AEGON Canada Inc., TLC, and ACM are affiliates. AFM, and ACM are each 100% owned by AEGON Canada Inc. and TLC is 73% owned by Aegon Canada Inc. and 27% owned by AEGON N.V. (Refer to Notes)
AEGON Canada Inc. is a wholly owned subsidiary of AEGON N.V. based in the Netherlands.
TIM-LLC is a wholly owned subsidiary of Transamerica Corporation, which is in turn a wholly owned subsidiary of AEGON N.V.
The following tables show the summary of fees paid to related parties up to December 31, 2008, and the balances outstanding as at December 31, 2008, by Fund.
ACM Management Fees Fund Management Fees Balances Outstanding
2008 2007 2008 2007 imaxx Money Market Fund 2,623 2,926 360 146 imaxx Canadian Bond Fund 25,295 19,952 2,395 1,858 imaxx Canadian Balanced Fund 9,420 8,665 676 859 imaxx Canadian Fixed Pay Fund 539,434 631,529 33,877 50,549 imaxx Canadian Dividend Fund 7,648 4,822 579 552 imaxx Canadian Equity Growth Fund 66,440 53,543 4,003 5,507 imaxx Canadian Small Cap Fund 3,222 4,543 149 377 imaxx TOP Conservative Portfolio 3.755 3,843 282 334 imaxx TOP Balanced Portfolio 27,504 26,549 2,158 2,425 imaxx TOP Growth Portfolio 20,805 20,342 1,577 1,855 imaxx TOP Income Portfolio 1,848 1,934 110 180 imaxx TOP Aggressive Growth Portfolio 9,666 9,679 690 878 Total 713,909 816,245 46,856 65,520 TIM-LLC Management Fees
Fund Management Fees Balances Outstanding 2008 2007 2008 2007
imaxx US Equity Growth Fund 1,774 1,882 138 166 Total 1,774 1,882 138 166 Foyston, Gordon and Payne Inc. Management Fees
Fund Management Fees Balances Outstanding 2008 2007 2008 2007
imaxx Canadian Equity Value Fund 7,975 9,950 476 830 imaxx Global Equity Value Fund 2,916 3,275 196 278 imaxx US Equity Value Fund 2,699 3,341 159 273 Total 13,590 16,566 831 1,381 Walter Scott and Partners Ltd., Management Fees
Fund Management Fees Balances Outstanding imaxx Global Equity Growth Fund 2,016 60,619 123 14,435 Total 2,016 60,619 123 14,435

9. Net Assets Per Unit and Net Asset Value Per Unit:
The difference between the Net Assets Per Unit and Net Asset Value Per Unit of each fund is related to the impact of applying Section 3855 (See Note 2). The following is a comparison of Net Assets Per Unit and Net Asset Value Per Unit:
Net Assets Per Unit
Net Asset Value Per Unit
Net Assets Per Unit
Net Asset Value Per Unit
Fund
2008 2008 2007 2007 $ $ $ $ imaxx Money Market Fund Class A 10.00 10.00 10.00 10.00 Class F - - - - Class I 10.00 10.00 10.00 10.00 Class I-seed - - - - imaxx Canadian Bond Fund Class A 9.97 9.98 10.09 10.10 Class F - - - - Class I 10.71 10.73 10.68 10.69 Class I-seed - - - - imaxx Canadian Balanced Class A 8.62 8.63 10.73 10.86 Fund Class F - - - - Class I - - - - Class I-seed 9.06 9.08 11.05 11.19 imaxx Canadian Fixed Pay Class A 7.79 7.83 11.61 11.66 Fund Class F 7.53 7.57 11.17 11.22 Class I 8.59 8.64 12.47 12.53 Class I-seed - - - - imaxx Canadian Dividend Class A 7.52 7.54 10.74 11.02 Fund Class F - - - - Class I 7.81 7.83 10.99 11.27 Class I-seed 7.95 7.97 11.09 11.37 imaxx Canadian Equity Class A 12.34 12.38 20.62 20.87 Growth Fund Class F 4.77 4.78 8.25 8.35 Class I 11.91 11.94 19.55 19.79 Class I-seed - - - - imaxx Canadian Equity Value Class A 9.10 9.12 13.24 13.62 Fund Class F 9.91 9.93 14.33 14.74 Class I 9.78 9.80 14.00 14.40 Class I-seed - - - - imaxx Canadian Small Cap Class A 5.88 5.94 11.32 11.42 Fund Class F - - - - Class I - - - - Class I-seed 6.25 6.32 11.72 11.82 imaxx US Equity Growth Fund Class A 7.89 7.90 11.87 11.87 Class F - - - - Class I 7.98 7.99 11.78 11.78 Class I-seed 8.21 8.22 12.04 12.04 imaxx US Equity Value Fund Class A 5.52 5.52 8.30 8.30 Class F - - - - Class I 5.58 5.59 8.26 8.26 Class I-seed - - 8.42 8.42 imaxx Global Equity Value Class A 6.16 6.18 8.38 8.39 Fund Class F 6.38 6.41 8.63 8.64 Class I 7.03 7.06 9.36 9.37 Class I-seed - - 9.39 9.40 imaxx Global Equity Growth Class A 8.87 8.89 10.86 10.96 Fund Class F 10.79 10.81 13.15 13.27 Class I 9.61 9.62 11.59 11.69 Class I-seed - - 11.93 12.03 imaxx TOP Conservative Class A 9.67 9.67 11.66 11.66 Portfolio Class F - - - - Class I 10.44 10.44 12.36 12.36 Class I-seed - - - - imaxx TOP Balanced Class A 9.13 9.13 11.74 11.74 Portfolio Class F - - - - Class I 9.69 9.69 12.27 12.27 Class I-seed - - - -

Net Assets Per Unit
Net Asset Value Per Unit
Net Assets Per Unit
Net Asset Value Per Unit
Fund
2008 2008 2007 2007
imaxx TOP Income Class A 7.09 7.09 9.62 9.62 Portfolio Class F - - - - Class I - - - - Class I-seed - - 9.90 9.90 imaxx TOP Growth Class A 7.95 7.95 11.09 11.09 Portfolio Class F - - - - Class I 8.87 8.87 12.14 12.14 Class I-seed - - - - imaxx TOP Aggressive Class A 7.93 7.93 12.35 12.35 Growth Portfolio Class F - - - - Class I 8.95 8.95 13.66 13.66 Class I-seed - - - -
10. Financial Risk Management:
Each Fund’s investment activities expose it to a variety of financial risks: market risk (including, interest rate risk, currency risk and other price risks), credit risk and liquidity risk. The Funds’ overall risk management program focuses on the unpredictability of financial markets. The value of the investments may change due to one or more of the following investment risks common to all mutual funds:
Other price risk
Mutual funds that invest in equity securities (also called stocks or shares) are affected by changes in the market value of those securities. The market value, or price, of a stock is affected by developments at the company and by general economic and financial conditions in that company’s industry and in the countries in which the company operates or is listed for trading on stock exchanges. General investor sentiment, as well as specific circumstances and events, may cause the value of a stock to decline.
The portfolio manager manages this risk by a careful selection of securities and other financial instruments within specified limits. The maximum risk resulting from investments in financial instruments is the fair value of the securities and other financial instruments acquired by the Funds. The Funds’ overall market positions are monitored daily by the Funds’ portfolio manager or sub-advisor if applicable.
As at December 31, 2008, had the benchmark of each fund of the following Funds increased or decreased by 3 percent, with all other variables held constant, the net assets of those Funds would have increased or decreased by approximately:
Fund Equity Exposure ($ 000’s)
Benchmark Impact on NAV ($ 000’s)
Impact on NAV (%)
imaxx Canadian Balanced Fund 2,210 40% Universe Bond Total Return Index 60% S&P/TSX Total Return
65 1.7
imaxx Canadian Fixed Pay Fund 119,344 20% DEX Universal Bond Total Return 80% S&P/TSX Total Return
3,294 2.1
imaxx Canadian Dividend Fund 3,244 S&P/TSX 60 Total Return Index 89 2.5 imaxx Canadian Small Cap Fund 571 BMO Nesbitt Burns Cdn Small Cap Index 17 2.7 imaxx Canadian Equity Growth Fund 15,077 S&P/TSX Total Return Index 520 3.3 imaxx Canadian Equity Value Fund 26,991 S&P/TSX Total Return Index 704 2.5 imaxx US Equity Growth Fund 2,970 S&P 500 Composite Total Return ($ Cdn) 105 3.3 imaxx US Equity Value Fund 3,444 S&P 500 Composite Total Return ($ Cdn) 116 3.2 imaxx Global Equity Growth Fund 6,824 MSCI World ($ Cdn) 192 2.7 imaxx Global Equity Value Fund 4,352 MSCI World ($ Cdn) 124 2.7
Certain Funds that invest in underlying mutual funds are exposed to indirect other price risk in the event that the underlying mutual funds invest in equity securities.
Fund Equity Exposure ($ 000’s)
Benchmark Impact on NAV ($ 000’s)
Impact on NAV (%)
imaxx TOP Conservative Portfolio 10,597 10% Lehman Brothers Govt/Corp; 25% MSCI World ($ Cdn); 40% DEX Universe Bond Total Return Index; 15% S&P/TSX Total Return; 10% DEX Short Term Bond Total Return
359 3.4
imaxx TOP Balanced Portfolio 82,164 6% Lehman Brothers Govt/Corp; 43% MSCI World ($ Cdn); 26% DEX Universe Bond Total Return Index; 17% S&P/TSX Total Return; 8% DEX Short Term Bond Total Return
2,711 3.3

Fund Equity
Exposure ($ 000’s)
Benchmark Impact on NAV ($ 000’s)
Impact on NAV (%)
imaxx TOP Growth Portfolio 60,815 53% MSCI World ($ Cdn); 20% DEX Universe Bond Total Return Index; 22% S&P/TSX Total Return; 5% DEX Short Term Bond Total Return
1,970 3.2
imaxx TOP Aggressive Growth Portfolio
26,918 75% MSCI World ($ Cdn); 25% S&P/TSX Total Return
913 3.4
imaxx TOP Income Portfolio 2,401 40% DEX Universe Bond Total Return Index; 60% S&P/TSX Composite Index
64 2.7
Interest rate risk
Mutual funds that invest in fixed income securities such as bonds and money market instruments are sensitive to changes in interest rates. An increase in prevailing interest rates will generally cause the value of fixed income securities to decline; while a decrease in such rates will generally cause the value of such securities to increase. Accordingly, the portion of a fund that is invested in fixed income securities will reflect this inverse relationship between interest rates and the price of securities. In addition, the longer the time to maturity of a particular debt instrument, the greater price volatility a fund will have.
The portfolio managers review each Fund’s overall interest rate sensitivity as part of the ongoing investment management process.
As December 31, 2008 had market interest rates increased or decreased by 1 percent, with all other variables held constant, the net assets of the following Funds would have increased or decreased by approximately:
Fund Less than 1 year 1 – 5 years 5 – 10 years Greater than 10 years
Impact to Net Assets with 1%
change in Interest Rates
imaxx Money Market Fund 8,505,647 - - - $ 21,264 imaxx Canadian Bond Fund 423,947 3,620,749 7,203,951 2,106,960 $ 828,581 imaxx Canadian Balanced Fund 119,710 614,448 687,578 230,600 $ 102,510 imaxx Canadian Fixed Pay Fund 2,521,883 11,647,178 18,005,296 3,324,147 $ 1,618,845 imaxx Canadian Dividend Fund 309,422 6,800 19,200 - $ 618 imaxx Canadian Equity Growth Fund 438,827 - - - $ 1,097 imaxx Canadian Equity Value Fund 649,166 - - - $ 1,622
Certain Funds that invest in underlying mutual funds are exposed to indirect interest rate risk in the event that the underlying mutual funds invest in fixed income securities.
Foreign currency risk
A fund that invests in foreign currency or buys investments denominated in currencies other than their functional currency, which is generally the Canadian dollar, is subject to foreign currency risk. The value of these foreign currency holdings may be affected by changes in the value of the Canadian dollar compared to the value of these foreign currencies. For example, if the US dollar rises relative to the Canadian dollar, the value of US securities held in a fund will be worth more Canadian dollars. The inverse is also true – if the US dollar falls, a fund’s US holdings will be worth less in Canadian dollars.
As at December 31, 2008 had exchange rates increased or decreased by 3 percent, with all other variables held constant, the net assets of the following Funds would have increased or decreased by approximately:
Fund Foreign Currency Exposure ($ 000’s)
Impact on NAV ($ 000’s)
Impact on NAV (%)
imaxx Canadian Balanced Fund 25 1 .02 imaxx Canadian Fixed Pay Fund 364 11 .01 imaxx Canadian Dividend Fund 55 2 .05 imaxx Canadian Equity Growth Fund
597 18 .11
imaxx Canadian Equity Value Fund
3,614 108 .39
imaxx US Equity Growth Fund 2,970 89 2.84 imaxx US Equity Value Fund 3,444 103 2.84 imaxx Global Equity Growth Fund
6,701 201 2.87
imaxx Global Equity Value Fund 4,352 131 2.88
Certain Funds that invest in underlying mutual funds are exposed to indirect foreign currency risk in the event that the underlying mutual funds own investments denominated in currencies other than their functional currency.

Credit risk
A fixed income security issued by a company or a government contains a promise by the issuer to pay interest and repay a specified amount on the maturity date. Credit risk involves the risk that such a company will not live up to its obligations. If the credit quality of the issuer begins to deteriorate, it will lower the market value of the security, and vice-versa. The risk is lowest among companies that have received good credit ratings from recognized credit rating agencies. The risk is greater among companies that have a low credit rating or none at all. Higher interest rates are usually offered to compensate for the increased level of risk.
As at December 31, 2008, the following table outlines the amount and percentage of fixed income securities held by various credit ratings for each Fund:
Fund AAA % AA % A % BBB % Unrated % imaxx Money Market Fund imaxx Canadian Bond Fund
7,997 5,012
94 38
364 1150
4 9
145 4,042
2 31
- 3,001
- 22
- -
- -
imaxx Canadian Balanced Fund 1,270 83 19 1 108 7 136 9 - - imaxx Canadian Fixed Pay Fund 10,907 31 1,514 4 9,667 27 7,454 21 5,955 17 imaxx Canadian Dividend Fund - - - - - - - - 26 100
Certain Funds that invest in underlying mutual funds are exposed to indirect credit risk in the event that the underlying mutual funds invest in debt securities and trading derivatives.
Liquidity risk
Liquidity risk is the risk that a fund may not be able to settle or meet its obligations on time or at a reasonable price.
Each Fund is exposed to daily cash redemptions of redeemable units. Units are redeemable on demand at the then current NAV per series unit at the option of the unitholder. Liquidity risk is the possibility that a Fund will not be able to convert its investments to cash when it needs to.
As required by applicable securities legislation, each fund maintains at least 90% of its assets in liquid investments (i.e. investments that are traded in active markets and can be readily disposed of). In addition, each Fund retains sufficient cash and cash equivalents to maintain liquidity.
Certain Funds that invest in underlying mutual funds are exposed to indirect liquidity risk in the event that the underlying mutual funds invest in securities that can not be converted to cash when it needs to.
A more comprehensive listing of risks is published in the imaxx Funds Simplified Prospectus.
11. Fund Valuation Adjustment
Subsequent to year end, one security was found to be inaccurately valued in the imaxx Canadian Fixed Pay Fund and the imaxx Canadian Dividend Fund. The financial statements of the two funds reflect the Net Asset Value as it should have been calculated for December 31, 2008. Adjustments will be made in accordance with the Manager’s NAV error policy.
12. Comparative Figures:
Certain figures from the prior year have been re-classified to conform with the current year presentation.

SCHEDULE A (UNAUDITED) The imaxx TOP Portfolio (“Funds") Each imaxx TOP Portfolio is a mutual fund that invests in multiple third party underlying mutual funds. The following outlines key information about the Funds' third party underlying investment holdings and is intended to help you understand the Funds’ third party investment portfolio. This information is derived from information provided by AEGON Fund Management's Third Party mutual fund providers and is unaudited. For each imaxx TOP Portfolio listed below, the top 5 holdings of each underlying fund is outlined. All investments are as of December 31, 2008. Funds are listed in the following order of appearance: imaxx TOP Portfolios imaxx TOP Conservative Portfolio imaxx TOP Balanced Portfolio imaxx TOP Growth Portfolio imaxx TOP Income Portfolio imaxx TOP Aggressive Growth Portfolio

imaxx TOP CONSERVATIVE PORTFOLIO (UNAUDITED)
Underlying Fund
% of Total Market Value of Security
in Underlying Fund
Underlying Fund
% of Total Market Value of Security
in Underlying Fund
TD Short-Term Bond Trimark Canadian Bond Canada Housing Trust No. 1 4.55% due 15 Dec 12 10.70% Govt of Canada, 5.75%, due 01 Jun 29 20.75%Canada Housing Trust No. 1 4.00% due 15 Jun 12 6.60% Govt of Canada, 4.00%, due 01 Jun 17 4.88%BC IMC Realty Corporation 5.25% due 19 Sep 12 3.00% Province of Ont, 6.50%, due 08 Mar 29 3.68%Canada Housing Trust No. 1 2.70% due 15 Dec 13 2.90% Canada Housing Trust, 4.80%, due 15 Jun 12 3.15%Toyota Credit Canada Inc. 5.05% due 27 Jul 12 2.90% KfW Bankengruppe, 4.38%, due 09 Feb 16 3.00%
Fidelity Canadian Bond TD Canadian Bond Canada, Government Of 22.10% Province of Ont Residual 5.25% due 02 Jun 27 3.50%Canada Housing Trust No 1 13.20% Government of Canada 5.75% due 01 Jun 29 3.40%Ontario Province Cda 2.60% Gov’t of Canada Residual 3.94% due 01 Jun 25 2.80%Royal Bank Of Canada 2.60% Government of Canada 5.75% due 01 Jun 33 2.20%Bank Of Nova Scotia 2.20% The TD Bank 4.779% due 14 Dec 16 2.10%
AGF Global Government Bond CI Signature High Income Inter-American Dev Bank 7.250% 24 May 12 4.90% Cominar REIT 1.70%European Investment Bank 6.000% 15 Jul 09 4.70% Inter Pipeline Fund LP 1.60%Royal Bank of Canada 4.724% 23 Mar 12 3.70% Canadian Apartment Properties REIT 1.50%New South Wales Treasury Corp 7.000% 01 Dec 10 2.40% Gerdau Ameristeel Corp., 10.375% 07/15/11 1.50%Vedanta Resources 6.625% 22 Feb 10 2.20% Vermilion Energy Trust 1.40%
Fidelity True North® Mackenzie Cundill Canadian Security Goldcorp Inc 5.30% West Fraser Timber Co Ltd 7.68%Encana Corp 5.10% Pfizer Inc 7.22%Toronto-Dominion Bank 4.80% Canfor Corp 7.01%Potash Corp Of Saskatchewan 4.70% Celestica Inc 6.84%Royal Bank Of Canada 4.10% Onex Corp 5.42%
CI Value Trust Corporate Class CI American Managers Corporate Class UnitedHealth Group Inc. 6.80% Comcast Corp. 3.40%Aetna Inc. 6.20% Oracle Corp. 3.00%AES Corp. 6.00% Everest Re Group Ltd. 2.50%Amazon.com Inc. 3.90% Microsoft Corp. 2.50%eBay Inc. 3.80% Cisco Systems Inc. 1.90%
AGF International Stock Class Fidelity NorthStar® Sanofi-Aventis SA 8.30% Wellpoint Inc 3.50%RSA Insurance Group PLC 7.30% Johnson & Johnson 2.80%GlaxoSmithKline PLC 7.10% Conocophillips 2.20%AXA SA 6.20% Usana Health Sciences Inc 1.90%France Telecom SA 5.70% L 3 Communications Hldgs Inc 1.80%
Mackenzie Cundill Value Seven & I Holdings Co Ltd 6.24% Muenchener Rueckversicherungs 5.86% DIRECTV Group Inc/The 5.38% Fairfax Financial Holdings Ltd 5.22% Sega Sammy Holdings Inc 4.21%

imaxx TOP BALANCED PORTFOLIO (UNAUDITED)
Underlying Fund
% of Total Market Value of Security
in Underlying Fund
Underlying Fund
% of Total Market Value of Security
in Underlying Fund
Trimark Canadian Bond Fidelity Canadian Bond Govt of Canada, 5.75%, due 01 Jun 29 20.75% Canada, Government Of 22.10%Govt of Canada, 4.00%, due 01 Jun 17 4.88% Canada Housing Trust No 1 13.20%Province of Ont, 6.50%, due 08 Mar 29 3.68% Ontario Province Cda 2.60%Canada Housing Trust, 4.80%, due 15 Jun 12 3.15% Royal Bank Of Canada 2.60%KfW Bankengruppe, 4.38%, due 09 Feb 16 3.00% Bank Of Nova Scotia 2.20%
TD Canadian Bond AGF Global Government Province of Ont Residual 5.25% due 02 Jun 27 3.50% Inter-American Dev Bank 7.250% 24 May 12 4.90%Government of Canada 5.75% due 01 Jun 29 3.40% European Investment Bank 6.000% 15 Jul 09 4.70%Gov’t of Canada Residual 3.94% due 01 Jun 25 2.80% Royal Bank of Canada 4.724% 23 Mar 12 3.70%Government of Canada 5.75% due 01 Jun 33 2.20% New South Wales Treasury Corp 7.000% 01 Dec 10 2.40%The TD Bank 4.779% due 14 Dec 16 2.10% Vedanta Resources 6.625% 22 Feb 10 2.20%
CI Signature High Income Fidelity TrueNorth® Cominar REIT 1.70% Goldcorp Inc 5.30%Inter Pipeline Fund LP 1.60% Encana Corp 5.10%Canadian Apartment Properties REIT 1.50% Toronto-Dominion Bank 4.80%Gerdau Ameristeel Corp., 10.375% 07/15/11 1.50% Potash Corp Of Saskatchewan 4.70%Vermilion Energy Trust 1.40% Royal Bank Of Canada 4.10%
Mackenzie Cundill Canadian Security CI Value Trust Corporate Class West Fraser Timber Co Ltd 7.68% UnitedHealth Group Inc. 6.80%Pfizer Inc 7.22% Aetna Inc. 6.20%Canfor Corp 7.01% AES Corp. 6.00%Celestica Inc 6.84% Amazon.com Inc. 3.90%Onex Corp 5.42% eBay Inc. 3.80%
CI American Managers Corporate Class AGF International Stock Class Comcast Corp. 3.40% Sanofi-Aventis SA 8.30%Oracle Corp. 3.00% RSA Insurance Group PLC 7.30%Everest Re Group Ltd. 2.50% GlaxoSmithKline PLC 7.10%Microsoft Corp. 2.50% AXA SA 6.20%Cisco Systems Inc. 1.90% France Telecom SA 5.70%
TD Dividend Growth Fidelity NorthStar® Royal Bank of Canada 9.10% Wellpoint Inc 3.50%The Bank of Nova Scotia 8.60% Johnson & Johnson 2.80%Canadian Imperial Bank of Commerce 8.60% Conocophillips 2.20%Canadian Oil Sands Trust 7.30% Usana Health Sciences Inc 1.90%The Toronto-Dominion Bank 7.00% L 3 Communications Hldgs Inc 1.80%
Mackenzie Cundill Value AGF Global Value Seven & I Holdings Co Ltd 6.24% GlaxoSmithKline PLC 6.10%Muenchener Rueckversicherungs 5.86% RSA Insurance Group PLC 4.80%DIRECTV Group Inc/The 5.38% Royal Dutch Shell PLC 'B' 4.10%Fairfax Financial Holdings Ltd 5.22% Sanofi-Aventis SA 3.90%Sega Sammy Holdings Inc 4.21% AXA SA 3.30%

imaxx TOP GROWTH PORTFOLIO (UNAUDITED)
Underlying Fund
% of Total Market Value of Security
in Underlying Fund
Underlying Fund
% of Total Market Value of Security
in Underlying Fund
Trimark Canadian Bond TD Canadian Bond Govt of Canada, 5.75%, due 01 Jun 29 20.75% Province of Ont Residual 5.25% due 02 Jun 27 3.50%Govt of Canada, 4.00%, due 01 Jun 17 4.88% Government of Canada 5.75% due 01 Jun 29 3.40%Province of Ont, 6.50%, due 08 Mar 29 3.68% Gov’t of Canada Residual 3.94% due 01 Jun 25 2.80%Canada Housing Trust, 4.80%, due 15 Jun 12 3.15% Government of Canada 5.75% due 01 Jun 33 2.20%KfW Bankengruppe, 4.38%, due 09 Feb 16 3.00% The TD Bank 4.779% due 14 Dec 16 2.10%
CI Signature High Income Fidelity TrueNorth® Cominar REIT 1.70% Goldcorp Inc 5.30%Inter Pipeline Fund LP 1.60% Encana Corp 5.10%Canadian Apartment Properties REIT 1.50% Toronto-Dominion Bank 4.80%Gerdau Ameristeel Corp., 10.375% 07/15/11 1.50% Potash Corp Of Saskatchewan 4.70%Vermilion Energy Trust 1.40% Royal Bank Of Canada 4.10%
Mackenzie Cundill Canadian Security TD Dividend Growth West Fraser Timber Co Ltd 7.68% Royal Bank of Canada 9.10%Pfizer Inc 7.22% The Bank of Nova Scotia 8.60%Canfor Corp 7.01% Canadian Imperial Bank of Commerce 8.60%Celestica Inc 6.84% Canadian Oil Sands Trust 7.30%Onex Corp 5.42% The Toronto-Dominion Bank 7.00%
CI Value Trust Corporate Class CI American Managers Corporate Class UnitedHealth Group Inc. 6.80% Comcast Corp. 3.40%Aetna Inc. 6.20% Oracle Corp. 3.00%AES Corp. 6.00% Everest Re Group Ltd. 2.50%Amazon.com Inc. 3.90% Microsoft Corp. 2.50%eBay Inc. 3.80% Cisco Systems Inc. 1.90%
Brandes U.S. Small Cap AGF International Stock Class Briggs & Stratton Corp. 3.06% Sanofi-Aventis SA 8.30%Westlake Chemical Corp. 2.70% RSA Insurance Group PLC 7.30%SAIA Inc. 2.68% GlaxoSmithKline PLC 7.10%Kelly Services Inc. 2.43% AXA SA 6.20%Timberland Company 2.42% France Telecom SA 5.70%
Fidelity NorthStar® Mackenzie Cundill Value Wellpoint Inc 3.50% Seven & I Holdings Co Ltd 6.24%Johnson & Johnson 2.80% Muenchener Rueckversicherungs 5.86%Conocophillips 2.20% DIRECTV Group Inc/The 5.38%Usana Health Sciences Inc 1.90% Fairfax Financial Holdings Ltd 5.22%L 3 Communications Hldgs Inc 1.80% Sega Sammy Holdings Inc 4.21% AGF Global Value Brandes Emerging Markets GlaxoSmithKline PLC 6.10% LG Chemical Ltd. Pref. 4.68%RSA Insurance Group PLC 4.80% Turkiye Vakiflar Bank 4.00%Royal Dutch Shell PLC 'B' 4.10% Lotte Chilsung Beverage Co. Ltd. 3.96%Sanofi-Aventis SA 3.90% Imperial Holdings Ltd. 3.54%AXA SA 3.30% Banco Latinoamericano 3.44% CI Can-Am Small Cap AltaGas Income Trust 6.10% Metro Inc. 5.90% Empire Co. Ltd. 5.70% Mullen Group Income Fund 5.20% Pason Systems Inc. 5.00%
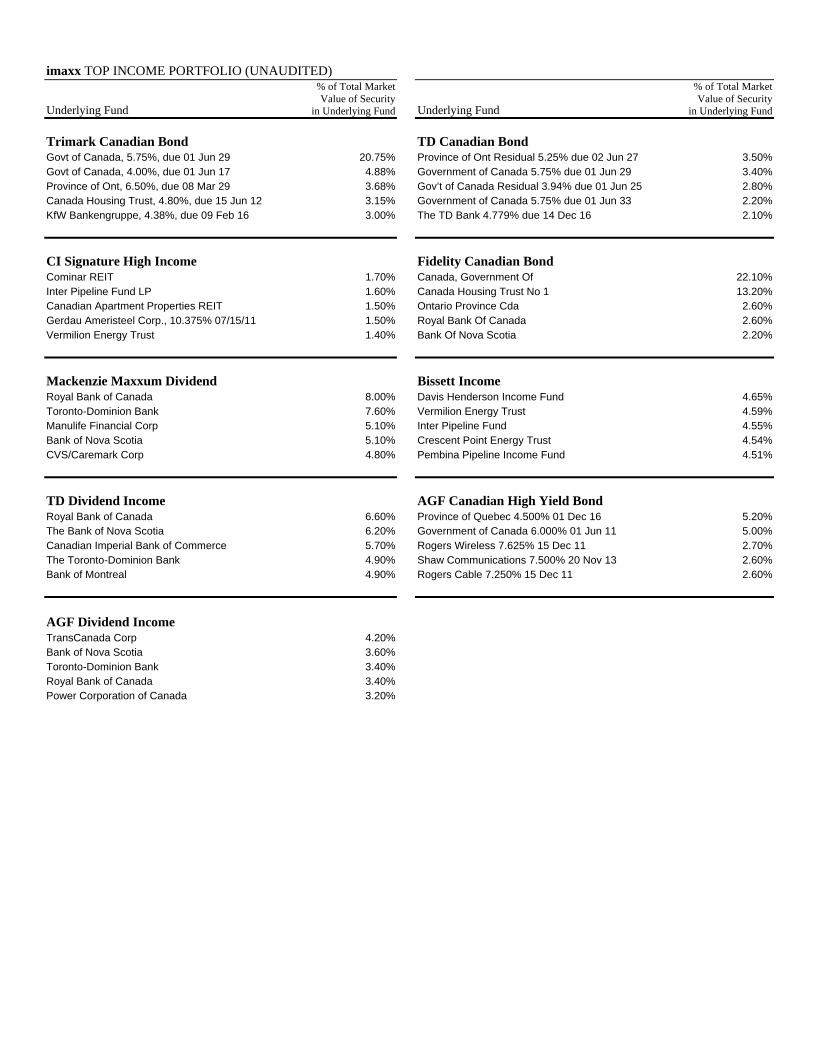
imaxx TOP INCOME PORTFOLIO (UNAUDITED)
Underlying Fund
% of Total Market Value of Security
in Underlying Fund
Underlying Fund
% of Total Market Value of Security
in Underlying Fund
Trimark Canadian Bond TD Canadian Bond Govt of Canada, 5.75%, due 01 Jun 29 20.75% Province of Ont Residual 5.25% due 02 Jun 27 3.50%Govt of Canada, 4.00%, due 01 Jun 17 4.88% Government of Canada 5.75% due 01 Jun 29 3.40%Province of Ont, 6.50%, due 08 Mar 29 3.68% Gov’t of Canada Residual 3.94% due 01 Jun 25 2.80%Canada Housing Trust, 4.80%, due 15 Jun 12 3.15% Government of Canada 5.75% due 01 Jun 33 2.20%KfW Bankengruppe, 4.38%, due 09 Feb 16 3.00% The TD Bank 4.779% due 14 Dec 16 2.10%
CI Signature High Income Fidelity Canadian Bond Cominar REIT 1.70% Canada, Government Of 22.10%Inter Pipeline Fund LP 1.60% Canada Housing Trust No 1 13.20%Canadian Apartment Properties REIT 1.50% Ontario Province Cda 2.60%Gerdau Ameristeel Corp., 10.375% 07/15/11 1.50% Royal Bank Of Canada 2.60%Vermilion Energy Trust 1.40% Bank Of Nova Scotia 2.20%
Mackenzie Maxxum Dividend Bissett Income Royal Bank of Canada 8.00% Davis Henderson Income Fund 4.65%Toronto-Dominion Bank 7.60% Vermilion Energy Trust 4.59%Manulife Financial Corp 5.10% Inter Pipeline Fund 4.55%Bank of Nova Scotia 5.10% Crescent Point Energy Trust 4.54%CVS/Caremark Corp 4.80% Pembina Pipeline Income Fund 4.51%
TD Dividend Income AGF Canadian High Yield Bond Royal Bank of Canada 6.60% Province of Quebec 4.500% 01 Dec 16 5.20%The Bank of Nova Scotia 6.20% Government of Canada 6.000% 01 Jun 11 5.00%Canadian Imperial Bank of Commerce 5.70% Rogers Wireless 7.625% 15 Dec 11 2.70%The Toronto-Dominion Bank 4.90% Shaw Communications 7.500% 20 Nov 13 2.60%Bank of Montreal 4.90% Rogers Cable 7.250% 15 Dec 11 2.60%
AGF Dividend Income TransCanada Corp 4.20% Bank of Nova Scotia 3.60% Toronto-Dominion Bank 3.40% Royal Bank of Canada 3.40% Power Corporation of Canada 3.20%

imaxx TOP AGGRESSIVE GROWTH PORTFOLIO (UNAUDITED)
Underlying Fund
% of Total Market Value of Security
in Underlying Fund
Underlying Fund
% of Total Market Value of Security
in Underlying Fund
Fidelity TrueNorth® Mackenzie Cundill Canadian Security Goldcorp Inc 5.30% West Fraser Timber Co Ltd 7.68%Encana Corp 5.10% Pfizer Inc 7.22%Toronto-Dominion Bank 4.80% Canfor Corp 7.01%Potash Corp Of Saskatchewan 4.70% Celestica Inc 6.84%Royal Bank Of Canada 4.10% Onex Corp 5.42%
CI Canadian Investment CI Can-Am Small Cap Barrick Gold Corp. 5.40% AltaGas Income Trust 6.10%EnCana Corp. 4.70% Metro Inc. 5.90%Goldcorp Inc. 3.70% Empire Co. Ltd. 5.70%Toronto-Dominion Bank 3.70% Mullen Group Income Fund 5.20%Power Corp. of Canada 3.30% Pason Systems Inc. 5.00%
CI Value Trust Corporate Class CI American Managers Corporate Class UnitedHealth Group Inc. 6.80% Comcast Corp. 3.40%Aetna Inc. 6.20% Oracle Corp. 3.00%AES Corp. 6.00% Everest Re Group Ltd. 2.50%Amazon.com Inc. 3.90% Microsoft Corp. 2.50%eBay Inc. 3.80% Cisco Systems Inc. 1.90%
TD U.S. Small Cap Brandes U.S. Small Cap Cash & Cash Equivalents 2.70% Briggs & Stratton Corp. 3.06%First Niagara Financial Group Inc 1.70% Westlake Chemical Corp. 2.70%SEACOR Holdings Inc 1.60% SAIA Inc. 2.68%Jack Henry & Associates Inc. 1.50% Kelly Services Inc. 2.43%ESCO Technologies Inc. 1.30% Timberland Company 2.42%
AGF International Stock Class CI Global Sanofi-Aventis SA 8.30% Toyota Motor Corp. 2.20%RSA Insurance Group PLC 7.30% Oracle Corp. 1.90%GlaxoSmithKline PLC 7.10% Samsung Electronics Co. Ltd. 1.70%AXA SA 6.20% Hutchison Whampoa Ltd. 1.70%France Telecom SA 5.70% Nintendo Co. Ltd. 1.50%
Fidelity NorthStar® Mackenzie Cundill Value Wellpoint Inc 3.50% Seven & I Holdings Co Ltd 6.24%Johnson & Johnson 2.80% Muenchener Rueckversicherungs 5.86%Conocophillips 2.20% DIRECTV Group Inc/The 5.38%Usana Health Sciences Inc 1.90% Fairfax Financial Holdings Ltd 5.22%L 3 Communications Hldgs Inc 1.80% Sega Sammy Holdings Inc 4.21%
Brandes Emerging Markets Mackenzie Universal Canadian Resources LG Chemical Ltd. Pref. 4.68% Potash Corp of Saskatchewan 5.60%Turkiye Vakiflar Bank 4.00% Agnico-Eagle Mines Ltd 3.74%Lotte Chilsung Beverage Co. Ltd. 3.96% Suncor Energy Inc 3.39%Imperial Holdings Ltd. 3.54% Canadian Natural Resources Ltd 3.34%Banco Latinoamericano 3.44% Gazprom OAO 3.32%

AEGON FUND MANAGEMENT INC.imaxxFunds™
imaxx Money Market Fund imaxx Canadian Small Cap Fundimaxx Canadian Bond Fund imaxx Canadian Dividend Fundimaxx Canadian Fixed Pay Fund imaxx U.S. Equity Growth Fundimaxx Canadian Equity Growth Fund imaxx U.S. Equity Value Fundimaxx Canadian Equity Value Fund imaxx Global Equity Value Fundimaxx Canadian Balanced Fund imaxx Global Equity Growth Fund imaxx TOP Conservative Portfolio imaxx TOP Income Portfolioimaxx TOP Balanced Portfolio imaxx TOP Aggressive Growth Portfolioimaxx TOP Growth Portfolio Commissions, trailing commissions, management fees and expenses all may be associated with mutual fund investments. Please read the prospectus before investing. Mutual funds are not guaranteed, their values change frequently and past performance may not be repeated.
You can get a copy of the Funds’ financial statements, including a statement of portfolio transactions, and the Annual Information Form at your request and at no cost, by calling toll-free 1-866-imaxx-go (1-866-462-9946), by asking your financial advisor or dealer, or by e-mail at [email protected]
These documents and other information about the Funds are also available at www.sedar.com, or by contacting
AEGON Fund Management Inc.5000 Yonge Street,Toronto, Ontario M2N 7J81-866-imaxx-go
® AEGON is a registered trademark of AEGON N.V. AEGON Canada Inc., AEGON Fund Management Inc., AEGON Dealer Services Inc. and AEGON Capital Management Inc. are licensed to use such marks.
™ imaxx, imaxxFunds, imaxxWealth, and the imaxx logo are trademarks of AEGON Canada Inc. All the subsidiaries of AEGON Canada Inc. are licensed to use such marks.
AFM61 4/09