aegis deliverable 1.8 - teilar.gr
TRANSCRIPT
Advancing Knowledge-Intensive Entrepreneurship and Innovation for
Economic Growth and Social Well-being in Europe
Deliverable Title D1.8.2 “Identifying dynamic capabilities in knowledge-intensive new entrepreneurial ventures actors sectoral groups and countries ”
Deliverable Lead: UB , IMIT
Related Work package: WP1.1 “Knowledge-intensive entrepreneurship: Theory and Conceptual Framework”
Author(s): Aimilia Protogerou and Glykeria Karagouni (LIEE/NTUA)
Dissemination level: Public
Due submission date: 31/01/2012
Actual submission: 14/03/2012
Version Final
Project Number 225134
Instrument: Collaborative Project (Large-scale integrating project)
Start date of Project: 01/01/2009
Duration: 36 months
Abstract In the context of this deliverable we use the large dataset of the AEGIS survey work in order to empirically test the applicability of the dynamic capabilities concept in newly-established firms which in their majority are micro and small ones. We also study dynamic capabilities not only in high-tech sectors but also in the context of low and medium-low tech ones as well as in the service sector. Moreover, we attempt to link the dynamic capabilities notion with that of knowledge-based entrepreneurship by examining whether dynamic capabilities’ development is differentiated on the basis of their knowledge seeking activities, knowledge assets and innovative performance. Last but not least this study offers the opportunity to test the applicability of dynamic
A E G I SA E G I SA E G I SA E G I SA E G I SA E G I SA E G I SA E G I S

AEGIS-225134 14.03.2012
Deliverable 1.8.2
Page 2 of 45
capabilities in different national contexts as our sample frame includes firms established in ten European countries of differing sizes and varieties of capitalism.
Project co-funded by the European Commission under Theme 8 “Socio-Economic Sciences and Humanities” of the 7th Framework Programme for Research and Technological Development.

AEGIS-225134 14.03.2012
Deliverable 1.8.2
Page 3 of 45
Versioning and Contribution History
Version Date Modification reason Modified by
V1 24/2/2012 Peer review Slavo Radocevic
V2 (Final)
14/03/2012 Final editing, incorporation of feedback from peer reviewer
Aimilia Protogerou

AEGIS-225134 14.03.2012
Deliverable 1.8.2
Page 4 of 45
Table of Contents 1. INTRODUCTION ................................................................................................... 1
2. THEORETICAL FRAMEWORK .............................................................................. 2
2.1 DYNAMIC CAPABILITIES IN DIFFERENT SECTORS ................................................ 2
2.2 DYNAMIC CAPABILITIES AND NEWLY -ESTABLISHED FIRMS ............................... 7
2.3 DYNAMIC CAPABILITIES AND FIRM SIZE ............................................................. 9 3. METHODOLOGY ................................................................................................ 10
3.1 THE SAMPLE ...................................................................................................... 10
3.2 THE VARIABLES ................................................................................................ 13
4. EMPIRICAL RESULTS AND DISCUSSION ............................................................ 18 4.1 DYNAMIC CAPABILITIES -DESCRIPTIVE STATISTICS. ......................................... 18
4.2 ARE THERE KNOWLEDGE-INTENSIVE FIRMS IN THE AEGIS SAMPLE? .............. 20 4.3 TWO-WAY ANALYSIS OF VARIANCE .................................................................. 25
5. CONCLUDING REMARKS .................................................................................... 28
6. REFERENCES .................................................................................................... 30
ANNEX 1 ......................................................................................................................... 35
Deliverable 1.8.2 1
1. Introduction
In the last decade dynamic capabilities and their role in firm strategy, value creation and
competitive advantage have attracted a great deal of interest among scholars (e.g. Teece et al.,
1997; Eisenhardt and Martin, 2000; Winter, 2003; Teece, 2007; Helfat et al., 2007).
In their seminal contribution, Teece et al. (1997) argue that dynamic capabilities enable
organizations to integrate, build, and reconfigure their resources and competencies and,
therefore, maintain performance in the face of changing business environments. The notion of
dynamic capabilities was subsequently refined and expanded (e.g. Eisenhardt and Martin, 2000;
Zollo and Winter 2002; Teece, 2007; Helfat et al., 2007 among others). However, a concise and
comprehensive definition of dynamic capabilities has not been reached yet.
In addition, the debate about dynamic capabilities has reached a point where theoretical
arguments should be further complemented by relevant empirical work. Overall, their empirical
investigation is rather limited and mainly based on case studies, with most theoretical arguments
pending empirical confirmation. In particular, dynamic capabilities have been mainly associated
with large, well-established companies operating in high-tech sectors and single national
contexts (especially large, developed countries). This stems from the fact that large firms are
generally considered as more eligible for the empirical study of dynamic capabilities because it is
assumed that their size ensures an adequate organizational structure and the required resources to
develop and exercise dynamic routines. On the other hand, high-tech sectors are thought as
synonymous to rapidly changing environmental conditions and therefore are considered as a
suitable context for studying dynamic capabilities whose essence is related to change.
However, new firms often face resource base weaknesses and are confronted with subsequent
performance loss if these weaknesses are not dealt with. It is necessary for entrepreneurs to
create and adapt the resource base of the new firm. (Garnsey, 1998; West and DeCastro, 2001),
and therefore newly-established companies have to demonstrate dynamic capabilities to
reconfigure or modify their resource base as required. Furthermore, a changing business
environment should not be exclusively associated with high-tech sectors as it can also exist and
play a significant role in low and medium-technology industries especially in the midst of the
financial crisis that most European countries are right now experiencing. In addition, dynamic
capabilities may be beneficial to the firm in both high and low levels of environmental change
Deliverable 1.8.2 2
and therefore play an important role even in less dynamic environments (Helfat et al., 2007;
Easterby and Smith, 2009; Eisenhardt and Martin, 2000; Protogerou et al., 2011). Finally, it
would be important to test and confirm the applicability of the dynamic capabilities concept in
multiple national contexts exhibiting different constraints and characteristics (Easterby-Smith et
al. 2009).
In the context of this deliverable we use the large dataset of the AEGIS survey work in order to
empirically test the applicability of the dynamic capabilities concept in newly-established firms
which in their majority are micro and small ones. We also study dynamic capabilities not only in
high-tech sectors but also in the context of low and medium-low tech ones as well as in the
service sector. Moreover, we attempt to link the dynamic capabilities notion with that of
knowledge-based entrepreneurship by examining whether dynamic capabilities’ development is
differentiated on the basis of their knowledge seeking activities, knowledge assets and innovative
performance. Last but not least this study offers the opportunity to test the applicability of
dynamic capabilities in different national contexts as our sample frame includes firms established
in ten European countries of differing sizes and varieties of capitalism.
The paper is structured as follows. First, we give some theoretical background on the dynamic
capabilities in newly-established firms and in different sectors. This is followed by a description
of our research method, including the sample, the measures, and the analysis, and the
presentation and discussion of our findings. The paper ends with the drawing of some
conclusions.
2. Theoretical Framework
2.1 Dynamic capabilities in different sectors
In the context of this deliverable we adopt the definition given by Helfat et al. (2007) who define
dynamic capabilities (DCs) as “the capacity of an organization to purposefully and
systematically create, extend or modify its resource base”(p. 4). The firm’s resource base
includes tangible, intangible and human assets such as includes labor, capital, technology,
knowledge, property rights, and also the structures, routines and processes that are needed to
support its productive activities (i.e. organizational structures and capabilities). “Creating” a
resource includes all forms of resource creation, such as obtaining new resources through

Deliverable 1.8.2 3
acquisitions and alliances, as well as through innovation and entrepreneurial activity.
“Extending” their resource base may result in promoting growth in an ongoing business.
“Modifying” their resource base includes any reaction to change, e.g. response to external
environment changes.
Almost by definition, theoretical and empirical research on dynamic capabilities has been mainly
focused on high-technology industries (especially in manufacturing) presupposing that high-tech
environments are characterized by rapid technological change. However, it is also suggested that
dynamic capabilities can be also useful in environments which are not characterized by rapidly
evolving conditions (Eisenhardt and Martin, 2000; Helfat et al., 2007). More specifically,
according to Eisenhardt and Martin (2000) dynamic capabilities can vary with market dynamism.
When markets are moderately dynamic, they are to be found in routines that are complicated,
detailed, and analytic processes to produce mainly predictable outcomes, but in highly dynamic
environments they are simple, experiential and unstable processes that rely on quickly created
new knowledge to produce adaptive but unpredictable outcomes.
In a relatively stable environment, although external changes occur they are to a large extent
predictable and incremental and the rate of change is low, compared to that experienced by firms
operating in more dynamic environmental contexts. In moderately dynamic markets we would
presume that the firm’s resource base remains essentially the same. However, although the extent
of change would be rather limited there would still be some need to adapt or continuously
improve the existing resource base in order that resources maintain their value. For example, a
successful brand name might be constantly updated to sustain its value over time, albeit the basic
brand continues to be stable. Under these circumstances dynamic capabilities do not transform
the firm’s resource base but they support its adaptive change through small and incremental
improvements. This suggests that dynamic capabilities do not only have a role in rapidly
changing environments but they can also be of value in less dynamic contexts where they can be
understood as detailed and analytic processes that rely on existing knowledge to effect
incremental change (Protogerou et al., 2011).
Yet, which business environment can be characterized as “stable” or even as “moderately
dynamic” today? Helfat and Peteraf (2009) argue that the oil industry, which is normally
classified as a low-medium tech (LMT) sector, is far from “stable”, since it “has endured large

Deliverable 1.8.2 4
price swings and several rounds of consolidation since the mid-1970s”. Although mature,
traditional industries are not dynamic by definition (Sciascia et al. 2009) they are characterized
by environmental hostility and are also subject to major changes. Globalization and trade
liberalization have raised interesting new problems and significant challenges for them,
delineating a vulnerable, volatile and rapid changing environment. Mature industries can even
create environmental dynamism through cumulative knowledge which can provide options to
expand to new markets and businesses (Penrose, 1959; Wall et al., 2010), since this is the only
way to survive.
It’s also worth mentioning that a new research stream tries to explore dynamic capabilities within
the crisis extreme high-velocity environment (Colombo et al., 2010; Simon, 2010) which can a
have a major impact on both high and low-tech sectors. For example, Colombo et al. (2010)
tested a sample of 114 Italian high-tech entrepreneurial ventures and found that DCs enable them
cope with the crisis, since they have a positive impact on firms’ growth performances
Therefore, although all the above indicate that dynamic capabilities can play a role in more
mature, traditional industries there is limited empirical research on the dynamic capabilities’
existence and role in low-tech firms either in their start-up stage or later on in their lifetime.
Helfat (1997) was perhaps one of the first scholars to engage a medium-tech industry in her
research and confirm R&D as a dynamic capability in the U.S. petroleum industry. Since then a
stream of empirical research has been slowly emerging trying to capture the impact of dynamic
capabilities in LMT sectors (see Table 1). These research efforts, both qualitative and
quantitative, address several issues such as the relationship between dynamic capabilities and
firm performance, the role of DCs in achieving competitive advantage at the international level
and their impact on innovative performance and change capability. In addition, some of the
studies included in Table 1 explain how dynamic capabilities are actually developed and
manifested in medium and low-tech industries mostly in cases of internationalization (Evers,
2011; Kuuluvainen, 2011; Quentier, 2011). Karagouni and Kalesi (2011) building on qualitative
data from knowledge-intensive firms active in the food industry, showed that low-tech
companies basing their strategy on knowledge intensiveness and innovation develop relatively
strong dynamic capabilities in order to gain competitive advantage.

Deliverable 1.8.2 5
Table 1: Empirical studies on DCs referring to LMT sectors
Study Type Sample Subject
Intra-sectoral studies
Abro et al (2011) comparative analysis
2 textile manufacturers in Pakistan
explore relationships between the leadership decisions and dynamic capabilities of leveraging ICT for sustained competitiveness.
Chirico (2007) qualitative 2 case studies in the beverage sector
impact of dynamic capabilities on entrepreneurial performance
Evers (2011) qualitative 3 case studies from seafood industry
examines international new ventures operating in a traditional low technology sector
Grande (2011) longitudinal study
3 Norwegian new ventures in the agricultural sector
explores the impact of dynamic capabilities in creating new profitable ventures
Kuuluvainen (2011)
case study a Finnish SME in the forestry sector
the role of dynamic capabilities in international growth
Karagouni and Kalesi (2011)
qualitative 4 case studies from the food sector
explore the applicability of DCs in knowledge-intensive companies active in the food sector
Quentier (2011)
in-depth analysis
3 cases of highly export Brittany ventures in the global seafood industry
examine how such companies develop competitive advantage at international level
Salvato et al .(2003)
in-depth empirical analysis
2 medium –sized Italian project-oriented firms
micro-processes and roles that form DCs
Inter-sectoral studies
Borch and Madsen (2007)
explorative study
235 Norwegian LMT SMEs
DCs that facilitate innovative strategies in SMEs (mainly micro and small)
Protogerou et al. (2011)
survey work 271 Greek firms of various manufacturing industries
explore the direct or indirect relationship between DCs and performance at differ levels of environmental dynamism
Rafailidis and Tselekidis (2009)
Empirical research
37 Greek SMEs of 4 medium -high industry sectors
relationships between the enabling mechanisms of dynamic capabilities and innovativeness and change capability
Spanos and Lioukas (2001)
survey work 147 Greek firms from various (mainly LMT) manuf. industries
relative impact of industry vs. firm-specific factors on performance
Telussa et al. (2006)
longitudinal database
354 low and medium –tech firms up to ten years old.
association between dynamic capabilities and new firm growth,

Deliverable 1.8.2 6
The empirical studies aiming at the examination of the applicability of the dynamic capabilities
framework in the services sector is also relatively limited, while the majority of these studies is
qualitative and built on case study work. Table 2 presents a summary of both qualitative and
quantitative studies examining DCs in the service sectors. They mainly explore the existence and
role of dynamic capabilities in the specific sector and examine the impact of DCs on
performance innovation or intermediate outcomes and scope of services.
Table 2: Empirical studies of dynamic capabilities in services
Study Type Sample Subject
Alvarez and Merino (2003)
quantitative 77 Spanish savings and loans institutions
the organizational evolutionary processes dependent on environmental dynamism
Doeving & Gooderham, (2008)
quantitative 254 Norwegian authorized accountancy practices
DC impact on the scope of services
Ellonen et al. (2009) qualitative 4 publishing companies link DC portfolios and innovation outcomes
Fischer et al. (2010) inductive data inquiry 13 firms of capital goods industries with different sizes and in two countries (Switzerland and Germany)
explore how DCs shape the way in which service business is developed
Jantunen (2005) survey 217 Finnish manufacturing and service organizations (from both low and high tech industries)
explores the effect of an entrepreneurial orientation and a firm’s reconfiguring capabilities on international performance
Lampel and Shamsie (2003)
Empirical / archival 400 films (U.S. motion picture industry), 1941–1948
Antecedents and
characteristics of DCs
Marcus & Anderson (2006)
empirical survey 108 grocery chains from U.S. retail food industry in 1997
characteristics of DCs and intermediate outcomes
Pablo et al. (2007) Field One regional health authority in Canada
characteristics of
DCs
Salunke et al. (2011) multi-case field study 13 national and international project-oriented service firms
build a theoretical framework of innovation-based competitive strategy in project-oriented service firms by drawing on the DC based view of compet. strategy
Tsekouras et al. (2011) qualitative 3 case studies in the tramp shipping sector
relationship between innov. activities and DCs
Deliverable 1.8.2 7
Zúñiga-Vicente & Vicente-Lorente (2006)
archival study 134 Spanish banks (1983–1997)
performance outcomes
In sum, our literature review indicated that despite the substantial body of work on dynamic
capabilities, the DCs approach have so far been developed and empirically examined in the
context of high-tech organizations (especially in high-tech manufacturing). Only lately research
effort has been put to relate the concept of dynamic capabilities to LMT and service sectors. As a
consequence the empirical studies trying to capture the nature and role of dynamic capabilities in
these sectors are still rather limited and therefore the potential to examine them through the lens
of the DCs approach remains largely unexplored.
2.2 Dynamic capabilities and newly-established firms
Thus far, the literature on dynamic capabilities and their development has been mainly focused
on large and established firms (McKelvie and Davidsson, 2009). One of the few exceptions is
Helfat et al. (2007) which suggest that the dynamic capabilities concept can apply both to newly-
formed as well as to established firms, however, they point out that almost by definition new
ventures “typically develop fewer patterned forms of behaviour that underpin a capability”.
New firms are usually micro or small ones, encountering resource base weaknesses therefore
they must demonstrate dynamic capabilities to reconfigure their resource base as needed (Telussa
et al., 2006), but this assumption is still empirically unexplored. A small but growing body of
empirical research highlights the way dynamic capabilities relate to the performance, survival
and growth of new firms (e.g. Arthurs & Busenitz, 2006; Zahra & Filatotchev, 2004; Grande,
2011), while in their grand majority involve high-tech sectors. For example, Stam et al. (2007)
examined the impact of dynamic capabilities on high-tech start-ups’ growth, resulting to initial
R&D activities and inter-firm alliances as the dynamic capabilities most likely to accompany
growth. The authors noted that in newly-established firms, attempts to sustain and renew
capabilities do not at first take the form of routines, but of trial and error efforts, for instance at
R&D and alliances. Boccardelli and Magnusson (2006) use the dynamic capabilities framework
of strategy trying to investigate how firms go about to match their resource bases with
opportunities in the marketplace in the Swedish mobile Internet industry. They suggest the single
entrepreneur as a source of dynamic capabilities, arguing that “dynamic capabilities can exist

Deliverable 1.8.2 8
already at the outset of a venture, then however residing primarily in the few individuals
constituting the entrepreneurial team and not always throughout the organization”.
Research also suggests that dynamic capabilities are important for the evolution and successful
entry and survival of new firms especially in international markets (Sapienza et al., 2006;
Sapienza et al., 2010; Jantunen et al., 2005). Zahra et al. (2006) adds that the skills and
competencies that “these firms have, must be upgraded and new dynamic capabilities must be
built to ensure successful adaptation for growth”.
Some researchers also address questions on the existence and importance of dynamic capabilities
for the creation and evolution of new ventures. Newbert (2005), for example, based on a study of
817 US nascent entrepreneurs, sees firm formation process as a dynamic capability, defined as
the “organizational and strategic routines by which firms achieve new resource combinations”.
While literature review indicates that the majority of existing empirical studies examining the
link between dynamic capabilities and new firms are focused on high-tech sectors, a few
researchers choose to explore this relationship in traditional sectors. For example, Telussa et al.
(2006) analyzed the association between dynamic capabilities and new firm growth, using a
sample of mostly low and medium-tech firms. Questioning the origins of dynamic capabilities in
new ventures of traditional sectors (up to 10 years old), Karagouni (2011) proposed that
entrepreneurial capabilities such as bricolage and improvisation as important antecedents of
dynamic capabilities.
There is also a small number of studies that neglect or use their own definitions for high and low-
technology industries. Stam and Wennberg (2009) covered the first six years of the life course of
micro firms investigating R&D as a major and representative dynamic capability but without
using the official OECD definition. They measured the technological basis of the firm’s product
instead. McKelvie and Davidsson (2009) applied the dynamic capabilities argument to new firms
using a mixed sample of manufacturing, service and trade firms.
So far, the limited but gradually increasing research on DCs regarding newly-founded firms is
evident through a number of empirical studies, which indicate that new ventures need dynamic
capabilities in order to survive, grow and thus enhance the potential for innovative
entrepreneurial activity. This growing interest imposes the need for more empirical research to
Deliverable 1.8.2 9
address the issue of the creation and importance of dynamic capabilities for the creation and
evolution of new ventures.
2.3 Dynamic capabilities and firm size
Considering the huge volume of literature on dynamic capabilities the relationship between
dynamic capabilities and firm size remains unsatisfactorily explored and understood. In general,
scholars have paid attention mainly to large, multinational firms ( e.g. Teece, 2007; Pitelis and
Teece, 2010; Zollo and Winter, 2002, Dunnung and Lundan, 2010, Kale & Singh, 2007) while
limited research has addressed SMEs (Spanos and Lioukas, 2001; Jantunen, 2005; Borch and
Madsen, 2007; Rafailidis and Tselekidis, 2009; McKelvie and Davidsson, 2009; Paun et al.,
2010; Foss et al., 2010; Wang and Shi, 2011; Abro et al., 2011; Salvato, 2003) or micro firms
(Telussa et al., 2006; Doeving & Gooderham, 2008).
Few studies have explicitly investigated which sizes of firms are more likely to benefit from
dynamic capabilities. Caloghirou et al. (2004), for example, attempted a first approach of the size
question, considering the impact of firm-specific assets and capabilities on both SMEs and large
firms. Borch and Madsen (2007) focused on small and micro firms in low-tech and medium-low
industries to explore dynamic capabilities that facilitate innovative strategies. Yet, the literature
on DCs and SMEs still remains rather limited and under-developed.
It is worth mentioning that while Telussa et al. (2006) focused on micro firms, McKelvie and
Davidsson (2009) excluded them from their sampling frame, claiming that “they may not
adequately reflect the theoretical entity ‘firm’ that dynamic capabilities theory makes statements
about”. Such statements arise many questions on the existence and role of dynamic capabilities
in the vast group of micro-enterprises. Whilst over 99% of all enterprises in Europe are SMEs,
90% of SMEs are actually micro-enterprises - with fewer than 10 employees - and the average
company has just five workers. However, these micro-enterprises account for 53% of all jobs in
Europe, so their importance to the European economy is enormous.1
Moreover, no studies have focused on SMEs within less dynamic industries. This, contrasts with
empirical evidence: although characterized by a growing concentration level, traditional LMT
1 http://ec.europa.eu/enterprise/policies/sme/promoting-entrepreneurship/crafts-micro-enterprises/

Deliverable 1.8.2 10
industries comprise mainly small firms. However current trends in the study of dynamic
capabilities seem to disregard this vast section of economic activity.
It is evident that further research of dynamic capabilities in SMEs is necessary and of great
importance especially nowadays, since the pressures of increasing globalization and rapid
technological and socioeconomic changes have major impacts on small and medium-sized firms,
arising quite different issues than those of interest to large organizations. Consequently, the need
of establishing theoretically and empirically sound recommendations and policies on the creation
and sustainment of strong competitive advantages is vital for the vast majority of the European
business ecosystem.
3. Methodology
3.1 The sample
The AEGIS questionnaire was filled in by 4,004 firms after a telephone interview with one of the
form founders in ten European countries, namely, UK, Germany, France, Italy, Sweden,
Denmark, Greece, Portugal, Croatia and Czech Republic. The total response rate of the survey
was 31.2%, but rates ranged within countries from 19.5% in the UK to 63.9% in Croatia.
The firms that participated in the survey were by definition young firms i.e. they were
established between 2001 and 2007. Table 1 presents a distribution of firms in terms of their year
of establishment. The average firm age is 7.1 years (min: 4; max: 11 years). By the time the
survey was carried out (late 2010 – beginning 2011), firms established in 2007 have been in
operation for about 4 years, and therefore it can be assumed that they have managed to exceed
the critical time for survival.2
Table 1: Firms and year of establishment
Year of establishment No of firms % of firms
2001 1071 27%
2002 151 4%
2 Bygrave W.D & Hunt, S. (2004), “Global Entrepreneurship Monitor 2004, Financing Report”, Babson College and London Business School

Deliverable 1.8.2 11
2003 503 13%
2004 510 13%
2005 458 11%
2006 832 21%
2007 479 12%
Total 4004 100%
Figure 1 shows that the majority of firms (63.6%) in the AEGIS sample are micro firms in terms
of full-time employees, i.e. they employ up to 9 full-time persons, while 8.51% of firms reported
that they have no employees (excluding founding team). 88.4% can be qualified as small firms
because they employ less than 50 persons, at the same time only a very small share of them can
be regarded as large or very large firms (0.28%).
Figure 2: Distribution of firms in terms of full time employees (N=3973)
The selection of the sectors covered in the AEGIS survey follow the rationale that has been
developed in the AEGIS proposal and cover most of the high-technology manufacturing sectors,
along with some medium-tech sectors, some low-technology manufacturing sectors (as classified
by OECD) and Knowledge Intensive Services (KIBS)3. More specifically, the selected sectors
covered in the survey and the firms that have responded in each sector are presented in Table 2.
3 For a first approach on KIBS please check on http://www.eurofound.europa.eu/emcc/publications/2005/ef0559en.pdf
8,51%
63,60%
24,82%
2,79%
0,15%
0,13%
0
1-9
10-49
50-249
250-499 (6 firms)
>500 (5 firms)

Deliverable 1.8.2 12
Table 2: Distribution of the AEGIS survey firms by sectors
Selected Sectors NACE rev. 1.1 code
Number of firms
High-technology manufacturing sectors
Aerospace 35.3 1
Computers and office machinery 30 20
Radio-television and communication equipment 32 35
Manufacture of medical, precision & optical instruments (scientific instruments)
33 67
Pharmaceuticals 24.4
Medium-high technology manufacturing sectors
Manufacture of electrical machinery & apparatus 31 45
Manufacture of machinery and equipment 29 201
Chemical industry (excl pharma) 24 (excl. 24.4) 51
Total 420
Low-technology manufacturing sectors
Paper and printing 21,22 618
Textile and clothing 17, 18, 19 209
Food, beverages and tobacco 15,16 297
Wood and wood products 20 122
Manufacture of furniture 36.1 111
Medium-low manufacturing sectors
Basic metals 27 31
Fabricated metal products 28 214
Total 1602
KIBS sectors
Telecommunications 64.2 24
Computer and related activities 72 518
Research and experimental development 73 71
Other business services activities 74.1, 74.2, 74.3, 74.4, 74.5, 74.8*
1369
Total 1982

Deliverable 1.8.2 13
*Selection of most 4-digits sectors. Only some 74.87 (other activities) excluded
3.2 The variables
The questionnaire used to conduct the AEGIS survey contained a large number of questions
pertaining to venture characteristics, competitive behaviour, market environment, and
performance. For the needs of the present deliverable we are focusing on the variables used to
capture the dynamic capabilities of newly-established firms, namely new product development
capability, technical and market adaptation capability, networking capability and capability to
participate in collaborations, while each of them was measured with specific items. Firm
founders were asked to indicate in a five-point scale the extent to which the particular
capabilities were present/developed in their firms.
New product development capability
New product development (NPD) is considered to be a key source of competitive advantage and
a strategic function of the organization which constitutes a major requirement for success (Teece,
2007). In today's competitive environment, firms have to cover latent needs, find new markets
for novel products and diversify their markets adapting to specific needs of different customers.
Product development is a dynamic capability that stems from the knowledge of the firm and
leads to innovation and adaptation to the market (i.e. entrepreneurial performance). Especially, in
rapidly changing environments, when a firm’s products go, for instance, out of fashion, it is of
vital importance to develop a product development process to acquire, exchange, transform and
at times shed resources in order to create new products according to the changing demand of
customers. In this way, change is promoted and value creation can be generated and competitive
advantage can be achieved.
New product development capability has been tightly connected to dynamic capabilities. For
instance, Eisenhardt and Martin (2000) identify new product development routines, among the
important elements (microfoundations) of dynamic capabilities. Empirical evidence also suggests
that dynamic capabilities are associated with high product quality and fast-cycle time (Henderson
& Clark, 1990; Iansiti & Clark, 1994) or even new niche markets. Teece (2007) involves NPD in
his microfoundations as an important success factor. He claims that the search activities that are
relevant to “sensing” can be a “form of ‘search’ for new products and processes”. In a recent

Deliverable 1.8.2 14
study, Pavlou and El Sawy (2011) relate a firm’s sensing capability to the technical and
marketing dimensions of new product development.
Altogether, a new product development capability enables firms to better satisfy existing and
potential customers’ current and future needs, to better serve these needs and create new market
niches as well as new business ecosystems.
Firm founders were asked to indicate in a five-point scale the degree to which new product
development capability was attained in their firms. It was measured with three items: capability
to offer novel products/services and capacity to adapt the products/services to the specific needs
of different customers and market niches.
Sensing capability (market and technical adaptation)
Following Teece’s terminology, sensing capabilities denote the firm’s activities in scanning and
monitoring changes in operating environments and identifying new opportunities. Sensing is an
inherently entrepreneurial set of capabilities that involves exploring market and technological
opportunities, probing markets, and listening to customers.
In order to measure the ability to spot, interpret, and pursue opportunities in the environment
regarding market adaptation, Teece’s (2007) relevant elements of sensing capability were
engaged after being translated in more specific activities. Thus, customer feedback and processes
of market- shift recognition are engaged to identify new market segments and changing customer
needs and to assist rapid responses. Market knowledge is regarded as knowledge related to
customer and competitor domains (Danneels, 2002; Bruni and Verona, 2009) and sensing
embraces understanding, generation and respond to market intelligence (Pavlou and El Sawy,
2011) by observing, counteracting and capturing opportunities. Firms tend to observe sectoral
markets and collect information and knowledge on competitive moves, outstanding products,
novel promotion methods and other relevant best practices in order to adopt, change and respond,
altering or even creating novel competitive advantages. Most interestingly, empirical research
has shown that market adaptation in young firms can take place without any related change in the
firms’ technological resources indicating that a significant factor at this stage is the flexible use
of resources in searching for an appropriate match between resources and market opportunities
(Boccardelli and Magnusson, 2006).

Deliverable 1.8.2 15
However, sensing entails also processes to acquire knowledge about, and understand technology
developments in its business environment. An organization that has a high level of technology
sensing capability will continually scan for information about potential technological
opportunities and threats (Srinivasan et al., 2002) and respond to technological changes in its
environment. Organizations develop systems and infrastructure such as formal technical and
engineering departments to select and understand new technologies, and direct internal R&D.
R&D activities are more likely to accompany growth in general, as well as especially for new
firms (Stam et. al, 2007). The authors noted that in new and young firms, attempts to sustain and
renew capabilities do not at first take the form of routines, but of trial and error efforts at R&D
and alliances.
Teece (2007) states that R&D can itself be thought of as a form of ‘search’ for new products and
processes. Yet technical adaptation extends to a blending of R&D with design and market
oriented dimension needed to proceed with seizing and communication of products/services to
markets. Design-making invites enriched perspectives of sensing results and constitutes an
important but not always necessary complement to the achievement of competitive advantages or
product internationalization.
In order to explore the “double face” of sensing capability, founders were asked to indicate in a
five-point scale the degree to which market and technology-oriented sensing capabilities were
available in their firms, discussing several items for each of them. Market adaptation was
captured by questions on adaptation of best practices, response to competitive moves, and
customer feedback, recognition of shifts in markets, consideration of the consequences of
changing market demand and capturing of new opportunities. Technological adaptation was
measured using three items, namely the existence of formal R&D and technical departments and
the importance of design activity.
Networking capability
Networking refers to the formation of mutually beneficial personal or business relationships to
expand and accelerate the acquisition of useful resources and skills. These resources include the
exchange of information and knowledge, as well as the discovery and control of opportunities
and it is also extended to various types of financial and institutional support.

Deliverable 1.8.2 16
Enterprises search not only the core but also the periphery of their business ecosystems by
embracing potential collaborators which can be customers, suppliers, and producers of
complementary products or even competitors. Especially in KIE, firms recognize opportunities
for profitable exchanges of knowledge and technology, identify the relevant knowledge sources
or partners (Birkinshaw et al., 2007; Carlsson et al., 2009), and develop different network types
in order to sense market and technology opportunities. Networking can therefore be considered
as a necessary (though not sufficient) condition for the existence of a sensing dynamic capability.
Knowledge acquisition, through networking, was positively related to new product development,
technological distinctiveness, and sales cost efficiency (Yli-Renko, et al.,2001). Besides R&D
and NPD, networking enhances the capturing of novel technologies and production methods, the
access to skilled human capital, and supports innovativeness.
Networking is shown to influence the viability and development paths of new firms. R&D
networking has been found to affect the early life course of high-tech firms (Stam and
Wennberg, 2009). Yli –Renko et al (2001) have studied networking of young technology-based
firms regarding their customer relationships in the UK, while O’ Gorman and Evers (2011) draw
on the network perspective of new venture internationalization.
Networks have been found important for firms to create competitive advantages (Dahl and
Pedersen, 2004; Littunen, 2000). Common goals are shared by network members regarding
markets, market shifts and customer needs, for example information sharing including
competitor activities as well, and the establishment of best practice techniques in advertising and
promotion.
Nevertheless, incentives for participating in networks can also be of economic nature such as
financial assistance in loans or fund seeking or can start from the idea of “safety”, whereby
associated firms are able to reduce uncertainty resulting from legal and other institutional issues
related to new markets and access of new distribution channels or even export potential.
For the purpose of the present research networking capability was operationalized by operations
regarding market processes such as collecting information about competitors, accessing
distribution channels, exploring export opportunities, advertising and promotion. Regarding the
technology side of the networking capability we employed variables assessing the network’s
impact on the development of new products/services, the management of production and

Deliverable 1.8.2 17
operations, as well as the easy access to skilled personnel. Finally in order to catch the economic
and more generic value of networking we used variables assessing networks’ assistance in
obtaining business loans and attracting funds or providing support on legal issues.
Participation in Collaborations
Collaborations assist firms to use efficient and cost effective ways to access additional or
complementary resources that can speed up progress and advance set targets. Firms develop
various types of collaborations according to what they want to attain: share the costs of R&D
development, introduce new products in global markets, minimize costs, develop sales or gain
access to rare or expensive resources. Therefore whatever the form, alliances are an important
vehicle for dynamic capabilities and the achievement of sustainable competitive advantage.
Lambe et al. (2002), in alliances ‘‘the firms pool their resources in an effort to achieve mutually
compatible goals that they could not achieve easily alone’’. A frequent type of collaboration
which has gained considerable attention is strategic alliance. A review of the literature reveals a
list of benefits derived by strategic alliances, such as enhancement of market power (Kogut,
1991), new competencies (Baum & Oliver, 1991) efficiencies (Ahuja, 2000) and access to new,
rare or critical resources, skills and capabilities (Rothaermel and Boeker, 2008).
Especially R&D and technical cooperation agreements have become a strategically important
part of business decision making in many industries in recent years in both high and low tech
sectors. They include any agreed-upon cooperative R&D or technology arrangement between
firms, such as joint ventures, consortia, technology partnerships and informal networking
arrangements. Such collaborations are often considered decisive for the creation of industry-
standard platforms and technological innovations (Nacamura, 2003). Regarding R&D,
nowadays, outsourcing has also become a common practice (Grimpe and Kaiser, 2010). Contract
R&D serves as an instrument to access knowledge resources that may subsequently be
redeployed with existing resources in a way superior to a competitor’s deployment (Barthélemy
and Quélin, 2006; DeSarbo et al., 2005)
Contractual forms of collaboration include also licensing agreements which, in contrast to
strategic alliances, introduce rather passive relationships. They define the nature and scope of the

Deliverable 1.8.2 18
intellectual property or product that is licensed, and mostly refer to “licensing-in” technology,
that is technology developed by another.
The various types of collaborations appear to play a special role when new firms try to develop
competitive advantages. New product development (NPD) and market introduction, although
crucial for high technology new firms' successful performance, can be costly and time
consuming processes with uncertain outcomes and this according to Haeussler et al., (2010),
constitutes a major reason for the employment of strategic alliances. Collaboration is important
for startups to gain the knowledge necessary to develop or acquire the capabilities needed for
NPD, R&D, innovation, design, manufacturing, or even technical services (Haeussler et al.,
2010; Stam et al., 2007; Park et al., 2005) as well as to gain higher rates of growth (Stearns,
1996).
Within the present research firms’ collaborative activities were operationalized using four
variables: participation in strategic alliances, agreements regarding R&D, technical cooperation
and licensing.
All multi-item scales pertaining to dynamic capabilities were tested following Confirmatory
Factors Analysis (CFA) in order to confirm that particular items relate to a specific dynamic
capabilities construct. Therefore five different dynamic capabilities constructs or composite
variables were produced. All of these composite variables were constructed as averages of multi-
item Likert-type scales, where higher numbers pointed to a “higher quantity” of what was
measured. Annex I presents all relevant CFA details. As shown there, all multi-item scales
representing dynamic capabilities were reasonably valid and reliable.
4. Empirical results and discussion
4.1 Dynamic capabilities-Descriptive statistics.
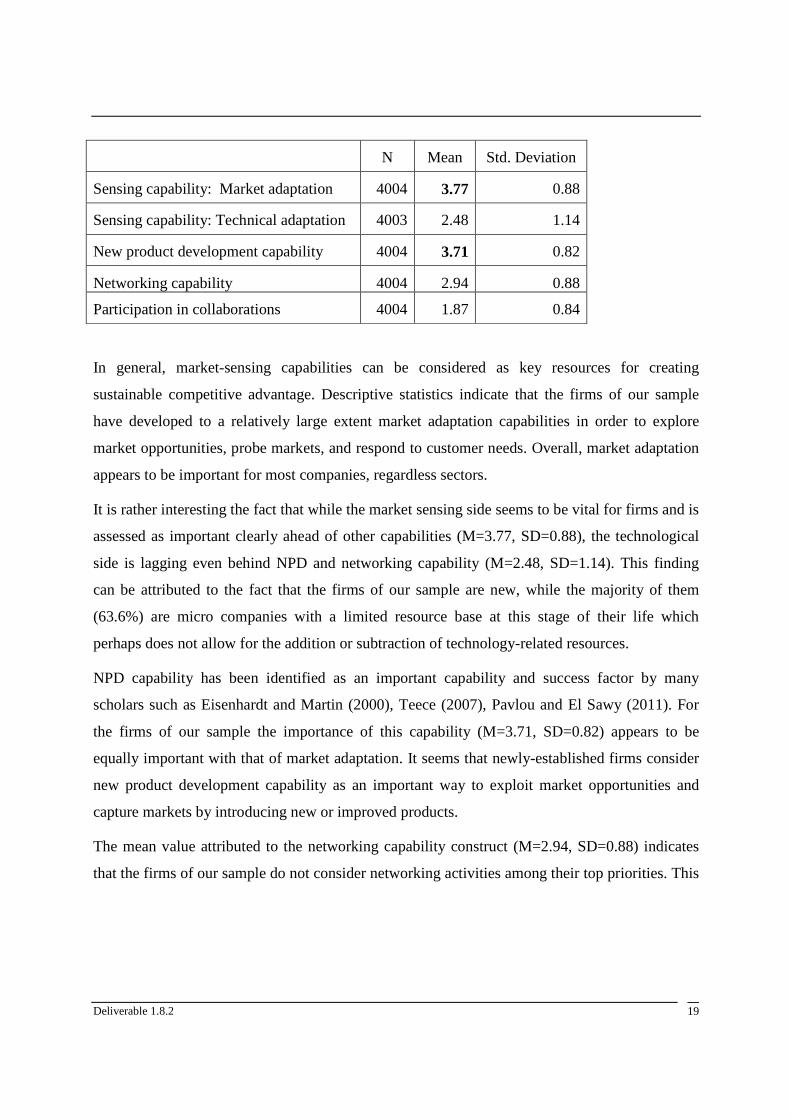
Table 3 presents the descriptive statistics (mean values) of the dynamic capabilities constructs
(please see Annex for a presentation of the items used to generate each construct) and provides a
first indication of their development and use within the newly-established firms of our sample.
Table 3: Descriptive Statistics
Deliverable 1.8.2 19
N Mean Std. Deviation
Sensing capability: Market adaptation 4004 3.77 0.88
Sensing capability: Technical adaptation 4003 2.48 1.14
New product development capability 4004 3.71 0.82
Networking capability 4004 2.94 0.88
Participation in collaborations 4004 1.87 0.84
In general, market-sensing capabilities can be considered as key resources for creating
sustainable competitive advantage. Descriptive statistics indicate that the firms of our sample
have developed to a relatively large extent market adaptation capabilities in order to explore
market opportunities, probe markets, and respond to customer needs. Overall, market adaptation
appears to be important for most companies, regardless sectors.
It is rather interesting the fact that while the market sensing side seems to be vital for firms and is
assessed as important clearly ahead of other capabilities (M=3.77, SD=0.88), the technological
side is lagging even behind NPD and networking capability (M=2.48, SD=1.14). This finding
can be attributed to the fact that the firms of our sample are new, while the majority of them
(63.6%) are micro companies with a limited resource base at this stage of their life which
perhaps does not allow for the addition or subtraction of technology-related resources.
NPD capability has been identified as an important capability and success factor by many
scholars such as Eisenhardt and Martin (2000), Teece (2007), Pavlou and El Sawy (2011). For
the firms of our sample the importance of this capability (M=3.71, SD=0.82) appears to be
equally important with that of market adaptation. It seems that newly-established firms consider
new product development capability as an important way to exploit market opportunities and
capture markets by introducing new or improved products.
The mean value attributed to the networking capability construct (M=2.94, SD=0.88) indicates
that the firms of our sample do not consider networking activities among their top priorities. This

Deliverable 1.8.2 20
may be initially attributed to the age of these companies4. Although an impressive line of
research has documented the wide-ranging effects of networking, new firms seem not to exploit
to a large extent network relations that both provide and shape opportunities. That can be due to
limited social and business capital during the first years, lack of trust to bigger companies or
introversion which depends on both national and sectoral contexts. The diversity of our sample
allows for assumptions to be made relating the technology and knowledge level, the sectoral and
national context, as well as the company’s age with the tendency to develop networking. We
would expect high-tech and more knowledge-intensive firms to draw more upon networking
capabilities than low-tech and less knowledge-intensive ones. This is however a matter of more
elaborate analysis which will follow.
Although firms demonstrate a moderate interest at networking (M=2.94, SD= 0.88), the
descriptive results indicate that they don’t participate or participate to a limited extent in
technological collaborations (M=1.87, SD=0.84). This may be attributed to their limited
resources, lack of trust and sometimes lack of clear goals and objectives due to newness.
Furthermore, owing to the fact that the specific collaborations study have a strategic orientation
it is more likely that young firms develop technology cooperative strategies and thus decide to
get involved in such collaborations later on in their lifetime
4.2 A proposed taxonomy of firms in the AEGIS sample5?
In the theoretical framework of the AEGIS project it is clearly stated that knowledge-intensive
entrepreneurship is associated with four basic characteristics: it concerns new ventures; new
ventures that are innovative; new ventures engaging in activities that are knowledge intensive;
and finally, new ventures that are not to be found only in high-tech industries (they may well be
4 Network content (inter-personal and inter-organizationanl relationships) changes throughout the lifetime of an entrepreneurial venture. During the early phases of a venture’s life entrepreneurs are particularly concerned with building personal networks in order to overcome the liability of newness, to mobilize necessary resources such as information and knowledge and promote the emerging business. More strategic networks emerge later in the life of the firm when issues such as growth and profit making arise. Once the operating foundation has been established the entrepreneur/founding team becomes more aware of the strategic aspects of the networks which tend to consist of relations with customers, suppliers or competitor organizations and can be
important conduits for information and know-how (Schutjens and Stam, 2001; Lechner and Dowling (2003).
5 This part of the deliverable relies heavily on empirical work undertaken by the LIEE/NTUA team in the context of Deliverable 2.3.2. In D.2.32 one can find detailed information on the variables used, their measurement and the cluster analysis performed to identify different types of knowledge-intensive ventures.

Deliverable 1.8.2 21
active in industries with medium or low-tech characteristics). The first and last conditions
characterising a KIE venture are satisfied a priori in the AEGIS sample. Table 1 and Table 2 (see
Sample section) indicate that the collected data regard new ventures and that these ventures are
sampled from a wide array of both high-tech and low-tech industries. We therefore need
variables for the remaining two conditions: knowledge intensive activities and innovation
performance in order to be able to identify KIE ventures. The following Table (column 1)
presents our choice of variables.
As it can be seen from Table 4, four classes of variables were employed as distinguishing
features of KIE. Variables representing knowledge-seeking activities and innovation
performance represent obvious choices. Knowledge-seeking activities are related to specific
linkages that can act as sources of information and knowledge for the young firm. They can be
either external (industry, scientific institutions, other open sources) or internal to the firm (in-
house R&D) and they can also be related to participation in collaborative R&D (nationally or
EU-funded). Innovation performance is measured using a set of variables measuring whether the
responding firm introduced product, process or other types of administrative innovations as well
as whether the firms utilized various means to protect their intellectual property during the last
three years. Finally, in innovation performance measures we included the radicalness of product
innovation as an ordinal variable taking the values of 0 (= no innovation); 1 (= new-to-firm); 2
(=new-to-market); and 3 (= new-to-world product innovation).
The remaining two groups of indicators are “initial conditions” and “human capital and
innovation input”. Beginning with “initial conditions”, average educational attainment of the
founding team can be thought of as representing the initial stock of knowledge founders bring
with them when starting the venture. The percentage of funding coming from venture capital
may be seen to reflect the quality or ingenuity of the original idea that led to the formation of the
venture. One would normally expect that, ceteris paribus, the higher the contribution of venture
capital the higher the originality and innovation potential of the firm. Taken together, these two
variables may be argued to represent the “initial” knowledge capital available to the venture at
start-up. As regards the next four variables, the positive role of human capital (i.e. percentage of
employees with advance qualifications) and of R&D intensity as inputs for knowledge creation
and innovation is self-evident.

Deliverable 1.8.2 22
We therefore argue that, taken as whole, knowledge-seeking activities, initial conditions, and
human capital, as operationalized in the AEGIS survey, reflect what might be understood as the
venture’s knowledge assets. Naturally, we do not pretend that these are the only, or even the best,
measures that could be used as indicators of “knowledge intensity”; we simply contend that,
within our particular context and data at hand, they represent reasonably faithfully the latent
concept of interest. As regards innovation performance, the variables presented in the Table are
fairly standard. Taken together they capture various dimensions of innovation performance,
including product, process and administrative innovation, and patenting as well as less formal
methods of intellectual property protection. With the variables shown in the Table, we have
3,226 firms with complete data.
In order to determine whether there it exists a meaningful grouping in our observations on the
basis of their similarity in knowledge assets and innovation performance as reflected by the
(binary) variables identified above we performed Kmeans cluster analysis. Kmeans is a partition
method that attempts to break the observations into a distinct number of non-overlapping groups
(clusters). Upon inspection, we decided that the most meaningful grouping in our data is given
by the 3-cluster solution. All variables included in cluster analysis are binary including those that
were originally measured as continuous or in a 5-point Likert scale6. The descriptive statistics on
each of the three groups are given in columns (2) to (4). Column (5) gives the sample means. As
the variables used in cluster analysis are binary, numbers in each column represent the percent of
firms within each group that score one in any given variable.
As can be seen from the Table, we distinguish between “followers”, “all-around innovators” and
“world-class product innovators”. The “followers” group is the most highly populated in our
sample (i.e. 2012 firms). Its main characteristic is that none of the means of the variables used in
cluster analysis is greater than the respective sample average.7 There is nothing extraordinary
about this group of firms, hence the name “followers”. For example, only 44% of firms
belonging into this group have introduced product innovation in the last three years compared to
6 Detailed information on the cluster analysis methodology followed and the results obtained can be found in Deliverable 2.3.2. 7 Note that in the Table, means are highlighted when they are greater than the overall mean. Also note that because variables are binary their means represent the percent of firms within each group that score one in any given variable.

Deliverable 1.8.2 23
100% for both remaining groups. Apparently, followers do engage in knowledge-intensive
activities and innovation, but they clearly lag behind firms in the other two groups.
“All-around innovators” (AaIs) are distinguished by their balanced emphasis on knowledge
seeking activities (both in-house and from external sources), on new-to-market product
innovation, and on process and administrative innovation. Interestingly, initial knowledge stock,
as reflected in founders’ average educational attainment, does not seem exceptional; only 20% of
these firms report founders with graduate degrees or higher compared to 57% in the last group.
All-around innovators also do not patent as much as world-class innovators, and more generally
they do not emphasize much intellectual property protection, again as compared to the last group,
except for lead-time advantages.
In contrast, new-to-world product innovation, IPR protection, and knowledge creation stemming
from highly educated founders and human capital seem to be the distinguishing marks of the last
group, hence the label “world-class product innovators” (WcPIs). It is interesting to note that in
this group, firms depend mainly on in-house knowledge creation and less so on knowledge from
external sources (the latter characterizing AaIs). It is perhaps no coincidence that this group is
the least populated in terms of number of firms: 487 compared to 727 for AaIs innovators and
2012 for the “followers”.
In sum, based on the abovementioned results one could say that two types of knowledge-intensive
ventures can be traced in our sample. The first, shows a more balanced emphasis on different
dimensions of innovation and relies mainly on external knowledge seeking, while the second
emphasizes new-to-world innovation based on in-house knowledge which in turn draws from
high quality human capital (both in terms of founders and workforce).

Table 4: Cluster analysis results
(1) (2) (3) (4) (5)
KIE variables Followers All-around Innovators
World-class product
Innovators
Total sample
Knowledge-intensive activities
Knowledge/External-Industry (0/1) 0.428 0.642 0.279 0.454
Knowledge/External-Science (0/1) 0.0586 0.186 0.0657 0.0883
Knowledge/In-house R&D (0/1) 0.415 0.736 0.706 0.531
Knowledge/External-Open sources (0/1) 0.177 0.421 0.240 0.242
Knowledge/Participation in collaborative (0/1) 0.0686 0.241 0.117 0.115
“Initial conditions”
F-team avrg edu attainment (0/1) 0.249 0.199 0.567 0.285
% capital from venture capital (0/1) 0.0119 0.0165 0.0678 0.0214
Human capital & Innovation “input”
%ft employees:Graduate degree (0/1) 0.124 0.0578 0.246 0.127
%ft employees:PhD degree (0/1) 0.0611 0.116 0.246 0.101
Employee training (0/1) 0.360 0.600 0.464 0.430
RD intensity (0/1) 0.167 0.470 0.548 0.293
Innovation performance
Introduced new goods/services last 3 years 0.440 1 1 0.651
New-to-firm (0/1) 0.206 0.283 0.168 0.218
New-to-market (0/1) 0.178 0.476 0.433 0.284
New-to-world (0/1) 0.0567 0.241 0.398 0.150
Introduced process innov last 3 years 0.350 0.817 0.292 0.446
Introduced logistics innov last 3 years 0.275 0.795 0.113 0.368
Introduced innov in support activities last 3 years 0.406 0.935 0.331 0.514
Improved knowl mngnt systems last 3 years 0.414 0.869 0.417 0.517
Changes in management structure the last 3 years 0.258 0.583 0.228 0.327
IPR last 3 years:patents 0.0263 0.213 0.304 0.110
IPR last 3 years:trademarks 0.117 0.519 0.536 0.271
IPR last 3 years:copyrights 0.0721 0.311 0.405 0.176
IPR last 3 years:confidentiality 0.134 0.642 0.932 0.369
IPR last 3 years:secrecy 0.0557 0.510 0.799 0.270
IPR last 3 years:lead_time 0.138 0.757 0.692 0.361
IPR last 3 years:complexity 0.0885 0.612 0.704 0.299
Observations 2012 727 487 3226
Deliverable 1.8.2 25
4.3 Two-way analysis of variance
In order to test the impact of the different types of ventures in terms of their knowledge
intensity (KIE type) as well as the effect of different sectors on dynamic capabilities we have
employed two-way analysis of variance8. This technique allows us to examine the individual
and joint effect of sector and KIE type (independent variables) on one dependent variable,
namely product development capability, technical adaptation, market adaptation capability,
networking capability and participation in collaborations.
Cluster analysis results in the previous section indicated that the firms of our sample can be
differentiated according to their knowledge-intensiveness and innovation capacity as “world-
class innovators” and “all-around innovators” while there is also a large category of firms that
were proved to be “followers” in terms of their knowledge seeking activities, innovation
performance, human capital and innovation input, and “initial conditions” (educational level
of employees and venture capital funding). Furthermore, we follow OECD’s sector
classification presented in detail in the section related to the presentation of the sample i.e.
high-tech and medium-high manufacturing, low and medium-low tech manufacturing, and
KIBS (knowledge intensive technology business services, knowledge intensive market
services).
First it was tested the impact of KIE type and sector on product development capability. There
was a statistically significant main effect for KIE type [F(2, 3208)=73.164, p<0.01]. Post-hoc
comparisons9 indicated that the firms characterized as “all-around innovators” and “world-
class innovators” have a significantly different mean score from firms characterized as
“followers”. This practically means that knowledge-intensive firms appear to develop superior
product development dynamic capabilities compared to “followers”. Furthermore, “all around
innovators” seem to develop product development capabilities to a higher degree than “world
class innovators”. However, the main effect for sector [F(5, 3208)=2.128, p=0.59)] and the
interaction effect of sector and KIE type [F(10, 3208)= 1.471, p=0.144] did not reach
statistical significance.
Our findings suggest that the knowledge-intensive firms of our sample have developed to a
greater extent their product development capabilities compared to the group of “followers”.
This finding may be related to the fact that the first two groups have developed more intensive
knowledge-seeking activities than firms characterized as “followers” and in consequence they
might have developed to a greater degree their capability to sense latent needs, develop novel
8 The two-way analysis of variance results can be found in the Annex II. 9 Post-hoc comparisons included Tukey HSD and Games-Howell test. The mean differences between pairs of groups are significant at the 0.05 level.
Deliverable 1.8.2 26
products and services and promote them into the market. Most interestingly empirical analysis
indicated that “all around innovators” develop and offer novel goods and services to a higher
degree than “world-class innovators”. This finding may be attributed to the fact that “all-
around innovators” are more extrovert in terms of the mechanisms they use to collect new
knowledge and information and perhaps have the possibilities to identify more rapidly new
product development opportunities compared to “world-class innovators” which mainly rely
on their own resources (R&D efforts and patenting activity). Sector classification does not
appear to have a significant effect on product development capability. This finding indicates
that the specific capability is equally important across sector groups because of its decisive
importance for creating and sustaining competitive advantage.
A two-way ANOVA was conducted that examined the effect of KIE type and sector on the
firm’s capability to adapt to market changes. There was a significant main effect of KIE type
on the firm’s capability to sense changes in market and consumer needs [F(2, 3208)=37.576,
p<0.001]. Post-hoc comparisons indicate that there is a statistically significant difference in
the means of firms considered as “followers” and the other two KIE groups. This an expected
result as “followers” have developed to a lesser extent the required knowledge assets that
would enable them to better understand and respond to market transformations In addition,
“all around innovators” appear to adapt more easily/ to a greater extent to market changes
than “world class innovators” possibly as a result of their ability to rely more on the use of
external knowledge sources to capture value and mobilize resources in order to address
market opportunities and achieve competitive advantage.
The Levene’s test of equality of error variances has a significant value which suggests the
variance of our dependent variable (market adaptation) is not equal across the groups
examined. In such a case it is suggested that a more stringent level for evaluating significance
level (e.g. 0.01) is set for evaluating the two-way ANOVA results (Pallant, 2001). Therefore
we assume that the main effect of sector is not significant and thus there is no significant
difference in market adaptation across groups [F(2,3208)=2.654, p=0.021]. The same applies
for the interaction effect of sector and KIE type [F(2,3208)=1.971, p=0.033]. This finding
indicates that the ability of a firm to sense market and customer needs and seek to respond to
them is an important dynamic capability which may affect the competitive advantage of
young firms irrespective of their sector classification.
The two-way ANOVA results testing the impact of KIE type on the firms’ capability to adapt
to technical changes indicate that there is a significant main effect [F(2,3208)=153.136,
p<0.001]. Post-hoc tests reveal that the mean scores for “world-class innovators” and “all-
around innovator” groups are significantly different from the “followers” group indicating

Deliverable 1.8.2 27
that that the first two groups have developed technical adaptability to a greater extent than the
less knowledge-intensive group. This finding may be related to the fact that “world-class” and
“all-around innovators” are involved more intensively in activities that allow them to acquire
knowledge and understand technology advancements better than “followers”. The main
effect for sector is also statistically significant [F(2,3208)=16.950, p<0.001]. Post-hoc
comparisons identified significant statistical mean differences among groups and more
specifically showed that the high-tech group of firms has developed technical adaptability to a
greater extent than low-tech firms and KIBS. This may be attributed to the fact that high-tech
firms should be able to continuously scan for information about potential opportunities and
threats as they are usually active in dynamic environments where rapid response to
technological changes is vital for their survival and growth.
The two-way ANOVA results show a significant effect for KIE type on networking capability
[F(2,3208)=72.648, p<0.001]. Post-hoc comparisons indicate that “world class innovators”
and “all-around innovators” have a significantly different mean score from “followers”, while
“world class” and “all around” innovators also exhibit significantly different means
themselves. More specifically, knowledge-intensive firms tend to be more involved in
different types of networks through which they can gain more resources than their less
knowledge-intensive counterparts. This finding results from the fact that knowledge-intensive
firms have also developed more advanced knowledge-seeking capabilities which practically
allows them to participate more easily and efficiently in different types of interpersonal and
inter-organizational networks. Furthermore “all-around innovators” appear to develop a more
intensive networking activity than “world-class innovators” due to the fact that they follow a
different innovation model i.e. they innovate primarily based on their external knowledge-
seeking activities as opposed to the group of “world-class innovators” which base their
innovative capacity mainly on their internal new knowledge generation ability.
In addition, there was also a significant main effect of sector on networking capability
[F(2,3208)=10.141, p<0.001] Post-hoc tests reveal that either low or high-tech manufacturing
firms appear to be more involved in networks than KIBS. However, we should note that this
is perhaps a counterintuitive finding which would require further research e.g. taking also into
account the heterogeneity of the KIBS firm group.
Finally the results of the two-way ANONA conducted to examine the impact of KIE type and
sector on a firm’s capability to participate in collaborations indicate that there was a
statistically significant main effect for KIE type [F(2, 3208)=120.844, p<0.001]. Post-hoc
tests indicated that “world class’’ innovators (M=2.2, SD=0.81) and “all around innovators”
(M=2.31, SD=0.81) have a significantly different mean score from “followers” (M=1.64,
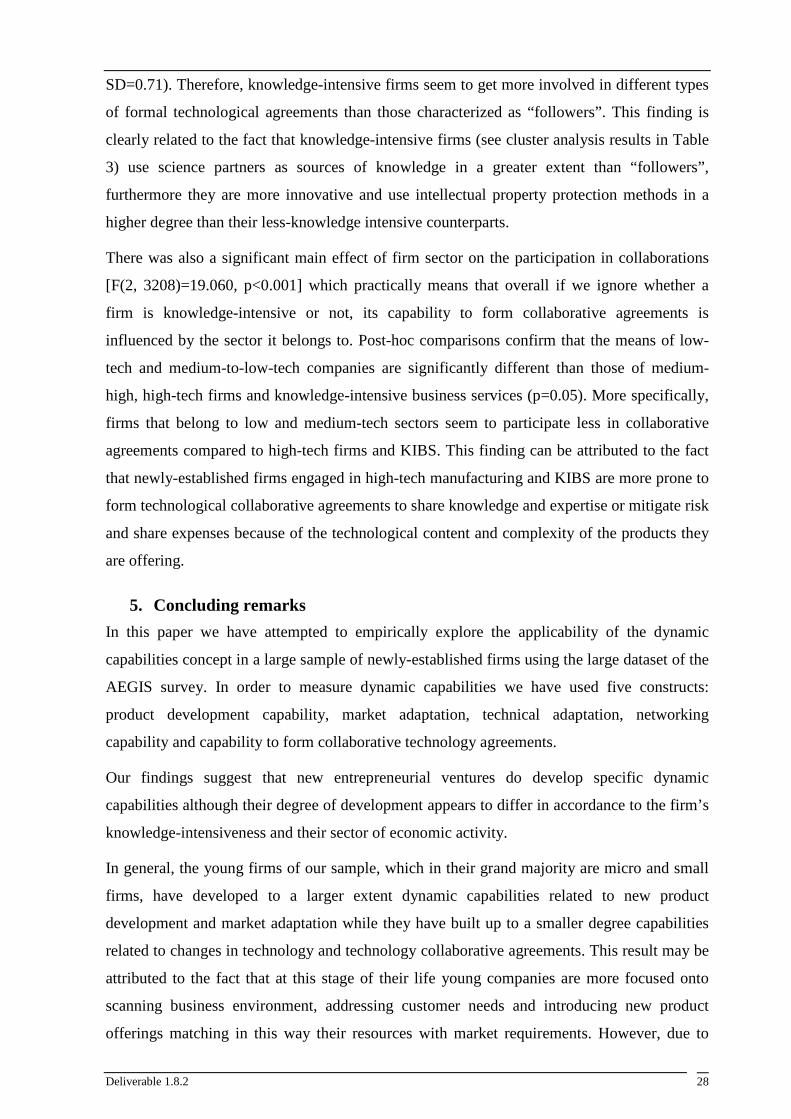
Deliverable 1.8.2 28
SD=0.71). Therefore, knowledge-intensive firms seem to get more involved in different types
of formal technological agreements than those characterized as “followers”. This finding is
clearly related to the fact that knowledge-intensive firms (see cluster analysis results in Table
3) use science partners as sources of knowledge in a greater extent than “followers”,
furthermore they are more innovative and use intellectual property protection methods in a
higher degree than their less-knowledge intensive counterparts.
There was also a significant main effect of firm sector on the participation in collaborations
[F(2, 3208)=19.060, p<0.001] which practically means that overall if we ignore whether a
firm is knowledge-intensive or not, its capability to form collaborative agreements is
influenced by the sector it belongs to. Post-hoc comparisons confirm that the means of low-
tech and medium-to-low-tech companies are significantly different than those of medium-
high, high-tech firms and knowledge-intensive business services (p=0.05). More specifically,
firms that belong to low and medium-tech sectors seem to participate less in collaborative
agreements compared to high-tech firms and KIBS. This finding can be attributed to the fact
that newly-established firms engaged in high-tech manufacturing and KIBS are more prone to
form technological collaborative agreements to share knowledge and expertise or mitigate risk
and share expenses because of the technological content and complexity of the products they
are offering.
5. Concluding remarks
In this paper we have attempted to empirically explore the applicability of the dynamic
capabilities concept in a large sample of newly-established firms using the large dataset of the
AEGIS survey. In order to measure dynamic capabilities we have used five constructs:
product development capability, market adaptation, technical adaptation, networking
capability and capability to form collaborative technology agreements.
Our findings suggest that new entrepreneurial ventures do develop specific dynamic
capabilities although their degree of development appears to differ in accordance to the firm’s
knowledge-intensiveness and their sector of economic activity.
In general, the young firms of our sample, which in their grand majority are micro and small
firms, have developed to a larger extent dynamic capabilities related to new product
development and market adaptation while they have built up to a smaller degree capabilities
related to changes in technology and technology collaborative agreements. This result may be
attributed to the fact that at this stage of their life young companies are more focused onto
scanning business environment, addressing customer needs and introducing new product
offerings matching in this way their resources with market requirements. However, due to

Deliverable 1.8.2 29
their liability of newness and limited resources their effort related to adapting their
technologies (radical change in their resource base in terms of acquisition or transformation)
is less intensive indicating they are more likely to adopt an altered use of existing resources in
order to address changing circumstances at the market side.
It is important to note that our findings indicate that NPD and market sensing capability are
equally important in both high-tech and traditional mature markets as they are both considered
as important drivers for sustaining profitability and business growth. It is rather sensible that
especially new companies that are striving to earn and keep a piece of the pie by creating or
entering markets invest on and develop both market sensing and NPD capabilities. Shorter life
cycles of products and the aggressiveness of global markets intensify strategies of all types of
companies towards translating market messages into new products ready to entice customers.
However, our findings also suggest that high-tech manufacturing firms have developed
technical adaptability to a greater extent than low-tech firms and KIBS. This may be
attributed to the fact that high-tech firms should be able to continuously scan for information
about potential opportunities and threats as they are usually active in dynamic environments
where rapid response to technological changes is vital for their survival and growth.
Furthermore, firms that belong to low and medium-tech sectors participate less in technology
collaborative agreements compared to high-tech manufacturing firms and KIBS. This finding
indicates that participation in specific collaborative agreements is significantly related to the
technological content and complexity of the products offered.
Our findings also suggest that the more knowledge-intensive firms, i.e. firms that have more
knowledge assets and exhibit better innovative performance (characterized as ‘world class
innovators’ or ‘all around innovators’) have developed to a greater extent all types of dynamic
capabilities compared to their less knowledge-intensive counterparts, i.e. ‘followers’.
Therefore it appears that a firm’s increased knowledge resources and endowments (i.e.
knowledge-seeking activities, human capital and innovation inputs) support the creation and
further development of dynamic capabilities which in turn may help the new firm survive and
grow.
In sum, our findings empirically support the assertion that dynamic capabilities can be present
in newly-established firms that in their majority are micro and small firms. The degree of DCs
development is dependent on the firm knowledge base suggesting that knowledge assets and
human capital are important for DCs creation and further nurturing. DCs also exist in low-
tech firms although capabilities such as technical adaptation and technology collaborative
agreements are present in a smaller degree compared to high-tech firms. Last, but not least our

Deliverable 1.8.2 30
empirical analysis was applied to a large number of firms operating in ten European countries
and therefore confirmed the generalizability of our results in different national contexts.
6. References
Abro Q. M. M., N. A. Memon, P. I. A. S. Arshdi, (2011), ‘Dynamic Capabilities and Firm Performance: A Case of Two SMEs in Pakistan’, Mehran University Research Journal of Engineering & Technology, Vol. 30, No. 3, [ISSN 0254-7821]
Alvarez, V.S. and Merino, T.G. (2003), “The history of organizational renewal: evolutionary models of Spanish savings and loans institutions”, Organization Studies, 24, 1437–1461.
Ambrosini V, Bowman C, Collier N. (2009), “Dynamic capabilities: an exploration of how firms renew their resource base”, British Journal of Management 20(S1): S9–S24.
Arthurs, J.A., and Busenitz, L.W., (2006), “Dynamic Capabilities and New Venture Performance: The Moderating Effects of Venture Capitalists”, Journal of Business Venturing, 21, 195-215.
Barthélemy, J. and Quélin, B. V. (2006). ‘Complexity of outsourcing contracts and ex post transaction costs: an empirical investigation’. Journal of Management Studies, 43, 1775–97.
Baum, J. & Oliver, C. (1991) “Institutional Linkages and Organizational Mortality.”, Administrative Science Quarterly, 36: 187-218.
Boccardelli, P. and Magnusson, M. G. (2006) “Dynamic Capabilities in Early-Phase Entrepreneurship”, Knowledge and Process Management, 13 (3), pp. 162-174
Borch, O. & Madsen, E., (2007), “Dynamic capabilities facilitating innovative strategies in SMEs”, International Journal of Technoentrepreneurship, 1(1), 109-125
Birkinshaw, J., Hamel, G., & Mol, M. (2008)” Management innovation”, Academy of Management.”, The Academy of Management Review, 33(4): 825
Bruni, D. S., Verona, G., (2009) “Dynamic Marketing Capabilities in Science-based Firms: an Exploratory Investigation of the Pharmaceutical Industry”, British Journal of Management 20, pp.101–S117.
Caloghirou Y., (2004)” Firm-specific effects on performance: Contrasting SMEs and large-sized firms”, European Management Journal, 22(2): 231–243 Chirico F., (2007) “The value creation process in family firms. A dynamic capabilities approach”, Electronic Journal of Family Business Studies (EJFBS), Vol. ½, pp.137-167
Colombo M. G., E. Piva, A. Quas, C. Rossi-Lamastra, (2010), Dynamic capabilities during the global crisis: evidence from Italian New Technology Based Firms. Available at SSRN: http://ssrn.com/abstract=1722507 or doi:10.2139/ssrn.1722507
Danneels, E. (2002), ‘The dynamics of product innovation and firm competences,’ Strategic Management Journal, 23(12), 1095–1121.
Dahl M.S.. Pedersen C.O.R. (2004), “Knowledge flows through information contracts in industrial districts: myth or reality?”, Research Policy, 33. p. 1673-1686
Deeds, D.L., DeCarolis, D. and Coombs, J. (1999) “Dynamic capabilities and new product development in high technology ventures: an empirical analysis of new biotechnology firms”, Journal of Business Venturing, 15, 211–229.
DeSarbo, W. S., Benedetto, C. A., Song, M. and Sinha, I. (2005), ‘Revisiting the miles and snow strategic framework: uncovering interrelationships between strategic types, capabilities, environmental uncertainty,and firm performance’, Strategic Management Journal, 26, 47–74
Di Stefano, G., M. Peteraf and G. Verona (2010), ‘Dynamic capabilities deconstructed: a bibliographic investigation into the origins, development, and future directions of the research,’ Industrial and Corporate Change, e-pub ahead of print, doi: 10.1093

Deliverable 1.8.2 31
Doeving E & P. Gooderham, (2008), “Dynamic capabilities as antecedents of the scope of related diversification: the case of small firm accountancy practices”, Strategic Management Journal, Vol., 29: 841–857
Drnevich, Paul L.; Marino, Louis D.; and Withers, Michael C. (2008) "How do firms leverage innovation-capabilities for repeat innovation?”, Frontiers of Entrepreneurship Research: Vol. 28: Iss. 19, Article 8.
Dunning, J. H. and S. M. Lundan (2010), ‘The institutional origins of dynamic capabilities in multinational enterprises,’ Industrial and Corporate Change, e-pub ahead of print, doi:10.1093/icc/dtq029.
Easterby-Smith, M. A., M. A. Lyles and Peteraf (2009), ‘Dynamic capabilities: current debates and future directions,’ British Journal of Management, 20, S1–S8.
Eisenhardt, K. M. and J. A. Martin (2000), ‘Dynamic capabilities: what are they?’ Strategic
Management Journal, 21(10–11), 1105–1121.
Ellonen HK, Wikström P, Jantunen A (2009). Linking dynamic capability portfolios and innovation outcomes. Technovation, 29:753-762.
Evers, N. (2011), "International new ventures in low-tech sectors - a dynamic capabilities perspective", Journal of Small Business & Enterprise Development (forthcoming)
Fischer T., H. Gebauer, M. Gregory, G. Ren, E. Flesch, (2010), “Exploitation or exploration in service business development? Insights from a dynamic capabilities perspective”, Journal of Service Management, Vol. 21 No. 5, pp. 591-624
Foss L., T. Iakovleva, J. Kickul, Elin (2010), “The role of microfoundations in explicating dynamic capabilities: A case study of the Norwegian petroleum sector “, Oftedal & Anne Solheim chapter in M. van Geenhuizen, W. Nuttall, D. V. Gibson (eds), Energy and innovation: structural change and policy implications, Purdue University, Press, Business & Economics USA 3, ISBN 978-1-55753-578-8
Foss, N., Husted, K. & Michailova, S. (2010), 'Governing Knowledge Sharing in Organizations: Levels of Analysis, Governance Mechanisms, and Research Directions.' Journal of Management Studies, 47:3, 455-82.
Garnsey, E. (1998) ‘A Theory of the Early Growth of the Firm’, Industrial and Corporate Change, 7: 523-556.
Ge B., and B. Dong (2009) “Dynamic Capabilities and Firm Performance: An Empirical Study of Chinese New Ventures”, Fourth International Conference on Cooperation and Promotion of Information Resources in Science and Technology, Pub. IEEE, Pages: 113-117, ISBN: 9780769538983, DOI: 10.1109/COINFO.2009.13
Grande J., (2011), ‘New venture creation in the farm sector – Critical resources and capabilities’, Journal of Rural Studies, Vol. 27, 2, pp. 220-233.
Grimpe, C. and U. Kaiser (2010), “Balancing Internal and External Knowledge Acquisition: The Gains and Pains of R&D Outsourcing”, Journal of Management Studies 47(8), 1483-1509.
Helfat, C. E. (1997), ‘Know-how and asset complementarity and dynamic capability accumulation: the case of R&D,’ Strategic Management Journal, 18(5), 339–360.
Helfat, C. E., S. Finkelstein, W. Mitchell, M. A. Peteraf, H. Singh, D. J. Teece and S. G. Winter (2007), Dynamic Capabilities: Understanding Strategic Change in Organization. Blackwell Publishing: Malden MA.
Helfat C. E. and M. A. Peteraf (2009), ‘Understanding dynamic capabilities: Progress along a development path’, Strategic Organization. 7 (1).
Haeussler, C., L. Jiang, J. Thursby, and M. Thursby, (2010), “Strategic alliances and product development in high technology new firms: The moderating effect of technological capabilities”, J. Bus. Venturing doi:10.1016/j.jbusvent.2010.10.002
Henderson, R., & Clark, K. (1990), “Architectural Innovation: The Reconfiguration of Existing Product Technologies and the Failure of Established Firms.”, Administrative Science Quarterly, 35, 9-30.

Deliverable 1.8.2 32
Iansiti M., Clark K., (1994), “Integration and dynamic capability: Evidence from product development in automobiles and mainframe computers”. Industrial and Corporate Change, 3 (3): 557-605
Jantunen A., K. Puumalainen, S. Saarenketo, K. Kylaheiko,(2005), “Entrepreneurial Orientation, Dynamic Capabilities and International Performance”, Journal of International Entrepreneurship, 3, 223–243
Kale, P., and Singh, H. (2007), “Building firm capabilities through learning: The role of the alliance learning process inalliance capability and firm-level alliance success”, Strategic Management Journal, 28: 981-1000.
Karagouni G., Kalesi M.,(2011), “Knowledge intensive entrepreneurship and dynamic capabilities in low tech SMEs: Evidence from the Greek food sector”, MIBES Transaction On Line electronic version available at http://mibes.teilar.gr, ISSN 1790-9899, Vol. 5/2, pp. 1-19
Karagouni G., (2011), “Autotelic Capabilities and Knowledge Intensive Entrepreneurship in Low Tech Sectors”, 4th Annual EuroMed Conference of the EuroMed Academy of Business, ISBN: 978-9963-711-01-7, pp 946-949, October 20th-21st, 2011, Elounda, Crete, Greece
Kogut, B. (1991), ‘‘Joint ventures and the option to expand and acquire’’, Management Science, Vol. 37/1, pp. 19-34
Kuuluvainen A., (2011), “Dynamic capabilities in the international growth of SME: Case study from Finland’, ICSB (International Council for Small Busines) -conference , Stockholm, Sweden, 15-18 June, 2011
Lambe, C.J., Spekman, R.E. and Hunt, S.D. (2002), ‘‘Alliance competence, resources, and alliance success: conceptualization, measurement, and initial test’’, Journal of the Academy of Marketing Science, Vol. 30 No. 2, pp. 141-58.
Lampel, J. and Shamsie, J. (2003), “Capabilities in motion: new organizational forms and the reshaping of the Hollywood movie industry”, Journal of Management Studies, 40, 2189–2210.
Lechner, C. and Dowling, M. (2003), “Firm networks: External relationships as sources for the growth and competitiveness of entrepreneurial firms”, Entrepreneurship & Regional Development, 15, 1–26.
Littunen, H. (2000), “Networks and Local Environmental Characteristics in the Survival of New Firms”, Small Business Economics, 15, pp. 59-71
McKelvie A, Davidsson P. (2009) “From resource base to dynamic capabilities: an investigation of new firms”, British Journal of Management 20: S63–S80.
Marcus, A. A. and M. H.Anderson, (2006), “A general dynamic capability: Does it propagate business and social competencies in the retail food industry?”, Journal of Management Studies, 43: 19-46.
Nakamura, M., (2003) “Research alliances and collaborations: introduction to the special issue”, Managerial and Decision Economics 24, 47–49
Newbert, S.L. (2005), “New firm formation: a dynamic capability perspective. “, Journal of Small Business Management, 43(1), 55–77.
O'Gorman C., N. Evers, (2011) "Network intermediaries in the internationalisation of new firms in peripheral regions", International Marketing Review, Vol. 28 Iss: 4, pp.340 - 364
Pablo, A., Reay, T., Dewald, J.R. and Casebeer, A.L. (2007), “Identifying, enabling and managing dynamic capabilities in the public sector”, Journal of Management Studies, 44, 687–708
Park, S. H., Chen, R., & Gallagher, S. (2002). “Firm resources as moderators of the relationship between market growth and strategic alliances in semiconductor start-ups.”, Academy of Management Journal, 45: 527–545.
Paun F., N. von Tunzelmann and P. Richard, (2010), "Transferring new dynamic capabilities to SMEs: the role of ONERA – the French Aerospace Lab in promoting asymmetries management”, Innovation Forum : environment, Innovation and Sustainable development”, Marseilles : France

Deliverable 1.8.2 33
Paul S. M., D. S. Mytelka, C. T. Dunwiddie, C. C. Persinger, B. H. Munos, S. R. Lindborg & A. L. Schacht, (2010), „How to improve R&D productivity: the pharmaceutical industry’s grand challenge”, Nature Reviews Drug Discovery 9, 203-214 Pavlou P. and El Sawy, O. (2011), “Understanding the Elusive Black Box of Dynamic Capabilities”, Decision Sciences, Vol. 42/ 1, pp. 239–273
Penrose, E.T. (1959), The Theory of the Growth of the Firm. New York: John Wiley.
Pitelis C. N. and D. J. Teece, (2010), “Cross-border market co-creation, dynamic capabilities and the entrepreneurial theory of the multinational enterprise”, Industrial and Corporate Change, vol. 19/ 4, pp. 1247-1270
Poulis J. (2009), “ Dynamic capabilities in complex environments. Assessing the dynamic capabilities view: spare change, everyone?” Strategic Organization 2009 7: 75
Protogerou A., Y. Caloghirou and S. Lioukas, (2011), “Dynamic capabilities and their indirect impact on firm performance “,Industrial and Corporate Change, pp. 1–33, doi:10.1093/icc/dtr049
Quentier, J-M., (2011), “International New Ventures in the Commodity Sector: A Dynamic Capabilities Perspective”, IABD 23rd Annual Conference, New Orleans, Louisiana, USA, April 7-9
Rafailidis A. and G. Tselekidis (2009), “Dynamic capabilities, change and innovation in Greek SMEs: a preliminary study”, International Journal of Entrepreneurship and Small Business Vol. 7/.4, pp. 404 - 419
Rindova, V., and S. Kotha, (2001), “Continuous "morphing": Competing through dynamic capabilities, form, and function” , Academy of Management Journal, 44(6): 1263-1280.
Rothaermel, F. and Boeker, W. (2008), ‘‘Old technology meets new technology: complementarities, similarities and alliance formation’’, Strategic Management Journal, Vol. 29 No. 1, pp. 47-77
Salunke S., J. Weerawardena, J. R. McColl-Kennedy (2011), “Towards a model of dynamic capabilities in innovation-based competitive strategy: Insights from project-oriented service firms”, downloaded from: http://eprints.qut.edu.au/47017/ [in press, (2011)] DOI:
http://www.sciencedirect.com/science/journal/00198501
Salvato, C. (2003), “The role of micro-strategies in the engineering of firm evolution”, Journal of Management Studies, 40(1), 83–108.
Salvato, C., and Melin, L. (2003), “Competitive Advantage of Family Business. A Dynamic Capabilities Perspective.”, Research Forum Proceedings, FBN, 14th world conference
Sapienza, H. J., Autio, E., George, G., & Zahra, S. A. (2006), “A capability perspective on the effects of early internationalization on firm survival and growth”, Academy of Management Review, 31: 914–933.
Sciascia, S., Alberti, G.F., Salvato, C., (2009), “Firm-level entrepreneurial contents for strategic renewal: A knowledge-based perspective. in G.T. Lumpkin, Jerome A. Katz (ed.) Entrepreneurial Strategic Content (Advances in Entrepreneurship, Firm Emergence and Growth, Volume 11), Emerald Group Publishing Limited, pp.41-75.
Simon, A., (2010), “Resources, dynamic capabilities and Australian business success.”, Management Science / Operations Research , Miscellaneous Papers, Journal of Global Business Technology, Vol. 6/ 2, Pp: 12-31, ISSN: 15535495
Schutjens, V. and Stam, E. (2003), “The evolution and nature of young firm networks: a longitudinal perspective”, Small Business Economics, 21, 115-134
Spanos, Y. E. and S. Lioukas (2001), ‘An examination into the causal logic of rent generation: contrasting Porter’s competitive strategy framework and the resource-based perspective,’Strategic Management Journal, 22(10), 907–934.
Srinivasan R, G. L. Lilien, A. Rangaswamy, (2002) “The Role of Technological Opportunism in Radical Technology Adoption: An Application to e-Business,” Journal of Marketing, Vol. 66, No. 3 (July), p. 47-60.

Deliverable 1.8.2 34
Stam, E., P. Gibcus, J. Telussa, and E. Garnsey (2007), “Employment Growth of New Firms," Scales Research Reports H200716, EIM Business and Policy Research
Stam, E. (2008), ‘Entrepreneurship and Innovation Policy’, Jena Economic Research Paper, 006-2008
Stam E. and K. Wennberg,(2009), “The roles of R&D in new firm growth”, Small Business Economy, 33:77–89
Teece, D. J. (2007), ‘Explicating dynamic capabilities: the nature and microfoundations of
(sustainable) enterprise performance,’ Strategic Management Journal, 28(13), 1319–1350.
Teece, D. J., G. Pisano and A. Shuen (1997), ‘Dynamic capabilities and strategic management,’ Strategic Management Journal, 18(7), 509–533
Telussa, J., Stam, E. y Gibcus, P. (2006) “Entrepreneurship, Dynamic Capabilities and New Firm Growth”, Working Paper H200623, Netherlands: Scientific Analysis of Entrepreneurship and SMEs
Tikkanen U. (2010) “Capability evolution in the Finnish forest cluster: a qualitative approach”, in J. Lamberg and M.Peltoniemi, Capabilities and competitive advantage in the forest industry, eprints.herce.fi/201/.../RAMI_Capabilities_Final_Report_12052010.p.
Tsekouras G., E. Poulis, K. Poulis, (2011) "Innovation and dynamic capabilities in a traditional service sector: Evidence from shipping companies", Baltic Journal of Management, Vol. 6 / 3, pp.320 – 341
Wall, S., C. Zimmermann, R. Kliengebiel and D. Lange (2010), Strategic Reconfigurations: Building Dynamic Capabilities in Rapid Innovation-Based Industries, Edward Elgar: Cheltenham: UK.
Wang Y., X. Shi, (2011) "Thrive, not just survive: enhance dynamic capabilities of SMEs through IS competence", Journal of Systems and Information Technology, Vol. 13 / 2, pp.200 - 222
West, III, P.G. & DeCastro, J. (2001), The Achilles heal of firm strategy: resource weaknesses and distinctive inadequacies, Journal of Management Studies, 38(3): 417-442.
Weerawardena, J., Sullivan Mort, G., Liesch, P. W., & Knight, G. (2007), “Conceptualizing accelerated internationalization in the born global firm: A dynamic capabilities perspective.”, Journal of World Business, 42: 294–306.
Winter, S. G. (2003), ‘Understanding dynamic capabilities,’ Strategic Management Journal, 24(10), 991–995.
Wu L-Y, (2006), “Resources, dynamic capabilities and performance in a dynamic environment: Perceptions in Taiwanese IT enterprises”, Information & Management 43, 447–454
Wu L-Y, (2007), ”Entrepreneurial resources, dynamic capabilities and start-up performance of Taiwan's high-tech firms”, Journal of Business Research 60, 549–555
Zahra, S. A. and I. Filatotchev (2004), ‘Governance of the entrepreneurial threshold firm: a knowledge-based perspective’, Journal of Management Studies, 41, pp. 885–897.
Zahra, S. A., H. J. Sapienza and P. Davidsson (2006), ‘Entrepreneurship and dynamic capabilities: a review, model and research agenda,’ Journal of Management Studies, 43(4),918–955.
Zollo M, Winter SG. (2002), “Deliberate learning and the evolution of dynamic capabilities.”, Organization Science 13(3): 339-351
Zúñiga- -Vicente, J. Α., & Vicente-Lorente, J. D. (2006), “Strategic moves and organizational survival in turbulent environments: The Case of Spanish Banks (1983-97).”, Journal of Management Studies, 43: 485-519
Yli-Renko H, Autio E & Sapienza HJ. (2001), “Social Capital, Knowledge Acquisition, and Knowledge Exploitation in Young Technology-Based Firms”, Strategic Management Journal 22: 587-613

Deliverable 1.8.2 35
Annex 1 CFA analysis results
Table A11: CFA analysis results for sensing capability
Sensing capability Construct indicators Standardized first-order loadings
Market adaptation
Our firm actively observes and adopts the best practices in our sector
0.650a
Our firm responds rapidly to competitive moves 0.707*
We change our practices based on customer feedback 0.676*
Our firm regularly considers the consequences of changing market demand in terms of new products and services
0.750*
Our firm is quick to recognize shifts in our market (e.g. competition, regulation, demography)
0.779*
We quickly understand new opportunities to better serve our customers
0.770*
Technological adaptation
Employees share practical experiences on a frequent basis
0.524a
There is a formal R&D department in our firm 0.640*
There is a formal engineering and technical studies department in our firm
0.719*
Design activity is important in introducing new products/services to the market
0.455*
Goodness-of-fit statistics
χ2(d.f.) 920.378(35) p=0.00
CFI 0.911
RMSEA 0.79 a Loadings are fixed to 1 for identification purposes. All factor loadings are significant at p <0.05 level.
Table A12: CFA analysis results
Firm capability Construct indicators Standardized first-order loadings
New product development capability
Capability to offer novel products/services 0.712a
Capacity to adapt the products/services to the specific needs of different customers/market niches
0.484*
Marketing and promotion activities 0.407*
R&D and alliance related capabilities
R&D activities 0.761a
Establishment of alliances/partnerships with other firms 0.406*
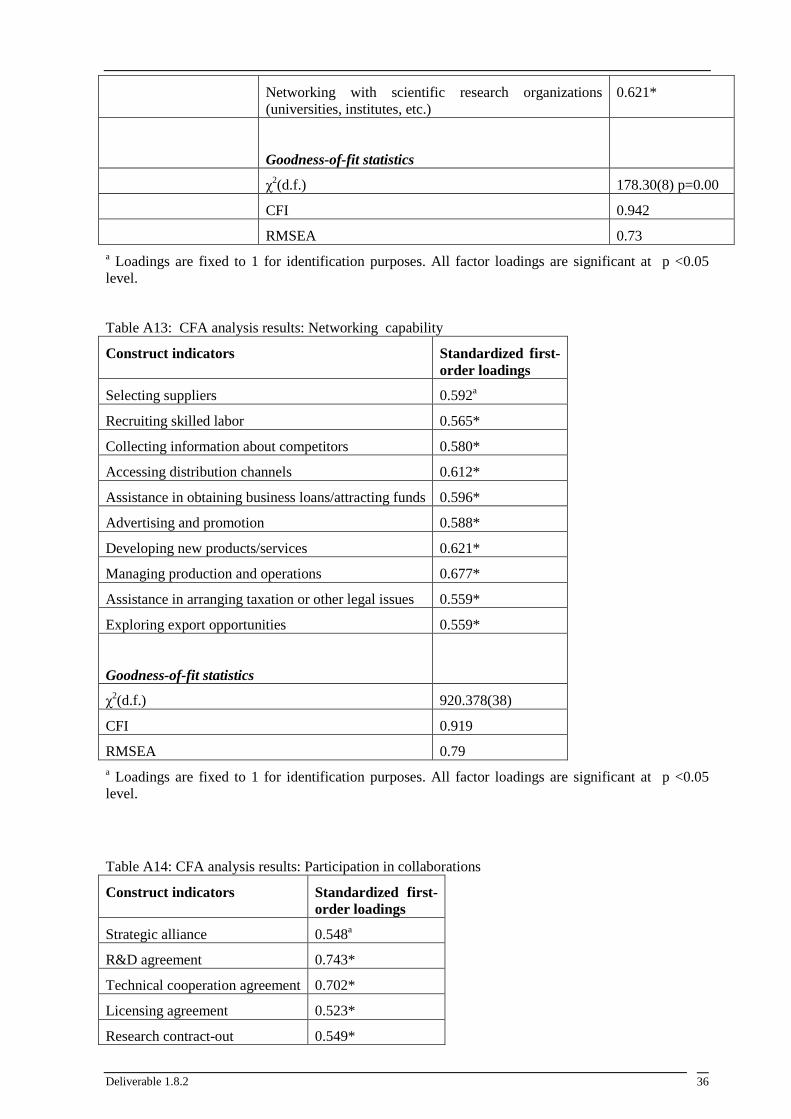
Deliverable 1.8.2 36
Networking with scientific research organizations (universities, institutes, etc.)
0.621*
Goodness-of-fit statistics
χ2(d.f.) 178.30(8) p=0.00
CFI 0.942
RMSEA 0.73 a Loadings are fixed to 1 for identification purposes. All factor loadings are significant at p <0.05 level.
Table A13: CFA analysis results: Networking capability
Construct indicators Standardized first-order loadings
Selecting suppliers 0.592a
Recruiting skilled labor 0.565*
Collecting information about competitors 0.580*
Accessing distribution channels 0.612*
Assistance in obtaining business loans/attracting funds 0.596*
Advertising and promotion 0.588*
Developing new products/services 0.621*
Managing production and operations 0.677*
Assistance in arranging taxation or other legal issues 0.559*
Exploring export opportunities 0.559*
Goodness-of-fit statistics
χ2(d.f.) 920.378(38)
CFI 0.919
RMSEA 0.79 a Loadings are fixed to 1 for identification purposes. All factor loadings are significant at p <0.05 level.
Table A14: CFA analysis results: Participation in collaborations
Construct indicators Standardized first-order loadings
Strategic alliance 0.548a
R&D agreement 0.743*
Technical cooperation agreement 0.702*
Licensing agreement 0.523*
Research contract-out 0.549*

Deliverable 1.8.2 37
Goodness-of-fit statistics
χ2(d.f.) 160.688(5) p=0.00
CFI 0.963
RMSEA 0.88 a Loadings are fixed to 1 for identification purposes. All factor loadings are significant at p <0.05 level.
CFI and RMSEA measures (CFI >0.9 and RMSEA <0.9) indicate an acceptable fit of the data to the constructs tested.
Table A15: Reliability analysis for CFA constructs
Constructs Cronbach’s Alpha
Market adaptation 0.857
Technical adaptation 0.617
New product development capability 0.611
Networking capability 0.845
Participation in technological collaborations 0.742
All capabilities constructs can be considered as reliable based on Cronbach’s Alpha indicator (>0.6).
Annex 2
Two-way analysis of variance results
1. Dependent variable: Product development capability
Table A21: Descriptive statistics (mean scores)
Technology class Followers All-around innovators
World-class innovators
Total sample
Total N
Low-tech 3.6 4.2 3.9 3.8 1066
Medium-low (LT=ref)
3.3 3.9 4.3 3.5 212
Medium-high 3.6 4.2 4.0 3.8 262
High-tech 3.7 4.2 3.8 3.9 103
KIHTS* 3.7 4.0 4.0 3.9 506
KI Market services
3.5 4.1 3.8 3.6 1077
Total 3.5 4.1 3.9 3.7 3226
*KIHTS: Knowledge-intensive high-tech business services
Table A22: Tests of Between-Subjects Effects (Dependent Variable: Capability/Product related)
Source Type III df Mean Square F Sig. Partial Eta
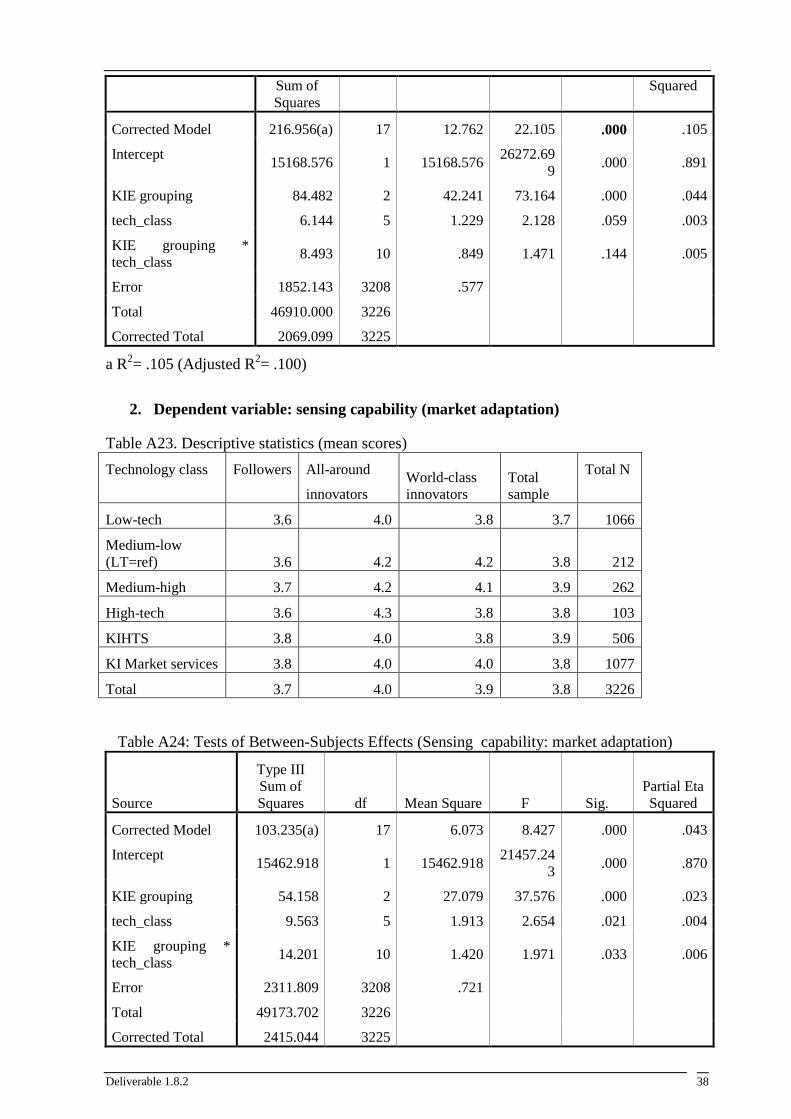
Deliverable 1.8.2 38
Sum of Squares
Squared
Corrected Model 216.956(a) 17 12.762 22.105 .000 .105
Intercept 15168.576 1 15168.576
26272.699
.000 .891
KIE grouping 84.482 2 42.241 73.164 .000 .044
tech_class 6.144 5 1.229 2.128 .059 .003
KIE grouping * tech_class
8.493 10 .849 1.471 .144 .005
Error 1852.143 3208 .577
Total 46910.000 3226
Corrected Total 2069.099 3225
a R2= .105 (Adjusted R2= .100)
2. Dependent variable: sensing capability (market adaptation)
Table A23. Descriptive statistics (mean scores)
Technology class Followers All-around
innovators World-class innovators
Total sample
Total N
Low-tech 3.6 4.0 3.8 3.7 1066
Medium-low (LT=ref) 3.6 4.2 4.2 3.8 212
Medium-high 3.7 4.2 4.1 3.9 262
High-tech 3.6 4.3 3.8 3.8 103
KIHTS 3.8 4.0 3.8 3.9 506
KI Market services 3.8 4.0 4.0 3.8 1077
Total 3.7 4.0 3.9 3.8 3226
Table A24: Tests of Between-Subjects Effects (Sensing capability: market adaptation)
Source
Type III Sum of Squares df Mean Square F Sig.
Partial Eta Squared
Corrected Model 103.235(a) 17 6.073 8.427 .000 .043
Intercept 15462.918 1 15462.918
21457.243
.000 .870
KIE grouping 54.158 2 27.079 37.576 .000 .023
tech_class 9.563 5 1.913 2.654 .021 .004
KIE grouping * tech_class
14.201 10 1.420 1.971 .033 .006
Error 2311.809 3208 .721
Total 49173.702 3226
Corrected Total 2415.044 3225

Deliverable 1.8.2 39
a R2= .043 (Adjusted R2= .038)
3. Dependent variable: Sensing capability: technology adaptation
Table A25: Descriptive statistics (mean scores)
Technology class Followers All-around innovators
World-class innovators
Total sample
Total N
Low-tech 2.2 2.8 2.7 2.4 1066
Medium-low (LT=ref)
2.3 3.0 3.1 2.5 212
Medium-high 2.4 3.5 3.7 2.9 262
High-tech 2.2 3.7 3.8 3.0 103
KIHTS 2.2 3.2 3.1 2.7 506
KI Market services 2.0 2.9 2.8 2.3 1077
Total 2.2 3.0 3.0 2.5 3226
Table A26: Tests of Between-Subjects Effects (Dependent variable: sensing capability: Technical adaptation)
Source
Type III Sum of Squares df Mean Square F Sig.
Partial Eta Squared
Corrected Model 676.791(a) 17 39.811 36.448 .000 .162
Intercept 8324.505 1 8324.505 7621.240 .000 .704
KIE grouping 334.534 2 167.267 153.136 .000 .087
tech_class 92.573 5 18.515 16.950 .000 .026
KIE grouping * tech_class
42.101 10 4.210 3.854 .000 .012
Error 3504.025 3208 1.092
Total 24282.528 3226
Corrected Total 4180.815 3225
a R2= .162 (Adjusted R2= .157)
4. Dependent variable: Networking capability
Table A27: Descriptive statistics (mean scores)
Technology class Followers All-around innovators
World-class innovators
Total sample
Total N
Low-tech 3.0 3.6 3.0 3.2 1066
Medium-low (LT=ref) 2.9 3.5 3.2 3.1
212
Medium-high 3.1 3.6 3.0 3.2 262

Deliverable 1.8.2 40
High-tech 3.1 3.6 2.8 3.1 103
KIHTS 2.6 3.2 3.0 2.9 506
KI Market services 2.6 3.4 2.9 2.8 1077
Total 2.8 3.5 3.0 3.0 3226
Table A28: Tests of Between-Subjects Effects (Dependent variable networking capability)
Source
Type III Sum of Squares df Mean Square F Sig.
Partial Eta Squared
Corrected Model 323.029(a) 17 19.002 28.813 .000 .132
Intercept 9867.011 1 9867.011
14961.558
.000 .823
KIE grouping 95.821 2 47.910 72.648 .000 .043
tech_class 33.439 5 6.688 10.141 .000 .016
KIE grouping * tech_clas
17.622 10 1.762 2.672 .003 .008
Error 2115.647 3208 .659
Total 31419.900 3226
Corrected Total 2438.676 3225
a R2= .132 (Adjusted R2= .128)
5. Dependent variable: Participation in alliances
Table Α29: Descriptive statistics (mean scores)
Technology class Followers All-around innovators
World-class innovators
Total Total N
Low-tech 1.5 2.1 1.9 1.7 1066
Medium-low (LT=ref)
1.6 2.0 2.1 1.7 212
Medium-high 1.7 2.4 2.4 2.0 262
High-tech 1.7 2.6 2.2 2.0 103
KIHTS 1.9 2.5 2.5 2.2 506
KI Market services 1.7 2.5 2.1 1.9 1077
Total 1.6 2.3 2.2 1.9 3226
Table A210: Tests of Between-Subjects Effects (Dependent variable: Participation in collaborations)
Source
Type III Sum of Squares df Mean Square F Sig.
Partial Eta Squared

Deliverable 1.8.2 41
Corrected Model 377.727(a) 17 22.219 37.477 .000 .166
Intercept 4337.598 1 4337.598 7316.168 .000 .695
KIE group 143.291 2 71.646 120.844 .000 .070
tech_class 56.503 5 11.301 19.060 .000 .029
KIE group * tech_class
14.227 10 1.423 2.400 .008 .007
Error 1901.954 3208 .593
Total 13731.040 3226
Corrected Total 2279.681 3225
a R2= .166 (Adjusted R2= .161)