adverse selection and the rights offer paradox · pdf fileadverse selection and the rights...
TRANSCRIPT
Adverse Selection and the Rights Offer Paradox∗
B. Espen Eckbo
Faculty of Commerce and Business Administration
The University of British Columbia
Vancouver, B.C.
Canada V6T 1Y8
Ronald W. Masulis
Owen Graduate School of Management
Vanderbilt University
Nashville, Tennessee 37203
July 1992
Forthcoming in the Journal of Financial Economics
Abstract
We develop an analytical framework to explain firms’ choice of equity flotation methodand the puzzling near-disappearance of rights offers by U.S. exchange-listed firms. The choicebetween uninsured rights, rights with standby underwriting, and firm commitment underwritingdepends on information asymmetries, shareholder characteristics, and direct flotation costs.Underwriter certification and current shareholder takeup are viewed as substitute mechanismsfor minimizing wealth transfers between shareholders and outside investors. Uninsured rightscreate severe adverse selection effects when shareholder takeup is low. Implications for stockprice behaviour around issue announcements, shareholder subscription precommitments, andrelative issue frequencies are supported by large-sample evidence.
∗We have received helpful comments from Øyvind Bøhren, Harry DeAngelo, Ron Giammarino, Clifford Smith (theeditor) and, in particular, the referee, Michael Barclay. We also wish to thank numerous colleagues in finance seminarsat the Australian Graduate School of Management, Boston College, the European Institute for Advanced Studiesin Management, London Business School, New York University, the Norwegian School of Economics and BusinessAdministration, the Norwegian School of Management, Ohio State University, University of Alberta, University ofBritish Columbia, University of Oklahoma at Norman, University of Pennsylvania, University of Texas at Austin,University of Utah, Texas A & M, Tulane University, Vanderbilt University, and the 1989 Western- and the 1989American Finance Association meetings. Partial financial support from the Owen Graduate School of Management,the James M. Collins Chair in Finance at the Southern Methodist University, the Ministry of Finance and CorporateRelations of the Province of British Columbia, the Social Sciences and Humanities Research Council of Canada, andthe Canadian Financial Research Foundation is gratefully acknowledged. This research was in part conducted whileEckbo was a Fellow of the Batterymarch Financial Management Corporation.
1 Introduction
Seasoned common stock is generally sold through one of three major flotation methods: unin-
sured rights (short-lived warrants issued to current shareholders on a pro rata basis), rights with
standby underwriting (the underwriter commits to purchase all unsubscribed shares), and firm
commitment underwritten offer (the entire issue is sold directly to the underwriter). Stevenson
(1957) reports that, over the 1933-55 period, approximately half of all U.S. common stock offers
over $1 million in proceeds used a rights or standby flotation method. However, by the 1960’s firm
commitment offers were the dominant flotation method in the U.S.. In fact, over the 1963-1981
period, less than 5% of all seasoned stock offers by NYSE and AMEX listed industrial companies
employed rights, with the virtual disappearance of these issuers by 1981. The recent preference
for firm commitment underwritten offers in the U.S. also extends to debt issues, as Eckbo (1986)
reports less than 5% of corporate debt issues sold between 1964 and 1981 used a rights offer method.
The current low frequency of rights issues in the U.S. contrasts sharply with Canada where in recent
years almost half of all equity issues are sold through rights offers,1 and in Europe and the Pacific
Basin where the majority of all equity issues are sold through rights or standby offers, though
recent trends toward greater firm commitment and standby use have occurred in a number of these
countries.2
As highlighted by Smith (1977), the preference for firm commitments in the U.S. represents a
major unresolved puzzle. A similar puzzle was observed by Hansen (1988) concerning the diminished
use of standby rights offers. The puzzle arises in part from Smith’s finding that the average rights
offer involves substantially lower direct flotation costs than the average underwritten offer (standby
or firm commitment). Furthermore, since the value of the right increases with the subscription
price discount, it appears that the rights issuer can guarantee success of the offer by properly
adjusting the subscription price. Smith raises the possibility that observed flotation method choices
reflect an agency problem. For example, managers may receive personal benefits from underwriters
who are selected to handle the equity issue. Second, there may be pressure from the boardroom:1Source: The Toronto Stock Exchange Monthly Review, various issues.2For international evidence on equity issues, see See Marsh (1979) (the UK), Loderer and Zimmerman (1988)
(Switzerland), MacCulloch and Emanuel (1990) (New Zealand), Hietala and Loyttyniemi (1991) (Finland), Eckboand Verma (1992) (Canada), Bøhren, Eckbo and Michaelsen (1992) (Norway), Dehnert (1991) (Australia), and Katoand Schallheim (1991) (Japan).
1
Herman (1981) finds that 21% of the 200 largest non-financials and 27% of the 100 largest industrial
companies have one or more investment bankers on their board of directors. The resulting conflict
of interest may lead to an excessive use of the underwritten method. Third, while a rights offer
is unlikely to substantially change the distribution of voting rights, a sale to the public through
an underwriter can increase shareholder dispersion and therefore reduce shareholder monitoring of
managers, thereby enhancing potential manager welfare.
A possible alternative explanation for the apparent demise of the rights offer is that other
important shareholder borne costs of the rights offer method have been ignored or underestimated.
Examples of such costs are capital gains taxes [Smith (1977)], transaction costs of selling rights
in the secondary market [Hansen (1988)], and wealth transfers due to anti-dilution clauses which
are a standard feature in convertible securities and warrants. Since these costs are likely to vary
substantially across issue types, an analysis of the costs of rights versus underwritten offers requires
a multivariate framework. Hansen and Pinkerton (1982) makes a similar point and argue that the
apparent cost advantage of uninsured rights reflects a selection bias driven by ownership structure
differences across issuers. However, as discussed below, there is presently insufficient evidence to
suggest that any of these alternative explanations can resolve the rights offer paradox.
Our initial evidence strongly reconfirms the rights offer paradox using multivariate regressions
designed to control for possible selection biases in Smith’s univariate cost comparisons. We then
examine firms’ flotation method choices when equity issue markets are characterized by adverse
selection. We draw on the basic mechanism in the Myers and Majluf (1984) model where adverse
selection effects are examined for the case of firms selling shares directly to unaffiliated investors
(a direct issue). In order to explicitly recognize more complex flotation methods, we allow for
shareholder participation in the issue sale, and we give underwriters an informational role to play.
We believe these extensions are necessary in order to provide a meaningful discussion of man-
agerial choices between uninsured rights, rights with standby underwriting, and firm commitment
underwritten offers, which is the subject of our empirical analysis.3
While shareholder participation and underwriter quality certification substantially complicate
the basic Myers and Majluf analysis, our analysis produces several testable implications. In this3The the use of other flotation methods, such as direct offers and best effort underwritten offers (where the
underwriter distributes the shares without bearing any risk of offer failure), can also be understood within thisframework.
2

analysis, the issuer selects the flotation method which maximizes net issue benefits to the firm’s
current shareholders, subject to an exogenous constraint on the expected portion of the issue that
can be sold directly to shareholders. In equilibrium, the net issue benefit depends on the level of
expected current shareholder takeup, as well as on the choice of flotation method.
This framework delivers a wide range of empirical predictions concerning the observable char-
acteristics of equity offers as a function of issue characteristics, such as the issuer’s ownership
structure and the degree of information asymmetry between the issuer and the capital market,
the relative frequency of rights issues, the role of rights subscription precommitments, and the
announcement and pre-announcement stock return patterns of equity issuers across flotation meth-
ods. We present several new empirical findings which are consistent with these predictions. In
particular, our framework and empirical evidence help explain
(1) why industrial firms tend to switch to underwritten offers as firm growth causes increased
dispersion of the shareownership structure, and why exchange listed companies, which are
among the largest U.S. firms, almost never use rights;
(2) why the decline in the use of rights offers coincides with the adoption of dividend reinvestment
plans;
(3) why there is a greater use of rights issues in foreign jurisdictions (including Canada and most
countries in Europe and the Pacific Basin) characterized by smaller and relatively closely held
firms;
(4) why public utilities are more frequent users of rights than industrial issuers;
(5) why uninsured rights offers are typically accompanied by large shareholder subscription pre-
commitments while no such precommitments are observed in standbys;
(6) why uninsured rights offers are associated with an insignificant average announcement period
abnormal stock return.
(7) why standby rights offers have a negative average announcement period abnormal return that
is significantly smaller than the announcement effect of firm commitment offers;
3
(8) why firm commitments, and to a lesser extent standbys, are typically announced following sig-
nificant stock price runups, while there is no evidence of stock price runups prior to uninsured
rights; and
(9) why preemptive rights charter amendments, which increase the probability of firm commit-
ment offers, cause negative market reactions.
The paper is organized as follows. Section 2 shows the relative decline in rights offers using
our substantially expanded sample of 1057 firm commitment offers and 192 (virtually the entire
population) domestic uninsured rights and standby rights offers by NYSE- and AMEX-listed in-
dustrial and utility firms over the period from 1963 up to the introduction of shelf registration in
1982. This section also demonstrates that the decline in the number of rights offers coincides with
a widespread adoption of dividend reinvestment plans, which may be viewed as a substitute means
of raising capital from current shareholders.
Using a multivariate regression framework, section 3 reconfirms the rights offer paradox in terms
of the differential direct flotation costs across uninsured rights, standbys and firm commitment of-
fers. Section 4 discusses the paradox in light of several potential costs of using rights not reflected
in the earlier direct flotation costs analysis. These include costs associated with adverse selection
in issue markets which becomes the basis for a theoretical framework for explaining the flotation
method choice summarized in section 5. The major empirical implications of this adverse selection
framework, including evidence on offer frequencies, rights subscription precommitments, and ab-
normal stock price behaviour around offer announcement dates, are examined in section 6. Section
7 concludes the paper.
2 Disappearing rights offers
In order to place the rights offer paradox in its proper perspective, we start our investigation
of the equity offer decision by documenting the frequencies of alternative seasoned equity flotation
methods chosen by publicly traded U.S. firms.
4
2.1 Sample selection
The primary offers of seasoned common stock in our sample are identified from company
announcements in the Wall Street Journal Index, the Investment Dealer’s Digest and Moody’s
Industrials and Utilities Manuals over the period 1963-1981. Our observation period ends just
prior to the 1982 adoption of shelf registration which Bhagat, Marr and Thompson (1985) show
has reduced underwriter compensation. Uninsured rights and standby offers are identified from the
“Rights Distributed” section of Moody’s Dividend Record as well as the previously cited sources.
Firm commitment offers that took place prior to 1981 were obtained primarily from the Masulis
and Korwar (1986) database, while 1981 offers were obtained from the Wall Street Journal Index,
Dow Jones News Retrieval Service, and the SEC Registered Offerings Statistics (ROS) tape.
The final sample satisfies the following five selection criteria. (1) The common stock is listed
on either the NYSE or AMEX at the offer announcement date; (2) the date of the initial public
announcement is found in the Wall Street Journal Index, Predicast’s F&S Index of Corporations and
Industries, or the Dow Jones News Retrieval Service; (3) no simultaneous offers of debt, preferred
stock or warrants were announced; (4) combination primary/secondary stock offers, cancelled or
postponed offers, and non-US issues are excluded; and (5) information in the offer prospectus or the
Investment Dealer’s Digest’s Corporate Financing Directory permits a classification of the rights
offers into those issues involving and not involving standby underwritten agreements.
Table 1 gives a yearly breakdown of the 1249 equity offers (1057 firm commitments, 135 standby
rights, and 57 uninsured rights) in our sample, classified by whether the issuing firm was a regulated
utility or an industrial company. Also, approximately half of the industrial offers are by NYSE-
listed firms and the other half by AMEX-listed companies. Almost all the utilities are NYSE-listed
reflecting their typically large size. Sixty-two percent of the offers (whether firm commitments
or rights) are by public utilities. The frequency of offers is decidedly dominated by the firm
commitment method, as observed earlier by Smith. After 1976, rights offers by industrial firms
have almost disappeared.
Table 2 lists the mean and median percentage increase in the number of shares outstanding,
gross proceeds and the value of an issuing firm’s total assets, separated into industrial and utility
issues. Data sources for these offer characteristics include Moody’s Daily Stock Price Guide and
5
Handbook of Common Stocks, Standard & Poor’s Manuals, Investment Dealer’s Digest’s Corporate
Financing Directory, the Wall Street Journal Index, and offer prospectuses. In the uninsured rights
category, industrial issuers tend to be small while utility issuers tend to be large. Furthermore,
uninsured rights issues tend to have the largest proportionate increase in shares outstanding whether
the issuer is an industrial firm or a public utility. For all three offer categories, the average size of
offers, as a percent of pre-announcement common stock market value, is larger for industrials than
for utilities.
2.2 Impact of dividend reinvestment plans on rights offers
Dividend reinvestment plans (DRIPs) allow shareholders to elect to receive shares of common
stock in lieu of cash dividends. In these plans the firms generally absorb commissions and other
expenses associated with the purchase of stock. Such plans require shares sold through DRIPs to
be purchased in the secondary market or, if the DRIP is registered with the SEC, the firm can
issue new shares. When new shares are issued through DRIPs, it is common to offer a discount
from the stock’s market price (typically 3-5% in the latter part of our sample period) and to allow
shareholders to purchase additional shares in excess of their dividends up to some maximum dollar
amount on the ex-dividend date.4
Given that DRIPs offer shareholders the right to buy shares with their dividends (typically
quarterly), and in many cases the right to buy additional shares for cash, they are similar to a
periodic rights offer. When firms need new equity capital, they can sell new shares through the
DRIPs, which have relatively predictable subscription levels. The alternative option of reducing
dividend payouts appears to be unattractive to most firms, given the observed inflexibility in
corporate dividend policies [see, e.g, Lintner (1956), Kalay (1980), DeAngelo, DeAngelo and Skinner
(1991)]. When additional equity capital is not needed, the firm can reduce the attractiveness of
the plan by decreasing the price discount, or it can fund the DRIPs with shares bought in the
secondary market.
Prior to a 1968 revision in SEC regulations, only regulated investment companies were able
to offer DRIPs in the U.S.. While DRIPs became quite popular within a short period, not until
1973 did firms begin to sell new shares through DRIPs. New share DRIP adoptions were relatively4See Scholes and Wolfson (1989) for a further description of DRIPs.
6

frequent for our sample of common stock issuers. Using DRIP filing dates obtained from the SEC
ROS tape, the pattern of new share DRIP adoptions for our sample is shown in table 3. The
population of stock issuers underlying this table is given by the 419 firms in table 1 that made
one or more firm commitment offers, and the 54 firms that made rights/standby issues, over the
1970-1981 period. Furthermore, the table is restricted to new share DRIP adoptions involving a
minimum of 10,000 new shares, and it excludes closed-end investment company issuers.
To the extent that DRIPs are similar to a rights offer, one would expect rights issuers to adopt
DRIPs more frequently than firm commitment issuers. This prediction is supported by the first
two columns in table 3, as 54% of the rights issuers registered DRIPs, while only 28% of the firm
commitment issuers did the same over the 1973-1981 period. The latter columns of table 3 present
the annual number of rights/standbys and firm commitment stock offers conditional on whether
or not the issuer had previously adopted a DRIP. For the total sample period, the proportion of
rights/standby offers is 6%, regardless of the DRIP adoption decision. However, following 1977,
the year with the largest number of DRIP adoptions, the proportion of rights/standbys falls to 2%
for issuers with DRIPs while it remains at 5% for issuers without DRIPs.
While the above evidence indicates that the growth trend in DRIPs can partially explain the
disappearance of rights and standby offers, the combined growth of rights/standby offers plus firms
adopting DRIPs over the 1970’s remains limited. Thus, this evidence leaves largely unexplained
why firm commitments continue to be the predominant flotation method when they appear to be
more costly than selling shares directly to existing shareholders, as shown below.
3 Direct flotation costs: Are rights cheaper?
At the core of the rights issue paradox is Smith’s (1977) finding that the direct costs of
uninsured rights offers are substantially lower than the cost of underwriting. To investigate this
issue, we start by extending Smith’s 1971-76 flotation cost evidence to our longer sample period.
We present a more detailed picture of the average cost differences across uninsured rights, standbys
and firm commitment offers by taking into account cross-sectional differences in a set of issue
characteristics which can confound univariate cost comparisons. For example, it is possible that
observed flotation costs of uninsured rights are particularly low because this method is selected
7

when stock return variance is low, when shareholder concentration is high, or, as suggested by
Hansen and Pinkerton (1982), when a large blockholder is willing to guarantee subscription. Any
of these issue characteristics can reduce direct flotation costs regardless of the chosen flotation
method.
3.1 Issue underpricing
The total cost of a firm commitment underwritten offer includes issue underpricing, if any,5
in addition to underwriter fees. While it is well established in studies by Ibbotson (1975), Ritter
(1984, 1991) and others that initial public offerings of stock are underpriced, the extant evidence
for seasoned equity offer discounts is somewhat contradictory. For example, Smith documents sig-
nificant discounts averaging 0.5% relative to the closing price the day prior to the offer day in his
sample of 328 common stock offers over the years 1971-75. Bhagat and Frost (1986) find significant
premiums for utility issuers, while Loderer, Sheenan and Kadlec (1991) find no statistically signif-
icant premiums/discounts. In order to clarify the evidence, we present several estimates of issue
discounts for our sample of industrial firms and public utilities, taking into account whether offers
are made at the exchange open or after the exchange close.
Table 4 presents estimates of the offer price discounts (pt − p)/p, where pt is the secondary
market price at the open, high, low or close at time t and p is the public offering price. Closing
prices are from the CRSP file (covering the entire sample period), while the open, high, and low
prices are from the Cornell University Price-Volume file (1970-1981). The discounts are computed
for firm commitment offers relative to the day prior to the offer day, with negative values indicating
premiums. Estimates based on offer day prices are also shown, however, these prices can be affected
by underwriter price stabilization efforts. Secondary market prices are also affected by a migration
of purchase orders from the secondary market, where the buyer incurs commission costs, to the
primary market where purchases from the underwriter are commission free.6 As shown in Lease,
Masulis and Page (1991), this migration causes the observed transaction prices pt in the secondary
market to shift toward the bid side of the bid-ask spread while the primary offer is ongoing, thereby
downward biasing these secondary market prices.5Parsons and Raviv (1985) presents a model which implies underpricing of seasoned equity offers.6Using the information in Phillips and Smith (1980), a conservative estimate of the one-way transaction cost,
including both commission and the bid-ask spread, is .5%.
8

Equity offers typically start in the morning prior to the opening of the exchange, or in the
late afternoon after the exchange closing. Thus, for morning offers, day 0 coincides with the offer
prospectus date. However, for late afternoon offers, day 0 is defined as the following trading
day. The offer was made after exchange closing in approximately 20 percent of our cases. This
information is based on a comparison of the prospectus date with the date of the “last sales price”
listed in the prospectus. “The last sales price” is the stock’s closing price on the date specified in
the prospectus. Thus, when this date coincides with the prospectus date itself, the offer was made
after closing. For 1980-81 offers we also relied on the Dow Jones news service which reports the
time of the day that the offer commencement was announced.
Panel I of table 4 indicates that the offer price of the typical industrial issue in our sample is
set at an average discount of 0.44% (median 0.00%) relative to the closing price on day -1. The
columns denoted ‘%EQ’ and ‘%GT’ show the percent of the sample where p = pt and p > pt,
respectively. In a majority of the cases (62.1%), the offer is set equal to the prior day’s closing
price, while only 3.1% of the offers are priced above this closing price and 1.4% exceed the daily
high. Panel II shows that the average utility offer is priced at a small premium over the prior day’s
close, a result found by Bhagat and Frost (1986) as well. The average value of (pt − p)/p in our
utility sample is -0.31% (median 0.00%). Of the total sample of utility offers, 50.9% were priced at
the prior day’s close, while in 42.8 percent of the cases, the offer price exceeds this closing price.
The estimates in table 4 provide little basis for arguing that firm commitment offers of seasoned
equity are systematically priced below the corresponding transaction price in the secondary market.
This result contrasts sharply with the evidence for rights offers where significant discounts are the
norm. In our sample of uninsured rights (not shown in table 4), the average (median) subscription
price discount relative to the closing price the day prior to the beginning of the rights subscription
period is 8.3% (14.3%) for industrial issuers and 12.7% (9.2%) for utility issuers. In the standby
rights category, the corresponding average discounts are 20.4% (19.5%) for industrials and 8.3%
(7.8%) for utilities. As reported below, the average subscription rate in either rights offer category
is close to 100%. Consequently, the value of these rights offer subscription discounts is captured
by current shareholders, either by subscribing to the offer or by selling the right. In sum, issue
underpricing does not constitute a relevant component of flotation costs in any of the three flotation
methods studied here.
9

3.2 Direct flotation costs and the impact of issue characteristics
Table 5 lists the mean and median values of underwriter fees and other direct expenses across
the three flotation methods and two issuer types.7 As concluded by Smith for the 1971-76 period,
an uninsured rights offer is on average the cheapest flotation method. The average cost of uninsured
rights offers (‘other’ expenses only) is 1.8% of the offering’s gross proceeds for industrial issues and
0.5% for utility issues, respectively. This contrasts with firm commitment contracts where the sum
of underwriter compensation and other direct expenses average 6.1% of gross proceeds for industrial
issues and 4.2% for utility issues, with underwriter fees accounting for approximately 90% of total
costs.
In standby underwritten agreements, the fee paid to the underwriter typically consists of two
components: a fixed commitment fee and a takeup fee on all unsubscribed shares resold by the
underwriter after expiration of the rights offer. Since the ROS file records underwriter compensation
in standbys either at its minimum level, which assumes no takeup by the underwriter, or at the
maximum level, which assumes a 100% issue takeup, we use subscription information (discussed
below) to compute the actual underwriter takeup. As shown in table 5, the mean ratio of direct
flotation expense to gross proceeds in standbys is 4.0% for industrial issuers and 2.4% for public
utilities, which is similar to the evidence presented by Hansen (1988).
While several earlier studies have identified issue characteristics which are correlated with direct
flotation costs such as those shown in table 5,8 the literature does not present a systematic compar-
ison of the costs of uninsured rights, standby rights and firm commitment offers in a multivariate
regression framework. Table 6 shows the coefficient estimates in such a cross-sectional model. The
dependent variable is direct flotation cost as a percent of offer proceeds, while the explanatory vari-
ables include offer size, percentage change in shares outstanding, issuer’s regulatory status, stock7‘Other’ direct expenses include fees for legal- and accounting services, trustees’ fees, listing fees, printing and
engraving expenses, SEC registration fees, Federal Revenue Stamps, and state taxes. Our primary data sources arethe ROS tape and offer prospectuses. This data excludes the value of any ‘Green Shoe’ (over-allotment) option inthe underwriter contract. A Green Shoe option grants the underwriting syndicate the right to purchase a certainpercentage (usually up to 10 percent) of the issue as additional shares at the offer price. This option makes it lesscostly for the underwriter to over-allot the new issue to potential customers before the offer date, a common sellingpractice. Hansen, Fuller and Janjigian (1987) estimate the value of the average over-allotment option for seasonedcommon stock offers based on the Black and Scholes (1973) option pricing model. They report the average value to beapproximately 1 percent of gross proceeds, and it appears to be independent of offer size as well as other componentsof total flotation costs.
8Examples of such studies are Smith (1977), Hansen and Pinkerton (1982), Smith and Dhatt (1984), Bhagat, Marrand Thompson (1985), Bhagat and Frost (1986), Booth and Smith (1986), Ritter (1987), and Hansen (1988)].
10

systematic and unsystematic risk, shareholder concentration, and binary variables for the flotation
method.
Overall, the model explains 74% of the cross-sectional variability in percentage flotation costs
for the sample of industrial issues and 38% for the utility issues sample, with significant F-values of
160.0 and 60.0, respectively. Since 90% of the rights offers took place before 1976 we reestimated the
model with post-1975 equity offers excluded and for each flotation method separately. The resulting
parameter estimates and significance levels are almost identical to those reported for the pooled
regressions in table 6. Further, with one exception, parameter estimates are typically insensitive
to whether the issuer is an industrial firm or a public utility. In sum, these issue characteristics
appear to represent fundamental determinants of flotation costs.
Interpreting the model estimates, the intercept is positive and significant suggesting a fixed
component to flotation expenses. The natural log of the issue’s gross proceeds (PRO) is negative
and significant, indicating economies of scale associated with share issuance. PRO2 exhibits a
significantly positive coefficient, indicating that the flotation cost function is decreasing and convex
in the gross proceeds of the offer. The percent change in shares (∆SHR) is positive and statisti-
cally significant for industrial issues and positive but insignificant for utility issues. As discussed
below, this result is consistent with the hypothesis that larger percentage changes in shares subject
shareholders to greater costs of adverse selection.
The log of equity capitalization per shareholder (SCON) is significantly negative, indicating
that shareholder concentration lowers flotation costs. Since firms with concentrated ownership
tend to obtain subscription precommitments as discussed below, it is natural to suspect that it is
precisely these subscription precommitments that lower flotation costs. However, while not shown
in table 6, adding an intercept dummy variable for subscription precommitments does not produce
a significant parameter estimate. Thus, the impact of ownership concentration on flotation costs is
apparently capturing more than simple proxy for subscription precommitments.9
The standard deviation of the issuer’s daily stock return (ST ) is positive and statistically9Hansen and Pinkerton (1982) use a non-linear flotation cost function that includes ownership concentration to
estimate the hypothetical flotation cost of a rights offer for a sample of firms that choose the firm commitment method,and conclude that rights offers would have entailed higher costs. However, their t-statistics are conditional on thefunctional form used to generate the flotation cost structure and are therefore difficult to assess. Also, Smith andDhatt (1984) argue that the Hansen-Pinkerton shareholder concentration parameter is biased, and that correctionfor this bias leaves rights offers as the cheapest flotation method.
11

significant. Greater stock risk is expected to positively affect flotation costs for several reasons.
For example, greater stock risk increases underwriting risk and therefore the underwriter fee. Also,
given that a rights offer requires a minimum 14-day subscription period, ST can be viewed as a proxy
for the risk of offer failure due to random changes in stock price over the rights subscription period
(where failure involves higher costs of alternative sources of capital). The greater the expected
failure costs, the greater the issuer’s distributional/selling effort which in turn translates into higher
‘other’ expenses.
The indicator variables D1 and D2 adjust for the flotation method. D1 separates underwritten
offers (standbys and firm commitments) from nonunderwritten offers (uninsured rights), while D2
separates firm commitments from all rights offers. The positive and statistically significant impact
of both D1 and D2 for industrial issuers suggests that the choice of an underwritten offer (standby
or firm commitment) increases the flotation costs, and that the choice of a firm commitment offer
increases these costs further. For utilities, the D1 parameter is significant and positive indicating
again that underwritten offers are more costly. However, the D2 parameter is insignificant, indicat-
ing that firm commitment and standby fees in utility offers are close in magnitude after controlling
for the other explanatory variables in the regression model.
The magnitudes of the coefficient estimates on D1 and D2 are interesting. For industrial issuers,
α6 is 0.05 and α7 is 0.02. In other words, controlling for the issue characteristics, direct flotation cost
as a percent of gross proceeds increases by 5% when going from uninsured rights to underwritten
offers. Furthermore, the average cost of firm commitments is 7% higher than uninsured rights
offers. Thus, the average cost differences implied by the cross-sectional regression are somewhat
larger than the ones emerging from the univariate analysis in table 5. A similar picture emerges
for utility issues. Based on this evidence, of the three flotation methods for selling common stock,
rights offers appear to be the cheapest.
4 Additional costs of rights: Hypotheses and evidence
The results above reconfirms the rights issue paradox. That is, even after controlling for issue
characteristics, rights have lower direct flotation costs than standbys which in turn have lower
costs than firm commitments. Yet, the firm commitment flotation method is dominant and, if
12

anything, rights are “dying out”. Furthermore, the observed substitution of DRIPs for rights offers
is insufficient to explain why underwritten offers continue to be the predominant flotation method.
As discussed in the introduction, unless these observed flotation method choices are a manifestation
of an agency problem, there must be some, as yet unidentified, direct costs of rights or opportunity
costs which value-maximizing managers find decrease the attractiveness of rights. Examples of such
costs are given below, some of which have been suggested by earlier research in this area.
(1) Capital gains taxes
In a rights offer, shareholders who do not wish to purchase shares of the issue must sell their
rights (or subscribe and sell the shares) in order to avoid losing the value of the subscription price
discount. As noted by Smith, these sales are subject to capital gains taxes which are increasing
in the subscription price discount, discouraging large discounts. The potential capital gains tax
liability is also particularly onerous if the firm’s stock has realized a large price rise in recent periods.
Smith estimates that the relative tax disadvantage of uninsured rights, in a worst-case scenario, is
at most 2% of offering proceeds, and he concludes that capital gains taxes alone cannot explain the
rights offer paradox.
(2) Stock liquidity and transaction costs of reselling rights
The resale of rights by current shareholders take place on organized exchanges, entailing dealer
spreads and brokerage fees. Shareholders avoid these costs when the firm employs an underwriter to
sell its new shares. Moreover, Hansen (1988) argues that underwriters are able to effectively lower
the compensation for portfolio rebalancing costs demanded by outside investors when purchasing
the shares. Both arguments imply that rights offers carry a transaction cost disadvantage for
shareholders uninterested in subscribing to the issue. Our empirical analysis (section 6, below)
fails to reveal the temporary price decline predicted by Hansen’s selling cost hypothesis. However,
Kothare (1991) presents evidence of a negative effect of rights offers on stock liquidity and bid-
ask spreads over the rights period, and Lease, Masulis and Page (1992) find bid-ask spreads to
fall subsequent to firm commitments. While this evidence indicates the presence of a transaction
cost disadvantage of rights, the magnitude of these bid-ask spread effects are small relative to the
flotation cost differential between uninsured rights and firm commitment offers documented above.
13

(3) Short selling activity and the risk of rights offer failure
The issuer is effectively reducing the cost of hedging short sale positions in its stock when it
makes a rights offer, especially for low equity capitalization stocks without publicly traded options.
At the rights offer expiration, if the market price is above the subscription price, the investor
subscribes to the rights and uses them to close out the short position. If the stock price falls, the
investor lets the rights expire unexercised and buys shares on the secondary market to close out the
short position at a profit. This hedged short selling is profitable as long as the stock price exceeds
the subscription price by more than the transaction costs incurred.10
As additional short positions are opened between the announcement of the rights offer terms
and offer expiration, the resulting sell orders tend to depress the stock price within the bid-ask
spread, thereby reducing the attractiveness of exercising the rights for most stockholders. This
creates additional uncertainty for issuers as to the ultimate rights offer subscription level, which
can cause the issuer to extend the expiration of the rights offer, increasing flotation costs and
creating continued downward pressure on stock price for the extended life of a rights offer.
It follows from this argument that, ceteris paribus, firms with greater stock price uncertainty
have less incentive to issue rights due to the greater value of the warrants (rights) being issued,
which increases the attractiveness of this hedged short selling strategy. Similarly, firms needing
to sell relatively large amounts of new shares would tend to avoid uninsured rights as the value
of the warrant issue increases with the number of rights per share outstanding. While the risk of
rights offer failure almost certainly is an important factor in the flotation method choice, empirical
tests of this hypothesis requires more detailed information on short-selling activity than is currently
available.
(4) Anti-dilution clauses and wealth transfers to convertible security holders
If a firm has convertible securities or warrants outstanding with anti-dilution clauses in place,
then issuing rights at discounts can trigger automatic reductions in conversion rates as discussed
in Kaplan (1965) and Myhal (1990). These anti-dilution clauses are likely to result in improved
positions for these convertible securities, shifting wealth from the common stock holders to the10Given the short life of the right, the transaction costs of purchasing the rights will be low.
14

convertible security holders. As a result, there is an added incentive for firms with convertible
securities outstanding to avoid issuing rights at deep discounts. According to Moody’s Industrial
and Utilities Manuals, the total number of industrial convertible securities (stocks and bonds)
outstanding was 611 in 1960, 1303 in 1970, and 1191 in 1975. Furthermore, industrial firms are
much more likely than utilities to issue convertible securities. These trends are consistent with
the observed reduction in rights offer frequencies occurring over the 1960’s and the 1970’s and the
reduced use of rights offers by industrial firms.
(5) Adverse selection costs of uninsured rights
In the remainder of this paper, we outline an adverse selection model for firms’ flotation method
choice in equity markets where underwriters offer imperfect certification services. The model implies
that an uninsured rights offer is a relatively costly flotation method when current shareholder
participation in the new issue is low. As shown, our empirical evidence appears to give substantial
support to the central empirical implications of this analysis.
5 A model for the flotation method choice under adverse selection
In the framework of Myers and Majluf (1984), a firm faces a profitable investment opportunity
which requires a commonly known level of new equity capital. The firm’s decision to issue and invest
depends on the value of the project, b, the cost/benefit of selling under-/overpriced stock, c, and
direct flotation costs, f . The value of c is equal to the difference between the intrinsic value of the
shares sold to outsiders and the shares’ market value conditional on the issue decision. Managers,
who are assumed to maximize the intrinsic (full information) value of the firm’s shares, elect to
issue and invest if and only if the net issue benefit is non-negative, i.e., when b−(c+f) ≥ 0. Myers-
Majluf further assume that current shareholders do not to participate in the issue, and they rule
out an informational role for underwriters. Thus, the real-world equivalent to the flotation method
implicit in the Myers-Majluf model is a direct issue to outside investors (possibly distributed by
a simple best-effort agreement with an investment bank), with no alternative flotation methods
available. Consequently, for certain parameter values, a decision to issue signals a truncation of
the upper tail of the distribution of share intrinsic values, causing rational market participants to
15

lower the secondary market price of an issuer’s stock.
In the following, we expand the flotation method opportunity set by allowing shareholder par-
ticipation in the issue and by assuming that underwriters play a certification role. As discussed,
alternative flotation methods now imply different equilibrium values of c as well as different direct
flotation costs f . While f is observed to be highest for firm commitment offers and lowest for
uninsured rights, the value of c depends in a non-trivial manner on the level of current shareholder
participation in the issue and the average quality of the firms in the pool selecting a particular
flotation method.
5.1 Model assumptions
Let k ε [0, 1] denote the proportion of the equity rights issue that is purchased and held by
current shareholders (shareholder takeup level). Assume that:
(A1) The firm faces a profitable but short-lived investment opportunity requiring equity investment.
Management’s objective is to maximize the intrinsic value of the firm, and managers know
more than the market about the intrinsic value of the firm’s assets in place (as in Myers and
Majluf). Managers select the optimal flotation method which maximizes the net issue benefit
b−(c+f) given the expected current shareholder takeup and recognizing that the equilibrium
value of c itself depends on both the value of k and flotation method choice.
(A2) The value of k is determined by factors largely beyond managerial control, such as personal
consumption and wealth constraints, diversification benefits and portfolio rebalancing costs,
benefits from maintaining a shareholder’s current voting and dividend rights, and individual
tax brackets. Thus, managers treat k as an exogenous parameter.
(A3) Managers have better information than the market about k. Information about k is revealed to
the market through the announcement of subscription precommitments, through the volume
of rights traded in the secondary market during a rights offer (where a high volume indicates
a low k), and through the announcement of actual subscription levels at the end of the rights
offer period. Thus, while low-k issuers cannot falsely signal a high k value, high-k issuers can
conceal their information on k by not selecting a rights offer.
16

(A4) Underwriter certification narrows, but does not eliminate, the information asymmetry be-
tween the firm and the market. That is, some residual uncertainty concerning the true value
of the issue remains even after the underwriter’s investigation of the issuer (noisy quality
certification).11 If the underwriter’s investigation indicates that the issue is overpriced, the
firm is given the choice of lowering the offer price or withdrawing the issue.12
Under these assumptions, the equilibrium value of c depends on the market’s estimate of k,
conditional on the information in the offer announcement. At one extreme, if the market is con-
vinced that current shareholders will purchase and hold the entire equity issue (k = 1), then there
is no potential for wealth transfers between current and new shareholders, no adverse selection and,
consequently, c = 0. In this case, the decision to issue reduces to assessing whether or not b ≥ f ,
and if it is the issuer (whether the firm is over- or undervalued) selects uninsured rights since this
is the flotation method which minimizes direct flotation costs.
However, if k is less than one, some undervalued firms find it too costly to issue due to the
dilution of current shareholder claims caused by selling shares at prices below intrinsic value.
Consequently, the pool of issuing firms exhibits adverse selection to a degree which, ceteris paribus,
is inversely related to k. Reducing k is here analogous to lowering the amount of financial slack in
the Myers and Majluf model, or to increasing the size of the issue offered to outside investors, as
in Krasker (1986) where equity offers of varying size are allowed. Thus, as discussed below, firms
facing k < 1 trade off the adverse selection cost of an uninsured rights issue and the net certification
benefit of an underwritten (standby or firm commitment) offer.
5.2 The flotation method choice when k < 1
(1) Undervalued firms11Quality certification can take place only if underwriters on average suffer penalties from selling mispriced stocks
to the public. Examples of such costs are loss of reputation [e.g., Booth and Smith (1986), Beatty and Ritter (1986),Titman and Trueman (1986), Smith (1986)], direct costs of lawsuits from disgruntled clients purchasing overpricedissues [Tinic (1988) and Blackwell, Marr and Spivey (1990)], and loss of business from issuing firms if the underwritersystematically underprices the issues [Ritter (1986)].
12In practice, issue withdrawal is likely to be infrequent since a profitable investment opportunity will be lost, whichis consistent with the evidence in Mikkelson and Partch (1988). Note also that if the certification process describedabove works well, the offer price can be set close to the stock’s secondary market price at the close of the day priorto the offer day, which is consistent with the evidence on offer price discounts presented earlier in table 4.
17

High-k issuers select uninsured rights and inform the market of the high k value using subscrip-
tion precommitments.13 These issuers realize a double benefit: the value of any underpricing is
captured by current shareholders (the value of c is close to zero), and the direct flotation cost f is
lowest for uninsured rights. In other words, for these firms, shareholder takeup is a cheap substitute
for an underwriter guarantee.
Adverse selection effects, and thus the value of c, increase as k falls since highly undervalued
firms are now more likely not to issue. Moreover, the presence of the underwriter certification
option exacerbates the negative market reaction to non-underwritten offers by low-k issuers. Thus,
for some critical value ks < 1, an undervalued firm finds excessive the size of c implied by an
uninsured rights offer. This firm will opt for an underwritten issue provided the sum of the expected
certification benefit (in terms of reducing c) and the net project value exceed the underwriter fee.
Ceteris paribus, the greater the undervaluation of the firm’s shares, the less likely this condition is
to be met, and the more likely the firm is not to issue.
If the firm decides to issue using the underwritten method, the value of k also helps the firm
decide on the form of the underwriter contract. Let kf < ks denote the firm’s critical k-value for
switching from a standby to a firm commitment contract. Over the range kf < k < ks, the standby
underwriting method economizes on the fact that current shareholders are expected to purchase a
non-negligible portion of the issue, which lowers both the standby fee and the takeup fee charged by
the underwriter. However, as k falls, the total standby underwriting fee necessarily approaches the
firm commitment fee. Thus, if k falls in the range 0 < k < kf , the issuer prefers a firm commitment
underwritten offer to a standby offer in order to save the additional issuer borne rights distribution
costs implied by the standby method.
(2) Overvalued firms
If the value of k is high, the overvalued issuer can select the uninsured rights method, informing
the market of the high k-value). Alternatively, the firm can conceal the k-value and select a firm
commitment contract in a calculated attempt to pool with undervalued low-k issuers in order to13In practice, subscription precommitments by large blockholders are likely to influence the subscription decisions
of small, relatively uninformed shareholders. Moreover, subscription precommitments are also useful when assessingthe likely underwriter risk in a standby offer and can help lower the standby fee. While not analyzed here, theseadditional benefits further underscore our contention that subscription precommitments play a strategic role in thefirm’s issuance decision.
18

exploit the imperfect certification process. By assumption, if detected as overvalued, the firm
either sells stock at the lower “certified” price or withdraws the issue, thus foregoing the profitable
investment project. The incentive for the overvalued firm to risk the underwriter certification
process depends on the probability of detection, the size of the underwriter fee, the average quality
of the firms in the pool selecting firm commitment offers, and the value of the investment project.
For lower values of k, rights are precluded due to the resulting large equilibrium value of c, and
the overvalued issuer selects the firm commitment method, again in a calculated attempt to exploit
the certification process.
(3) Market inferences
The market cannot distinguish between overvalued and undervalued issuers but understands
the above issue strategies and incentives. Thus, the market infers that
(i) the pool of uninsured rights offers will exhibit (i) high k-values (verified by subscription
precommitments and/or by low rights trading volume), and (ii) low adverse selection since
a greater proportion of relatively undervalued firms decide to issue (using uninsured rights)
when k is high;
(ii) the pool of standby rights offers will exhibit (i) lower k-values and (ii) greater adverse selection
than uninsured rights since a greater proportion of highly undervalued firms (with similar k-
values) now prefer not to issue; and
(iii) the pool of firm commitment underwritten offers will exhibit (i) the lowest k-values and (ii)
the greatest degree of adverse selection since (a) some overvalued firms try to get by the
underwriter regardless of the true value of k, (b) high-k undervalued firms use rights or
standbys, and (c) low-k undervalued firms are more likely not to issue.
Note also that, in practice, the underwriter may well have a greater incentive to sell overpriced
stock than to sell underpriced stock given the value of future debt and equity underwriting business
with the issuing firm, and given the difficulty of verifying ex post whether or not the issue was in
fact overpriced. This incentive further increases the degree of adverse selection in the pool of firms
selecting underwritten offers relative to the pool of rights offers.
19

As discussed next, this equilibrium analysis has implications for the observed market reaction to
equity issue announcements, as well as for the values of certain issue characteristics, across flotation
methods.
5.3 Implications for stock price behaviour around issue announcements
The model implies that the market reaction to an equity issue announcement is a function of
both k and the flotation method:
(H1) The average value of k in the pool of uninsured rights offers is close to one and, consequently,
the average market reaction to uninsured rights offers is close to zero.14
(H2) The average market reaction to a standby offer is less negative than the average market
reaction to a firm commitment offer of equivalent dollar size.
H2 follows because the average quality of firms in the pool selecting standbys is no less than the
average quality of firms selecting firm commitments, and because issuers selecting standbys have
higher k-values. Taken together, H1 and H2 imply that the average market reaction to rights offers
should be less negative than the average market reaction to firm commitment underwritten offers.
(H3) High-k issuers, which tend to have fairly or undervalued stock, on average exhibit smaller pre-
announcement stock price runups than low-k issuers. Given the hypothesized correspondence
between k-values and the flotation method choice, this in turn implies that rights and standby
offers have smaller pre-announcement runups than firm commitment offers, with no runup
for uninsured rights.
H3 extends the argument of Lucas and McDonald (1990) to include the effect of differential k-
values across issuers/flotation methods. Lucas and McDonald assume that (i) firms are correctly
priced on average but may be temporarily mispriced and (ii) delaying the equity issue lowers
the net present value b and is therefore costly. In this situation, temporarily underpriced firms
have an incentive to postpone the issue until the stock price is higher, which implies that the
average pre-announcement price path of these issuing firms will be upward sloping. On the other14This holds provided that issuers are not constrained in their choice of flotation methods. If issuers are precluded
from using firm commitments, as appears to be true in some foreign countries, the rights and standby offers shouldexhibit greater adverse selection effects and thus receive more negative market reactions.
20

hand, temporarily overpriced firms will issue immediately as investment opportunities arise. If the
arrival of investment projects is uncorrelated with the firm’s price history, then the average pre-
announcement price path of temporarily overvalued firms will be flat. As a result, the average pre-
announcement price path of all issuing firms will be upward sloping. The effect of k in this analysis is
to reduce the incentive of undervalued firms to postpone the issue since current shareholders capture
part of the underpricing. At the extreme, when k = 1, the firm issues immediately regardless of its
current degree of underpricing. Thus, in a sample of issuers where the average value of k is known
to be large, the analysis predicts that there should be little or no stock price runup on average prior
to the issue announcement.
(H4) Since there is less adverse selection risk associated with a public utility issue than with an
industrial issue, utilities are more likely to select rights, and the adverse market reaction to
a public sale of equity should be relatively smaller for public utilities than other issuers for
the same flotation method. However, across flotation methods, utilities should also exhibit
relatively higher adverse selection effects for firm commitments.
Utility issues have less adverse selection risk since the investment and financing of utilities are
highly regulated, and since public knowledge of the regulatory policy lowers the probability that a
utility announcing a stock offer is attempting to take advantage of favorable market conditions.15
(H5) The market reacts negatively to preemptive rights charter amendments.
As managers receive (private) information that the value of k in future equity issues will be low,
they propose preemptive rights charter amendments in order to prepare for the firm commitment
flotation method. The charter amendment proposal signals management information on k, causing
the market to capitalize the higher future expected costs of raising capital. Interestingly, this
explanation is also consistent with the fact that shareholders almost uniformly see it in their own
self interests to vote in favour of such manager-sponsored proposals to amend the charter.
H5 is consistent with the evidence in Bhagat (1983) and results included in an early draft
of this paper [Eckbo and Masulis (1986)]. The remaining hypotheses H1-H4, as well as several15For example, stock offers often require state utility commission approval or SEC approval for utility holding
companies. In other instances, a utility offer is mandated if a rate increase is to be approved. It also appearsthat regulatory commissions sometimes pressure utilities to make equity offers, which further lowers the anticipatedadverse selection effect.
21

predictions concerning subscription precommitments and the timing and frequency of rights issues,
are examined below.
6 Empirical analysis
6.1 Subscription precommitments and actual shareholder takeup
Our adverse selection model implies that the degree of shareholder takeup (the value of k) plays
a strategic role in the issuer’s flotation method choice. Since the issuer is better informed than
the market about k at the time of the offer announcement, high-k issuers selecting rights have an
incentive to credibly communicate their information on k to the market by means of subscription
precommitments. Such precommitments help attenuate the negative market reaction to the issue
announcement, and reduce the expected cost of offer failure in an uninsured rights offer. Given
the hypothesized relationship between the value of k and the flotation method choice, we therefore
expect both actual shareholder takeup and subscription precommitments to be larger for uninsured
rights than for standby rights offers.
Table 7, which shows the mean and median values of shareholder subscription precommitments
and actual subscription rates for rights and standbys, supports this prediction. As shown, the total
subscription precommitment consists of two components, one referring to the pro rata allocation
of the rights distributed and the other covering over-allotment guarantees. The latter represent
precommitments to exercise rights beyond ones own pro rata allocation should other shareholders
not fully exercise theirs. In the uninsured rights category, industrial issuers received total precom-
mitments averaging 48% (median 23%) of the number of shares offered, while the precommitment
is 66% (median 87%) for the average utility issue. Thus, at the time of the offer announcement, the
risk of offering failure was particularly low for public utility issuers. As shown in the last column,
actual subscription rates in uninsured rights offers average 99% for industrial issuers and 93% for
public utilities.
For standby rights offers, while actual subscription rates are high, the average size of precom-
mitments is lower than for uninsured rights: 2.7% for industrials and 0 for utility issuers. From
the table, the underwriter takeup averages 8.0 percent for utility issues and 1.3% for industrial
issues, suggesting that the adverse selection risk borne by the standby underwriter is relatively
22

low.16 In fact, the underwriter takeup rate implied by table 7 understates the true rate because the
underwriters typically purchase and exercise rights during the offer period. While information on
the underwriter’s secondary market purchases is unavailable for industrial standbys, Singh (1992)
documents that underwriters in utility standbys typically purchase and exercise approximately 16%
of the rights, leaving an average shareholder takeup of 76%.17 In sum, the evidence indicates that
both the level of subscription precommitments and the value of k on average is lower for stand-
bys than for uninsured rights. According to our model, these standby issuers realized that their
respective k values were too low to select uninsured rights but sufficiently high to select standby
underwriting over firm commitment offers.
According to our model setup, absent subscription precommitments, the market infers the value
of k through other means, such as the trading volume in the rights during the offer period, and
otherwise observable shareholder characteristics (e.g., ownership dispersion) which help form expec-
tations about k. If these information sources yield relatively imprecise estimates of k, our model
implicitly assumes that the costs to the issuer of misrepresenting the value of k is prohibitive.
Specifically, in light of the low levels of subscription precommitments in the standby category evi-
dent in table 7, the model implicitly assumes that the standby underwriter refrains from overstating
the value of k when marketing the shares. A recent court case in the UK, where rights offers are the
rule rather than the exception, is of interest in this respect. In this case, the standby underwriter
for the £837 million equity issue by Blue Arrow in September of 1987 (the largest issue ever in
the UK) was convicted of overstating the actual subscription level the morning after the rights
offer expired (The Times, International Edition, February 15, 1992). The actual subscription rate
was 38%. However, the underwriter apparently viewed 50% as a minimum in order to successfully
market the remaining shares to its clients, and so proceeded to anonymously purchase rights to
11% of the issue, and announced that the offer had been a “success”. The prosecution spent £35
million to prove that k had been overstated, and the underwriter lost the case.1680% of the standby issues in the sample have an underwriter takeup of 10% or less. Comparable subscription
rates are reported by Hansen, Pinkerton and Ma (1986) in a sample of 60 utility standby offers which took placebetween 1969 and 1979.
17Singh’s data suggest that we underestimate the takeup fee component of the total cost of a utility standby offerin section 3 above. Correcting for this bias does not alter our earlier conclusion that firm commitment offers are moreexpensive than standby rights offers.
23

6.2 Stock price behaviour around issue announcements
Procedure for estimating abnormal stock returns
Table 8 presents estimates of the percent average abnormal stock returns, classified by issuer
type and flotation method, relative to the following dates: issue announcement (a), offer begin
(b), and offer expiration (e). Abnormal returns for all event windows are estimated simultaneously
using the regression model
rjt = αj + βjrmt +6∑
n=1
γjndnt + εjt, (1)
where rjt and rmt denote the continuously compounded daily rates of return to firm j and the value
weighted market portfolio of all NYSE- and AMEX-listed stocks. The six dummy variables dnt
each take on values of one over the intervals corresponding to each of the six columns in table 8,
and zero otherwise.18
The estimation uses 450 daily stock returns from the CRSP tape, starting on day a − 60. We
use a post-offer dominated estimation period to minimize the possible bias in the market model
parameters caused by long periods of pre-announcement abnormal stock price runups reported in
the literature. Missing return observations are dealt with as follows: If a return observation in the
estimation period following the event period is missing, then the next return observation is also
excluded (since, on the CRSP tape, this is a multiple day return). If there is a missing return in
any of the five event periods, however, then the following available return is not excluded since we
want γjn to capture the total abnormal return over the event period. Missing observations in the
event period are rare in our sample, and for the critical event periods 2 (the two-day announcement
period) and 4 (the offer day), there are none.
The issuing firm’s total abnormal stock return over event period n is wjnγj , where wjn is the
number of days in the event period. Since firm commitment offers have no formal offer expiration
day e, we define e = b + 20 for this offer category, which is in fact comparable to the length of a
typical rights offer.19 For each event period n, table 8 also reports the percent of the sample with18We also repeated all regressions using a ‘Monday-factor’ in equation (1), defined as β′rmtdmt, where dmt is a
dummy variable which takes on a value of one if period t is a Monday and a value of zero otherwise. This procedureaddresses the concern that the estimated value of the abnormal return parameter for stock offers which take placeon Mondays will tend to reflect the abnormal Monday behaviour of the market index. Inclusion of this additionalfactor in the market model does not alter the conclusions of this paper, and we therefore report results based on thestandard form of the market model only.
19In the firm commitment sample, the average number of trading days between the issue announcement and the
24

negative abnormal return, as well as the test statistic
zn = (1/√
N)N∑
j=1
(γjn/σγjn),
where the “hat” denotes OLS estimate and σγjm is the estimated standard error of γjn. Under the
null hypothesis of zero abnormal return, zn is approximately standard normal for large sample size
N.
Announcement period abnormal returns and direct flotation costs
The second column in table 8 shows the average two-day announcement period abnormal return,
which reflects the capitalized value of the flotation costs and the market’s reassessment of the stock’s
adverse selection potential. As is well documented in the extant literature, announcement of firm
commitment offers are met with significantly negative average abnormal returns.20 The two-day
announcement period average abnormal return is a highly significant -3.34% for the 389 industrial
offers and -0.80% for the 646 public utility offers.
In the standby category, the two-day announcement period abnormal return is a statistically
significant -1.03% (z-value of -2.04) for industrial issuers and -0.53% (z-value of -2.28) for utility
issuers, which is consistent with the Hansen (1988) findings. In other words, the average market
reaction to standbys is only weakly significant, and for industrial issuers, approximately one third
of the average reaction to firm commitment offers. The average announcement induced market
reaction is weakest for uninsured rights, -1.39% (z-value -1.56) for industrial issues, and 0.23% (z-
value 1.00) for utility issues. A standard t-test for differences in sample means rejects at a 1 percent
level the hypothesis that the average market reaction to firm commitment and rights offers is the
same. Further, the average negative market reaction is significantly less negative when the issuer
is a public utility rather than an industrial company which is consistent with the hypothesized
beginning of the offer period is 26 for the industrial offers and 33 for the public utility offers. For standbys, theaverage number of trading days from a to b is 31 for industrial and 38 for utility offers, while e− b (i.e., the length ofthe subscription period) averages 12 for industrial standbys and 13 for utility standbys. Finally, the average numberof trading days from a to b in pure rights offers is 40 for industrial and 45 for utility offers, while the length of e− baverages 14 for industrials and 21 for utilities.
20See Asquith and Mullins (1986), Masulis and Korwar (1986), Kalay and Shimrat (1987), Barclay and Litzenberger(1988), Choe, Masulis and Nanda (1991). Mikkelson and Partch (1986) and Officer and Smith (1986) document apositive average market reaction to announcements of the cancellation or postponements of equity issues.
25

smaller adverse selection effects in regulated utilities.
The results in table 8 substantially expand our empirical knowledge of the valuation effects of
rights offers. Smith (1977) reports zero announcement month abnormal performance in his sample
of rights issues from the period 1971-1975. His analysis does not distinguish between pure rights and
standbys or between industrial and utility issuers, distinctions which the results in table 8 indicate
are important. White and Lusztig (1980), who use daily security returns over the period 1962-
1972, report evidence that the average market reaction to rights offer announcements is negative.
Their study also does not separate the two categories of rights offers or issuer types. For standby
rights offers, Hansen (1988) presents results which are similar to ours. He estimates the average
two-day announcement period abnormal return to be -2.61% for industrial issues and -1.21% for
utility issues, both with t-values greater than -5. These estimates are significantly larger than the
corresponding marginally significant estimates of -1.03% and -0.53% reported in table 9. While it
is not clear why Hansen’s estimates exceed ours, we suspect the discrepancy reflects a combination
of our larger sample (his 22 industrial standbys are from the period 1965 through 1971 only) and
different estimation procedures.21
Since the offer announcement causes the market to capitalize the expected flotation costs, it
is useful to add the realized flotation costs as a percent of the pre-announcement equity capital-
ization back into the estimated abnormal stock return. This adjusted abnormal return provides a
measure of the extent to which the market reaction to an offer announcement reflects the effect
of information asymmetries not influencing direct flotation costs. Looking at the mean values, the
adjusted abnormal return is -2.29% for industrial firm commitment offers, up from -3.34%. Thus,
over and above flotation costs, the offer announcement conveys negative information which causes
the market to lower the share price by approximately two percent. For public utility firm com-
mitment offers the average adjusted abnormal return is -.31%, up from the unadjusted average of
-.80% in table 8. For standbys, the average adjusted abnormal return is -.10% for industrials (up
from -1.03%) and -.31% for utilities (up from -.53%). Finally, for pure rights, the average adjusted
abnormal return is -.59% for industrials (up from -1.39%) and .28% for utilities (up from .23%). In21Eckbo (1986) shows that the average market reaction to convertible debt issues is significantly negative when the
issue is underwritten and indistinguishable from zero in rights offers. Moreover, for straight debt issues the averagemarket reaction is indistinguishable from zero regardless of the flotation method. This evidence is also consistentwith our main hypothesis since the hybrid debt-equity nature of convertible debt leads one to expect greater adverseselection effects for convertible than for straight debt.
26

sum, the market reactions to rights and standby offers appear to be economically negligible after
adjusting for the effect of direct flotation costs.
Adjusted announcement-period abnormal returns and offer characteristics
The statistical significance of the differences between the adjusted abnormal returns discussed
above is indicated by the pooled cross-sectional regression shown in table 9.22 One can interpret
this as a constrained regression where the explanatory variable flotation costs is required to take on
a parameter value of minus one. As in section 2, we use indicator variables, D1 and D2, to test the
proposition that the conditional mean value of the dependent variable differs systematically across
flotation methods, as predicted by our theoretical framework.
The cross-sectional regression yields an R2 of 8% for industrial issues and 9% for utility issues,
with marginally significant F-values of 4.6 and 8.3, respectively. Interpreting the individual regres-
sion coefficients, the issuing firm’s abnormal stock return over the 59-day period prior to the issue
announcement (RUN) exhibits a significantly negative coefficient for both industrial and utility
issues. The standard error of the firm’s stock return (ST ) has a statistically significant negative
coefficient in the public utility sample but, surprisingly, appears to have no explanatory power
in the sample of industrial issuers.23 Since this variable is a significant determinant of flotation
costs (table 5), the estimated value of δ2 indicates that firm risk has an additional impact of the
market reaction to utility but not to industrial issues.24 Moreover, the leverage change variable
∆(D/E) is insignificant for both industrial and utility issuers. The offer-induced change in leverage
is approximated by
∆(D/E) =∆D
E− D
E(∆E
E) = −(s +
D
E)(
∆E
E),
where s is the percent of the equity proceeds used to repurchase the firm’s debt as indicated
in the offer prospectus or the Wall Street Journal Index, ∆E is the increase in equity, and the22The regression is estimated using weighted least squares. Eckbo, Maksimovic and Williams (1990) show that,
for discrete non-repetitive voluntary events, OLS or GLS are inconsistent. However, re-estimation of our statisticalmodel using the Eckbo-Maksimovic-Williams estimator yields conclusions which are qualitatively similar to thosegiven in table 9.
23This result differs from Dierkens (1991), who uses pre-announcement returns to generate standard errors. Themarket pre-announcement runup in the firm commitment sample induces a bias in her standard error estimate.
24Inclusion of a corresponding market risk variable, i.e., the standard deviation of the market return over theestimation period of ST , does not alter the results. Thus, the negative value of δ2 for utility issuers reflects firm-specific risk. The market risk variable exhibited an insignificant coefficient and was dropped.
27

corresponding decrease in the firm’s debt is ∆D = −s∆E. The insignificance of ∆(D/E) fails to
support the proposition that the negative market reaction to seasoned equity issues is a function
of the leverage reduction implied by the equity issue, which runs counter to a number of current
capital structure theories.
Turning to the indicator variable AUT for prior stock authorization (which is included as a
proxy for the market’s ex ante assessment of the probability of an equity issue) we find it has a
significantly positive coefficient for industrial issues, as expected. Surprisingly, the same coefficient
is negative for utility issues where the probability of an issue is more directly related to investment
activity (as opposed to market timing). The share concentration variable SCON exhibits an
insignificant coefficient in the sample of industrial issues and, perhaps surprisingly, a significantly
negative coefficient in the sample of utility issues. The log of equity capitalization (lnAj) receives
a significantly negative coefficient, indicating a potential ‘size’ effect in abnormal returns. Since
firm size and issue size are positively correlated, we also included the log of offer proceeds and the
percent change in the number of shares outstanding as explanatory variables. Neither exhibits a
significant coefficient in any of the regressions, and their inclusion did not eliminate the negative
impact of lnA. Thus, the negative value of δ1 does not appear to reflect the offer size per se.
The estimated coefficients δ7 and δ8 for the indicator variables D1 and D2 are particularly
interesting. For industrial issues, δ8 is significant with a value of -1.9. Thus, the market reaction
to firm commitment offers, adjusted for flotation costs and firm specific variables, is significantly
more negative than the market reaction to rights issues. The value of δ7 is indistinguishable from
zero, which suggests that for industrial rights issues, the market reacts primarily to whether the
flotation method is a firm commitment underwriting. For utility issues, δ7 is significant with a
value of -1.1 while δ8 is indistinguishable from zero. Thus, in this issuer category, the market reacts
primarily to whether or not the flotation method is an underwritten offer, which is consistent with
our observation that flotation costs of standby and firm commitment offers are very similar for
utility issuers. Overall, this evidence indicates that the market reaction net of flotation costs is
most negative for underwritten offerings and least negative for uninsured rights, whether the issuer
is an industrial firm or regulated utility, as predicted.
28

Pre- and post-announcement abnormal stock price behaviour
Returning to table 8, the first column shows the average abnormal stock price runup over the
three-month period prior to the announcement date. Firm commitment offers (which under our
hypothesis have the largest adverse selection potential) are typically announced following significant
abnormal stock price increases, on average gaining 12.05% for industrial issuers (z-value of 11.89).
This is consistent with empirical studies by Korajczyk, Lucas and McDonald (1990), Lucas and
McDonald (1990) and Choe, Masulis and Nanda (1991) on firm commitment offers.
In contrast, there is evidence of a much smaller prior stock price runup in standbys (4.57% for
industrials, with a z-value of 1.97), and virtually no runup prior to industrial uninsured rights offers
(-2.38%, z-value of -0.42), which is consistent with our model. Note also that the apparent market
timing in the firm commitment sample appears unique to industrial issuers, with utilities exhibiting
little or no significant gains, which is also consistent with our adverse selection argument.
With the exception of utility firm commitment offers, table 8 also shows evidence of negative
average abnormal returns after the announcement day, in particular over the first day of the offer
(column four). As discussed in section 3, this may be caused by short selling designed to take
advantage of (and perhaps impact) the offering price, or by the necessity to compensate investors
for transaction costs of absorbing the new issue. As discussed earlier, the negative abnormal returns
may also reflect the fact that the primary market, where there are no purchaser-borne fees, draws
buyers away from the secondary market, increasing the likelihood that our secondary market closing
prices are at the low end of the bid-ask spread as documented by Lease, Masulis and Page (1991).25
These arguments all have in common that the hypothesized price decline is temporary. Hansen
(1988) concludes that the price decline is indeed temporary for his sample of standby offers. He finds
a significantly negative correlation between the abnormal return over the 20 trading days prior to
the start of the offer period and the the 20-day abnormal return following the offer expiration day.
However, as detailed in an earlier version of this paper, when replicating Hansen’s test strategy, we
fail to reproduce the significant correlation. This discrepancy probably reflects our larger sample
size and different estimation methodology. For example, instead of Hansen’s 20-day pre-offer event
period, we used the exact time period from announcement to the offer (column 3 in table 8) which is25See also Barclay and Litzenberger (1988) and Loderer and Sheenan (1991).
29

arguably a superior measure under Hansen’s hypothesis. Regardless, tests for price reversal of the
type described above lack power since both the timing and duration of the hypothesized price dip
are likely to vary substantially across firms. Intra-day transactions data, as well as information on
bid-ask spreads and short-selling activity, would increase our power to test hypotheses predicting
temporary price effects in the post-announcement period, but this exceeds the bounds of the current
study.
The information content of subscription price discounts
The rights offer paradox hinges in part on the apparent reluctance of managers to issue rights
with a deep subscription price discount [Smith (1977)]. In principle, the deeper the discount, the
more valuable the right, and the more likely the issue will be fully subscribed. As discussed earlier,
a reluctance to offer a deep discount possibly reflects capital gains tax considerations or the cost of
compensating convertible security holders under anti-dilution clauses. Alternatively, as in Heinkel
and Schwartz (1986), a deep discount conveys negative information to outside investors about the
true value of the issue. In their model, offer failure is costly, and a rights issuer who privately expects
the stock price to fall over the rights offer period prefers to self insure by selecting a relatively low
offer price relative to the current market price. As a result, market participants infer the issuer’s
private information from the magnitude of the offer price discount. Thus, Heinkel-Schwartz predict
that greater discounts will cause larger downward adjustments in the stock’s secondary market
price.26
Table 10 presents the results of pooled cross-sectional regressions with the offer-day abnormal
stock return as dependent variable and the offer price discount as one of the explanatory variables.
The discount is computed as DISC = (p−p−1)/p−1, where p is the offer price and p−1 is the stock’s
closing price on the trading day prior to the offer day. News of the discount typically reaches the
market on the offer day, thus the dependent variable in this regression captures the information26Heinkel and Schwartz also model the issuer’s choice between uninsured rights, standby rights and firm com-
mitment underwritten offers. However, they assume that direct flotation costs are higher for standbys than for firmcommitments, which is contradicted by the flotation cost evidence presented earlier. Furthermore, their model impliesthat the most undervalued firms choose standby offers, which appears inconsistent with our evidence on the relativemarket reactions to equity announcements across flotation methods (table 8). This evidence does not, however,invalidate the Heinkel and Schwartz predictions concerning the information content of the rights offer discount whichare tested below.
30

effect of the discount.27
The offer price discount enters with an insignificant coefficient whether the issuer is an industrial
firm or a public utility. While not reported in table 10, DISC receives an insignificant coefficient
also when the regression is run separately for uninsured and standby rights offers. Moreover, since
subscription precommitments in uninsured rights offers tend to reduce the signalling effect of the
discount (since the risk of offer failure is low), the regression was reestimated with a precommitment
indicator variable. This specification also failed to produce a significant coefficient for DISC.
In sum, we find no support for the proposition that a relatively deep discount signals negative
information to the market concerning the true value of the issuer.
6.3 Determinants of k and the frequency of rights offers
To the extent that the value of k decreases as the firm’s equity capitalization and degree
of shareownership dispersion increase, the frequency of rights offers is expected to be highest for
relatively small, closely held firms. This is consistent with the evidence on industrial issuers in tables
1 and 2 above, and from the fact that smaller, private companies (not included in our sample) use
the rights method more frequently than publicly traded firms. On the other hand, table 2 indicates
that the average utility rights issuer, which according to table 7 have a high k-value, is relatively
large. Thus, although some large firms have concentrated ownership [Demsetz and Lehn (1985)],
firm size is most likely not the only factor determining k.
Our analysis also suggests that, for a given value of k, the greater the information asymmetry
between the issuer and the market, the greater the marginal benefit of quality certification, and
the greater the probability that the issuer will employ an underwriter. Issuers with a relatively
transparent production technology, or a high level of mandated disclosure, which reduces informa-
tion asymmetries between the firm and the market, are more likely to use rights. Thus, regulated
utilities, with the greater level of public information, are more likely to select rights issues.28 This27Note that since the offer discounts may be affected by the order flow asymmetries discussed earlier in this section,
the coefficient estimate for the offer discount in table 10 may be understated. Also, since our sample excludes canceledofferings, the average offer-day abnormal return reflects a slight survivorship bias. However, given the low number(less than 20) of offer cancellations found during the course of our sample selection or in Mikkelson and Partch (1988),we doubt that this selection bias is empirically important.
28Note that if the information asymmetry between the issuer and the market is sufficiently low, there is little tocertify, and the cost of the underwriting guarantee will exceed the benefit even if k is low. In these cases the issuerwill choose a direct offer, or a best effort contract. While these flotation methods are not part of the subsequentempirical analysis given their scarcity, it is interesting to note that certain public utilities, where regulatory policy
31

prediction is supported by the relatively high frequency of rights issues among utility issuers shown
earlier in table 1. Furthermore, the conjecture that information asymmetries play a relatively minor
role in the flotation method decision of these firms helps explain why utility issuers selecting rights,
which according to table 7 have high k-values, also tend to be relatively large in size.
Finally, since firms switching from rights to firm commitment offers must first eliminate cor-
porate charter provisions granting shareholders preemptive rights to purchase new equity issues,
our adverse selection framework also has implications for the timing of preemptive right charter
amendments. Specifically, as the value of k falls over time (perhaps because firm size grows with
time), managers find it optimal to switch to firm commitment offers and therefore propose preemp-
tive rights charter amendments. According to the sample of preemptive rights charter amendments
in Bhagat (1983), there was a surge in such amendments in early the 1970s, just preceding the
sharp reduction in rights issues shown in our table 1. Given the fact that equity issues by exchange
listed industrial firms are relatively infrequent, the clustering of the charter amendments in the
late 1960s and early 1970s possibly reflect a positive cross-sectional correlation in the demand for
equity capital by these firms.
7 Conclusions
This paper begins by reconfirming the rights offer paradox highlighted by Smith (1977) in
his study of seasoned equity offers. With a sample of more than 1000 firm commitment offers,
and nearly 200 rights offers made over the period 1962 through 1981, we show that average direct
flotation costs of uninsured rights are significantly lower than the costs of rights with standby
underwriting, which in turn are significantly cheaper than firm commitment offers. This conclusion
is further strengthened by our multivariate analysis where flotation costs are shown to be determined
by several issue specific characteristics regardless of the chosen flotation method. Yet, U.S. firms
overwhelmingly prefer the firm commitment method when issuing seasoned common stock, with
rights issues becoming relatively rare after 1975.
We show that the reduction in rights issues coincides with these same firms adopting dividend
reinvestment plans which allow shareholders to receive shares of common stock in lieu of cash
reduces information asymmetries, appear to be the most frequent users of direct offers.
32

dividends. Given the apparent reluctance of managers to cut long-run dividend levels, dividend
reinvestment plans are similar to a periodic rights offer. Thus, a narrow focus on rights issues tends
to understate actual shareholder participation in new equity issues in the period after 1975. Never-
theless, the combined growth of rights and dividend reinvestment plans is relatively limited, leaving
unexplained why underwritten equity offers continue to be the predominant flotation method.
The revealed preference for underwritten offers possibly reflects as yet unidentified managerial
benefits of underwritten offers (an agency cost hypothesis) or indirect costs which cause value-
maximizing managers to avoid rights. Examples of these indirect costs are capital gains taxes
[Smith (1977)], shareholder-borne costs of reselling rights [Hansen (1988)], wealth transfers to
convertible security holders under anti-dilution clauses, and risk of offer failure resulting from the
increased short-selling activity encouraged by the rights offer. While all of these costs may play a
role in resolving the paradox, the existing evidence does not indicate that any one of them is the
dominant explanation.
By placing the flotation method choice in an adverse selection framework, we identify a possible
trade-off between rights and underwritten offers which has not previously been recognized in the
literature. We view current shareholder subscription in rights offers and underwriter certification
in firm commitments as substitute mechanisms for minimizing wealth transfers between current
shareholders and outside investors. From the outside investors’ point of view, a rights issue where
current shareholders elect not to subscribe is informationally equivalent to a direct sale of stock to
the market by the company. Given the availability of underwriter quality certification services, such
a direct stock issue causes the market to infer that the stock is overvalued, resulting in relatively
large adverse selection costs of the type analyzed in Myers and Majluf (1984). Adverse selection
costs are reduced in direct proportion to the degree of current shareholder participation in the issue
or, alternatively, by the relatively costly services of an underwriter. Conditional on the expected
current shareholder takeup, we show how under- and overvalued issuers of stock choose between
uninsured rights, standby rights and firm commitment offers, and how the market respond to these
choices. In this framework, observed flotation method choices reflect shareholder characteristics,
the degree of information asymmetry between the issuer and the market, and direct flotation costs.
Our framework yields a wide range of empirical predictions across equity offers for rights, stand-
bys and firm commitments which we find is broadly consistent with the evidence. The analysis helps
33

explain why rights issuers tend to have large blockholder subscription precommitments, why aver-
age stock returns at equity offer announcements vary by flotation method, being most negative for
firm commitments and least negative for rights offers, and why firms tend to switch to underwritten
offers as growth in firm size causes substantial dispersion of share ownership. It also suggests a
possible explanation for why large exchange listed U.S. firms in recent years have gravitated to the
firm commitment method. Similarly, the analysis offers a possible explanation for the recent shift
to firm commitments by large UK and Japanese firms who have experienced increased dispersion in
shareownership, and why corporations in most other markets (which are typically small and closely
held) continue to rely on rights and standbys to sell their stock. The current trends in these other
capital markets offer a fertile ground for further analysis of the security issuance process.
34
References
Asquith, Paul and David W. Mullins, 1986, Equity issues and stock price dilution, Journal ofFinancial Economics 15, 61–89.
Barclay, Michael J. and Robert H. Litzenberger, 1988, Announcement effects of new equity issuesand the use of intraday price data, Journal of Financial Economics 21, 71-99.
Beatty, Randolph P. and Jay R. Ritter, 1986, Investment banking, reputation, and the underpricingof initial public offers, Journal of Financial Economics 15, 213-232.
Bhagat, Sanjai, 1983, The effect of pre-emptive right amendments on shareholder wealth, Journalof Financial Economics 12, 289-310.
Bhagat, Sanjai and Peter A. Frost, 1986, Issuing costs to existing shareholders in competitive andunderwritten public utility equity offers, Journal of Financial Economics 15, 233–259.
Bhagat, Sanjai, M. Wayne Marr and G. Rodney Thompson, 1985, The Rule 415 experiment: Equitymarkets, Journal of Finance 40, 1385–1401.
Blackwell, David W., M. Wayne Marr and Michael F. Spivey, 1990, Shelf registration and the re-duced due diligence argument: Implications of the underwriter certification and the implicitinsurance hypotheses, Journal of Financial and Quantitative Analysis 25, 245-259.
Black, Fischer and Myron Scholes, 1973, The pricing of options and corporate liabilities, Journalof Political Economy 84, 637-654.
Booth, James R. and Richard L. Smith, III, 1986, Capital raising, underwriting and the certificationhypothesis, Journal of Financial Economics 15, 261–281.
Bøhren, Øyvind, B. Espen Eckbo and Dag Michaelsen, 1992, Equity issues in Norway: Implicationsfor the rights offer anomaly, working paper, Norwegian School of Management.
Choe, Hyuk, Ronald W. Masulis and Vikram Nanda, 1991, Adverse selection in common stockofferings: Theory and evidence, working paper, Vanderbilt University.
DeAngelo, Harry, Linda DeAngelo and Douglas Skinner, 1991, Dividends, losses and the quality ofearnings, working paper, University of Southern California.
Dehnert, Jocelyn, 1991, The determinants of the size of equity issue announcement effects, un-published Ph.D. dissertation, Australian School of Management, University of New SouthWales.
Dierkens, Nathalie, 1991, Information asymmetry and equity issues, Journal of Financial and Quan-titative Analysis 26, 181-199.
Demsetz, Harold and Kenneth Lehn, 1985, The structure of corporate ownership: Causes andconsequences, Journal of Political Economy 93, 1155-1177.
Eckbo, B. Espen, 1986, Valuation effects of corporate debt offerings, Journal of Financial Economics15, 119–151.
Eckbo, B. Espen, Vojislav Maksimovic and Joseph Williams, 1990, Consistent estimation of cross-sectional models in event studies, Review of Financial Studies 3, 343-365.
35

Eckbo, B. Espen and Ronald W. Masulis, 1986, Preemptive rights amendments and the rightsoffering anomaly, working paper, University of British Columbia.
Eckbo, B. Espen and Savita Verma, 1992, Voting power and the valuation effects of security offer-ings, working paper, University of British Columbia.
Hansen, Robert S., 1988, The demise of the rights issue, Review of Financial Studies 1, 289-309.
Hansen, Robert S., Beverly R. Fuller and Vanan Janjigian, 1987, The over-allotment option andequity financing flotation costs: An empirical analysis, Financial Management 16, 24-32.
Hansen, Robert S. and John M. Pinkerton, 1982, Direct equity financing: A resolution of a paradox,Journal of Finance 37, 651-665.
Hansen, Robert S., John M. Pinkerton and Taj Ma, 1986, On the rightholders’ subscription to theunderwritten rights offer, Journal of Banking and Finance 10, 595-604.
Heinkel, Robert and Eduardo S. Schwartz, 1986, Rights vs. underwritten offers: An asymmetricinformation approach, Journal of Finance 41, 1–18.
Herman, Edward S., 1981, Corporate control, corporate power (Cambridge University Press, NewYork).
Hietala, Pekka and Timo Loyttyniemi, 1991, Raising equity using rights issues: Evidence on sig-nalling, working paper, INSEAD.
Kalay, Avner, 1980, Signalling, information content and the reluctance to cut dividends, Journalof Financial and Quantitative Analysis 15, 855-869.
Kalay, Avner and Adam Shimrat, 1987, Firm value and seasoned equity issues: Price pressure,wealth redistribution, or negative information, Journal of Financial Economics 19, 109–126.
Kaplan, Stanley, 1965, Piercing the corporate boilerplate: Anti-dilution clauses in convertible se-curities, University of Chicago Law Review 33, 1-30.
Kato, Kiyoshi and James S. Schallheim, 1991, Public and private placements of seasoned equityissues in Japan, working paper, University of Utah.
Korajczyk, Robert A., Deborah Lucas and Robert L. McDonald, 1990, Understanding stock pricebehaviour around the time of equity issues, in R. Hubbard (ed.), Asymmetric Information,Corporate Finance and Investment, (University of Chicago Press, Chicago, Ill.).
Kothare, Meeta, 1991, Equity financing: An investigation of the rights offer anomaly, workingpaper, University of Texas at Austin.
Krasker, William S., 1986, Stock price movements in response to stock issues under asymmetricinformation, Journal of Finance 41, 93–105.
Lease, Ronald, Ronald W. Masulis and John R. Page, 1991, An investigation of market microstruc-ture impacts on event study returns, Journal of Finance 46, 1523-1536.
Lease, Ronald, Ronald W. Masulis and John R. Page, 1992, Impacts of seasoned equity offeringson the market microstructure and the stock return generating process, working paper,Vanderbilt University.
36
Lintner, John, 1956, Distribution of incomes of corporations among dividends, retained earnings,and taxes, American Economic Review 46, 97-113.
Loderer, Claudio and Dennis Sheenan, 1991, Seasoned stock offerings and the bid-ask spread,working paper, Purdue University.
Loderer. Claudio, Dennis Sheenan and Gregory B. Kadlec, 1991, The pricing of equity offerings,Journal of Financial Economics 29, 35-57.
Loderer, Claudio and Heinz Zimmerman, 1988, Stock offerings in a different institutional setting:The Swiss case, Journal of Banking and Finance 12, 353-378.
Lucas, Deborah and Robert L. McDonald, 1990, Equity issues and stock price dynamics, Journalof Finance 45, 1019-1043.
MacCulloch, R.J. and D.M Emanuel, 1990, The valuation of New Zealand underwriting agreements,working paper, University of Auckland, New Zealand.
Marsh, Paul, 1979, Equity rights issues and the efficiency of the UK stock market, Journal ofFinance 34, 839–862.
Masulis, Ronald W. and Ashok N. Korwar, 1986, Seasoned equity offers: An empirical investigation,Journal of Financial Economics 15, 91–118.
Mikkelson, Wayne H. and M. Megan Partch, 1988, Withdrawn security offers, Journal of Financialand Quantitative Analysis 23, 119-133.
Myers, Stewart C. and Nicholas S. Majluf, 1984, Corporate financing and investment decisionswhen firms have information investors dot not have, Journal of Financial Economics 13,197–221.
Myhal, Patricia, 1990, Some observations on the “usual” anti-dilution provisions, Canadian Busi-ness Law Journal 17, 283-302.
Officer, Dennis T. and Richard L. Smith, 1986, Announcement effects of withdrawn security offer-ings: Evidence on the wealth redistribution hypothesis, Journal of Financial Research 9,229-238.
Parsons, John E. and Arthur Raviv, 1985, Underpricing of seasoned issues, Journal of FinancialEconomics 14, 377–397.
Phillips, S.M. and C.W. Smith, 1980, Trading costs for listed options: The implications for marketefficiency, Journal of Financial Economics 8, 179–201.
Ritter, Jay, 1987, The costs of going public, Journal of Financial Economics 19, 269-282.
Scholes, Myron and Mark Wolfson, 1989, Decentralized investment banking: The case of discountdividend reinvestment and stock purchase plans, Journal of Financial Economics 23, 7-35.
Singh, Anjan, 1992, Common stock rights offering and the standby underwriting contract, workingpaper, Iowa State University.
Smith, Clifford W. Jr., 1977, Alternative methods for raising capital: Rights vs. underwrittenoffers, Journal of Financial Economics 5, 273–307.
37
Smith, Clifford W. Jr., 1986, Investment banking and the capital acquisition process, Journal ofFinancial Economics 15, 3-29.
Smith, Richard and Manjeet Dhatt, 1984, Direct equity financing: A resolution of a paradox: Acomment, Journal of Finance 39, 1615-1618.
Stevenson, Harold W., 1957, Common Stock Financing, (Michigan Business Reports no. 29, Bureauof Business Research, University of Michigan).
Tinic, Seha M., 1988, Anatomy of initial public offerings of common stock, Journal of Finance 43,789-822.
Titman, Sheridan and Brett Trueman, 1986, Information quality and the valuation of new issues,Journal of Accounting and Economics 8, 159-172.
White, Robert W. and Peter A. Lusztig, 1980, The price effects of rights offers, Journal of Financialand Quantitative Analysis 15, 25-40.
38

Table 1
Annual distribution of the number of seasoned common stock offer announcements by NYSE/AMEX listed industrialfirms (‘Ind’) and regulated utilities (‘Utl’), classified by offering method. Total data base, 1963-1981.1
Rights offersFirm commitment Standby Uninsuredunderwritten offers Rights rights
Year ofissue Total Total Totalannouncement offers underwritten Ind Utl rights Ind Utl Ind Utl
1963 12 2 1 1 10 3 3 1 31964 17 8 4 4 9 3 3 1 21965 20 5 5 0 15 4 5 2 41966 27 12 7 5 15 8 4 2 11967 26 12 9 3 14 4 5 4 11968 44 26 20 6 18 4 5 7 21969 42 24 13 11 18 7 8 2 11970 49 36 18 18 13 2 8 2 11971 84 65 40 25 19 2 13 2 21972 81 68 27 41 13 1 10 1 11973 58 50 10 40 8 1 5 1 11974 53 47 5 42 6 0 3 1 21975 89 79 19 60 10 1 8 0 11976 93 88 29 59 5 1 3 0 11977 65 62 2 60 3 0 3 0 01978 90 86 23 63 4 2 1 0 11979 85 81 20 61 4 0 2 1 11980 162 157 86 71 5 0 2 1 21981 152 149 63 86 3 0 1 1 1
All 1249 1057 401 656 192 43 92 29 28
1 Primary offer of seasoned common stock are identified from company announcements in the Wall Street JournalIndex, the Investment Dealer’s Digest and Moody’s Industrials and Utilities Manuals. Rights offers are identifiedfrom the “Rights Distributed” section of Moody’s Dividend Record as well as previously cited sources. The samplesatisfies the following criteria: (1) The common stock is listed on either the NYSE or AMEX; (2) the initial publicannouncement appears in the Wall Street Journal or Predicast’s F&S Index of Corporations and Industries or theDow Jones News Retrieval Service; (3) no simultaneous offers of debt, preferred stock or warrants were announced; (4)combination primary/secondary stock offerings, cancelled or postponed offers, and non-U.S. issues are excluded; and(5) information in the offer prospectus or the Investment Dealer’s Digest’s Corporate Financing Directory permits aclassification of the rights offers into those issues involving and not involving standby underwritten agreements.
39

Table 2
Mean (median) values of offer characteristics for the total sample of seasoned common stock offers classified by thetype of firm and flotation method, 1963-1981.1
Firm commitments Standby rights Uninsured rightsOfferingcharacteristic Ind Utl Ind Utl Ind Utl
Number of observations 401 656 43 92 29 28
Shares issued/ 13.0 9.9 15.4 8.3 24.2 10.0old plus new shares (%) (11.1) (9.3) (12.5) (9.1) (20.1) (9.1)
Amount offered 33.3 50.6 60.4 48.3 15.1 169.7($ millions) (19.8) (37.3) (21.6) (31.5) (8.6) (108.6)
Amount offered/ 16.5 11.2 20.2 9.2 34.7 11.3market value of equity (%) (12.5) (10.3) (14.3) (10.0) (25.2) (10.0)
Market value of equity 389.6 732.9 960.5 547.0 51.2 1962.5($ millions) (149.2) (391.0) (133.2) (371.8) (26.7) (977.0)
Firm total assets 855.2 2437.2 1083.3 1698.4 133.4 3846.2($ millions) (148.0) (1254.0) (157.3) (988.2) (69.1) (1441.2)
1 “Ind” denotes industrial issuer and “Utl” denotes public utility. Data sources for the offer characteristics includeMoody’s Daily Stock Price Guide and Handbook of Common Stocks, Standard & Poor’s Manuals, Investment Dealer’sDigest, Corporate Financing Directory, the Wall Street Journal Index, and offer prospectuses.
40

Table 3
The number and proportion of NYSE and AMEX listed seasoned common stock issuers adopting dividendreinvestment plans (DRIPs) over the 1973-1981 period, and the number of stock issues following DRIP adoption,
classified by the flotation method.1
Number of stock issuers Stock offers by Stock offers byregistering DRIPs issuers with DRIPs issuers without DRIPs
Offer Firm Rights/ Firm Rights/ Firm Rights/year commitments standbys commitments standbys commitments standbys
1973 6 4 3 2 54 91974 5 5 4 1 40 41975 13 7 5 5 72 51976 18 2 18 1 73 31977 15 12 32 3 29 31978 18 3 35 1 50 31979 10 2 40 2 40 31980 15 2 57 1 101 41981 15 2 67 1 83 3
Total 115 29 261 17 542 37
Proportion (%) 28 54 94 6 94 6
1 The population of stock issuers underlying this table is given by the 419 firms in table 1 that made one ormore firm commitment offers, and the 54 firms that made rights/standby issues, over the 1970-1981 period.Furthermore, the table requires the DRIP to be funded with new shares where the SEC registration involvedat least 10,000 common shares; it excludes regulated investment company issuers; and it assumes that AT&T’sDRIP date does not apply to its separately incorporated subsidiaries. Prior to a 1968 revision in SEC regu-lations, only regulated investment companies were able to offer DRIPs. Furthermore, according to the SECRegistered Offerings Statistics tape, firms did not begin to sell shares through DRIPs until 1973.
41

Table 4
Secondary market prices around the offer day as a percent of offer pricesfor firm commitment seasoned common stock offers by
NYSE and AMEX listed firms (1963-1981)
I. Industrial issues (N=401)
Offer day -1 Offer dayMean Median % EO % GT Mean Median % EO % GT
Open 0.00649 0.00382 13.4 32.4 0.00127 0.00000 56.9 19.3High 0.01801 0.01296 11.0 1.4 0.00929 0.00490 26.6 9.0Low -0.00510 -0.00349 32.8 52.4 0.00787 0.00000 50.7 41.4Close 0.00444 0.00000 62.1 3.1 -0.00113 0.00000 34.8 26.2
II. Utility issues (N=656)
Offer day -1 Offer dayMean Median % EO % GT Mean Median % EO % GT
Open -0.00414 -0.00619 20.5 58.2 -0.00253 0.00000 48.7 42.4High 0.00327 0.00000 36.5 22.9 0.00322 0.00000 36.8 17.9Low -0.01108 -0.01061 11.6 85.3 -0.00502 -0.00455 43.4 54.4Close -0.00305 0.00000 50.9 42.8 -0.00061 0.00000 43.2 33.2
1 The mean and median values are of the return (pt− p)/p, where pt is the secondary market price as of event time trelative to the first day of the offer (day 0), and p is the offer price. Thus, positive values indicate offer price discountswhile negative values indicate premiums. ‘%EQ’ and ‘%GT’ are the percent of the cases where p = pt and p > pt,respectively. Closing prices are from the CRSP file (entire sample period), while the open, high, and low prices arefrom the Cornell University Price-Volume file (1970-1981).
42

Table 5
Mean (median) underwriter compensation and other flotation expenses for the sample of seasoned common stockoffers, classified by the type of firm and method of offering, 1963-1981.1
Firm commitments Standby rights Uninsured rights
Flotation costs Ind Utl Ind Utl Ind Utl
Number of observations 351 639 42 89 26 23
Underwriter compensation 1.47 1.78 1.20 0.56 – –($ millions) (1.03) (1.32) (0.47) (0.34)
Other expenses 0.16 0.14 0.36 0.38 0.11 0.45($ millions) (0.15) (0.12) (0.19) (0.29) (0.09) (0.19)
Total costs 1.72 1.92 1.59 0.94 0.11 0.45($ millions) (1.28) (1.45) (0.68) (0.72) (0.09) (0.19)
Total costs/ 6.09 4.23 4.03 2.44 1.82 0.51gross proceeds (%) (5.53) (3.82) (3.32) (2.07) (0.94) (0.22)
Total costs/ 1.05 0.49 0.93 0.22 0.80 0.05market value common (%) (0.68) (0.41) (0.57) (0.18) (0.30) (0.02)
1 “Ind”denotes industrial issues and “Utl”denotes public utility. Data sources are the SEC Registered OfferingsStatistics data tape and issue prospectuses. The cost of the offer price discount in firm commitment offers is notincluded, nor is the value of any “Green Shoe” options. In the standby rights category, the underwriter’s compensationis computed using the actual takeup fee based on subscription information shown in table 7, below.
43

Table 6
OLS parameter estimates in cross-sectional regressions of percentage flotation costs against issue characteristics and offeringmethod, 1963-1981.1
(t-statistics in parentheses)
Model : FC = α0 + α1PRO + α2PRO2 + α3∆SHR + α4SCON + α5ST + α6D1 + α7D2
α0 α1 α2 α3 α4 α5 α6 α7 R2 F value
I. Industrial issues (N=402)2
0.29 -0.05 0.002 0.01 -0.004 0.50 0.05 0.02 0.74 160.0(7.58) (-6.22) (4.75) (3.07) (-5.11) (6.29) (14.42) (9.71)
II. Utility issues (N=702)3
0.55 -0.10 0.005 -0.02 -0.003 0.81 0.03 0.000 0.38 60.0(11.24) (-10.33) (9.56) (1.09) (-3.36) (4.68) (8.37) (0.02)
1 Variable definitions:FC = direct flotation costs (the sum of underwriter fees and other expenses in table 5) as a percent of gross proceeds.PRO = natural log of gross proceeds of offerPRO2 = square (PRO)SCON = natural log of share value at the offering divided by number of shareholders (based on offer price)ST = standard deviation of issuer’s daily stock return over 450 trading days starting 60 days prior to the Wall Street Journaloffer announcement∆SHR = percentage change in shares outstanding due to the offer (new shares divided by old plus new shares)D1 = indicator variable of offering method (standby or firm commitment offer = 1)D2 = 2nd indicator variable of offering method (firm commitment underwritten offer = 1)
2 The total sample of 402 consists of 337 firm commitments, 40 standbys and 25 uninsured rights offers.
3 The total sample of 702 consists of 597 firm commitments, 83 standbys and 22 uninsured rights offers.
44
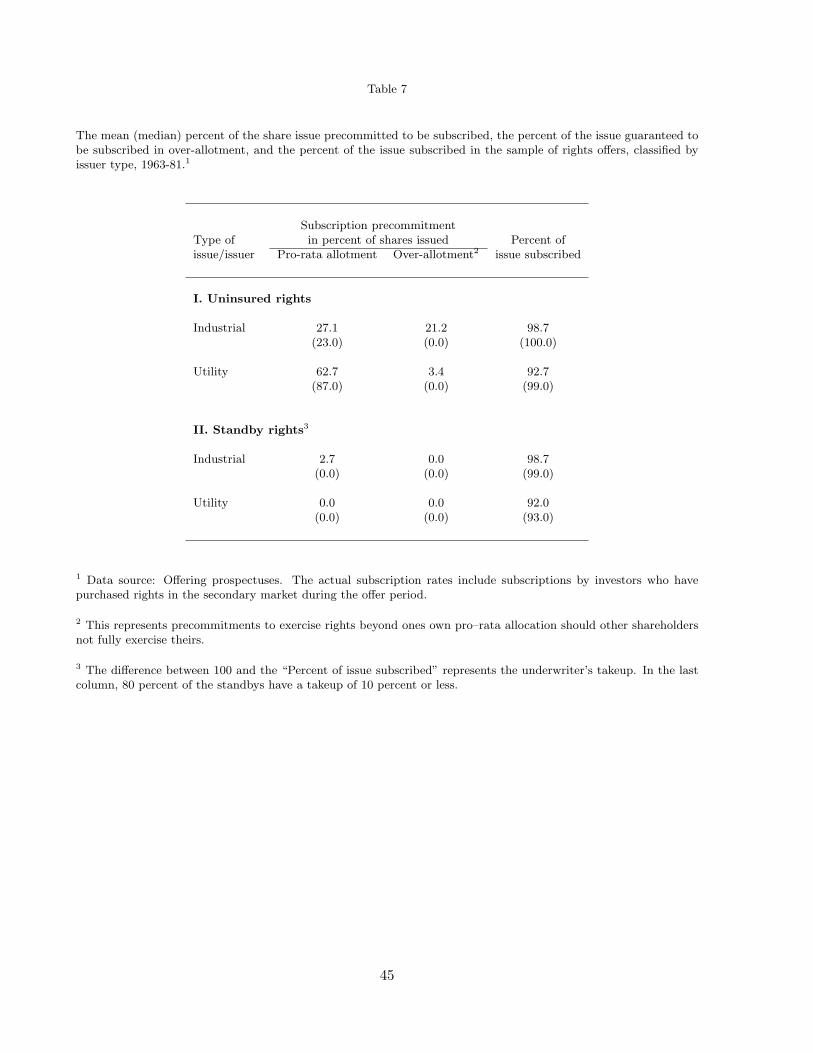
Table 7
The mean (median) percent of the share issue precommitted to be subscribed, the percent of the issue guaranteed tobe subscribed in over-allotment, and the percent of the issue subscribed in the sample of rights offers, classified byissuer type, 1963-81.1
Subscription precommitmentType of in percent of shares issued Percent ofissue/issuer Pro-rata allotment Over-allotment2 issue subscribed
I. Uninsured rights
Industrial 27.1 21.2 98.7(23.0) (0.0) (100.0)
Utility 62.7 3.4 92.7(87.0) (0.0) (99.0)
II. Standby rights3
Industrial 2.7 0.0 98.7(0.0) (0.0) (99.0)
Utility 0.0 0.0 92.0(0.0) (0.0) (93.0)
1 Data source: Offering prospectuses. The actual subscription rates include subscriptions by investors who havepurchased rights in the secondary market during the offer period.
2 This represents precommitments to exercise rights beyond ones own pro–rata allocation should other shareholdersnot fully exercise theirs.
3 The difference between 100 and the “Percent of issue subscribed” represents the underwriter’s takeup. In the lastcolumn, 80 percent of the standbys have a takeup of 10 percent or less.
45

Table 8
Percent average abnormal stock returns relative to the issue announcement (a), offer–begin (b), and offer expiration(e) dates for seasoned common stock offers classified by issuer type and flotation method, over the period 1963-1981.The regression model is
rjt = αj + βj rmt +
6∑n=1
γjndnt + εjt
where rjt and rmt denote the continuously compounded daily rates of return to firm j and the value–weighted marketportfolio; the five dummy variables dnt each take on values of one over the intervals corresponding to each of the sixcolumns in the table, and zero otherwise. The issuing firm’s abnormal return over event period n is wjnγj , wherewjn is the number of days in the event period. (z–value, and percent negative in parenthesis)1
Event PeriodOffering method/ a-60 a-1 a+1 b+1issuer type through a-2 through a through b-1 b through e-1 e
I. Firm commitments2
Industrials 12.05 -3.34 0.97 -0.21 0.91 -(N=389) (11.89, 24.7) (-21.48, 82.5) (1.18, 47.6) (-1.75, 55.5) (1.69, 44.2)
Utilities 0.77 -0.80 -0.80 0.19 -0.08 -(N=646) (2.29, 48.9) (-11.57, 66.9) (-2.09, 55.6) (4.53, 41.2) (-0.19, 50.5)
II. Standby rights3
Industrials 4.57 -1.03 -0.87 -1.10 -1.03 0.51(N=41) (1.97, 43.9) (-2.04, 56.1) (-0.45, 53.7) (-5.08, 70.7) (-0.58, 58.5) (2.09, 41.5)
Utilities 0.11 -0.53 -2.73 -0.67 -0.55 0.07(N=87) (0.03, 49.4) (-2.28, 63.2) (-3.37, 74.7) (-6.06, 70.1) (-0.83, 58.5) (0.72, 43.7)
III. Uninsured rights4
Industrials -2.38 -1.39 -6.88 -1.33 -3.55 0.81(N=26) (-0.42, 53.8) (-1.56, 69.2) (-1.32, 65.4) (-1.94, 57.7) (-2.63, 69.2) (1.54, 42.3)
Utilities 3.11 0.23 -1.87 -0.34 -3.23 0.27(N=27) (2.15, 40.7) (1.00, 51.9) (-1.18, 55.6) (-1.72, 59.3) (-3.12, 77.8) (0.97, 44.4)
1 The estimation uses 450 daily stock returns from the CRSP tape, starting on day a − 60. For event period n,zn = (1/
√N)
∑Nj=1(γjn/σγjn), where the “hat” denotes OLS estimate and σγjm is the estimated standard deviation
of γjn. Under the null hypothesis of zero abnormal return, zn is approximately standard normal for large N.2 Since firm commitment offers have no formal offer expiration day, we use e = b + 20 in this offer category, which iscomparable to the length of a typical rights offer (see below). The average number of trading days between the issueannouncement and the beginning of the offer period is 26 for the industrial offers and 33 for the public utility offers.3 The average number of trading days from a to b is 31 for industrial and 38 for utility offers, while e − b (i.e., thelength of the subscription period) averages 12 for industrial standbys and 13 for utility standbys.4 The average number of trading days from a to b is 40 for industrial and 45 for utility offers, the e− b averages 14for industrials and 21 for utilities.
46

Table 9
OLS estimates of coefficients in linear cross–sectional regressions of the percent two–day announcement period abnormal stockreturn plus flotation costs on firm and issue characteristics, 1963–1981.1
(t–values in parentheses)
Model : AR + FC = δ0 + δ1lnA + δ2ST + δ3RUN + δ4AUT + δ5SCON + δ6∆(D/E) + δ7D1 + δ8D2
δ0 δ1 δ2 δ3 δ4 δ5 δ6 δ7 δ8 R2 F
I. Industrial issues (N = 402)2
-0.01 -0.28 3.39 -3.94 1.27 0.08 0.01 0.94 -1.88 0.08 4.6(-0.01) (-1.90) (0.12) (-3.50) (2.03) (0.40) (0.35) (0.88) (-2.68)
II. Utility issues (N = 737)3
3.91 -0.20 -66.60 -3.53 -0.51 -0.39 -0.09 -1.05 -0.04 0.09 8.3(5.24) (-3.05) (-3.23) (-4.19) (-2.48) (-3.39) (-0.60) (-2.13) (-0.17)
1 The dependent variable is the sum of the two-day announcement period abnormal stock return and the direct flotation costsfrom table 6. The explanatory variables arelnA = natural log of firm total assetsRUN = cumulative abnormal stock return over the period –60 through –2 relative to the offer announcement dayAUT = indicator variable which takes on a value of one if the firm had sought and obtained additional common stock autho-rizations in the year preceding the offering announcement and zero otherwise∆(D/E) = implied change in issuer’s debt/equity ratio (see text)The variables ST , SCON , D1 and 6D2 are defined as in Table 6.
2 The 402 issues consists of 334 firm commitments, 42 standbys, and 26 uninsured rights offers.
3 The 737 issues consists of 630 firm commitments, 86 standbys, and 21 uninsured rights offers.
47

Table 10
OLS estimates of coefficients in linear cross–sectional regressions with the offering day abnormal stock return as dependentvariables and the offering discount and other issue and issuer characteristics as explanatory variables, 1963–1981.1
(t–values in parentheses)
Model : AR = θ0 + θ1DISC + θ2lnA + θ3ST + θ4SCON + θ5D1 + θ6D2
θ0 θ1 θ2 θ3 θ4 θ5 θ6 R2 F
I. Industrial issues (N=451)2
-1.06 -0.73 -0.01 -31.64 -0.01 0.59 1.16 0.05 3.6(-1.25) (-0.65) (-0.08) (-1.99) (-0.12) (0.93) (2.40)
II. Utility issues (N=761)3
0.56 1.01 -0.03 -17.11 -0.09 -0.55 0.79 0.07 9.2(1.34) (0.88) (-0.79) (-1.55) (-1.58) (-2.20) (4.94)
1 The dependents variable is the offering day abnormal stock return DISC = (P0 − P−1)/P−1, where P0 is the offering priceand P−1 is the stock’s closing price on the day prior to the offering day. See table 6 for the mean and median values of DISCacross flotation methods. The explanatory variables ST, SCON, D1 and D2 are as defined in Table 6.
2 The total sample of 451 consists of 379 firm commitments, 43 standbys and 27 uninsured rights offers.
3 The total sample of 761 consists of 646 firm commitments, 88 standbys, and 23 uninsured rights.
48