adverse outcome pathways outcome pathways what are they? what are they good f?for? how can they be...
TRANSCRIPT

Adverse Outcome PathwaysAdverse Outcome PathwaysAdverse Outcome PathwaysAdverse Outcome PathwaysWhat are they?What are they?
Wh h d f ?Wh h d f ?What are they good for?What are they good for?How can they be used in risk assessment?How can they be used in risk assessment?
Daniel L. Villeneuve, Ph.D.US EPA, National Health and Environmental Effects Laboratory (NHEERL)*
Mid-continent Ecology Division (MED)
SOT Risk Assessment Specialty Section, Monthly WebinarWednesday April 8 2015
6201 Congdon Blvd, Duluth, MN
Wednesday April 8, 2015.
*The contents of this presentation neither constitute nor, necessarily, reflect US EPA views or policies.

Disclaimers
*The contents of this presentation neither constitute nor, necessarily reflect US EPA views or policiesnecessarily, reflect US EPA views or policies.
*I’m an EcotoxicologistI m an Ecotoxicologist
• I’ll be presenting “eco” examples
• I’m not an expert on human health risk assessment
• I’m interested in learning from youg f y

Introduction
p,p’‐DDE
Contribution of DDT to population declines in sensitive bird populations
Perhaps the most well known incident in wildlife ecotoxicology
Helped spark the environmental movement, and in part the mission of EPA

Introduction
A central challenge for regulatory toxicology
How do we identify the other chemicals that may cause similar adverse effectsHow do we identify the other chemicals that may cause similar adverse effects
Before we see impacts on human health or wildlife populations
Traditional Approach
Avian reproduction study(OPPTS 850.2300; OECD 206)
$>250 000$>250,000 >30 weeks to perform

Introduction
If we understand HOW chemicals cause adverse outcomes
And…biological activities that lead to/are associated with progression toward those AOs
Prostaglandin Ca2+ and HCOProstaglandin
Creates opportunities to use new types of data for hazard id and/or risk‐based decision‐making
gsynthaseinhibition(cox‐1 or 2 and peroxidase)
Ca2+ and HCO3 transport to shell‐gland
lumen impaired
Eggshell thickness reduced
Crushed eggs, breeding failure
E2 concentrations in eggshell
gland mucosa, reduced
gap
High throughput toxicology• > 600 in vitro assays• daysy• ≈ $ 20,000
1

Introduction
“Transform toxicity testing from a system based on whole‐animal i f d d i il i i h d h ltesting to one founded primarily on in vitro methods that evaluate
changes in biologic processes using cells, cell lines, or cellular components, preferably of human origin”
“The vision emphasizes the development of suites of predictive, high‐throughput assays …..”p , g g p y
“The mix of tests in the vision include tests that assess critical mechanistic endpoints involved in the induction of overt toxic effects rather than the effects themselves.”
6
t e se es

Introduction
ToxCastToxCast> 600 assays, >2000 chemicals,
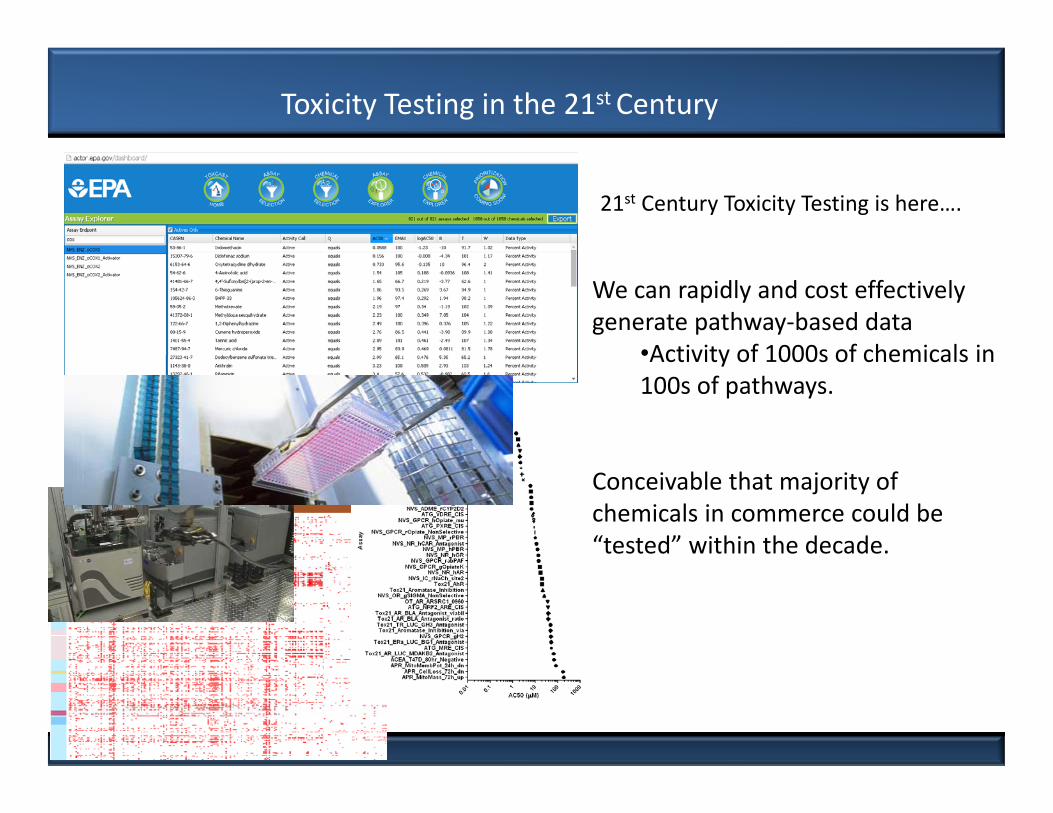
Toxicity Testing in the 21st Century
21st Century Toxicity Testing is here….
We can rapidly and cost effectively generate pathway‐based data
•Activity of 1000s of chemicals in•Activity of 1000s of chemicals in 100s of pathways.
Conceivable that majority of chemicals in commerce could be “tested” within the decade.
1

Example
So What?
•Can we expect this perturbation lead to an adverse outcome?adverse outcome?

Introduction
An Adverse Outcome Pathway (AOP) is a conceptual framework that portrays existing knowledge concerning the An Adverse Outcome Pathway (AOP) is a conceptual framework that portrays existing knowledge concerning the
linkage between a direct linkage between a direct molecular initiating eventmolecular initiating event and an and an adverse outcomeadverse outcome, at a level of biological organization , at a level of biological organization
relevant to risk assessment.relevant to risk assessment.
((AnkleyAnkley et al. 2010, Environ. et al. 2010, Environ. ToxicolToxicol. Chem., 29(3): 730. Chem., 29(3): 730‐‐741.)741.)
ToxicantCellular Responses
OrganResponses
OrganismResponses
PopulationResponses
Macro‐MolecularInteractions
ChemicalProperties
Receptor/LigandInteraction
DNA Binding
Gene activation
Protein production
Altered physiology
Disrupted h i
Lethality
Impaired Development
Toxicant Responses Responses Responses
Structure
Recruitment
ResponsesInteractions
Protein Oxidation Altered signaling
homeostasis
Altered tissue development/
function
Impaired Reproduction
Extinction
• Helps us organize what we know
A d tili th t k l d t t i k b d d i i ki• And utilize that knowledge to support risk‐based decision‐making

Example
Prostaglandin synthaseinhibition(cox‐1 or 2 and peroxidase)
Ca2+ and HCO3 transport to shell‐gland
lumen impaired
Eggshell thickness reduced
Crushed eggs, breeding failure
Prostaglandin E2
concentrations in eggshell
gland mucosa, gap
peroxidase) reduced
Ah-ha

Introduction
Prostaglandin synthaseinhibition(cox‐1 or 2 and
)
Ca2+ and HCO3 transport to shell‐gland
lumen impaired
Eggshell thickness reduced
Crushed eggs, breeding failure
Prostaglandin E2
concentrations in eggshell
gland mucosagap
peroxidase) pgland mucosa,
reduced
A set of chemicals for which there may be reason expect egg‐shell thinning

Introduction
Prostaglandin synthaseinhibition(cox‐1 or 2 and
)
Ca2+ and HCO3 transport to shell‐gland
lumen impaired
Eggshell thickness reduced
Crushed eggs, breeding failure
Prostaglandin E2
concentrations in eggshell
gland mucosagap
peroxidase) pgland mucosa,
reduced
•Alternative tests: Suggests informative endpoints we may be able to measure more rapidly and cost‐ff ti l i l b t t i it t teffectively in laboratory toxicity tests.
•Biomarkers: Suggests biomarkers we could measure in animals from the environment – early warning; diagnostic
• Particularly if we can translate into a quantitative prediction of probability or severity of AO.p p y y
•Diagnostic potential: Suggests an etiology for observed patterns of biological response – may help trace back to causative agents and/or sourcestrace back to causative agents and/or sources.

Introduction
•HTS is not the only relevant source of mechanistic data
•Toxicology research community has been studying mechanismsToxicology research community has been studying mechanisms underlying toxicity for decades.
•Considerable mechanistic data exists in the literature currently•Considerable mechanistic data exists in the literature – currently under‐utilized for regulatory applications.
• Biomarkers•Omics
Molecular Cellular Tissue Organ Organ System Individual Population Ecosystem
•Survival•Growth/development
•QSAR and Read‐Across•High content imaging• In vitro•Alternative model organisms (e g zebrafish drosophila C elegans)
Growth/development•Reproduction
Human Health Ecosystem Health
Alternative model organisms (e.g., zebrafish, drosophila, C. elegans)

Introduction
AOPs and environmental surveillance and monitoring.
Connecting chemicals to potential hazards

21st Century Regulatory Decision‐Making
The data are there….
We have entire libraries of scientificWe have entire libraries of scientific publications available at our fingertips…..
Scientific challenge of the 21st C….
How do we make effective use of those data and our wealth of existing scientific knowledge to support regulatory decision making?decision‐making?
AOPs are part of the solution.

AOP Concept in Ecotoxicology
SETAC Pellston workshop on biomarkers – identified need for linkages across levels of organization to support use of biomarkers in ERA.1992
Mid 90 Schmieder Bradbury Veith others in ecotox community – concept toMid 90s Schmieder, Bradbury, Veith, others in ecotox community concept to support application of QSARs and biomarkers in ERA.
2004 Bradbury et al. (ES&T Dec. 1, 2004) – publication of the concept as a means to support greater use of in silico and in vitro approaches in risk assessment – termed “Toxicity Pathway”
2004 Schmieder et al. (ES&T 38:6333‐6342) – published a “toxicity pathway” linking ER binding to potential population‐level consequences.
2007 NRC report on Toxicity Testing in the 21st Century – advocated paradigm similar to Bradbury et al – defined “toxicity pathway” as “cellular response pathways that, when sufficiently perturbed, are expected to result in adverse health effects”
20092009, 2010
Use of AOP term at McKim conferences – introduction of AOP terminology into OECD QSAR tool‐box discussions
2010MED working group published definition of “Adverse O h ” d ib li i i d2010 Outcome Pathways”, describe application in Ecotox and Ecological Risk Assessment. ET&C 2010.

Regulatory Application
Prostaglandin Prostaglandin
Until recently, AOP development was an ad hoc process.
Prostaglandin synthaseinhibition(cox‐1 or 2 and peroxidase)
Ca2+ and HCO3 transport to shell‐gland
lumen impaired
Eggshell thickness reduced
Crushed eggs, breeding failure
gE2
concentrations in eggshell
gland mucosa, reduced
gap
•When can you trust that the relationships depicted provide a sound/defensible foundation for regulatory decision‐support?/ g y pp
•What is the biological/toxicological applicability domain?•Taxa life stage target organ(s) route of exposure•Taxa, life stage, target organ(s), route of exposure
•How do we present in a systematic and transparent manner?

Mode of Action (MOA) Concept in HH Toxicology
•In many respects synonymous with AOP conceptAOP concept.
•MOA generally applied in a chemical‐specific context (RA)
•Intended to address a specific question (animal to human relevance)
•Formal incorporation of BH considerations

Formalism of the AOP Framework
•2012 launch of OECD AOP development programme•2013 OECD Guidance on Developing and Assessing AOPsp g g
•Conventions and terminology•Information content of an AOP description•Weight of evidence evaluation (adopted from MOA)•Weight of evidence evaluation (adopted from MOA)•Introduce standardization and rigor to AOP development
AOP Development
and Description
Users’ handbook supplement to
dDescription Case Studies OECD guidance
document for developing and assessing AOPs.g

Formalism of the AOP Framework
•March 2014 – Advancing AOPs for Integrated Toxicology and Regulatory Applications Workshop
Workshops

Formalism of the AOP Framework
Principles of AOP
Development
Weight of evidence evaluationDevelopment evaluation
•Supports for a systematic approach to describing AOPs.
•Evaluates the relative level of confidence/uncertainty in the relationships depicted.
•Provides a rationale for why they’re described that way.
p p
• Informs suitability for different applications.

Principles of AOP Development
1. AOPs are not chemical‐specific•Not trying to describe what a single chemical does
• Trying to describe what ANY chemical that perturbs the MIE with sufficient potency and duration is likely to do‐ Biological motifs of failure
•Describing AOP does not require chemical‐specific information.•Applying those motifs in a predictive context requires understanding chemical‐specific properties (e.g., potency, ADME) that dictate the magnitude and duration of perturbation
h MIEat the MIE.
Volz et al. 2011. Toxicol. Sci. 123: 349‐358Russom et al. 2014. Environ. Toxicol. Chem. 33: 2157‐2169

Principles of AOP Development
2. AOPs are ModularTwo Primary Building Blocks
HepatocyteReduced VTG production
OvaryImpaired
Oocyte Dev.
FemaleDecreased
ovulation/spawn
PopulationDeclining Trajectory
AromataseInhibition
GranulosaReduced E2 synthesis
PlasmaReduced
circulating E2
Key EventsKey Events (KEs)
•Functional unit of observation/verification
•Observable ∆ biological state (measurable)•Essential (but not necessarily sufficient)( y )
•Description•Methods for observing/measuring•Methods for observing/measuring
•Taxonomic applicability

Building an AOP
•Molecular initiating event (MIE) – A specialized type of KE that represents the initial point of chemical interaction onthat represents the initial point of chemical interaction, on the molecular level, within an organism, that results in a perturbation that starts the AOP.
•Adverse Outcome (AO) – A specialized type of KE that is generally accepted as being of regulatory significance on the basis of correspondence to an established protection goal or p p gequivalence to an apical endpoint in an accepted regulatory guideline toxicity test.

Principles of AOP Development
2. AOPs are ModularTwo Primary Building Blocks
HepatocyteReduced VTG production
OvaryImpaired
Oocyte Dev.
FemaleDecreased
ovulation/spawn
PopulationDeclining Trajectory
AromataseInhibition
GranulosaReduced E2 synthesis
PlasmaReduced
circulating E2
Key Event Relationships (KERs)
Key event down
Key event up
y p ( )
•Functional unit of inference/extrapolation
•Define a directed relationship•Define a directed relationship•State of KEup provides some ability to predict or infer state of KEdown
•Supported by plausibility and evidence•Quantitative understanding

Principles of AOP Development
3. AOPs are a pragmatic functional unit of development and evaluationp
HepatocyteReduced VTG production
OvaryImpaired
Oocyte Dev.
FemaleDecreased
ovulation/spawn
PopulationDeclining Trajectory
AromataseInhibition
GranulosaReduced E2 synthesis
PlasmaReduced
circulating E2
•By convention AOP consists of a single sequence of key events connecting an q y gMIE to AO (no branches)
•AOP is a pragmatic simplification of complex biology
•For a “pure ligand” – functional unit of di i One set of directions from point A to pointprediction One set of directions from point A to point
B, not the map of all possible routes

Principles of AOP Development
4. For most real‐world applications, AOP networks are the functional unit of predictionp
Diuron
Chemicals with multiple biological activities Exposure to multiple chemicals
ImidaclopridLinuronTerbuthylazine2,4-DMCPPPropachlor ESAButalbitalDiclofenacFurosemideGemfibrozilIbuprofenNaproxenPhenobarbitalPhenytoinySulfamethoxazoleTriclosanAcebutololAlbuterolAmitriptyline
AOPs are not triggered in isolation. They interact.

Principles of AOP Development
4. For most real‐world applications, AOP networks are the functional unit of predictionp
Key events shared by multiple AOPs
KERs shared by multiple AOPs
AR
Agonism
Theca/Granulosa
Reduced T & E2 synthesis
Hypothalamic Neurons
(‐) Feedback
HepatocyteReduced VTG production
OvaryImpaired
Oocyte Dev.
FemaleDecreased
ovulation/spawning
PopulationDeclining Trajectory
PlasmaReduced
circulating E2
HepatocyteReduced VTG production
OvaryImpaired
Oocyte Dev.
FemaleDecreased
ovulation/spawning
PopulationDeclining Trajectory
Aromatase
Inhibition
GranulosaReduced E2 synthesis
PlasmaReduced
circulating E2
ER Hepatocyte Ovary Female Population
CYP17, CYP11A
Inhibition
Theca/GranulosaReduced T & E2
Synthesis
HepatocyteReduced VTG production
OvaryImpaired
Oocyte Dev.
FemaleDecreased
ovulation/spawning
PopulationDeclining Trajectory
PlasmaReduced
circulating E2
AntagonismReduced VTG production
Impaired Oocyte Dev.
Decreased ovulation/spawning
Declining Trajectory

Principles of AOP Development
4. For most real‐world applications, AOP networks are the functional unit of prediction
AR
Agonism
Hypothalamic Neurons
(‐) Feedback
p
HepatocyteReduced VTG production
OvaryImpaired
Oocyte Dev.
FemaleDecreased
ovulation/spawning
PopulationDeclining Trajectory
Aromatase
Inhibition
GranulosaReduced E2 synthesis
PlasmaReduced
circulating E2
CYP17, CYP11A
Inhibition
•By building modular AOPs, we gradually describeER
Antagonism
By building modular AOPs, we gradually describe the complexity of potential interactions.
•AOPs meet systems biology

Principles of AOP Development
•Each AOP is one sequential sequence or path through a broader network of AOPs.
•If properly represented in KB, can be analyzed as a network.

Principles of AOP Development
5. AOPs are living documents
•AOPs are a way of organizing existing knowledge•AOPs are a way of organizing existing knowledge
•As methods for observing biology evolve:•New possibilities for KEs•Ability to measure KEs with greater precision/accuracy
•As new experiments are published:•Weight of evidence supporting (or rejecting) KERs grows•New AOPs and new branches in AOP networks discovered•New AOPs and new branches in AOP networks discovered
•There is no objective “complete AOP”

Principles of AOP Development
5. AOPs are living documentsOperationally‐defined “stages” of AOP development
Stages of AOP Development Characteristics
Putative AOPs: Hypothesized set of KEs and KERs primarily supported b bi l i l l ibili d/ i i l i f
Increasing
• Depth of Putative AOPs: by biological plausibility and/or statistical inference
Formal AOPs:
Include assembly and evaluation of the supporting weight of evidence – developed in AOP knowledgebase in accordance with internationally harmonized OECD
evidence /understanding
• Transparency /defensibilityin accordance with internationally‐harmonized OECD
guidance
QuantitativeSupported by quantitative relationships and/or computational models that allow quantitative
/de e s b y
• Quantitative precision
C tQuantitative AOPs:
computational models that allow quantitative translation of key event measurements into predicted probability or severity of adverse outcome
• Cost• Data needs
• Time
All t h t ti l tilit•All stages have potential utility•Level of development desired/required depends on the application

AOP ApplicationTh i bj ti “ f l” “ it bl ” AOP•There is no objective “useful” or “suitable” AOP
•AOPs are developed independent of the regulatory applications for which they may be applied.pp
• The suitability of an AOP for any risk assessment or regulatory decision is dependent on the problem formulation or regulatory context.
Data needed for development
Prediction/extrapolation uncertainties
Cost and time required for development
Quantitative risk assessment (high tier,
Quantitative risk assessment (low
Informed approaches to
Screening and prioritization
high impact)tier, low impact)testing and assessment
prioritization

Elements of WOE
Elements of WOE Evaluation Considerations
Biological Plausibility of KERs Are the KERs consistent with current biological understanding
Essentiality of KEs Are the effects are reversible if the stressor is removed? Are the downstream KEs prevented if one or more upstream KEs are blocked? (e.g., knock‐out, over‐expression, pharmacological agents)
Empirical Support for KERs Dose response ‒ Upstream KEs observed at doses below or similar toEmpirical Support for KERs Dose response Upstream KEs observed at doses below or similar to those associated with downstream KEs and the AO?
Temporality ‒ The KEs are observed in hypothesized order?Incidence ‒ The frequency of occurrence of the apical effect less than
that for the key events?Consistency – relationship consistently observed within the relevant
domain of applicability, inconsistencies are explainable.
Quantitative Understanding of the KERs
Extent to which the state of KE downstream and can be precisely inferred from the measured or predicted state of KE upstream.Extent to which relevant modulating factors are understood.

Example
HepatocyteReduced VTG production
OvaryImpaired
Oocyte Dev.
FemaleDecreased
ovulation/spawn
PopulationDeclining Trajectory
AromataseInhibition
GranulosaReduced E2 synthesis
PlasmaReduced
circulating E2

Biological Plausibility
•Aromatase is rate‐limiting for 17β‐estradiol synthesisAromatase Granulosa
CYP17CYP11A
CYP17
Cholesterol
Inhibition Reduced E2 synthesis
Pregnenolone 17‐OH‐Pregnenolone
CYP17 (hydroxylase)
3‐HSD 3‐HSD
DHEA
CYP17 (lyase)
3‐HSDCYP17 CYP17
Progesterone 17‐OH‐Progesterone Androstenedione
17‐HSDCYP19
20‐HSD
CYP17 (hydroxylase)
CYP17 (lyase)
estroneCYP19
17‐HSDCYP21 CYP21
Testosterone 17‐estradiol17α20β‐dihydroxy‐4‐
pregnen‐3‐one
11β‐OH‐Testosterone
CYP11B1
11‐deoxycorticosterone
corticosterone
CYP11B1 11‐deoxycortisol
CYP11B2 Testosterone
11‐Ketotestosterone
11βHSDaldosterone
CYP11B2
cortisol

Biological Plausibility
A bit of fish reproductive biologyEstrogenReceptor
Hepatocyte Ovary
l i
Female
Stable or
Population
Agonism Vtgproduction
Oocytedevelopment
Ovulation& spawning
Stable orincreasing trajectory
OH
OH
ERE‐Vtg
•17β‐estradiol regulates vitellogenin (Vtg) synthesisVt iti l lk•Vtg critical egg yolk precursor
• accounts for up to 95% of egg mass/volume•Reproduction required for stable/increasing pop trajectoryReproduction required for stable/increasing pop. trajectory

1
Forecast Population Trajectories
11
Forecast Population Trajectories
Empirical Support
N y
150
Male Female
a
b
y
150
Male Female
a
bPerturbed fish reproductive biology
0.6
0.8
1
e Po
pula
tion
Size
of C
arry
ing
Cap
acity
)
A
0.6
0.8
1
ulat
ion
Size
rryin
g C
apac
ity)
A 0%
0.6
0.8
1
e Po
pula
tion
Size
of C
arry
ing
Cap
acity
)
0.6
0.8
1
e Po
pula
tion
Size
of C
arry
ing
Cap
acity
)
A
0.6
0.8
1
ulat
ion
Size
rryin
g C
apac
ity)
A 0%
N
Fadrozole
Aro
mat
ase
Act
ivity
(fmol
/mg-1
hr-1
)
75
Aro
mat
ase
Act
ivity
(fmol
/mg-1
hr-1
)
75
0
0.2
0.4
0 5 10 15 20
Ave
rage
(Pro
port
ion
B
C
DE0
0.2
0.4
Aver
age
Pop
u(P
ropo
rtion
of C
ar
B
CDE
25%
50%
75%>95%0
0.2
0.4
0 5 10 15 20
Ave
rage
(Pro
port
ion
0
0.2
0.4
0 5 10 15 20
Ave
rage
(Pro
port
ion
B
C
DE0
0.2
0.4
Aver
age
Pop
u(P
ropo
rtion
of C
ar
B
CDE
25%
50%
75%>95%
CN
Fadrozole (µg / L)0 50
0
cc
Fadrozole (µg / L)0 50
0
cc
10
Fadrozole (ug/L)
10
Fadrozole (ug/L)
Time (Years)0 5 10 15 20Time (Years)Time (Years)Time (Years)0 5 10 15 20Time (Years)
8
4
6
E2
(ng/
ml)
8
4
6
E2
(ng/
ml)
4
6
8
(Tho
usan
ds)
lativ
e N
umbe
r of E
ggs
Control21050
Fadrozole (ug/L)
***
4
6
8
(Tho
usan
ds)
lativ
e N
umbe
r of E
ggs
Control21050
Fadrozole (ug/L)
***
0
2 *
*
20g/
ml)
0
2 *
*
20g/
ml)
-20 -18 -16 -14 -12 -10 -8 -6 -4 -2 0 2 4 6 8 10 12 14 16 18 20Exposure (d)
0
2
Cum
u
-20 -18 -16 -14 -12 -10 -8 -6 -4 -2 0 2 4 6 8 10 12 14 16 18 20Exposure (d)
0
2
Cum
u
0
10Vtg
(mg
*
* *Control 2 10 50
Fadrozole (µg/l)
0
10Vtg
(mg
*
* *Control 2 10 50
Fadrozole (µg/l)Ankley et al., 2002, Toxicol. Sci. 67:121‐130

Empirical Support
HepatocyteReduced VTG production
OvaryImpaired
Oocyte Dev.
FemaleDecreased
ovulation/spawn
PopulationDeclining Trajectory
AromataseInhibition
GranulosaReduced E2 synthesis
PlasmaReduced
circulating E2
NN
Aromatase inhibition
8
6
8
6 8
10
gs
Control2
Fadrozole (ug/L)
8
10
gs
Control2
Fadrozole (ug/L)
Reduced E2, Vtg synthesis
Impaired vitellogenesis Reduced fecundity
CN0
2
4E2
(ng/
ml)
*
*
10
20
Vtg
(mg/
ml)
*
0
2
4E2
(ng/
ml)
*
*
10
20
Vtg
(mg/
ml)
*
2
4
6
(Tho
usan
ds)
Cum
ulat
ive
Num
ber o
f Egg 2
1050
***
2
4
6
(Tho
usan
ds)
Cum
ulat
ive
Num
ber o
f Egg 2
1050
***
0* *
Control 2 10 50Fadrozole (µg/l)
0* *
Control 2 10 50Fadrozole (µg/l)
-20 -18 -16-14-12 -10 -8 -6 -4 -2 0 2 4 6 8 10 12 14 16 18 20Exposure (d)
0-20 -18 -16-14-12 -10 -8 -6 -4 -2 0 2 4 6 8 10 12 14 16 18 20
Exposure (d)
0
Consistent profile of effects have been observed with other cyp19 inhibitors and in other species :
Prochloraz, fathead minnow: Toxicol. Sci. 2005. 86: 300‐308
Propiconazole, fathead minnow: Toxicol. Sci. 2013. 132: 284‐297.Propiconazole, fathead minnow: Toxicol. Sci. 2013. 132: 284 297.
Letrozole, Japanes medaka: Compar. Biochem. Physiol. Pt. C, 2007, 145: 533‐541

Empirical Support
HepatocyteReduced VTG production
OvaryImpaired
Oocyte Dev.
FemaleDecreased
ovulation/spawn
PopulationDeclining Trajectory
AromataseInhibition
GranulosaReduced E2 synthesis
PlasmaReduced
circulating E2
3
4
ng/m
l)
<6h 12 h 24 h days weeks years
Temporal concordance
0
1
2
**
Ex vivo E2
(
**
6
8
(ng/ml)
)
6 Hour 12 Hour 24 Hour
0
2
4
***
Plasma E2
(
6 Hour 12 Hour 24 Hour 30
40
50
*
(c)
TG (m
g/ml)
6h 12h 24hPRO (200 μg/L)
P 6 Hour 12 Hour 24 Hour
0
10
20
Plasma VT
6 Hour 12 Hour 24 HourPRO (200 μg/L)
Skolness et al. 2011 Aquat. Toxicol. 103:170‐178

Empirical Support
HepatocyteReduced VTG production
AromataseInhibition
GranulosaReduced E2 synthesis
PlasmaReduced
circulating E2
PlasmaReduced
circulating VTG
•KE1 – declining through d1 then compensatingTemporal concordance
KE1 declining through d1 then compensating•KE2 – declining through d2 then compensating•KE4 – declining through d4
P t i t l d•Post‐exposure recovery in same temporal order

Essentiality of the KEs
Recovery Experiments Provide Evidence for Essentiality
HepatocyteAromatase Granulosa Plasma Plasmap yReduced VTG production
Inhibition Reduced E2 synthesis
Reduced circulating E2
Reduced circulating VTG

Quantitative Understanding
HepatocyteReduced VTG production
AromataseInhibition
GranulosaReduced E2 synthesis
PlasmaReduced
circulating E2
PlasmaReduced
circulating VTG
Input parameter – in vitro measure of aromatase inhibition
200 Simulate…
0
50
100
150
Veno
us VTG
(μM)
0‐5 5 15 25 35
150
200 Simulated …
(μM)
HPG axis model that accounts for 0
50
100
5 0 5 10 15 20 25 30 35
Veno
us VTG
Breen et al. 2013 Toxicol. Sci. 133: 234‐237
feedback and compensatory responses developed.
‐5 0 5 10 15 20 25 30 35Time (d)

Quantitative Understanding
PlasmaReduced
circulating VTG
OvaryImpaired
Oocyte Dev.
FemaleDecreased
ovulation/spawn
50
100
150
200 Simulated …
0
50
‐5 0 5 10 15 20 25 30 35
Statistically based model predicts cumulative fecundity and spawning from VTG dataStatistically‐based model predicts cumulative fecundity and spawning from VTG data.

Quantitative Understanding
Ad t tit ti d t di t f MIE t di t it f AO ( d
HPG axis model
A t Granulosa Plasma Hepatocyte Plasma
Adequate quantitative understanding to use measure of MIE to predict severity of AO (and dose‐response time‐course behaviors of intermediate KEs)
AromataseInhibition
GranulosaReduced E2 synthesis
PlasmaReduced circulating
E2
HepatocyteReduced VTG
production
PlasmaReduced circulating
VTG
Oocyte growth dynamics modelOvary
Impaired Female
Decreased l ti /
l d d l
Oocyte Dev. ovulation/spawning
Population dynamics modelPopulationDeclining Trajectory
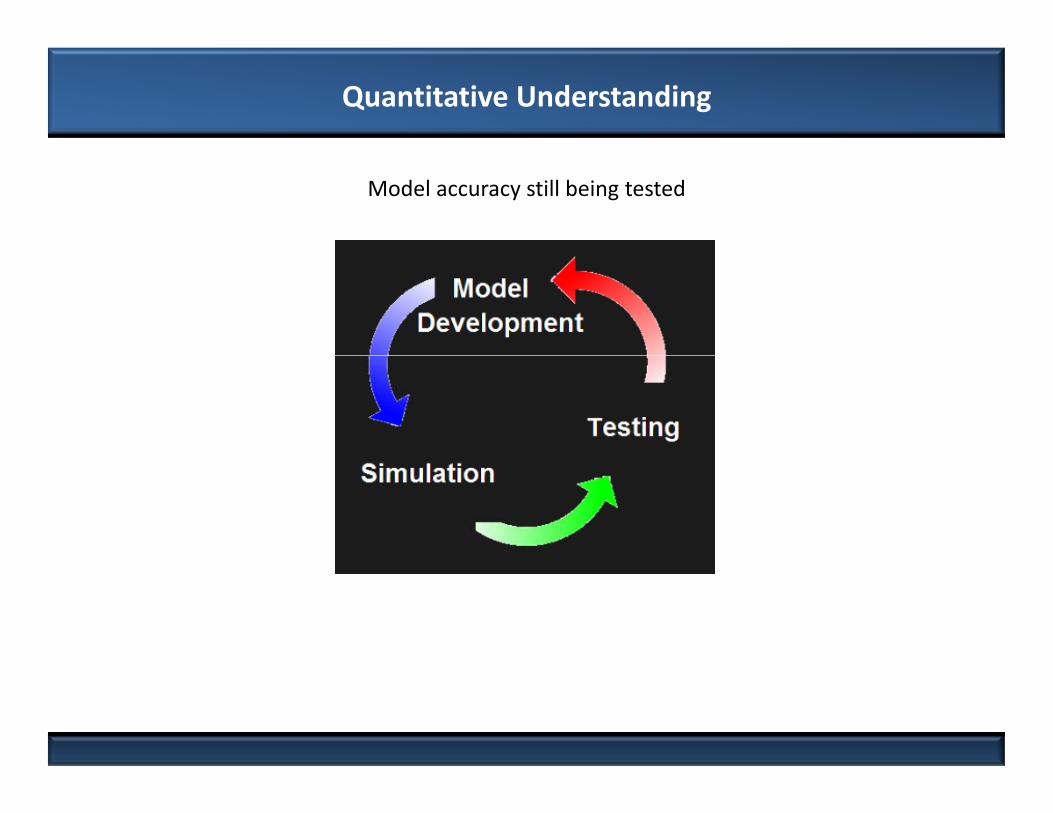
Quantitative Understanding
Model accuracy still being tested

Elements of WOE
Elements of WOE Evaluation Considerations
Biological Plausibility of KERs Are the KERs consistent with current biological understanding
Essentiality of KEs Are the effects are reversible if the stressor is removed? Are the downstream KEs prevented if one or more upstream KEs are blocked? (e.g., knock‐out, over‐expression, pharmacological agents)
Empirical Support for KERs Dose response ‒ Upstream KEs observed at doses below or similar toEmpirical Support for KERs Dose response Upstream KEs observed at doses below or similar to those associated with downstream KEs and the AO?
Temporality ‒ The KEs are observed in hypothesized order?Incidence ‒ The frequency of occurrence of the apical effect less than
that for the key events?Consistency – relationship consistently observed within the relevant
domain of applicability, inconsistencies are explainable.
Quantitative Understanding of the KERs
Extent to which the state of KE downstream and can be precisely inferred from the measured or predicted state of KE upstream.Extent to which relevant modulating factors are understood.

WOE Calls
•WOE calls and analysis are summarized in the AOP knowledgebase
•Data from which the calls are derived, are captured on AOP, KE, and KER pages –transparency.
•Allows user to evaluate fit‐for‐purpose suitability for varying regulatory contexts

Summary
•AOPs are a framework for organizing existing knowledge concerning biological motifs of failure.
•Intended to support the use of mechanistic/pathway perturbation data in risk‐based regulatory decision‐making.data in risk based regulatory decision making.
•AOPs are NOT risk assessments
•Application in chemical risk assessment requires additional info:•Exposure (concentration, duration, route)ADME/T i ki ti ( t ti d ti f f t b ti•ADME/Toxicokinetics (concentration, duration, frequency of perturbation at target site)
Th d l d i d d t f th l t li ti f•They are developed independent of the regulatory applications for which they may be applied.

The Role for AOPs in 21st Century Toxicology
Cart
Cvfat
Cven
Cexp Cinsp
Gills
Cart
QfatFat Tissue Group
Effective Respiratory Volume
Cardiac Output Qc
Qw
Qc
Qw
Cvcarc Cart
QcarcCarcass Tissue Group
Cvliv Cart
Qliv
Liver
Km, Vmax
Source EnvironmentalFate Exposure
Molecular InitiatingEvent
Pathway Perturbation / Key Events
Apical Outcomes
Population/Community Impacts
ADME, Toxicokinetics
Cart
Qgut
Cvliv Cart
Qdigesta
CdigestaCdiet
Qdiet
Cvgut
Gut
kgut
Qbile Cbile
Gut Lumen
Gut Tissue
Exposure Assessmentff
AOP
Effects Assessment
•An AOP is not a risk assessment
•AOP describes a generalizable/predictable biological motif of failure that can be expected when a particular biological pathway or process is perturbed.

Summary
•Ad hoc process of AOP development/description has evolved•Guided by set of core principles•Conventions•Emerging best practicesEmerging best practices
•Process is aimed at assembling knowledge in a manner that facilitates evaluation and applicationfacilitates evaluation and application.
•Evaluation of AOPs and the level of confidence and quantitative understanding of the relationships they depict dictates suitable applications (including for MOA analyses).

Summary
•AOP facilitates translation of mechanistic data to outcomes that meaningful to decision‐making.
•Facilitates MOA‐type analysis of cross‐species relevance.
•Application in chemical risk assessment requires additional info:•Exposure (concentration, duration, route)•ADME/Toxicokinetics (concentration, duration, frequency of perturbation at target site)

Using AOP KnowledgeHow certain
Needs from a regulatory standpoint:•Systematically organized
How certain are we?
•Systematically organized•Transparent, well documented•Scientifically‐defensible, credibleScientifically defensible, credible
Pathway‐based bioactivity profile
Potential/probable AO
OECD Guidance on Developing and Assessingand Assessing
AOPsReview and evaluation
Conceptually, AOP description documents could meet those needs.
process

Need for an AOP‐KB
Documents are not ideal for:•Facilitating collaboration and crowd‐sourcingFacilitating collaboration and crowd sourcing•Avoiding duplicative effort•Integration and analysis•Accessible and searchable

CSSCSSNeed for an AOP Knowledgebase
AOPs are modular•KEs and KERs are shared by multiple AOPsy p•No need to re‐write the same descriptions over and over•Reusability (best practices)
AOPs are living documentsAOPs are living documents•KE and KER descriptions can be expected to evolve over time•As descriptions are updated and expanded – all AOP descriptions they link to update automaticallyy p y
•AOP networks for prediction•Entry of structured information in KB allows for de‐facto assembly of AOP networksAOP networks.

How you can access AOP Knowledge
Released and in use
Integration with KB in 2015
On‐going development
https://aopkb.org/
KB in 2015development, case studies
In development
InIn development

Components of the AOP‐KBModular organization.Allows independent KE, KER pages to be linked to multiple AOPs.
https://aopkb.org/aopwiki/index.php/Main_Page

Contents of the AOP‐KB
•Modular structure implemented via a common knowledgebase provides a tractable approach to tackle “real‐world” toxicological complexity and supports more integrated toxicology.
OECD AOP Development Programme– 29 development projects & 9 case studies
Only one reviewed and approved AOP Skin Sensitization– Only one reviewed and approved AOP ‐ Skin Sensitization– 14 AOPs (10 projects) being reviewed by EAGMST– 2 AOPs (2 projects) are scheduled for EAGMST review
AOP Wiki AOPs– 17 AOPs Open for Commenting
bl d• Public comments are encouraged• Includes the 14 under EAGMST review
– 40+ AOPs Under Development• Available for viewing, but not comments• Note: Not all are under active development

Acknowledgements
AOP Training Team:Mirjam Luijten, Bette Meek, Carole Yauk, Stephen Edwards, Kristie Sullivan, Dan Villeneuve
EAGMSTEAGMST
Users’ Handbook Development Team:Bette Meek, Carole Yauk, Grace Tier, Joop DeKnecht, Stephen Edwards, Julia Filipovska, Rick Becker, Anne Gourmelon, Nathalie Delrue, Hristo Aladjov, Dan VilleneuveEAGMSTEAGMST
Somma Lombardo AOP Workshop WG2Dan Villeneuve, Doug Crump, Natalia Garcia‐Reyero,
EAGMSTEAGMST
, g p, y ,Markus Hecker, Tom Hutchinson, Carlie LaLone, Brigitte Landesmann, Teresa Lettieri, Sharon Munn, Malgorzata Nepelska, Mary Ann Ottinger, Lucia Ver a en Ma ri e WhelanVergauwen, Maurice Whelan.

Acknowledgements
• Clemens Wittwehr• Brigitte Landesmann
• Stephen Edwards• David Lyons
• Marina Goumenou• Sharon Munns• Maurice Whelan
• Ryan Durden• Max Felsher• Harriet Ashcroft
K l P i t• Ed Perkins• Natalia Garcia Reyero• Tanwir Habib
• Kyle Painter• Dan Villeneuve• Kevin Crofton• Gary Ankley• Tanwir Habib
• Hristo AladjovJoop DeKnecht
• Gary Ankley• Lyle Burgoon• Robert Kavlock
• Joop DeKnecht• Collaborative Partners
– OECD External Advisory Group on Molecular Screening & Toxicogenomicsg g
– IPCS/WHO Mode of Action Steering Committee

SMALL FISH
• USEPA, NHEERL – Duluth, MN, and Grosse Isle, MI
• G. Ankley, J. Berninger, B. Blackwell, K Jensen, M Kahl, C. LaLone, D. Miller, A Schroeder D VilleneuveA. Schroeder, D. Villeneuve,
• USEPA, NERL – Athens, GA
• T. Collette, D. Ekman, J. Davis, D. Skelton, Q. Teng
• USEPA, NERL – Cincinnati, OH
• D. Bencic, M. Kostich, A. Biales, J. Lazorchak, R. Wang,
• USEPA, NHEERL, ‐RTP, NC
• M. Breen, R. Conolly, S. Edwards, L. Burgoon, S. Bell, D. Lyons
• USACE, ERDC – Vicksburg, MS
• E. Perkins, T. Habib, M. Mayo
• Other partners• Other partners• Mississippi State University, N. Garcia‐Reyero, • University of St. Thomas, D. Martinovic• Oregon Health and Science University, K. Watanabe
• Current Contractors and FellowsCurrent Contractors and Fellows• J. Cavallin, K. Nelson, R. Milsk, E. Randolph, T. Saari
Retired: E. Durhan, E. Makynen,
Former Contractors, Fellows, Students, Interns:M. Breen, M. Hughes, L. Wehmas, L. Thomas, K. Stevens, S. Seidl, E. Eid, M. Weberg, M. Lee, L. Blake, N. Mueller, K. Green, J. Brodin, S. Skolness, O. Adedeji, S. Robinson