adverse events associated with ephedrine-containing products
TRANSCRIPT

Adverse Events Associated with Ephedrine-Containing Products —Texas, December 1993–September 1995
Ephedrine — ContinuedDuring December 1993–September 1995, the Bureau of Food and Drug Safety,
Texas Department of Health (TDH), received approximately 500 reports of adverse
events in persons who consumed dietary supplement products containing ephedrine
and associated alkaloids (pseudoephedrine, norephedrine, and N-methyl ephedrine).
This total included reports by individuals and reports identified by the Bureau of
Epidemiology, TDH, in a review of records from the six centers of the Texas Poison
Center Network. Reported adverse events ranged in severity from tremor and head-
ache to death in eight ephedrine users and included reports of stroke, myocardial in-
farction, chest pain, seizures, insomnia, nausea and vomiting, fatigue, and dizziness.
Seven of the eight reported fatalities were attributed to myocardial infarction or
cerebrovascular accident. This report describes three patients in which the recom-
mended dosage for the dietary supplements reportedly was not exceeded, summa-
rizes results from ongoing investigations, and underscores the potential health risks
associated with the use of products containing ephedrine.
Case Reports
Patient 1. In December 1993, a 44-year-old man died from acute coronary artery
thrombosis approximately 3 weeks after beginning daily use of a dietary supplement
containing ephedrine. He was an active swimmer and tennis player with no known
cardiovascular risk factors. He received the dietary supplement from his family physi-
cian during a routine physical examination when he requested a substitute for his
daily coffee and cocoa. He used the product as directed and eliminated his coffee and
cocoa use. On December 18, 1993, after playing tennis and returning home, he sus-
tained a cardiorespiratory arrest. An autopsy revealed an acute thrombus in the left
anterior descending coronary artery. All other coronary lumina were patent, although
calcified with focal narrowing to approximately 50%.
Patient 2. In May 1995, a 35-year-old woman who was taking no other prescription
or over-the-counter (OTC) medications began use of a dietary supplement containing
ephedrine for weight loss. She used the supplement within the dosage recommended
on the label for approximately 30 days, discontinued use of the supplement while on
a 1-week vacation, then resumed the usual dosage when she returned on June 24,
1995. On June 25, while sleeping, she had acute onset of symptoms including anterior
TM
August 16, 1996 / Vol. 45 / No. 32
U.S. DEPARTMENT OF HEALTH AND HUMAN SERVICES / Public Health Service
689 Adverse Events Associated withEphedrine-Containing Products —Texas
693 Update: Diphtheria Epidemic —New Independent States of theFormer Soviet Union, January 1995–March 1996
697 Progress Toward PoliomyelitisEradication — Indonesia, 1995
700 Average Postpartum Length of Stayfor Uncomplicated Deliveries —New Jersey, 1995

chest pain that radiated to her left shoulder and arm, numbness of the left arm and
hand, diaphoresis, and shortness of breath. She was taken to the hospital and her pain
remitted after she was treated with nitroglycerin and morphine. Although an electro-
cardiogram and cardiac enzymes indicated an acute myocardial infarct, cardiac
catheterization indicated normal cardiac function and normal coronary arteries. She
had no history of cardiovascular risk factors. She was discharged with a diagnosis of
acute myocardial infarction secondary to cardiac spasm and was advised to discon-
tinue use of the dietary supplement that contained ephedrine. Since discontinuing use
of the product, she has had no additional cardiac-related symptoms.
Patient 3. On August 17, 1995, a 38-year-old woman with no history of seizures
experienced two petit mal seizures beginning at 11 p.m. She experienced two addi-
tional petit mal seizures the following morning, and that afternoon had onset of a
generalized tonic-clonic seizure lasting approximately 2 minutes, during which she
required respiratory assistance. On August 17, she had taken two tablets of an
ephedrine-containing dietary supplement at 10 a.m. and two more 5 hours later as
directed on the product label. She denied use of other drugs except oral contracep-
tives. During August 19–22, she experienced five additional episodes of unresponsive-
ness while sitting or standing; while waiting in the office of a neurologist, she
sustained an additional generalized seizure witnessed by the neurologist and staff.
She was hospitalized for monitoring, treated with antiseizure medication, and diag-
nosed with new onset of tonic-clonic seizures with complex partial seizures. Other
possible causes of seizures were excluded. She was discharged and was advised to
avoid any medications or products that contained ephedrine, pseudoephedrine, or re-
lated drugs. Since discontinuing use of the product, she has had no additional sei-
zures.
Ongoing Investigations
TDH also has received reports of persons who had acute onset of palpitations and
fainting after using ephedrine-containing products marketed as “beyond smart
drugs” for “euphoric stimulation, highly increased energy levels, tingly skin sensa-
tions, enhanced sensory processing, increased sexual sensations, and mood eleva-
tions.” Although these substances have been sold without warnings or contra-
indications on the information labels, one label indicated that the product “acts on the
same basis as MDMA (3,4-methylenedioxy-methamphetamine, “ecstasy”) triggering
similar but not identical physical reactions in the body.” TDH investigators purchased
a product labeled “no side effects” that also listed wild Chinese ginseng as the only
ingredient. Laboratory analysis indicated that a single tablet contained 45 mg ephed-
rine and 20 mg caffeine; the label on this product instructed users to take five tablets,
representing a total ephedrine dosage of approximately 11 times the usual recom-
mended OTC dosage of bronchodilator products, which contain 12.5 mg–25.0 mg of
ephedrine per dose.
Ephedrine-containing products usually are marketed and labeled for weight loss,
energy, “pep,” performance enhancement, or body building or as a substitute for illicit
drugs such as MDMA. They are commonly labeled as “natural” or “herbal” and use
common names for herbs as the source of active ingredients (ma huang, Chinese
ephedra, and Sida cordifolia—another plant source with small amounts of ephedrine
alkaloids). An additional 400 reports of adverse events involved OTC drug products
690 MMWR August 16, 1996
Ephedrine — Continued

containing ephedrine that were labeled as required for use as bronchodilators but
marketed in a manner to imply their effectiveness for weight loss and as stimulants.
Since September 1995, the Texas Poison Control Network has received approxi-
mately 300 additional reports of adverse events in persons consuming products con-
taining ephedrine. These reports are being investigated by TDH.Reported by: DM Perrotta, PhD, Bur of Epidemiology; G Coody, C Culmo, Bur of Food and DrugSafety; Texas Poison Center Network, Texas Dept of Health. Clinical Research and Review Staff,Center for Food Safety and Applied Nutrition, Food and Drug Administration. EnvironmentalHazards Epidemiology Section, Health Studies Br, Div of Environmental Hazards and HealthEffects, National Center for Environmental Health, CDC.
Editorial Note: The three reports presented here and the approximately 500 reports of
adverse events received by TDH underscore that use of dietary supplements contain-
ing ephedrine and related alkaloids can be associated with a spectrum of adverse
health events. Although a cause-and-effect relation cannot be established for the three
patients presented here, no other cause was found to explain their medical conditions,
all of which are compatible with documented effects of ephedrine consumption.
Ephedrine and associated alkaloids are structurally similar to the amphetamines (1 )
and, by stimulating adrenergic receptors, can increase arterial blood pressure through
both peripheral vasoconstriction and cardiac stimulation. Adverse effects from ephed-
rine can be variable, and do not always depend on the dose consumed. Serious ad-
verse effects of ephedrine and related alkaloids, such as acute cardiovascular and
central nervous system stimulant effects, can occur in susceptible persons with use of
low dosages. Other adverse effects associated with the use of ephedrine include pal-
pitations, tachycardia, hypertension, coronary spasm, paranoid psychoses, convul-
sions, respiratory depression, coma, and death (2 ). Particularly when used in
combinations with phenylpropanolamine (PPA) and caffeine, ephedrine has been as-
sociated with stroke secondary to intracranial hemorrhage, seizures, mania, and psy-
chosis (3,4 ). Combinations of ephedrine and caffeine have been documented to have
side effects substantially greater than those from the consumption of either com-
pound alone or of a placebo (5–8 ).
In the United States, ephedrine, pseudoephedrine, and PPA have been marketed
extensively for some OTC uses. For example, preparations containing ephedrine are
marketed for oral use as a short-term, OTC bronchodilator for persons with mild
asthma. The Food and Drug Administration (FDA) has proposed to remove oral
ephedrine drug products from the OTC market based on their use in the production of
illicit drugs and on their misuse and abuse as stimulants and for weight loss.*
Pseudoephedrine, an ephedrine alkaloid contained in many OTC decongestant, cold,
and allergy products, is associated with fewer cardiovascular and central nervous sys-
tem stimulant effects than ephedrine. PPA, another ephedrine alkaloid, also is con-
tained in OTC decongestant, cold, and allergy preparations and is marketed for use in
the United States as a weight-control agent.
Dietary supplements can be marketed with no premarket safety evaluation by FDA.
For dietary supplements that include an ingredient marketed in the United States be-
fore October 15, 1994—such as products containing sources of ephedrine alkaloids—
no FDA review is required. For dietary supplements that include an ingredient that
was not marketed before October 15, 1994, manufacturers or distributors must submit
a notice to FDA 75 days before marketing; however, the notice is not required to in-
*60 FR 38,643.
Vol. 45 / No. 32 MMWR 691
Ephedrine — Continued

clude objective evidence of safety, only an explanation of why there is a reasonable
expectation that use of the supplement will be safe.
Because many of these products are marketed as “natural” or promoted as foods,
consumers may assume incorrectly that the products are safe and without side ef-
fects. For example, the TDH investigation determined that, during medical evalu-
ations, some patients did not report taking ephedrine-containing dietary supplements
because they did not initially believe that a “natural” or “herbal” food supplement
could be related to their illness. In addition, health-care providers or consumers may
not have realized that ephedrine alkaloids and other stimulants were in the product
because they were not included in the ingredient listing or because an unfamiliar
name for the compound was used.
Because of misuse of and adverse reactions to products containing ephedrine, ap-
proximately 21 states have passed regulations stricter than federal regulations, in-
cluding requiring that ephedrine drug and food products be made available by
prescription only; moving ephedrine products to the schedules of controlled sub-
stances; and prohibiting weight loss, appetite control, or stimulant claims on the la-
bels. Because of concerns about the safety of dietary supplements that contain
sources of ephedrine alkaloids, a working group convened by FDA in October 1995
made several recommendations about potency limits and label warnings to promote
safer use of these products. FDA has been evaluating these recommendations and,
because of continuing concerns about the safety of these products, is convening
a meeting of the Food Advisory Committee and the special working group on
August 27–28, 1996, in Washington, D.C.
The findings in this report underscore the need for the general public and for
health-care providers to be aware of potential health hazards associated with use of
dietary supplements containing ephedrine and associated alkaloids. Health-care
providers should question patients about their use of dietary supplements and herbal
medications and report any adverse effects to dietary supplements, including those
containing ephedrine and associated alkaloids, to FDA’s MedWatch Program, tele-
phone (800) 322-1088 ([800] FDA-1088). Consumers can report adverse events to the
FDA Consumer Hotline, (800) 322-4010 ([800] FDA-4010).
References1. Dollery C, ed. Ephedrine (hydrochloride). In: Therapeutic drugs. Vol 1. New York: Churchill Liv-
ingstone, 1991:E26–E29.
2. Pentel P. Toxicity of over-the-counter stimulants. JAMA 1984;252:1898–903.
3. Loizou LA, Hamilton JG, Tsementzis SA. Intracranial haemorrhage in association with
pseudoephedrine overdose. J Neurol Neurosurg Psychiatry 1982;45:471–2.
4. Lake CR, Gallant S, Masson E, Miller P. Adverse drug effects attributed to phenylpropanolamine:
a review of 142 case reports. Am J Med 1990;89:195–208.
5. Breum L, Pedersen JK, Ahlstrom F, Frimodt-Moller J. Comparison of an ephedrine/caffeine
combination and dexfenfluramine in the treatment of obesity: a double-blind, multi-centre trial
in general practice. International Journal of Obesity and Related Metabolic Disorders
1994;18:99–103.
6. Astrup A, Lundsgaard C, Madsen J, Christensen NJ. Enhanced thermogenic responsiveness
during chronic ephedrine treatment in man. Am J Clin Nutr 1985;42:83–94.
7. Astrup A, Toubro S. Thermogenic, metabolic, and cardiovascular responses to ephedrine and
caffeine in man. International Journal of Obesity and Related Metabolic Disorders 1993;17
(suppl):S41–S43.
692 MMWR August 16, 1996
Ephedrine — Continued

Astrup A, Toubro S, Cannon S, Hein P, Breum L, Madsen J. Caffeine: a double-blind, placebo-controlled study of its thermogenic, metabolic, and cardiovascular effects in healthyvolunteers. Am J Clin Nutr 1990;51:759–67.
Ephedrine — Continued
Update: Diphtheria Epidemic — New Independent Statesof the Former Soviet Union, January 1995–March 1996
Diphtheria Epidemic — ContinuedEpidemic diphtheria reemerged in the New Independent States (NIS) of the former
Soviet Union, beginning in the Russian Federation in 1990 and affecting all 15 NIS by
the end of 1994 (1,2 ). Approximately 90% of all diphtheria cases reported worldwide
during 1990–1995 were reported from the NIS (World Health Organization [WHO], un-
published data, 1996). During 1993–1994, WHO, partner organizations, and national
ministries of health developed a strategy to control the epidemic with a priority goal
of achieving coverage of >90% among persons aged ≥3 years with a single dose of
diphtheria toxoid through mass vaccination campaigns and achieving coverage for
routine childhood vaccination (i.e., four doses of diphtheria and tetanus toxoids and
pertussis vaccine by age 2 years) of >95%. This report summarizes data provided to
WHO about the incidence of diphtheria (Table 1) and efforts to implement control
measures in the NIS during 1995 and January–March 1996.
Overall, from 1994 to 1995, reported diphtheria cases in the NIS increased 5.2%,
from 47,628 to 50,412 cases (Figure 1) with approximately 1500 deaths in 1995. Since
the epidemic began in 1990, approximately 125,000 cases and 4000 deaths have been
reported in the NIS. The number of cases in 1995 reflects an 11% decrease in reported
cases in the Russian Federation but a near doubling of cases from other NIS. However,
following expanded control efforts, by the end of 1995 most countries began reporting
decreases from the same periods in 1994. During January–March 1996, a total of
6179 diphtheria cases were reported in the NIS, a 59% decrease from the 14,931 cases
reported during the same period in 1995.
Russian Federation. During 1990–1995, approximately 97,000 diphtheria cases and
2500 deaths were reported in the Russian Federation. Reported cases decreased from
39,582 (26.9 cases per 100,000 population) in 1994 to 35,652 (24.3) in 1995. Reported
deaths decreased from 1104 (case-fatality rate: 2.8%) in 1994 to 740 (2.1%) in 1995.
Vaccination coverage among persons aged ≥18 years with at least one dose of diph-
theria toxoid during the preceding 10 years had increased to 70%–80% by the end of
1995 from an estimated 20% in 1990. In 1995, reported coverage with a primary series
of diphtheria toxoid among children aged 12–23 months was 92.7%.
Western NIS and Baltic countries. In Ukraine, reported cases nearly doubled, from
2990 (5.8 cases per 100,000) in 1994 to 5280 (10.3) in 1995. Mass vaccination cam-
paigns targeting adults were conducted in seven of the 27 regions in April 1995; the
remaining regions were targeted for mass vaccination in late 1995 and in 1996. Over-
all, vaccine coverage in adults was an estimated 60%. In Belarus, Latvia, and Lithuania,
increases in diphtheria cases were reported in 1995 (Table 1); however, mass adult
vaccination efforts in 1995 and 1996 achieved coverage of 60%–80%, and efforts to
complete vaccination of all adults are continuing. In Moldova, reported cases in-
creased from 376 (8.5 cases per 100,000 population) in 1994 to 418 (9.4) in 1995. A
mass vaccination campaign was conducted in the summer and fall of 1995, increasing
coverage among adults to >80%; a sustained decline in cases began in October 1995.
8.
Vol. 45 / No. 32 MMWR 693
Ephedrine — Continued

69
4M
MW
RA
ug
ust 1
6, 1
99
6
Dip
hth
eria
Ep
idem
ic —
Co
ntin
ue
d
TABLE 1. Number and rate of diphtheria cases, 1994–1995, percentage change in number of cases from 1994 to 1995 and firstquarter of 1995 to first quarter of 1996, and level of coverage with diphtheria toxoid, 1995, by country — New IndependentStates of the former Soviet Union
% Change in number of cases % Coverage, 1995
Country Population* Cases Rate† Cases Rate1994 to
19951st quarter 1995 to1st quarter 1996
Primary seriesat age 1 year
1 dose,adult
Armenia 3.6 36 1.0 29 0.8 –19 –14 NA§ 60¶
Azerbaijan 7.5 841 11.3 883 11.7 5 –85 >90 95Belarus 10.1 230 2.3 322 3.2 40 –46 96 65Estonia 1.6 7 0.5 19 1.2 171 –29 >90 30**Georgia 5.4 294 5.4 419 7.7 43 –28 NA 65¶
Kazakstan 17.0 489 2.9 1105 6.5 126 –31 93 50Kyrgyzstan 4.7 299 6.4 693 14.6 132 –15 93 70Latvia 2.6 250 9.7 369 14.4 48 –71 NA 30††
Lithuania 3.6 38 1.0 43 1.2 13 –69 97 70Moldova 4.4 376 8.5 418 9.4 11 –85 NA >80 Russia 146.7 39,582 26.9 35,652 24.3 –10 –59 93 75Tajikistan 6.1 1912 31.8 4455 73.0 133 –42 94 >95 Turkmenistan 4.1 60 1.5 87 2.1 45 90 92§§ 30Ukraine 51.3 2990 5.8 5280 10.3 77 –37 NA 60Uzbekistan 22.8 224 1.0 638 2.8 185 –40 NA 50
Total 298.5 47,628 16.1 50,412 16.9 5 –59 – –
19951994
*In millions.† Per 100,000 population per year.§ Not available.¶ Adult coverage for Armenia and Georgia is based on less complete data than for other countries.
**Approximately 75% of adults were vaccinated during 1985–1987.†† The Latvian Ministry of Health considers coverage to be three doses for adults; an estimated 60%–70% have received at least one
dose.§§ Coverage figure is for four doses of diphtheria and tetanus toxoids and pertussis vaccine (primary series plus first revaccination) at
age 2 years.

In Estonia, cases increased from seven to 19, almost exclusively among ethnic Rus-
sians in border areas. Approximately 30% of adults were vaccinated during the cam-
paign in 1995.
Central Asia. All of the Central Asian republics reported increases in reported diph-
theria cases in 1995. In Tajikistan, reported cases increased from 1912 (31.8 cases per
100,000 population) in 1994 to 4455 (73.0) in 1995, with cases reported from all regions
of the country. A mass vaccination campaign was conducted during October 1995 and
reached >90% of adults (aged ≤50 years). The other Central Asian republics (Kazak-
stan, Kyrgyzstan, Uzbekistan, and Turkmenistan) reported a total of 2523 cases in 1995
(Table 1), representing a 135% increase over the total reported cases in 1994. Mass
vaccination campaigns targeting both adults and children were initiated in Kazakstan,
Kyrgyzstan, and Uzbekistan in 1995 and are to be completed during 1996. In Turk-
menistan, vaccination campaigns for children were conducted in 1995; adults are be-
ing targeted in 1996.
Caucasus. Georgia reported a 43% increase in diphtheria cases during 1995 (419)
over 1994 (294), and Azerbaijan reported a 5% increase; Armenia continued to report
few cases (Table 1). Following revaccination efforts among schoolchildren, resulting in
coverage of 96%, Azerbaijan conducted mass vaccination of persons aged 0–55 years
during November 1995, achieving coverage of 95%. Reported cases in Azerbaijan dur-
ing January–March 1996 are 85% below the same period in 1995. In Georgia and
Armenia, adult vaccination campaigns began in 1995; however, coverage is <60% in
some regions.Reported by: Regional Office for Europe, World Health Organization, Copenhagen, Denmark.International Federation of Red Cross and Red Crescent Societies, Geneva, Switzerland. Child
1965 1970 1975 1980 1985 1990 19950
10,000
20,000
30,000
40,000
50,000
60,000
Year
Cas
es (
Tho
usa
nds)
10
20
30
40
50
60
Cas
es (
Tho
usan
ds)
Year
FIGURE 1. Number of reported cases of diphtheria — New Independent States ofthe former Soviet Union, 1965–1995
Vol. 45 / No. 32 MMWR 695
Diphtheria Epidemic — Continued
Vaccine Preventable Disease Br, Epidemiology and Surveillance Div, National ImmunizationProgram, CDC.
Editorial Note: The findings in this report highlight the first evidence of progress to-
ward controlling the diphtheria epidemic in the NIS. WHO continues to consider the
epidemic an international public health emergency. At the time of the disintegration of
the former Soviet Union in 1991, all NIS relied on supplies of vaccine and antitoxin
from Russia, and most lacked the financial resources to procure them from the inter-
national market. Governmental and nongovernmental organizations, such as the
United States Agency for International Development, European Community Humani-
tarian Office, International Federation of Red Cross and Red Crescent Societies, WHO,
United Nations Children’s Fund (UNICEF), the government of Japan, and others, have
initiated an effort, monitored by the Interagency Immunization Coordination Commit-
tee, to mobilize the needed materials (i.e., vaccine, syringes, needles, antitoxin, and
antibiotics) for all of the NIS except Russia, which continues to be self-sufficient for all
these materials.
This epidemic has been characterized by a high proportion of cases among adults;
children were the predominant age group affected in previous epidemics (3 ). Much of
the variation in incidence rates in the NIS during 1994 and 1995 was attributed to dif-
ferences in the timing of the onset of the epidemic between countries; however, the
success in implementing control measures is beginning to affect incidence rates. In
countries that have achieved high coverage among adults, diphtheria incidence has
decreased substantially, regardless of the level of incidence before the vaccination
campaigns. The impact of mass vaccination of the adult population on slowing the
course of the epidemic underscores the need for rapidly completing the vaccination
campaigns in the other countries.
All the NIS have attempted to increase childhood vaccination coverage, including
decreasing perceived contraindications to childhood vaccination and increasing the
routine use of full-strength vaccine preparations in the primary series; routine child-
hood coverage is now high in most countries. Most countries also have reinstituted a
school-entry booster dose and many of the national mass campaigns have included
preschool-aged and school-aged children and adolescents in the target population.
Other control measures are important in efforts to further reduce transmission of
diphtheria. Most of the NIS have made efforts to improve early diagnosis and treat-
ment of cases. Moldova, Lithuania, and Azerbaijan have adopted the WHO recommen-
dation to use empiric antibiotic treatment for close contacts of persons with
diphtheria. Providing additional doses of diphtheria toxoid to at least certain portions
of the population (e.g., adults aged 30–50 years in whom risk for severe disease and
death is highest) will be needed to fully protect all persons. Because some epi-
demiologic features of this epidemic differ from those of the prevaccine era and the
epidemiologic situation may vary among the NIS, ongoing surveillance and additional
field studies are needed to track the course of the epidemic in each country.
The reemergence of epidemic diphtheria throughout the NIS after >30 years of suc-
cessful control and the reports of >20 imported cases from the NIS into Europe (1,2 )
and Mongolia (WHO, unpublished data, 1996) emphasize the need for achieving and
maintaining high levels of diphtheria immunity among both adults and children in the
United States and other countries. The Advisory Committee on Immunization Prac-
tices recommends that all children receive a routine series of five doses of diphtheria
696 MMWR August 16, 1996
Diphtheria Epidemic — Continued

toxoid-containing vaccine with doses at ages 2, 4, 6, and 12–20 months and 4–6 years;
boosters of diphtheria and tetanus toxoids should then be administered beginning at
age 11–12 years (provided at least 5 years have passed since the last dose of diph-
theria toxoid-containing vaccine) and every 10 years thereafter (4–6 ). Travelers to
areas with diphtheria activity should review their vaccination status and receive age-
appropriate vaccinations as needed.
References1. CDC. Diphtheria epidemic—New Independent States of the former Soviet Union, 1990–1994.
MMWR 1995;44:177–81.
2. Hardy IR, Dittmann S, Sutter R. Current situation and control strategies for resurgence of diph-
theria in Newly Independent States of the former Soviet Union. Lancet 1996;347:1739–44.
3. Stuart G. Note on diphtheria incidence in certain European countries. British Medical Journal
1945;2:613–5.
4. Advisory Committee and Immunization Practices. Diphtheria, tetanus, and pertussis: recom-
mendations for vaccine use and other preventive measures—recommendations of the
Immunization Practices Advisory Committee (ACIP). MMWR 1991;40(no. RR-10).
5. CDC. Recommended childhood immunization schedule—United States, January–June 1996.
MMWR 1996;44:940–3.
6. CDC. Food and Drug Administration approval of an acellular pertussis vaccine for the initial
four doses of the diphtheria, tetanus, and pertussis vaccination series. MMWR 1996;45:676–7.
Diphtheria Epidemic — Continued
Progress Toward Poliomyelitis Eradication — Indonesia, 1995
Polio Eradication — ContinuedIn 1988, Indonesia (1991 population: 181 million) adopted the goal of eradicating
poliomyelitis by the year 2000. Although routine coverage with three doses of oral
poliovirus vaccine (OPV3) has been >90% among 1-year-old children since 1991, cases
of polio continue to be reported (Figure 1). To interrupt poliovirus transmission, Na-
tional Immunization Days (NIDs)* were conducted during September 13–17 and Octo-
ber 18–22, 1995, resulting in vaccination of >22 million children aged <5 years
(representing approximately 100% of the target population). NIDs are planned for Sep-
tember 10–14 and October 15–19, 1996, and in 1997. This report presents the polio
surveillance data for Indonesia for 1995, which indicate that substantial improvements
are necessary to meet the objectives of the polio-eradication initiative. Activities are
under way to intensify surveillance for acute flaccid paralysis (AFP) and to identify the
remaining reservoirs of wild poliovirus transmission.
Indonesia, which instituted AFP surveillance in 1995, requires all cases of AFP to be
reported immediately to health authorities. A case of suspected polio is defined as
AFP, including Guillain-Barré syndrome, in a child aged <15 years for which no other
cause can be immediately identified, or any patient in whom a clinician suspects polio
regardless of age. Stool specimens collected from AFP case-patients were sent to one
of three designated laboratories in Bandung, Jakarta, and Surabaya for virus isolation.
Poliovirus isolates were sent to the national laboratory in Jakarta to distinguish wild
and vaccine-type polioviruses. Genetic sequencing of wild polioviruses was con-
ducted at CDC.
*Mass campaigns over a short period (days to weeks) in which two doses of oral poliovirusvaccine are administered to all children in the target age group, regardless of prior vaccinationhistory, with an interval of 4–6 weeks between doses.
Vol. 45 / No. 32 MMWR 697
Diphtheria Epidemic — Continued

The number of reported polio cases has decreased substantially since the start of
the national Expanded Program on Immunization (Figure 1). In 1995, a total of 22 cases
of AFP were reported, representing an AFP rate of 0.04 per 100,000 children aged
<15 years; seven (33%) cases were investigated within 48 hours of report, 17 (78%)
had stool specimens taken for virus isolation, and two (10%) cases had stool speci-
mens taken within 2 weeks of paralysis onset. Of the 22 cases of suspected polio,
12 have been classified as confirmed polio cases (using the standard WHO case defi-
nition†) by virus isolation (five cases—two in case-patients and three in contacts of
case-patients), with residual paralysis at 60 days’ follow-up (four), or lost to follow-up
(three). Four culture-confirmed cases of polio were associated with type 1 and one
with type 3 wild polioviruses with onset of paralysis during March and August 1995.
Four of these cases, in Java and Sumatra, occurred in unvaccinated children.
To define the molecular epidemiology of the type 1 wild polioviruses isolated from
the four culture-confirmed cases in 1995, genetic sequencing was conducted on a 150-
nucleotide interval at the VP1/2A junction of the viral genome (1 ). Because the
poliovirus genome mutates at a rate of approximately two nucleotide substitutions
per week, it is possible to quantify the genetic relatedness of isolates from different
geographic areas and determine chains of transmission. Data summarizing the se-
quence relatedness among wild poliovirus isolates recently identified as endemic in
South and East Asia suggested that the type 1 wild polioviruses isolated from Indone-
sia in 1995 form a distinct cluster and have been circulating in the country for at least
10 years. The genetic sequences of the isolates from Java and Sumatra, although
1988 1989 1990 1991 1992 1993 19940
20
40
60
80
100
Year
Pe
rce
nt
OPV3 Coverage Reported Cases
1988 1989 1990 1991 1992 1993 1994 19950
200
400
600
800
1,000
Year
Cas
es
Cas
es
1000
1988 1989 1990 1991 1992 1993 1994 1995
Year
Per
cent
YearYear
Source: Ministry of Health, Indonesia.
FIGURE 1. Reported percentage coverage with three doses of oral poliovirus vaccine(OPV3) among 1-year-olds, by year, 1988–1994, and number of reported poliomyelitiscases, by year, 1988–1995 — Indonesia
†A confirmed case of polio is defined as AFP and at least one of the following: 1) laboratory-confirmed wild poliovirus infection, 2) residual paralysis at 60 days, 3) death, or 4) no follow-upinvestigation at 60 days.
698 MMWR August 16, 1996
Polio Eradication — Continued

found at the same time on adjacent islands, differed enough to suggest that the two
cases were not related epidemiologically.Reported by: H Wibosono, MD, H Roespandi, MD, Surveillance Unit, Ministry of Health, Indo-nesia; W Gendro, Polio Laboratory, Indonesia National Institute of Health, Research, andDevelopment, Jakarta; L Soemara, MD, PT Biofarma, S Rusliana, MD, Public Health Laboratoryof Surabaya; S Prihatini, MD, Provincial Health Svcs, East Java. United Nations Children’s Fund;World Health Organization, Jakarta, Indonesia. Respiratory and Enterovirus Br, National Centerfor Infectious Diseases; Polio Eradication Activity, National Immunization Program, CDC.
Editorial Note: Indonesia successfully conducted its first NIDs in 1995 and is improv-
ing surveillance for polio by requiring AFP reporting. The AFP reporting rate in Indo-
nesia during 1995 (0.04 per 100,000) was substantially lower than the expected rate of
one AFP case per 100,000 persons aged <15 years (the rate used to define a sensitive
AFP surveillance system [653 cases would be expected each year in Indonesia if the
rate reached one per 100,000]). To meet the objectives of the polio-eradication initia-
tive, performance indicators other than the AFP rate (i.e., proportion of case investiga-
tions conducted within 48 hours of notification and proportion of cases for which two
stool specimens were obtained within 2 weeks of paralysis onset) should be at least
80%, which indicates adequate surveillance. Major efforts are under way to
strengthen the surveillance system as a guide to further polio-eradication activities in
Indonesia; these efforts include establishing active AFP reporting (i.e., reviewing hos-
pital discharge records for AFP in hospitalized patients) linked with timely AFP case
investigations.
The low level of AFP reporting in Indonesia and the retrospective reviews of hospi-
tal records indicate that many persons with AFP or with physician-diagnosed polio are
admitted to hospitals but are not reported to public health officials. Although a hospi-
tal early-warning system is in place to immediately report high-priority infectious dis-
eases, active surveillance systems probably will be needed to increase sensitivity.
These active systems will be valuable especially in densely populated urban areas.
For the global polio-eradication initiative, genetic analysis of wild poliovirus iso-
lates has provided critically important information. The isolation of type 1 wild
poliovirus in Java and Sumatra indicate that the virus is indigenous to Indonesia and
has circulated for many years, and confirmed the independent evolution of at least
two poliovirus reservoirs in the country. These findings suggest that wild poliovirus
has remained endemic in Indonesia despite routine high coverage with OPV3 in recent
years and underscore the need for supplementary vaccination strategies (i.e., NIDs) to
interrupt poliovirus transmission.
Indonesia, the fourth most populous country in the world, is of critical importance
to the global polio-eradication initiative. Improved virologic surveillance already has
identified at least two indigenous poliovirus reservoirs. The government of Indonesia,
in cooperation with the major partner agencies contributing to the polio-eradication
initiative (including WHO, United Nations Children’s Fund [UNICEF], and Rotary Inter-
national), will need to establish a sensitive AFP surveillance system. Adequate surveil-
lance is necessary to identify the remaining poliovirus reservoirs and target areas for
supplemental vaccination activities (i.e., mopping-up vaccination§) and prepare Indo-
nesia for eventual certification of polio-free status (2 ).
§House-to-house administration of two doses of oral poliovirus vaccine at an interval of4–6 weeks to all children aged <3 years who reside in areas where risk for wild poliovirustransmission is highest.
Vol. 45 / No. 32 MMWR 699
Polio Eradication — Continued

References1. Kew OM, Mulders MN, Lipskaya GY, et al. Molecular epidemiology of polioviruses. Seminars
in Virology 1995;6:401–14.
2. World Health Organization. Report of the first meeting of the Global Commission for the Cer-
tification of the Eradication of Poliomyelitis. Geneva, Switzerland: World Health Organization,
Global Programme for Vaccines and Immunization, Expanded Programme on Immunization,
1995; publication no. WHO/EPI/GEN/95.6.
Polio Eradication — Continued
Average Postpartum Length of Stayfor Uncomplicated Deliveries — New Jersey, 1995
Average Postpartum Length of Stay — ContinuedDuring 1970–1992, total lengths of hospital stay following delivery declined sub-
stantially for both mothers and newborn infants (1 ). In response to public perceptions
that postpartum stays have become excessively short, 28 states have enacted legisla-
tion and the U.S. Senate is considering legislation* mandating that insurers provide
health-care coverage for a minimum postpartum length of stay for both mother and
infant. On June 28, 1995, New Jersey enacted legislation requiring insurance compa-
nies and health-maintenance organizations (HMOs) to pay for at least a 48-hour post-
partum hospital stay for women and newborns following vaginal delivery and a
96-hour postpartum stay following cesarean delivery when requested by the mother
or the attending physician.† To assess the effect of this law in New Jersey on the aver-
age length of stay for uncomplicated deliveries, electronic birth certificate (EBC) data
for 1995 were analyzed from four New Jersey hospitals. This report summarizes the
findings, which demonstrate that, following enactment of legislation, the average
length of stay increased for uncomplicated deliveries at these four hospitals.
On January 17, 1995, New Jersey initiated pilot testing of an EBC system in four of
the state’s 73 facilities that perform deliveries (69 hospitals and four birthing centers).
These four hospitals, representing approximately 8% of births in New Jersey, were
selected because they were considered sufficiently diverse to test the system and to
detect any problems before statewide implementation of the EBC system in all birth-
ing facilities (V. Dato, Division of Family Health Services, New Jersey Department of
Health and Senior Services, personal communication, September 1995). The selected
hospitals (one regional perinatal center and three community hospitals) are nonprofit
organizations and represent north, south, and central New Jersey and urban and sub-
urban areas. Because the EBC data include the exact time of delivery and the day and
hour of discharge for the infant, length of stay was calculated in hours and converted
to the equivalent proportion of days.
Length of stay was defined as the time from birth to discharge of an infant from the
hospital. Deliveries were classified as uncomplicated if they met the following criteria:
1) a live-born infant weighing ≥2500 g (≥5 lbs 8 oz) was delivered vaginally or by
cesarean, 2) the mother and infant were discharged on the same day, and 3) the infant
was not admitted or transferred to a neonatal intensive-care unit. Because this study
focused on length of stay for uncomplicated deliveries, deliveries with a high likeli-
*The New Borns’ and Mothers’ Health Protection Act of 1996; S. Rep. No. 969, 104th Cong., 2dSess. (1996).
†N.J. Stat. Ann. 17:48–61 as amended by Public Law 1995, c. 138.
700 MMWR August 16, 1996
Polio Eradication — Continued

hood of having complications (i.e., those greater than the 97.5th percentile for length
of stay) were excluded from analysis.§
From January 17 through December 31, 1995, a total of 9007 live-born infants were
delivered at the four selected hospitals in New Jersey. Of the 7209 uncomplicated de-
liveries, 5619 (78%) were vaginal, and 1590 (22%) were cesarean. The number of deliv-
eries that occurred before and after the law were similar: for vaginal deliveries, 46%
and 54% of deliveries, respectively, and for cesarean deliveries, 47% and 53%, respec-
tively.
After enactment of the New Jersey legislation, the average postpartum length of
stay increased for both uncomplicated vaginal and cesarean deliveries (Figure 1). The
average length of stay for vaginal deliveries increased 29%, from 1.4 days before the
law to 1.8 days after the law (Table 1). The average length of stay for cesarean deliver-
ies increased 18%, from 2.8 days before the law to 3.3 days after the law.
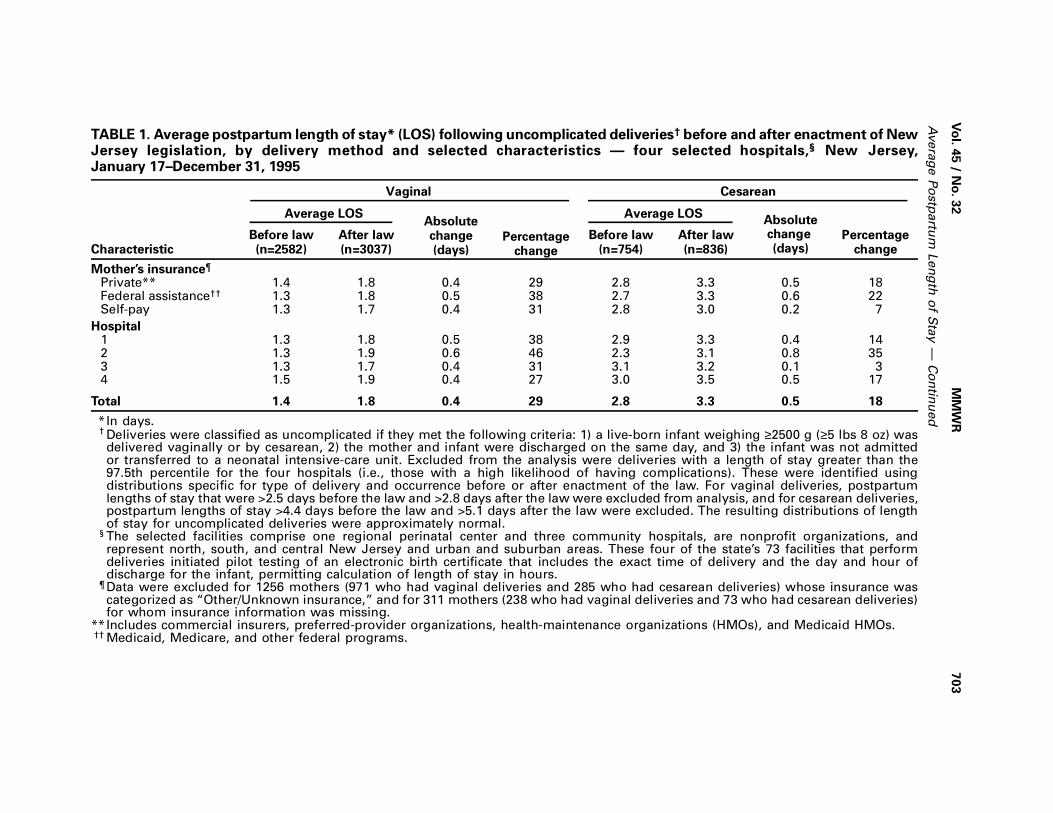
Length of stay also was examined by type of insurance and hospital (Table 1). After
enactment of the law, length of stay increased for all types of insurance; increases
were greater for private and federal assistance insurance¶ than for self-pay groups.
However, self-pay deliveries represented <2% of all deliveries. Length of stay also in-
creased for all four participating hospitals after enactment of the law; the increase was
greatest for the hospital with the shortest average length of stay for cesarean deliver-
ies before enactment of the law.Reported by: V Dato, MD, L Ziskin, MD, M Fulcomer, PhD, RM Martin, MPH, K Knoblauch, NewJersey Dept of Health and Senior Svcs. Pregnancy and Infant Health Br, Div of ReproductiveHealth, National Center for Chronic Disease Prevention and Health Promotion, CDC.
Editorial Note: The findings in this report indicate that, after enactment of legislation
in New Jersey mandating insurance coverage for a minimum length of hospital stay
for mother and infant following obstetric delivery, the average postpartum length of
stay for all uncomplicated deliveries increased by 10–12 hours in these four hospitals.
Because the New Jersey EBC system allowed calculation of the length of stay in
hours, the system provides a more precise measure of the length of stay than most
previous studies, which calculated length of stay in days.
The findings in this report are subject to at least three limitations. First, EBC data
are subject to the limitations of other vital records data, including limited information
(particularly about content of prenatal care). Second, because the analysis included
only the four hospitals using the EBC system for the 6 months before enactment of the
New Jersey legislation, the results may not be generalizable to the entire state. Finally,
some insurance carriers administer both traditional health-care plans, which are sub-
ject to state regulation, and self-insured health plans, which are not. Therefore, for
deliveries covered by these carriers, the EBC system cannot differentiate those deliv-
eries exempt from the state law.
Following consumer demand for less medical intervention in the birthing process
(2 ) and institution of cost-containment measures by the insurance industry, the na-
§Deliveries for which the length of stay was greater than the 97.5th percentile for the fourhospitals were identified using distributions specific for type of delivery and occurrence beforeor after enactment of the law. For vaginal deliveries, postpartum lengths of stay that were>2.5 days before the law and >2.8 days after the law were excluded from analysis and, forcesarean deliveries, postpartum lengths of stay >4.4 days before the law and >5.1 days afterthe law were excluded. The resulting distributions of length of stay for uncomplicated deliverieswere approximately normal.
¶Includes Medicaid, Medicare, and other federal programs.
Vol. 45 / No. 32 MMWR 701
Average Postpartum Length of Stay — Continued

Enactment of Legislation
Cesarean Delivery
Vaginal Delivery
J F M A M J J A S O N D0
1
2
3
4
Month
Leng
th o
f Sta
y (D
ays)
*Deliveries were classified as uncomplicated if they met the following criteria: 1) a live-borninfant weighing ≥2500 g (≥5 lbs 8 oz) was delivered vaginally or by cesarean, 2) the motherand infant were discharged on the same day, and 3) the infant was not admitted or transferredto a neonatal intensive-care unit. Excluded from the analysis were deliveries with a length ofstay greater than the 97.5th percentile for the four hospitals (i.e., those with a high likelihoodof having complications). These were identified using distributions specific for type of deliveryand occurrence before or after enactment of the law. For vaginal deliveries, postpartum lengthsof stay that were >2.5 days before the law and >2.8 days after the law were excluded fromanalysis, and for cesarean deliveries, postpartum lengths of stay >4.4 days before the law and>5.1 days after the law were excluded. The resulting distributions of length of stay for uncom-plicated deliveries were approximately normal.
†The selected facilities comprise one regional perinatal center and three community hospitals,are nonprofit organizations, and represent north, south, and central New Jersey and urbanand suburban areas. These four of the state’s 73 facilities that perform deliveries initiated pilottesting of an electronic birth certificate that includes the exact time of delivery and the dayand hour of discharge for the infant, permitting calculation of length of stay in hours.
§This study comprised 5619 vaginal deliveries and 1590 cesarean deliveries.
Source: 1995 New Jersey electronic birth certificate data.
FIGURE 1. Average postpartum length of stay following uncomplicated deliveries*,by delivery method — four selected hospitals†, New Jersey, January 17– December 31,1995§
702 MMWR August 16, 1996
Average Postpartum Length of Stay — Continued
Avera
ge P
ostp
artu
m L
en
gth
of S
tay —
Co
ntin
ued
Vo
l. 45 / N
o. 3
2M
MW
R70
3
TABLE 1. Average postpartum length of stay* (LOS) following uncomplicated deliveries† before and after enactment of NewJersey legislation, by delivery method and selected characteristics — four selected hospitals,§ New Jersey,January 17–December 31, 1995
Vaginal Cesarean
Average LOSAbsolutechange(days)
Average LOSAbsolutechange (days)Characteristic
Before law(n=2582)
After law(n=3037)
Percentagechange
Before law(n=754)
After law(n=836)
Percentagechange
Mother’s insurance¶
Private** 1.4 1.8 0.4 29 2.8 3.3 0.5 18Federal assistance†† 1.3 1.8 0.5 38 2.7 3.3 0.6 22Self-pay 1.3 1.7 0.4 31 2.8 3.0 0.2 7
Hospital1 1.3 1.8 0.5 38 2.9 3.3 0.4 142 1.3 1.9 0.6 46 2.3 3.1 0.8 353 1.3 1.7 0.4 31 3.1 3.2 0.1 34 1.5 1.9 0.4 27 3.0 3.5 0.5 17
Total 1.4 1.8 0.4 29 2.8 3.3 0.5 18
*In days.† Deliveries were classified as uncomplicated if they met the following criteria: 1) a live-born infant weighing ≥2500 g (≥5 lbs 8 oz) was
delivered vaginally or by cesarean, 2) the mother and infant were discharged on the same day, and 3) the infant was not admittedor transferred to a neonatal intensive-care unit. Excluded from the analysis were deliveries with a length of stay greater than the97.5th percentile for the four hospitals (i.e., those with a high likelihood of having complications). These were identified usingdistributions specific for type of delivery and occurrence before or after enactment of the law. For vaginal deliveries, postpartumlengths of stay that were >2.5 days before the law and >2.8 days after the law were excluded from analysis, and for cesarean deliveries,postpartum lengths of stay >4.4 days before the law and >5.1 days after the law were excluded. The resulting distributions of lengthof stay for uncomplicated deliveries were approximately normal.
§ The selected facilities comprise one regional perinatal center and three community hospitals, are nonprofit organizations, andrepresent north, south, and central New Jersey and urban and suburban areas. These four of the state’s 73 facilities that performdeliveries initiated pilot testing of an electronic birth certificate that includes the exact time of delivery and the day and hour ofdischarge for the infant, permitting calculation of length of stay in hours.
¶ Data were excluded for 1256 mothers (971 who had vaginal deliveries and 285 who had cesarean deliveries) whose insurance wascategorized as “Other/Unknown insurance,” and for 311 mothers (238 who had vaginal deliveries and 73 who had cesarean deliveries)for whom insurance information was missing.
**Includes commercial insurers, preferred-provider organizations, health-maintenance organizations (HMOs), and Medicaid HMOs.†† Medicaid, Medicare, and other federal programs.
tional average length of hospital stay for obstetric deliveries declined by nearly
50% during 1970–1992. In 1992, the average total length of stay for all hospital deliver-
ies in the United States was 2.6 days (2.1 days for vaginal deliveries and 4.0 days for
cesarean deliveries) (1 ). In the western United States, lengths of stay of 12–24 hours
after uncomplicated vaginal deliveries are common (3 ). However, consumer groups,
legislators, and health-care providers are concerned that early hospital discharge may
adversely affect 1) the mother’s feeling of preparedness to care for the infant and her-
self, 2) the ability of hospital staff to effectively teach a mother to care for the infant
and herself and assess her ability to do so, 3) initiation and continuation of breastfeed-
ing, 4) early diagnosis and treatment of infant and maternal morbidity, and 5) the abil-
ity to obtain adequate specimens for newborn metabolic screenings (3 ).
Over the past several decades, early postpartum discharge has been variously de-
fined (4 ). In 1992, the American Academy of Pediatrics (AAP) and the American Col-
lege of Obstetricians and Gynecologists defined early discharge for uncomplicated
deliveries as <48 hours for vaginal delivery and <96 hours for cesarean delivery (5 ). In
addition, in 1995, the AAP published guidelines for newborn discharge (6 ) that in-
clude meeting certain medical criteria and receiving appropriate support and follow-
up. However, previous studies have not adequately examined the effects of short
postpartum stays on maternal and infant outcomes because of small sample sizes,
poor study designs, and lack of controls. In addition, most of these studies were con-
ducted under specific, controlled circumstances (e.g., intensive and repeated in-home
follow-ups) that do not represent well-established standards of care for health-care
providers (3 ). Further research is needed to determine an optimal length of stay and
adequate follow-up care for women and infants.
Because of federal legislation enacted in 1974 (Employee Retirement Income Secu-
rity Act of 1974 [ERISA]**), state legislation cannot mandate coverage requirements
for employer self-insured plans. An estimated 40%–55% of the insured U.S. popula-
tion is covered by ERISA plans (7 ). The proposed New Borns’ and Mothers’ Health
Protection Act of 1996 would require a minimum coverage for postpartum stays of
48 hours for vaginal deliveries and 96 hours for cesarean deliveries for all insurance
plans in all states.
References1. CDC. Trends in length of stay for hospital deliveries—United States, 1970–1992. MMWR
1995;44:335–7.
2. Beck CT. Early postpartum discharge programs in the United States: a literature review and
critique. Women Health 1991;17:125–38.
3. Braveman P, Egerter S, Pearl M, Marchi K, Miller C. Early discharge of newborns and mothers:
a critical review of the literature. Pediatrics 1995;96:716–26.
4. Kessel W, Kiely M, Nora AH, Sumaya CV. Early discharge: in the end, it is judgement. Pediatrics
1995;96:739–42.
5. American Academy of Pediatrics/American College of Obstetricians and Gynecologists. Guide-
lines for perinatal care. 3rd ed. Washington, DC: American College of Obstetricians and
Gynecologists, 1992;105–8.
6. Committee on Fetus and Newborn, American Academy of Pediatrics. Hospital stay for healthy
term newborns. Pediatrics 1995;96:788–90.
7. Kent C. Bill would put the brakes on “drive-through deliveries”. American Medical News, Oc-
tober 2, 1995:1,19.
Average Postpartum Length of Stay — Continued
**Public Law 93-406 (29 USC 1001–1461).
704 MMWR August 16, 1996
Average Postpartum Length of Stay — Continued

FIGURE I. Selected notifiable disease reports, comparison of 4-week totals endingAugust 10, 1996, with historical data — United States
Anthrax - HIV infection, pediatric*§ 170Brucellosis 53 Plague -Cholera 2 Poliomyelitis, paralytic¶ -Congenital rubella syndrome 1 Psittacosis 22Cryptosporidiosis* 1,075 Rabies, human -Diphtheria 1 Rocky Mountain spotted fever (RMSF) 357Encephalitis: California* 16 Streptococcal toxic-shock syndrome* 10
eastern equine* 2 Syphilis, congenital** -St. Louis* - Tetanus 17western equine* - Toxic-shock syndrome 89
Hansen Disease 63 Trichinosis 14Hantavirus pulmonary syndrome*† 9 Typhoid fever 200
Cum. 1996Cum. 1996
TABLE I. Summary — cases of selected notifiable diseases, United States,cumulative, week ending August 10, 1996 (32nd Week)
-: no reported cases *Not notifiable in all states.
† Updated weekly from reports to the Division of Viral and Rickettsial Diseases, National Center for Infectious Diseases (NCID).§ Updated monthly to the Division of HIV/AIDS Prevention, National Center for HIV, STD, and TB Prevention (NCHSTP), last
update July 30, 1996.¶ Three suspected cases of polio with onset in 1996 have been reported to date.
**Updated quarterly from reports to the Division of STD Prevention, NCHSTP. First quarter 1996 is not yet available.
DISEASE DECREASE INCREASECASES CURRENT
4 WEEKS
Ratio (Log Scale)*
Beyond Historical Limits
4210.50.25
1,517
557
186
73
144
91
167
32
466
437
64
Hepatitis A
Hepatitis B
Hepatitis, C/Non-A, Non-B
Legionellosis
Malaria
Measles, Total
Meningococcal Infections
Mumps
Pertussis
Rabies, Animal
RubellaAAAAAAAAAAAAAAAAAAAA
AAAAAAAAAA
AAAAAAAAAAAA
AAAAAA
AAAAAAAAAAAAAAAAAAAA
AAAAAAAAAA
*Ratio of current 4-week total to mean of 15 4-week totals (from previous, comparable, andsubsequent 4-week periods for the past 5 years). The point where the hatched area begins isbased on the mean and two standard deviations of these 4-week totals.
Vol. 45 / No. 32 MMWR 705

TABLE II. Cases of selected notifiable diseases, United States, weeks endingAugust 10, 1996, and August 12, 1995 (32nd Week)
UNITED STATES 39,982 42,926 200,725 1,220 560 171,884 238,200 2,118 2,418 472 733
NEW ENGLAND 1,589 2,182 10,662 177 33 4,480 4,582 72 81 25 15Maine 29 75 547 16 - 29 52 - - 1 4N.H. 50 70 397 19 12 80 71 6 12 - 1Vt. 14 21 - 12 11 37 34 27 7 3 -Mass. 740 996 4,068 79 10 1,346 1,647 33 58 14 9R.I. 113 144 1,237 8 - 314 304 6 4 7 1Conn. 643 876 4,413 43 - 2,674 2,474 - - N N
MID. ATLANTIC 11,159 11,231 23,236 115 34 17,736 27,041 186 266 101 121Upstate N.Y. 1,378 1,439 N 76 12 3,694 5,854 152 134 36 32N.Y. City 6,277 5,655 9,512 6 - 4,931 10,942 1 1 3 3N.J. 2,130 2,745 2,482 33 5 2,853 2,226 - 107 8 19Pa. 1,374 1,392 11,242 N 17 6,258 8,019 33 24 54 67
E.N. CENTRAL 3,225 3,350 25,882 291 132 25,813 47,684 294 196 131 212Ohio 696 723 11,986 75 36 8,836 14,972 22 7 55 98Ind. 433 335 6,187 32 23 4,041 5,703 7 1 29 49Ill. 1,397 1,394 2,502 130 16 10,486 11,960 46 58 9 22Mich. 528 668 U 54 38 U 10,992 219 130 29 21Wis. 171 230 5,207 N 19 2,450 4,057 - - 9 22
W.N. CENTRAL 935 1,017 14,527 268 163 7,091 12,345 80 48 26 49Minn. 170 218 - 101 94 U 1,890 1 2 3 -Iowa 63 54 2,588 66 50 663 798 40 8 6 16Mo. 469 472 7,640 38 - 4,927 7,049 21 15 6 13N. Dak. 10 4 2 9 7 1 17 - 4 - 3S. Dak. 8 9 689 9 - 95 120 - 1 2 -Nebr. 65 75 898 21 3 161 707 4 10 7 11Kans. 150 185 2,710 24 9 1,244 1,764 14 8 2 6
S. ATLANTIC 9,735 10,759 32,946 64 34 59,226 65,849 147 149 86 115Del. 193 219 1,148 - 1 875 1,303 1 - 8 2Md. 1,149 1,416 3,813 N 5 8,127 7,471 1 6 15 20D.C. 638 640 N - - 2,758 2,732 - - 6 4Va. 647 880 6,532 N 16 5,800 6,437 8 9 13 11W. Va. 73 62 1 N 2 313 470 7 36 1 3N.C. 539 587 - 17 7 11,263 14,920 30 36 6 25S.C. 500 569 - 6 3 6,743 7,710 17 15 4 21Ga. 1,421 1,459 7,137 20 - 12,366 12,269 U 15 3 14Fla. 4,575 4,927 14,315 14 - 10,981 12,537 83 32 30 15
E.S. CENTRAL 1,311 1,391 18,268 32 29 19,564 24,817 394 699 31 44Ky. 212 179 4,083 7 4 2,518 2,825 20 22 3 8Tenn. 497 561 7,998 13 22 6,924 8,379 303 675 15 21Ala. 365 375 5,289 8 3 8,515 10,290 4 2 3 5Miss. 237 276 U 4 - 1,607 3,323 67 U 10 10
W.S. CENTRAL 3,970 3,694 29,081 35 9 21,281 33,400 288 168 15 13Ark. 170 166 - 11 3 2,263 3,089 3 4 - 5La. 923 602 4,264 5 3 4,717 7,465 130 104 1 2Okla. 165 173 4,703 6 1 2,926 3,343 69 30 4 3Tex. 2,712 2,753 20,114 13 2 11,375 19,503 86 30 10 3
MOUNTAIN 1,198 1,330 9,673 91 48 4,480 5,578 396 289 24 87Mont. 22 14 - 12 - 17 43 12 10 1 4Idaho 25 31 944 20 5 67 86 88 34 - 2Wyo. 3 10 350 - 2 16 33 122 120 3 8Colo. 335 454 - 34 21 1,077 1,797 35 42 7 33N. Mex. 114 111 U 5 - 540 636 42 35 1 4Ariz. 342 350 3,934 N 13 2,287 2,024 44 24 8 7Utah 117 87 921 12 - 182 136 44 10 2 12Nev. 240 273 1,031 8 7 294 823 9 14 2 17
PACIFIC 6,859 7,972 36,450 147 78 12,213 16,904 261 522 33 77Wash. 447 576 5,859 31 5 1,282 1,575 36 133 3 15Oreg. 311 275 U 47 29 331 468 4 33 - -Calif. 5,964 6,910 25,872 66 36 10,105 14,059 99 346 28 57Alaska 16 50 680 3 2 264 425 2 1 1 -Hawaii 121 161 780 N 6 231 377 120 9 1 5
Guam 4 - 168 N - 31 77 1 4 2 1P.R. 1,352 1,692 N 12 U 157 363 71 141 - -V.I. 16 25 N N U - - - - - -Amer. Samoa - - - N U - 15 - - - -C.N.M.I. 1 - N N U 11 32 - 5 - -
N: Not notifiable U: Unavailable -: no reported cases C.N.M.I.: Commonwealth of Northern Mariana Islands
*Updated monthly to the Division of HIV/AIDS Prevention, National Center for HIV, STD, and TB Prevention, last update July 30, 1996.†National Electronic Telecommunications System for Surveillance.§Public Health Laboratory Information System.
Reporting Area
AIDS* Chlamydia
Escherichia
coli O157:H7
Gonorrhea
Hepatitis
C/NA,NB LegionellosisNETSS† PHLIS§
Cum.
1996
Cum.
1995
Cum.
1996
Cum.
1996
Cum.
1996
Cum.
1996
Cum.
1995
Cum.
1996
Cum.
1995
Cum.
1996
Cum.
1995
706 MMWR August 16, 1996

TABLE II. (Cont’d.) Cases of selected notifiable diseases, United States, weeks endingAugust 10, 1996, and August 12, 1995 (32nd Week)
UNITED STATES 5,310 6,015 794 705 2,216 2,073 6,663 9,988 11,118 12,242 3,413 4,862
NEW ENGLAND 1,817 1,221 33 29 96 96 109 230 242 295 425 988Maine 13 10 6 3 12 6 - 2 4 11 56 21N.H. 21 18 1 1 3 16 1 1 8 9 41 109Vt. 9 7 2 1 3 6 - - 1 2 106 123Mass. 103 70 11 9 36 33 50 39 113 162 65 314R.I. 204 189 5 3 10 4 1 2 24 28 30 195Conn. 1,467 927 8 12 32 31 57 186 92 83 127 226
MID. ATLANTIC 2,935 3,883 181 190 196 268 259 533 1,936 2,642 448 1,262Upstate N.Y. 1,863 1,908 52 37 59 74 47 54 234 298 241 742N.Y. City 182 292 91 94 30 36 71 231 1,068 1,518 - -N.J. 211 1,029 28 45 53 66 77 114 433 442 84 236Pa. 679 654 10 14 54 92 64 134 201 384 123 284
E.N. CENTRAL 38 253 85 97 300 297 851 1,714 1,200 1,149 40 50Ohio 25 20 9 6 118 86 310 546 176 161 6 5Ind. 12 11 9 12 46 41 139 184 112 109 1 9Ill. 1 13 35 54 77 80 284 678 689 610 7 6Mich. - 5 22 13 31 54 U 177 161 217 15 22Wis. U 204 10 12 28 36 118 129 62 52 11 8
W.N. CENTRAL 83 68 27 18 179 123 221 497 298 368 339 242Minn. 18 5 9 3 23 21 27 29 70 93 18 11Iowa 16 7 2 2 36 23 13 28 43 44 165 88Mo. 22 35 7 6 74 46 159 422 127 135 15 23N. Dak. - - 1 1 3 1 - - 3 3 46 22S. Dak. - - - 1 8 5 - - 14 13 76 66Nebr. 1 4 3 3 16 10 6 9 13 17 3 4Kans. 26 17 5 2 19 17 16 9 28 63 16 28
S. ATLANTIC 272 413 176 135 484 341 2,282 2,522 2,064 2,169 1,686 1,320Del. 36 30 3 1 2 5 23 8 20 37 43 70Md. 138 278 39 37 48 29 368 269 186 242 399 265D.C. 1 2 7 11 8 4 98 73 82 65 8 10Va. 25 30 24 30 35 45 279 380 178 146 349 253W. Va. 9 18 3 1 11 8 1 8 40 51 67 77N.C. 43 35 15 11 58 57 643 709 301 255 438 306S.C. 3 9 9 - 44 44 254 376 221 204 57 95Ga. 1 8 16 14 111 66 381 470 395 405 191 175Fla. 16 3 60 30 167 83 235 229 641 764 134 69
E.S. CENTRAL 42 35 18 12 125 136 1,489 2,002 812 850 133 174Ky. 8 8 3 1 20 35 83 113 155 186 32 15Tenn. 16 17 8 4 16 48 525 507 237 280 45 65Ala. 5 2 3 5 50 29 371 395 269 247 54 90Miss. 13 8 4 2 39 24 510 987 151 137 2 4
W.S. CENTRAL 70 72 20 17 244 248 1,056 1,966 1,434 1,500 41 495Ark. 19 6 - 2 28 25 113 301 118 146 14 33La. 1 3 2 2 45 39 343 657 59 148 13 22Okla. 5 28 - 1 23 25 123 116 116 128 14 26Tex. 45 35 18 12 148 159 477 892 1,141 1,078 U 414
MOUNTAIN 5 6 35 39 123 153 89 147 350 395 81 91Mont. - - 5 3 4 2 - 4 14 10 15 30Idaho 2 - - 1 19 7 2 - 6 8 - -Wyo. 2 3 3 - 3 5 2 - 3 1 20 21Colo. - - 16 17 22 40 23 85 45 37 22 -N. Mex. - 1 1 4 21 29 1 5 52 56 3 3Ariz. - - 4 6 33 45 56 21 146 194 16 27Utah 1 - 4 5 12 12 2 4 34 19 2 7Nev. - 2 2 3 9 13 3 28 50 70 3 3
PACIFIC 48 64 219 168 469 411 307 377 2,782 2,874 220 240Wash. 5 4 13 14 67 69 4 10 144 167 - 4Oreg. 9 9 15 11 82 73 8 18 57 74 - 1Calif. 33 51 182 132 312 259 294 348 2,436 2,477 212 228Alaska - - 3 1 5 6 - 1 43 47 8 7Hawaii 1 - 6 10 3 4 1 - 102 109 - -
Guam - - - 1 1 2 3 8 35 72 - -P.R. - - - 1 4 18 81 173 63 120 31 32V.I. - - - 2 - - - - - - - -Amer. Samoa - - - - - - - - - 3 - -C.N.M.I. - - - 1 - - 1 1 - 23 - -
N: Not notifiable U: Unavailable -: no reported cases
Reporting Area
Lyme
Disease Malaria
Meningococcal
Disease
Syphilis
(Primary & Secondary) Tuberculosis Rabies, Animal
Cum.
1996
Cum.
1995
Cum.
1996
Cum.
1995
Cum.
1996
Cum.
1995
Cum.
1996
Cum.
1995
Cum.
1996
Cum.
1995
Cum.
1996
Cum.
1995
Vol. 45 / No. 32 MMWR 707

TABLE III. Cases of selected notifiable diseases preventable by vaccination,United States, weeks ending August 10, 1996, and August 12, 1995 (32nd Week)
UNITED STATES 755 747 16,259 17,197 5,706 6,192 37 367 4 29
NEW ENGLAND 20 30 199 163 110 151 - 8 1 4Maine - 3 13 17 2 6 - - - -N.H. 8 7 10 7 9 16 - - - -Vt. 1 2 4 4 10 2 - 1 1 1Mass. 10 10 103 68 35 56 - 6 - 3R.I. 1 3 9 20 7 8 - - - -Conn. - 5 60 47 47 63 - 1 - -
MID. ATLANTIC 117 104 980 1,068 858 875 1 19 - 5Upstate N.Y. 37 25 265 251 225 227 - - - -N.Y. City 20 26 378 527 396 288 1 9 - 3N.J. 36 11 205 146 155 223 - - - -Pa. 24 42 132 144 82 137 - 10 - 2
E.N. CENTRAL 116 133 1,354 2,052 586 710 - 6 - 3Ohio 70 68 536 1,166 85 78 - 2 - -Ind. 7 17 192 98 102 139 - - - -Ill. 27 30 262 419 129 187 - 2 - 1Mich. 7 16 264 235 232 256 - 1 - 2Wis. 5 2 100 134 38 50 - 1 - -
W.N. CENTRAL 33 55 1,314 1,192 260 418 - 17 1 2Minn. 20 28 77 118 35 33 - 14 1 2Iowa 5 3 237 61 59 31 - - - -Mo. 5 17 621 853 127 304 - 2 - -N. Dak. - - 28 19 - 4 - - - -S. Dak. 1 1 37 33 - 2 - - - -Nebr. 1 3 144 31 16 20 - - - -Kans. 1 3 170 77 23 24 - 1 - -
S. ATLANTIC 176 150 749 691 900 816 - 6 - 5Del. 2 - 9 8 6 6 - 1 - -Md. 42 53 127 128 191 161 - 2 - 1D.C. 5 - 20 16 27 14 - - - -Va. 6 19 99 118 90 65 - - - 2W. Va. 6 6 12 12 14 34 - - - -N.C. 20 24 87 73 227 193 - 3 - 1S.C. 4 1 37 29 49 33 - - - -Ga. 72 43 61 50 8 62 - - - 1Fla. 19 4 297 257 288 248 - - - -
E.S. CENTRAL 19 6 925 1,033 495 566 - - - -Ky. 4 1 19 33 36 51 - - - -Tenn. 8 - 628 847 285 441 - - - -Ala. 6 4 125 55 39 74 - - - -Miss. 1 1 153 98 135 - - - - -
W.S. CENTRAL 31 39 3,373 2,070 756 735 3 23 - 2Ark. - 5 314 265 50 34 - - - -La. 3 1 107 61 75 118 - - - -Okla. 25 20 1,398 510 59 97 - - - -Tex. 3 13 1,554 1,234 572 486 3 23 - 2
MOUNTAIN 76 84 2,574 2,604 662 538 33 145 2 5Mont. - - 80 69 6 16 - - - -Idaho 1 2 148 225 67 64 - 1 - -Wyo. 35 4 26 83 29 17 - - - -Colo. 11 10 278 321 82 78 - 4 - 3N. Mex. 9 12 271 544 222 198 2 10 - -Ariz. 9 21 1,031 737 162 85 - 8 - -Utah 6 9 585 494 65 46 31 117 2 2Nev. 5 26 155 131 29 34 - 5 - -
PACIFIC 167 146 4,791 6,324 1,079 1,383 - 143 - 3Wash. 2 8 321 494 60 118 - 45 - -Oreg. 22 20 562 1,610 39 83 - 4 - -Calif. 140 114 3,828 4,084 963 1,161 - 30 - 2Alaska 1 - 30 27 9 9 - 63 - -Hawaii 2 4 50 109 8 12 - 1 - 1
Guam - - 2 5 - 4 U - U -P.R. 1 3 61 57 228 377 - 7 - -V.I. - - - 6 - 12 U - U -Amer. Samoa - - - 5 - - U - U -C.N.M.I. 10 11 1 21 5 10 U - U -
N: Not notifiable U: Unavailable -: no reported cases
*Of 175 cases among children aged <5 years, serotype was reported for 37 and of those, 10 were type b.†For imported measles, cases include only those resulting from importation from other countries.
Reporting Area
H. influenzae,
invasive
Hepatitis (viral), by type Measles (Rubeola)
A B Indigenous Imported†
Cum.
1996*
Cum.
1995
Cum.
1996
Cum.
1995
Cum.
1996
Cum.
1995 1996
Cum.
1996 1996
Cum.
1996
708 MMWR August 16, 1996

UNITED STATES 396 258 3 397 558 130 2,296 2,095 3 185 92
NEW ENGLAND 12 8 - - 10 9 470 305 - 24 35Maine - - - - 4 - 18 19 - - -N.H. - - - - 1 - 40 23 - - 1Vt. 2 - - - - - 13 41 - 2 -Mass. 9 2 - - 2 9 394 211 - 20 7R.I. - 5 - - - - - 1 - - -Conn. 1 1 - - 3 - 5 10 - 2 27
MID. ATLANTIC 24 11 - 57 82 10 169 168 - 7 12Upstate N.Y. - 1 - 18 19 3 89 78 - 4 3N.Y. City 12 5 - 13 9 - 21 27 - 1 7N.J. - 5 - 2 13 - 5 11 - 2 2Pa. 12 - - 24 41 7 54 52 - - -
E.N. CENTRAL 9 13 2 74 95 15 225 254 - 3 3Ohio 2 1 2 32 29 9 110 79 - - -Ind. - - - 5 7 - 19 18 - - -Ill. 3 1 - 18 28 5 69 45 - 1 -Mich. 3 5 - 18 31 1 22 35 - 2 3Wis. 1 6 - 1 - - 5 77 - - -
W.N. CENTRAL 19 2 - 9 32 34 127 124 - 1 -Minn. 16 - - 3 2 30 89 42 - - -Iowa - - - 1 8 - 4 6 - 1 -Mo. 2 1 - 2 18 1 20 36 - - -N. Dak. - - - 2 - - 1 6 - - -S. Dak. - - - - - 1 3 8 - - -Nebr. - - - - 4 2 6 7 - - -Kans. 1 1 - 1 - - 4 19 - - -
S. ATLANTIC 11 11 1 65 85 9 290 173 - 89 8Del. 1 - - - - 1 11 9 - - -Md. 3 1 - 19 27 6 105 21 - - 1D.C. - - - - - - - 4 - 1 -Va. 2 - 1 10 16 - 26 10 - 2 -W. Va. - - - - - - 2 - - - -N.C. 4 - - 14 16 - 49 81 - 75 1S.C. - - - 5 7 1 22 16 - 1 -Ga. 1 2 - 2 6 - 13 13 - - -Fla. - 8 - 15 13 1 62 19 - 10 6
E.S. CENTRAL - - - 18 7 2 62 96 1 3 1Ky. - - - - - - 26 11 - - -Tenn. - - - 1 - - 17 55 1 1 1Ala. - - - 3 4 2 12 30 - 2 -Miss. - - - 14 3 - 7 - N N N
W.S. CENTRAL 25 20 - 16 38 2 59 163 - 2 7Ark. - 2 - - 5 1 4 27 - - -La. - 18 - 11 8 - 6 11 - 1 -Okla. - - - - - - 8 17 - - -Tex. 25 - - 5 25 1 41 108 - 1 7
MOUNTAIN 150 68 - 22 25 13 242 401 - 6 4Mont. - - - - 1 1 12 3 - - -Idaho 1 - - - 2 11 85 85 - 2 -Wyo. - - - - - - 3 1 - - -Colo. 7 26 - 2 - 1 64 64 - 2 -N. Mex. 10 31 N N N - 34 63 - - -Ariz. 8 10 - 1 2 - 11 146 - 1 3Utah 119 - - 2 11 - 11 17 - - 1Nev. 5 1 - 17 9 - 22 22 - 1 -
PACIFIC 146 125 - 136 184 36 652 411 2 50 22Wash. 45 19 - 18 10 7 235 96 - 1 -Oreg. 4 1 - - - - 29 27 - 1 -Calif. 32 103 - 99 158 29 374 250 2 45 18Alaska 63 - - 2 12 - 2 - - - -Hawaii 2 2 - 17 4 - 12 38 - 3 4
Guam - - U 5 3 U 1 2 U - 1P.R. 7 3 - 1 2 - 1 1 - - -V.I. - - U - 3 U - - U - -Amer. Samoa - - U - - U - - U - -C.N.M.I. - - U - - U - - U - -
N: Not notifiable U: Unavailable -: no reported cases
TABLE III. (Cont’d.) Cases of selected notifiable diseases preventable by vaccination,United States, weeks ending August 10, 1996, and August 12, 1995 (32nd Week)
Reporting Area
Measles (Rubeola), cont’d.
Mumps Pertussis RubellaTotal
Cum.
1996
Cum.
1995 1996
Cum.
1996
Cum.
1995 1996
Cum.
1996
Cum.
1995 1996
Cum.
1996
Cum.
1995
Vol. 45 / No. 32 MMWR 709

NEW ENGLAND 533 386 82 43 13 9 37Boston, Mass. 145 94 28 12 6 5 9Bridgeport, Conn. 38 29 6 1 2 - 2Cambridge, Mass. 9 9 - - - - -Fall River, Mass. 18 12 5 1 - - 2Hartford, Conn. 48 32 7 8 - 1 1Lowell, Mass. 30 25 4 - 1 - 3Lynn, Mass. 13 9 2 2 - - -New Bedford, Mass. 27 24 1 2 - - 2New Haven, Conn. 49 30 7 8 2 2 3Providence, R.I. 41 32 6 1 2 - 1Somerville, Mass. 3 - 2 1 - - -Springfield, Mass. 37 35 2 - - - 1Waterbury, Conn. 28 23 3 2 - - 4Worcester, Mass. 47 32 9 5 - 1 9
MID. ATLANTIC 2,313 1,516 455 259 46 37 101Albany, N.Y. 45 31 5 6 3 - 3Allentown, Pa. 15 12 2 1 - - -Buffalo, N.Y. 85 71 10 2 1 1 3Camden, N.J. 30 13 11 2 - 4 1Elizabeth, N.J. 10 5 3 1 - 1 -Erie, Pa.§ 33 29 4 - - - 3Jersey City, N.J. 35 22 7 4 2 - 3New York City, N.Y. 1,152 743 230 144 18 17 24Newark, N.J. 65 29 21 10 3 2 4Paterson, N.J. 34 11 9 13 - 1 1Philadelphia, Pa. 400 250 87 44 15 4 13Pittsburgh, Pa.§ 46 32 5 5 - 4 5Reading, Pa. 15 12 - 2 1 - 3Rochester, N.Y. 139 99 28 9 2 1 19Schenectady, N.Y. 10 6 3 1 - - 1Scranton, Pa.§ 25 21 3 1 - - 1Syracuse, N.Y. 109 84 15 8 1 1 10Trenton, N.J. 20 11 4 4 - 1 1Utica, N.Y. 19 16 2 1 - - 1Yonkers, N.Y. 26 19 6 1 - - 5
E.N. CENTRAL 2,066 1,323 397 191 87 65 106Akron, Ohio 38 26 10 1 - 1 -Canton, Ohio 33 28 3 1 - 1 2Chicago, Ill. 513 275 108 69 30 28 34Cincinnati, Ohio 147 103 25 14 2 3 10Cleveland, Ohio 154 97 36 14 6 1 3Columbus, Ohio 212 136 42 12 13 9 13Dayton, Ohio 108 68 31 6 2 1 8Detroit, Mich. 181 97 35 35 11 3 -Evansville, Ind. 39 30 5 2 1 1 1Fort Wayne, Ind. 65 46 12 3 4 - 5Gary, Ind. U U U U U U UGrand Rapids, Mich. 66 45 10 5 4 2 5Indianapolis, Ind. 137 96 21 9 9 2 3Madison, Wis. U U U U U U UMilwaukee, Wis. 99 64 21 8 1 5 4Peoria, Ill. 33 24 5 4 - - 3Rockford, Ill. 45 28 12 2 3 - 4South Bend, Ind. 52 45 4 2 1 - 4Toledo, Ohio 95 73 12 2 - 8 6Youngstown, Ohio 49 42 5 2 - - 1
W.N. CENTRAL 710 486 119 43 26 25 24Des Moines, Iowa U U U U U U UDuluth, Minn. 35 26 6 3 - - 2Kansas City, Kans. 49 37 5 2 3 2 3Kansas City, Mo. 108 60 23 10 1 3 8Lincoln, Nebr. 26 19 4 1 1 1 -Minneapolis, Minn. 131 95 19 8 4 5 6Omaha, Nebr. 73 58 9 2 2 2 2St. Louis, Mo. 117 77 23 6 4 7 -St. Paul, Minn. 58 46 8 3 1 - 2Wichita, Kans. 113 68 22 8 10 5 1
S. ATLANTIC 1,388 821 307 176 46 36 60Atlanta, Ga. 176 92 49 21 7 7 1Baltimore, Md. 272 158 55 42 8 9 26Charlotte, N.C. 67 47 9 7 2 2 3Jacksonville, Fla. 116 72 22 19 3 - 2Miami, Fla. 116 70 25 15 3 3 2Norfolk, Va. 52 30 12 3 4 3 3Richmond, Va. 67 42 16 6 1 1 3Savannah, Ga. 38 27 6 4 1 - 3St. Petersburg, Fla. 36 27 9 - - - -Tampa, Fla. 159 104 33 17 2 2 11Washington, D.C. 273 146 61 42 15 9 6Wilmington, Del. 16 6 10 - - - -
E.S. CENTRAL 774 497 171 60 21 23 59Birmingham, Ala. 103 59 26 7 4 5 4Chattanooga, Tenn. 92 60 21 6 1 4 8Knoxville, Tenn. 94 73 12 4 5 - 11Lexington, Ky. 69 39 21 5 - 4 4Memphis, Tenn. 182 123 42 12 5 - 22Mobile, Ala. 77 46 15 8 4 4 4Montgomery, Ala. 28 16 8 2 1 1 -Nashville, Tenn. 129 81 26 16 1 5 6
W.S. CENTRAL 1,458 948 280 146 44 40 75Austin, Tex. 53 38 7 5 2 1 5Baton Rouge, La. 60 38 10 10 2 - 3Corpus Christi, Tex. 59 37 16 5 1 - 3Dallas, Tex. 178 105 30 29 4 10 4El Paso, Tex. 77 55 14 4 3 1 5Ft. Worth, Tex. 121 75 23 15 5 3 -Houston, Tex. 322 212 67 27 9 7 29Little Rock, Ark. 66 47 12 4 2 1 2New Orleans, La. 138 93 23 17 3 2 -San Antonio, Tex. 180 118 34 15 8 5 8Shreveport, La. 94 62 19 6 3 4 12Tulsa, Okla. 110 68 25 9 2 6 4
MOUNTAIN 873 597 153 74 32 15 54Albuquerque, N.M. 89 69 12 7 1 - -Colo. Springs, Colo. 53 38 9 4 2 - 4Denver, Colo. 106 80 10 12 2 2 10Las Vegas, Nev. 155 104 26 12 9 3 5Ogden, Utah 29 22 2 3 2 - 1Phoenix, Ariz. 207 119 52 22 8 5 14Pueblo, Colo. 20 19 - 1 - - 4Salt Lake City, Utah 95 56 20 9 5 5 6Tucson, Ariz. 119 90 22 4 3 - 10
PACIFIC 1,703 1,137 320 156 44 43 155Berkeley, Calif. 16 9 4 1 1 1 -Fresno, Calif. 82 49 14 9 6 3 9Glendale, Calif. 17 13 2 2 - - 1Honolulu, Hawaii 74 53 14 5 2 - 11Long Beach, Calif. 64 43 13 5 3 - 15Los Angeles, Calif. 340 232 72 25 7 4 17Pasadena, Calif. 32 19 6 3 - 4 4Portland, Oreg. 123 90 16 9 6 2 4Sacramento, Calif. 153 106 28 14 3 2 22San Diego, Calif. 136 85 21 14 7 9 17San Francisco, Calif. 144 87 30 21 1 3 21San Jose, Calif. 167 110 37 12 1 7 15Santa Cruz, Calif. 21 14 4 3 - - 2Seattle, Wash. 154 97 27 24 3 3 3Spokane, Wash. 67 45 15 3 1 3 5Tacoma, Wash. 113 85 17 6 3 2 9
TOTAL 11,818¶
7,711 2,284 1,148 359 293 671
Reporting Area>65 45-64 25-44 1-24 <1
P&I†
TotalAllAges
All Causes, By Age (Years)
Reporting AreaP&I
†
TotalAllAges
All Causes, By Age (Years)
>65 45-64 25-44 1-24 <1
U: Unavailable -: no reported cases*Mortality data in this table are voluntarily reported from 121 cities in the United States, most of which have populations of 100,000 ormore. A death is reported by the place of its occurrence and by the week that the death certificate was filed. Fetal deaths are notincluded.
†Pneumonia and influenza.§Because of changes in reporting methods in these 3 Pennsylvania cities, these numbers are partial counts for the current week. Completecounts will be available in 4 to 6 weeks.
¶Total includes unknown ages.
TABLE IV. Deaths in 121 U.S. cities,* week endingAugust 10, 1996 (32nd Week)
710 MMWR August 16, 1996

Contributors to the Production of the MMWR (Weekly)
Weekly Notifiable Disease Morbidity Data and 121 Cities Mortality Data
Denise Koo, M.D., M.P.H.
Deborah A. Adams
Timothy M. Copeland
Patsy A. Hall
Carol M. Knowles
Sarah H. Landis
Myra A. Montalbano
Desktop Publishing and Graphics Support
Jolene W. Altman
Morie M. Higgins
Peter M. Jenkins
Vol. 45 / No. 32 MMWR 711

The Morbidity and Mortality Weekly Report (MMWR) Series is prepared by the Centers for Disease Controland Prevention (CDC) and is available free of charge in electronic format and on a paid subscription basisfor paper copy. To receive an electronic copy on Friday of each week, send an e-mail message [email protected]. The body content should read subscribe mmwr-toc. Electronic copy also is availablefrom CDC’s World-Wide Web server at http://www.cdc.gov/ or from CDC’s file transfer protocol server atftp.cdc.gov. To subscribe for paper copy, contact Superintendent of Documents, U.S. Government PrintingOffice, Washington, DC 20402; telephone (202) 512-1800.
Data in the weekly MMWR are provisional, based on weekly reports to CDC by state health departments.The reporting week concludes at close of business on Friday; compiled data on a national basis are officiallyreleased to the public on the following Friday. Address inquiries about the MMWR Series, including materialto be considered for publication, to: Editor, MMWR Series, Mailstop C-08, CDC, 1600 Clifton Rd., N.E., Atlanta,GA 30333; telephone (404) 332-4555.
All material in the MMWR Series is in the public domain and may be used and reprinted withoutpermission; citation as to source, however, is appreciated.
Director, Centers for Disease Control and PreventionDavid Satcher, M.D., Ph.D.
Deputy Director, Centers for Disease Controland PreventionClaire V. Broome, M.D.
Director, Epidemiology Program OfficeStephen B. Thacker, M.D., M.Sc.
Editor, MMWR SeriesRichard A. Goodman, M.D., M.P.H.
Acting Editor, MMWR (weekly)Andrew R. Pelletier, M.D.
Managing Editor, MMWR (weekly)Karen L. Foster, M.A.
Writers-Editors, MMWR (weekly)David C. JohnsonDarlene D. Rumph PersonCaran R. Wilbanks
Editorial Assistant, MMWR (weekly)Teresa F. Rutledge
✩U.S. Government Printing Office: 1996-733-175/47020 Region IV
712 MMWR August 16, 1996