advancing the relief canyon mine
TRANSCRIPT

Advancing the Relief Canyon Mine
Precious Metals Summit Beaver Creek, CO
NASDAQ/TSX:PGLC
September, 2017

2
Cautionary Note Regarding Forward Looking Statements: Statements in this presentation made regarding matters which are not historical facts are “forward looking statements” within the meaning of the U.S. Private Securities Litigation Reform Act of 1995. These statements include the forecasted economics of the Relief Canyon project, including forecasts in the PFS, PEA and Company models; reserve and resource estimates; development and expansion potential (including in the Pershing Pass area); suitability of facilities for future operations; permit modification plans and timing; estimated Capex to bring the project into production; our ability to start production quickly; projected recovery rates; and internal economics and cash cost of the project. Forward looking statements involve risks and uncertainties that could cause actual results to differ materially from those anticipated, targeted or implied including results of future exploration and engineering studies on our Relief Canyon properties; increases in estimates or costs of exploration and other activities; our ability to raise necessary capital to conduct our exploration and other activities and do so on acceptable terms or at all; results from exploration and changes in interpretations of geological, metallurgical or other technical information; problems or delays in permitting or other government approvals; and the matters described in the risk factors identified in our most recent Annual Report on Form 10-K, Quarterly Reports on Form 10-Q and other filings with the United States Securities and Exchange Commission (the "SEC").
Cautionary Note to United States Investors Regarding Estimates of Resources and Reserves: This presentation uses the terms "Measured," "Indicated" and "Inferred" mineral resources, which are defined in Canadian Institute of Metallurgy guidelines, the guidelines widely followed to comply with Canadian National Instrument 43-101-- Standards of Disclosure for Mineral Projects ("NI 43-101"). We advise U.S. investors that these terms are not recognized by the SEC. The estimation of measured and indicated resources involves greater uncertainty as to their existence and economic feasibility than the estimation of proven and probable reserves. Mineral resources are not mineral reserves. Mineral resources that are not mineral reserves do not have demonstrated economic viability. U.S. investors are cautioned not to assume that measured or indicated mineral resources will be converted into reserves. Inferred mineral resources have a high degree of uncertainty as to their existence and their economic and legal feasibility. It cannot be assumed that all or any part of an inferred mineral resource exists, or is economically or legally viable. Under Canadian rules, estimates of "inferred mineral resources" may not form the basis of feasibility studies, pre-feasibility studies or other economic studies, except in prescribed cases, such as in a preliminary economic assessment under certain circumstances.
The Company is a reporting issuer in the United States and is required to discuss mineralization estimates in accordance with US reporting standards. The estimates of proven and probable mineral reserves used in this presentation are in reference to the mining terms defined in the Canadian Institute of Mining, Metallurgy and Petroleum Standards, which definitions have been adopted by NI 43-101. The definitions of proven and probable reserves used in NI 43-101 differ from the definitions in the United States Securities and Exchange Commission's Industry Guide 7. In the United States, a mineral reserve is defined as a part of a mineral deposit, which could be economically and legally extracted or produced at the time the reserve determination is made. Accordingly, information contained in this presentation containing descriptions of our mineral deposits in accordance with NI 43-101 may not be comparable to similar information made public by other U.S. companies under the United States federal securities laws and the rules and regulations thereunder. Moreover, the SEC normally only permits issuers to report mineralization that does not constitute "reserves" as in-place tonnage and grade without reference to unit measures. US investors are urged to consider closely the disclosure in our Form 10-K for the year ended December 31, 2016 and other SEC filings. You can review and obtain copies of these filings from the SEC's website at http://www.sec.gov/edgar.shtml.
Forward-looking Statements

3 1. Based on Relief Canyon Mine PFS, 5/26/17. Assumes $1,250/oz Au 2. Contract-mining, Pre-Tax, 5% discount rate, market capitalization as of 9/12/17
l Cash Cost of $770/oz Au, AISC of $802/oz Au, $23.6MM Initial CAPEX, $22.8MM Sustaining CAPEX, Pre-tax Net Cash Flow of $193MM
l Average LOM production of 93,900 oz Au/year
l Heap leach processing with conveyor stacking of crushed and agglomerated ore
l Potential for multiple re-rating as Relief Canyon Mine approaches production
l ~$145MM NPV at $1,250/oz Au on Relief Canyon Mine alone, PGLC trading at ~$80MM market capitalization2
• 2017 NI 43-101 Reserve Estimate: Proven and Probable, 634,900 oz Au
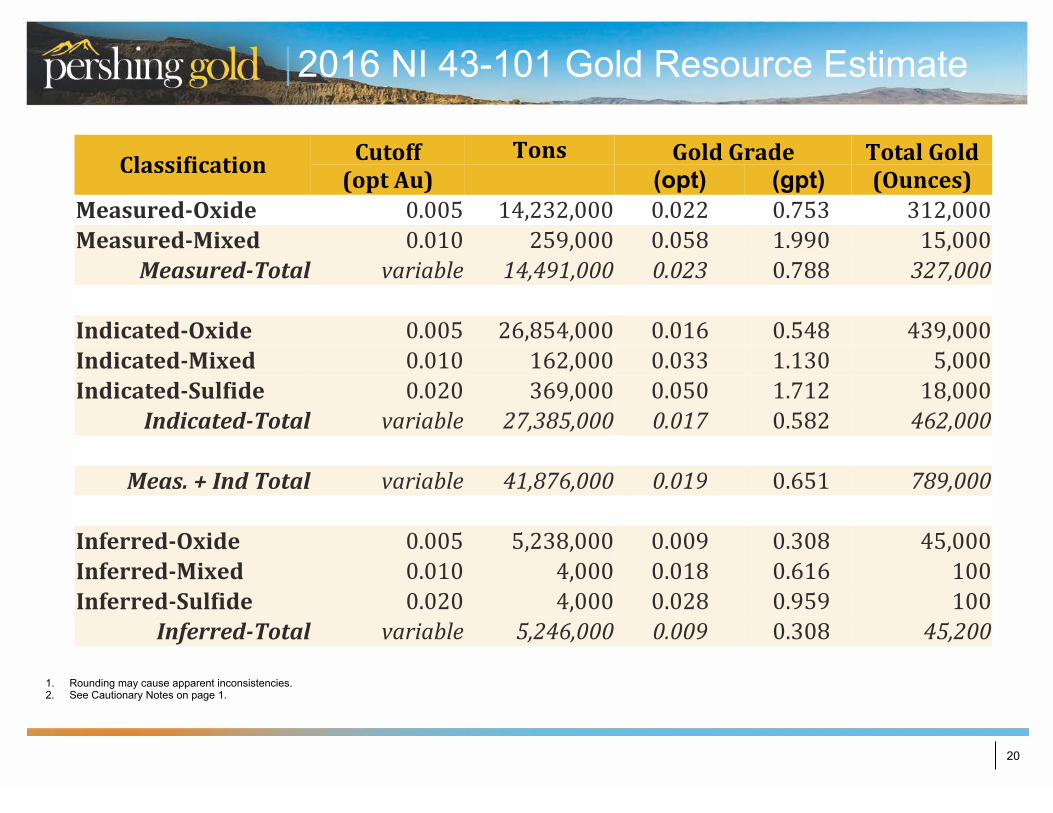
• 2016 NI 43-101 Resource Estimate: Measured and Indicated, 789,000 oz Au, Inferred 45,200 oz Au
l Large and prospective land position with significant exploration potential n Over 25,000 acres of claims with only ~20% that has been explored to date n Located in the Pershing Gold & Silver Trend which has produced over 5.7 M Au equivalent oz
l Strong potential for resource expansion, deposit geologically open to the west, east and south
l The project is the re-start of the Relief Canyon Mine, successfully operated by Pegasus Gold in the 1990’s
l State-of-the-art 21,500 tpd heap-leach production rated facility built in 2011
l ADR plant size can accommodate future growth and process discoveries from satellite deposits n 3,000 gpm capacity and permitted leach pad capacity of 21 million tons
l Relief Canyon is located in Nevada, one of the most productive, lowest risk gold mining jurisdictions in the world
l Outstanding access to support infrastructure with processing facilities, power and water supply in place
Low Risk, Proven Mining Jurisdiction
Growing Resource and Reserve, Significant Exploration Potential
Robust Economics1
Attractively Valued
Investment Highlights
Fully Permitted Processing Facility

4 Source: Nevada Bureau of Mines and Geology, SNL 1. Equivalence calculated at current street consensus long-term prices of gold ($US 1,200) and silver (US$18)
Located in a low risk, highly prospective historic mining district
Situated in a Proven Mining Jurisdiction
l Nevada is ranked the 4th most mining friendly jurisdiction in the world (Fraser Institute) n Stable tax regime n Robust legal framework n Streamlined permitting process n Unparalleled access to qualified labor n Nearby infrastructure
l Large gold mining industry n 23 major gold mines n 5 M oz Au produced annually n >218 M oz Au have been mined since 1859
l Relief Canyon Mine is situated at the southern edge of the Pershing Gold & Silver Trend along the Humboldt Range n The city of Lovelock lies ~19 miles by road west-southwest
of the property and had an estimated population of 1,987 in 2013
n ~95 miles northeast of Reno, Nevada
Pershing Gold & Silver Trend has yielded over 5.7 million gold equivalent ounces

5
Prospects for New Discoveries
New Discovery Potential through Exploration of 25,000 acre Land Package
l Grew land position from 1,100 to ~25,000 acres
l Control all land in and around mine site and priority exploration targets
l Significant exploration upside for new discoveries at Pershing Pass

6 Assumes $1,250/oz Au * Company Model includes inferred resources.
Relief Canyon Highlights
Decreased Risk l Low CAPEX l Low Cash Cost l Low AISC
Increased Upside l High Leverage to Gold Price l High NPV l High Net Cash Flow
PEA PFS CompanyModel*
Lifeofmine(“LOM”) 5.8years 5.6years 5.6years
AverageLOMproduction 88,500ozAu/year 93,900ozAu/year 97,100ozAu/year
CashCost $772/ozAu $770/ozAu $769/ozAuAISC $804/ozAu $802/ozAu $801/ozAuInitialCAPEX $12.2million $23.6million $23.6millionSustainingCAPEX $16.6million $22.8million $22.8millionWorkingCapital $14.9million $11.0million $11.1millionPre-taxNPV,5% $159million $145million $151millionPre-taxIRR 125% 89% 91% Pre-taxNetCashFlow $206million $192.7million $201millionAfter-taxNPV,5% $121million $126million $131millionAfter-taxIRR 109% 85% 87%* After-taxNetCashFlow $157.6million $167.7million $174.1million
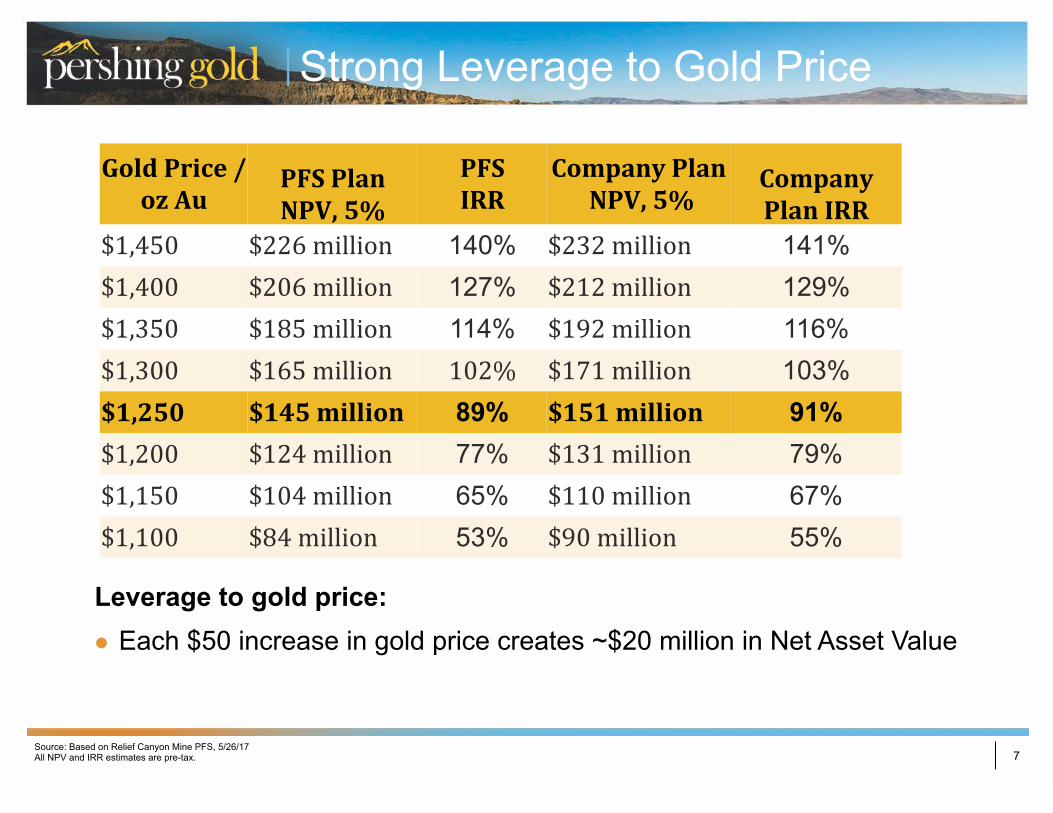
7 Source: Based on Relief Canyon Mine PFS, 5/26/17 All NPV and IRR estimates are pre-tax.
Strong Leverage to Gold Price
Leverage to gold price: l Each $50 increase in gold price creates ~$20 million in Net Asset Value
GoldPrice/ozAu
PFSPlanNPV,5%
PFSIRR
CompanyPlanNPV,5%
CompanyPlanIRR
$1,450 $226million 140% $232million 141% $1,400 $206million 127% $212million 129% $1,350 $185million 114% $192million 116% $1,300 $165million 102% $171million 103% $1,250 $145million 89% $151million 91% $1,200 $124million 77% $131million 79% $1,150 $104million 65% $110million 67% $1,100 $84million 53% $90million 55%

8 Source: BMO Gold Pages, Small Producers and Project Developers, 9/8/17 and Relief Canyon Mine PFS, 5/26/17 Assumes 5% discount rate and ~$1,350/oz Au
Peer Comparison: Share Price to NPV/Share
0.0x
0.2x
0.4x
0.6x
0.8x
1.0x
1.2x
Continental G
old
Lundin Gold
New
Castle G
old
Orezone G
old
Pretium
Resources
TMA
C R
esources
Victoria Gold
Alio G
old
Argonaut G
old
Klondex M
ines
Mandalay R
esources
Prim
ero Mining
Roxgold
Pershing G
old
.4x

9 Source: SNL US and Canadian open pit, heap leach operations with 50,000-200,000 estimated LOM average production Relief Canyon Mine PFS, 5/26/17
Peer Comparison: Low Initial CAPEX
$24M
$-
$100
$200
$300
$400
$500
$600
$700
$800
Rackla
Copper K
ing
Robertson
Talapoosa
Dingm
an
Cam
eron
Monum
ent Bay
Gold B
ar
Long Valley
Mount H
amilton
Colum
bia
Hasbrouck
Soledad M
ountain
Goldfield
Goliath
Moose R
iver
Relief C
anyon
Sleeper
Long Canyon
Golden S
umm
it
Goldfields
South A
rturo
Hosco
North B
ullfrog
Imperial
Golden B
ear
Haile
Farley Lake
Black Fox
Freegold Mountain
Duparquet
Converse
Castle M
ountain
Coffee
Spanish M
ountain
Dublin G
ulch
Back R
iver
Ruby H
ill
Initial Capital Expense ($M)

10 Source: SNL US and Canadian open pit, heap leach operations with 50,000-200,000 estimated LOM average production Relief Canyon Mine PFS, 5/26/17
Peer Comparison: High IRR
0%
10%
20%
30%
40%
50%
60%
70%
80%
90%
100%
Rackla
Copper K
ing
Robertson
Talapoosa
Cam
eron
Monum
ent Bay
Gold B
ar
Long Valley
Mount H
amilton
Colum
bia
Hasbrouck
Soledad M
ountain
Goldfield
Goliath
Moose R
iver
Relief C
anyon
Sleeper
Long Canyon
Golden S
umm
it
Goldfields
South A
rturo
Hosco
North B
ullfrog
Imperial
Golden B
ear
Haile
Farley Lake
Black Fox
Freegold Mountain
Duparquet
Converse
Castle M
ountain
Coffee
Spanish M
ountain
Dublin G
ulch
Back R
iver
Pre-Tax IRR %
89%

11
Opportunity for Resource Expansion
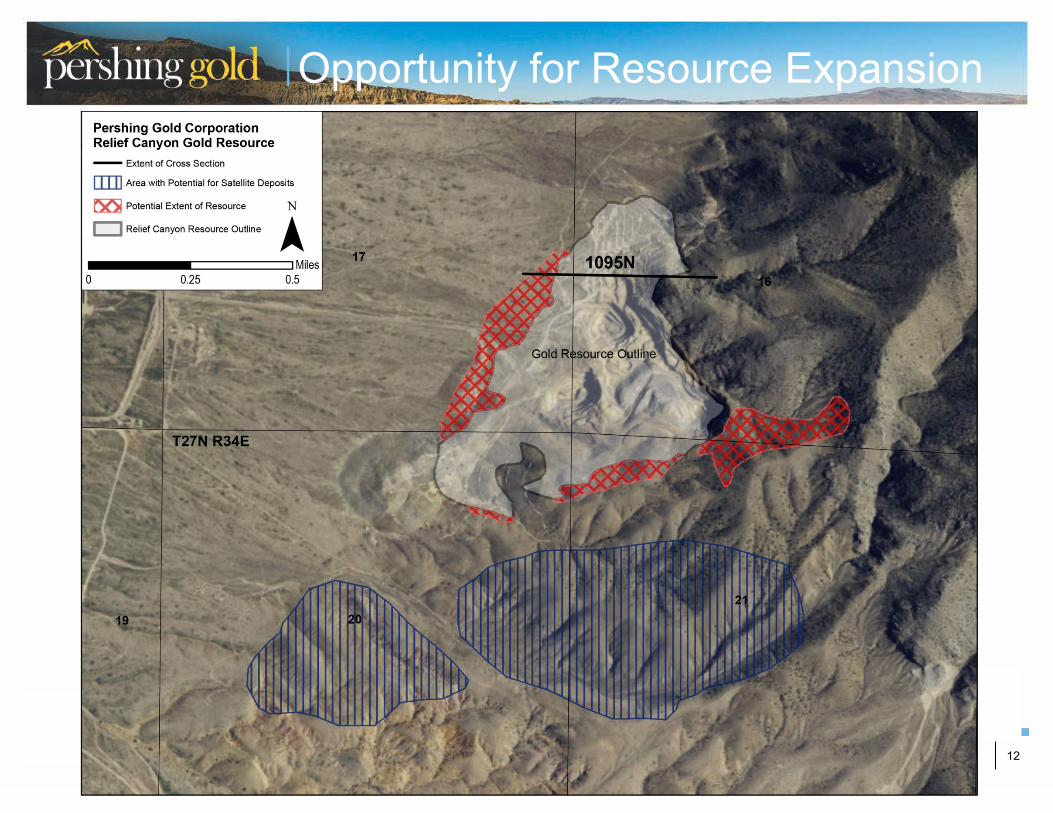
12
Opportunity for Resource Expansion

13
Cross Section 1095N

14
Pershing Pass Exploration

15
Fully permitted processing facility with key infrastructure in place and short timeline to production
Relief Canyon Mine and Processing Facility
Open Pits
Processing Facility
Historic Leach Pads
Permitted Leach Pads
Low-grade Stockpile
Mine Office
Crusher
Haul Road
Overflow Ponds
Future Waste Rock Dump

16
Fully Permitted Processing Facility
Fully Permitted Mine and Processing Facility with Key Infrastructure in Place
l State-of-the-art 21,500 tpd heap-leach production rated facility built in 2011
l Leach pads: permitted 21 million ton capacity, ¼ currently built
l ADR plant: 3,000 gpm capacity
l Can accommodate growth of deposit
l Ideally situated to process satellite deposits
Carbon Stripping System Crushing Facility

17
Extensive Metallurgical Test Work
l ~99% of resource is oxide l Amenable to heap leach
processing l ~83% average gold recovery for
crushed and agglomerated material
l Single-stage-crushing to 80% minus three inch
l Crushing plant annual capacity of 6 million tons Heap leach barren solution
return tank (right) Carbon acid wash system (left)

18
Fast-track Permitting Opportunity
Fully permitted mine and processing facility with sequential and seamless permitting strategy to expand mineable area
North Pit (Facing North)
l All permits in hand to start production and mine through Phase I l New Secretarial Order requires BLM to complete EIS process in one year
n Relief Canyon Phase II expansion is an ideal project for a one-year EIS l No sage grouse habitat or other sensitive environmental issues l Permit modification to expand and deepen the pit is in preparation
n Environmental baseline and engineering studies underway l Sequential permitting allows simultaneous Phase I mining while permitting Phase II l Processing facility fully permitted and ready to operate

19
1. Rounding may cause apparent inconsistencies. 2. See Cautionary Notes on page 1. 3. Silver is modeled for approximately 50% of resource due to incomplete silver assay coverage in historic drilling.
2017 NI 43-101 Reserve Estimate
ClassiGicationCutoff Tons GoldGrade TotalGold(optAu) 000's (opt) (gpt) (Ounces)
Proven 0.005 13,095,419 0.024 0.822 308,467Probable 0.005 17,434,254 0.019 0.651 326,478
Proven&Probable 30,529,673 0.021 0.719 634,944
ClassiGication Tons SilverGrade TotalSilver 000's (opt) (gpt) (Ounces)
Proven 4,123,930 0.095 3.253 391,273Probable 10,268,582 0.121 4.144 1,241,341
Proven&Probable 14,392,513 0.113 3.87 1,632,615
20
1. Rounding may cause apparent inconsistencies. 2. See Cautionary Notes on page 1.
2016 NI 43-101 Gold Resource Estimate
ClassiGication Cutoff Tons GoldGrade TotalGold(optAu) (opt) (gpt) (Ounces)
Measured-Oxide 0.005 14,232,000 0.022 0.753 312,000Measured-Mixed 0.010 259,000 0.058 1.990 15,000
Measured-Total variable 14,491,000 0.023 0.788 327,000
Indicated-Oxide 0.005 26,854,000 0.016 0.548 439,000Indicated-Mixed 0.010 162,000 0.033 1.130 5,000Indicated-SulGide 0.020 369,000 0.050 1.712 18,000
Indicated-Total variable 27,385,000 0.017 0.582 462,000
Meas.+IndTotal variable 41,876,000 0.019 0.651 789,000
Inferred-Oxide 0.005 5,238,000 0.009 0.308 45,000Inferred-Mixed 0.010 4,000 0.018 0.616 100Inferred-SulGide 0.020 4,000 0.028 0.959 100
Inferred-Total variable 5,246,000 0.009 0.308 45,200

21
1. Rounding may cause apparent inconsistencies. 2. See Cautionary Notes on page 1.
2016 NI 43-101 Silver Resource Estimate
ClassiGication Tons SilverGrade TotalSilver(opt) (gpt) (Ounces)
Measured-Oxide 10,550,000 0.119 4.075 1,260,000
Measured-Mixed 259,000 0.251 8.600 65,000Measured-Total 10,809,000 0.123 4.212 1,325,000
Indicated-Oxide 6,236,000 0.094 3.219 584,000Indicated-Mixed 162,000 0.206 7.055 33,000Indicated-SulGide 369,000 0.313 10.720 115,000
Indicated-Total 6,767,000 0.108 3.700 732,000
Meas.+IndTotal 17,576,000 0.117 4.007 2,057,000
Inferred-Oxide 781,000 0.066 2.260 52,000Inferred-Mixed 4,000 0.125 4.281 1,000Inferred-SulGide 4,000 0.164 5.616 1,000
Inferred-Total 789,000 0.068 2.323 54,000
22
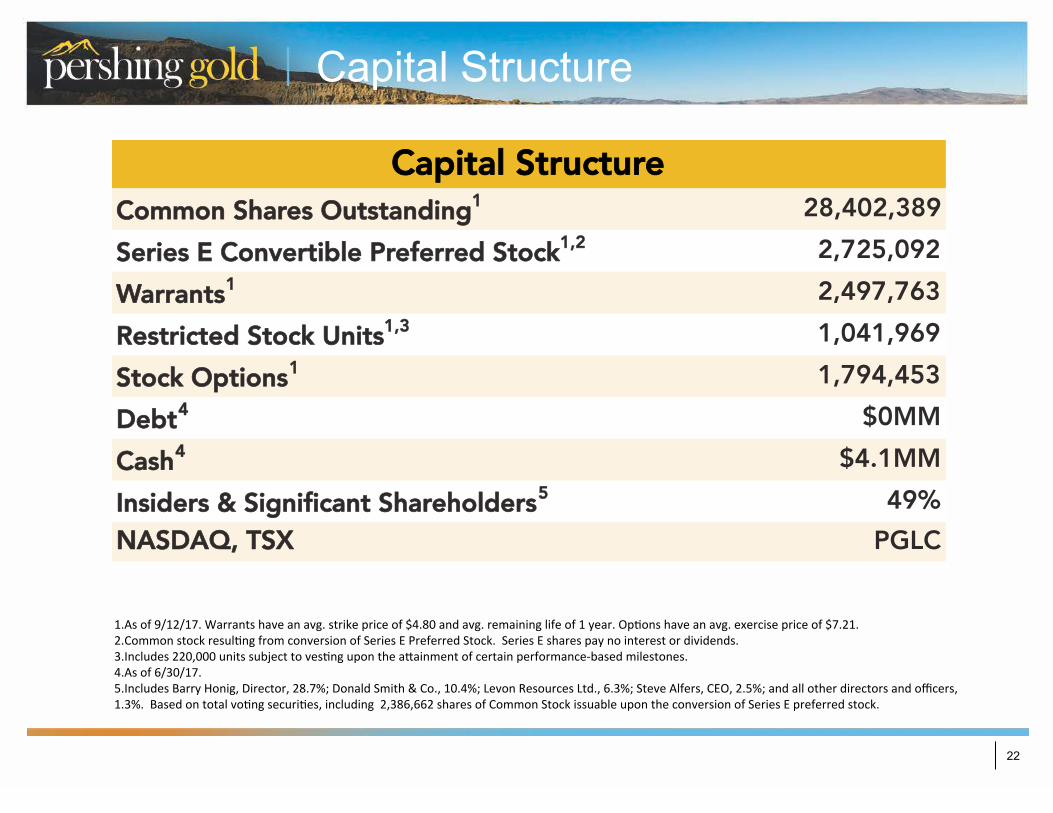
Common Shares Outstanding1 28,402,389Series E Convertible Preferred Stock1,2 2,725,092
Capital Structure
Warrants1 2,497,763Restricted Stock Units1,3 1,041,969Stock Options1 1,794,453Debt4 $0MMCash4 $4.1MMInsiders & Significant Shareholders5 49%NASDAQ, TSX PGLC
Capital Structure
1. Asof9/12/17.Warrantshaveanavg.strikepriceof$4.80andavg.remaininglifeof1year.OpMonshaveanavg.exercisepriceof$7.21.2. CommonstockresulMngfromconversionofSeriesEPreferredStock.SeriesEsharespaynointerestordividends.3. Includes220,000unitssubjecttovesMngupontheaVainmentofcertainperformance-basedmilestones.4. Asof6/30/17.5. IncludesBarryHonig,Director,28.7%;DonaldSmith&Co.,10.4%;LevonResourcesLtd.,6.3%;SteveAlfers,CEO,2.5%;andallotherdirectorsandofficers,1.3%.BasedontotalvoMngsecuriMes,including2,386,662sharesofCommonStockissuableupontheconversionofSeriesEpreferredstock.

23
Shareholder Mix
As of Q3 17
25%
32%
43% Institutional
Insiders
Retail

24
Experienced Leadership
Permi&ng/Regulatory/GovernmentRela4ons/Land&Legal
Opera4ons Explora4on/Geology
Corporate
STEVEALFERSExecu4veChairman,CEO&President- 30+yearsexperienceinminingindustry- FormerlyCEO,NewWestGold&ChiefofUSOperaDons,FrancoNevada- WellknownexecuDveandaGorneyresponsibleformanylandmarkmining
royaltyandpropertytransacDonsworldwide- ProvidedstrategicadviceonLongCanyonlandconsolidaDonand
development,andmanyotherNevadaandinternaDonalprojects
BillHouston–Landman
TimArnold–VP,OperaMons
JerodEastman–ProjectManager
MichaelMarsden–ProcessSupervisor
KurtDavis–Sr.MineEngineer
EarlShortridge–MetallurgicalAdvisor
DougPrihar–ManagerofExploraMon
BobCasaceli–Sr.Geologist
EricAlexander–VP,Finance&ControllerJackPerkins–VP,InvestorRelaMonsMindyjoGermann–CorporateSecretary&HumanResources
Proven Track Record of Discovering and Developing Gold Mines in Nevada
TimJankeChiefOpera4ngOfficer
DebraStruhsackerSeniorVP

25
Board of Directors
STEVE ALFERS Executive Chairman, CEO & President • 30+ years experience in mining industry • Formerly CEO, New West Gold & Chief of US Operations, Franco Nevada Barry Honig Director, Founder • Successful investor with extensive knowledge of capital markets
Ed Karr Director • 20+ years capital markets experience • CEO and Founder, Strategic Asset Management SA
Alex Morrison Director • CPA with 25+ years experience in mining industry • Formerly CFO, Franco Nevada

26
Pershing Gold Corporation 1658 Cole Boulevard, Building 6, Suite 210
Lakewood, CO 80401 720 974-7254
www.pershinggold.com

27
Notes
________________________________________________________________________________________________________________________________________________________________________________________________________________________________________________________________________________________________________________________________________________________________________________________________________________________________________________________

28
Notes
________________________________________________________________________________________________________________________________________________________________________________________________________________________________________________________________________________________________________________________________________________________________________________________________________________________________________________________