advancing the phoenix gold projectphoenix gold project to ......cautionary statement regarding...
TRANSCRIPT
Phoenix Gold ProjectAdvancing the Phoenix Gold Project to Feasibility StudyIn the Prolific Red Lake Gold Camp in Ontario, Canada
Proven LeadershipGeorge Ogilvie, P.Eng. President, CEO, & DirectorNicholas J. Nikolakakis, MBAChief Financial OfficerMichael Willett, P.Eng.Director, ProjectsAllan Candelario, CFADirector, IR & Corporate DevelopmentKevin Canario, CPA, CACorporate Controller
Julian Kemp, BBA, CPA, CA, C.DirChairPeter R. Jones, P.Eng.Independent DirectorDr. David Palmer, PhD, P.Geo.Independent DirectorDaniel Burns, JD, MBA, CPA, CMA, ICD.D., A.C.CIndependent DirectorSasha Bukacheva, MSc., CFAIndependent Director
Fact SheetJanuary 2020
Investor Contact Information:Rubicon Minerals Corporation
Phone +1 (416) 766-2804Email: [email protected]
Twitter: @RubiconMinerals www.rubiconminerals.com
*The 2019 PEA summarized in this presentation is only a conceptual study of the potential viability of the Project’s 2019 Mineral Resource Estimate, and the economic and technical viability of the Project and such mineral resource estimate have not been demonstrated. The 2019 PEA is preliminary in nature and provides only an initial, high-level review of the Project’s potential and design options; there is no certainty that the 2019 PEA will be realized. The 2019 PEA conceptual life of plan and economic model include numerous assumptions and estimates. For more information on the 2019 PEA refer to the technical report entitled “National Instrument 43-101 Technical Report for the Phoenix Gold Project Preliminary Economic Assessment, Cochenour, Ontario” dated September 23, 2019, which is available on SEDAR (www.sedar.com) or on the Company website (www.rubiconminerals.com). The September 23, 2019 technical report and 2019 Mineral Resource Estimate is/are not current and should not be relied upon.
**The 2020 Mineral Resource Estimate is based on 3.0 g/t Au cut-off grade. For more information on the 2020 Mineral Resource Estimate refer to the Rubicon news release dated January 7, 2020, which is available under the Company’s profile on SEDAR (www.sedar.com) or on the Company website (www.rubiconminerals.com). An updated Technical Report for the Project will be filed on www.sedar.com within 45 days from January 7, 2020, and will then supersede the September 23, 2019 technical report referenced in endnote 1. There is no certainty that the Measured and Indicated mineral resource estimates will be converted to the Proven and Probable mineral reserve categories and there is no certainty that the 2020 Mineral Resource Estimate will be realized. There is no guarantee that Inferred mineral resource estimates can be converted to Indicated or Measured mineral resources, or that Indicated or Measured mineral resource estimates will be converted to mineral reserves. Mineral resource estimates that are not mineral reserves do not have demonstrated economic viability, and as such there is no guarantee the Project economics described herein will be achieved. The 2020 Mineral Resource Estimate may be materially affected by environmental, permitting, legal, title, taxation, socio-political, marketing, or other relevant risks, uncertainties and other factors , as more particularly described in the Cautionary Statements at the second page of this presentation.
Building a mid-tier gold company by:
• Advancing the Phoenix Gold Project to commercial production• Grow organically with targets within 2 km of the Phoenix Gold Project• Exploring our vast Red Lake Properties
TSX: RMX | OTCQX: RBYCF
Economics(Base Case):
New PEA Conceptual Project Life of Mine
(“LOM”)
After-tax IRR (“IRR”)(%) 40.2%
After-tax NPV5% (“NPV”)(C$) C$135.2M
Estimated free cash flow (“FCF”) C$191.5M
Exchange rate (C$/US$) 0.7519
LT gold price assumption (US$) US$1,325/oz
LT gold price assumption (C$) C$1,762/oz
Payback period 3.9 years
Initial Capital cost estimates Pre-CP (C$ millions)
Underground development & infrastructure
$43.2
Equipment $16.9
Surface and mill $22.8
Contingency (18%) $18.3
Total Initial Capital $101.2
Capitalized operating costs $45.7
Proceeds from ~44koz gold sales $74.5
Net positive cash flow $28.8
Net Pre-CP Capital $72.4Projected Funding Requirement
(incl. 18% contingency)$80.9
Robust 2019 PEA- EconomicsStrong economics, reasonable capex, based on actual results
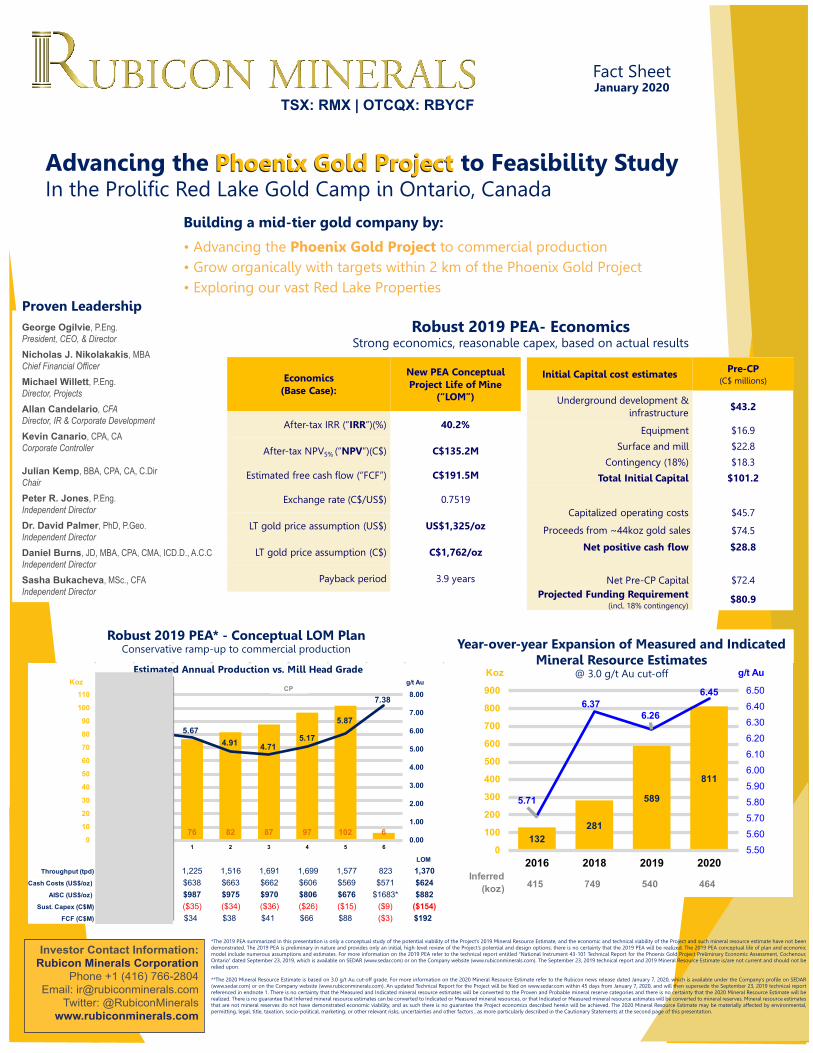
Robust 2019 PEA* - Conceptual LOM PlanConservative ramp-up to commercial production
Koz g/t Au
LOM
Throughput (tpd) 133 670 1,225 1,516 1,691 1,699 1,577 823 1,370Cash Costs (US$/oz) $638 $663 $662 $606 $569 $571 $624
AISC (US$/oz) $987 $975 $970 $806 $676 $1683* $882Sust. Capex (C$M) ($35) ($34) ($36) ($26) ($15) ($9) ($154)
FCF (C$M) ($54) ($18) $34 $38 $41 $66 $88 ($3) $192
Estimated Annual Production vs. Mill Head Grade
0.5 44 76 82 87 97 102 6
4.06
5.915.67
4.91 4.715.17
5.87
7.38
0.00
1.00
2.00
3.00
4.00
5.00
6.00
7.00
8.00
0
10
20
30
40
50
60
70
80
90
100
110
-2 -1 1 2 3 4 5 6
Pre-CP CP
Koz g/t Au
Inferred (koz) 415 749 540 464
132281
589
811
5.71
6.376.26
6.45
5.50
5.60
5.70
5.80
5.90
6.00
6.10
6.20
6.30
6.40
6.50
0
100
200
300
400
500
600
700
800
900
2016 2018 2019 2020
Year-over-year Expansion of Measured and Indicated Mineral Resource Estimates
@ 3.0 g/t Au cut-off
Cautionary Statement regarding Forward-Looking Statements and other Cautionary Notes All statements, other than statements of historical fact, contained or incorporated by reference in or made in giving this presentation and responses to questions, including but not limited to any information as to the future performance of the Company, constitute “forward-looking statements” and “forward looking information” (collectively, “forward-looking statements”) within the meaning of applicable Canadian and United States securities legislation. Generally, these forward-looking statements can be identified by the use of forward-looking terminology such as “amenability”, “anticipates”, “assumption”, “ “confidence”, “believe”, “conceptual”, “contingency”, “contemplate”, “conversion”, “demonstrate”, “drive”, “evaluate”, “estimates”, “expect”, “exploration”, “feasibility”, “forward”, “future”, “goal”, “implications”, “intend”, “IRR”, “LOM”, “may”, “model”, “NPV”, “objective”, “opportunity”, “path”, “PEA”, “plan”, “possibility”, “potential”, “preliminary”, “priority”, “project”, “projected”, “prospective”, “risk”, “sensitivity”, “strategies”, “study”, “target”, “upgrade”, “valuation”, and “will”, or variations of such words, and similar such words, expressions or statements that certain actions, events or results can, could, may, should, will (or not) be achieved or occur in the future. In some cases, forward-looking information may be stated in the present tense, such as in respect of current matters that may be continuing, or that may have a future impact or effect. Forward-looking statements include, but are not limited to, statements regarding mineral resource estimates, mine plans and mine life, the anticipated timing of the delivery and details of an updated technical report and/or Feasibility Study for the Project, the results of the 2019 PEA (including any anticipated economics such as return on capital (including IRR) and NPV, free cash flow, gold production (payable or otherwise), capital and operating costs, taxes payable, life of mine (or LOM), estimated tonnes and grade, underground development meters, mineable inventory, construction period and other results of the 2019 PEA, all of which are estimates only), impact of infrastructure on the economics of the 2019 PEA or any Feasibility Study for the Project, impact of results from the 2018 test trial mining and bulk sampling on the 2019 PEA, the potential tonnage of mineralized material and its grade from the Project (including any Explore Target areas), the impact of the data from the 2019 drilling program completed after September 30, 2019, the potential to improve mineral resource estimates (including expanding the quantity and converting or upgrading the classification) and any further steps necessary to do so (including the anticipated outcome of further drilling of the Project), the anticipated or potential impact of further drilling at the project (including on stope dimensions, future mining, Project economics and the understanding of the structural geology including at depth), mine plans and any potential to move the Project back into production. Forward-looking statements are made as of the date of this presentation based on the expectations, assumptions, opinions and estimates of management as of the date such statements are made, which management considers reasonable, and represent management’s best judgment. If such expectations, assumptions, opinions and estimates prove to be incorrect, actual and future results may be materially different than expressed or implied in the forward-looking statements. Forward-looking statements are subject to a number of known and unknown risks, uncertainties and other factors which may cause Rubicon’s actual results, performance or achievements to be materially different from any future results, performance or achievements expressed or implied by the forward-looking statements. Such factors include, among others: possible variations in mineralization, grade or recovery or throughput rates; uncertainty of mineral resource estimates; inability to realize exploration potential, mineral grades and mineral recovery estimates; actual results of current exploration activities; actual results of reclamation activities; uncertainty of future operations, delays in completion of exploration plans for any reason including insufficient capital, delays in permitting, and labour issues; conclusions of future economic or geological evaluations (including the 2019 PEA and/or any Feasibility Study for the Project); changes in project parameters as plans continue to be refined; failure of equipment or processes to operate as anticipated; accidents and other risks of the mining industry; delays and other risks related to operations; timing, receipt and maintenance of permits and other required regulatory approvals; the ability of Rubicon and other relevant parties to satisfy regulatory requirements; the ability of Rubicon to comply with its obligations under material agreements including financing agreements; the availability of financing for proposed programs and working capital requirements on reasonable terms; the ability of third-party service providers to deliver services on reasonable terms and in a timely manner; risks associated with the ability to retain key personnel; cost of environmental expenditures and potential environmental liabilities; dissatisfaction or disputes with local communities or First Nations; failure of plant, equipment or processes to operate as anticipated; market conditions and general business, economic, competitive, political and social conditions; our ability to generate sufficient cash flow from operations or obtain adequate financing to fund our capital expenditures and working capital needs and meet our other obligations; the volatility of our stock price; the ability of our common stock to remain listed and traded on the TSX; and the “Risk Factors” in the Company’s annual information form dated March 22, 2019 (“2019 AIF”). The foregoing list of assumptions, risks, uncertainties and other factors is not exhaustive. The forward-looking statements contained or incorporated by reference herein are expressly qualified by this cautionary statement as well as those in other continuous disclosure documents of the Company filed under its profile at www.sedar.com including, but not limited to, the Company’s news releases dated August 19, 2019 and January 7, 2020, the 2019 AIF and the endnotes to this presentation. Rubicon disclaims any obligation to update any forward-looking statements, whether as a result of new information, future events or results or otherwise, except as required by applicable securities laws.
Qualified PersonThe content of this corporate presentation relating to geology and exploration has been read and approved by George Ogilvie, P.Eng., President, CEO, and Director, who is a Qualified Person as defined by NI 43-101.Cautionary Note to U.S. Readers Regarding Estimates of Measured, Indicated and Inferred ResourcesThis news release uses the terms “Measured” and “Indicated” Mineral Resources and “Inferred” Mineral Resources. The Company advises U.S. investors that while these terms are recognized and required by the Canadian Securities Administrators, they are not recognized by the United States Securities and Exchange Commission (SEC). The estimation of “Measured” and “Indicated” Mineral Resources involves greater uncertainty as to their existence and economic feasibility than the estimation of Proven and Probable Reserves. The estimation of “Inferred” Mineral Resources involves far greater uncertainty as to their existence and economic viability than the estimation of other categories of Mineral Resources. It cannot be assumed that all or any part of a “Inferred”, “Measured”, or “Indicated” Mineral Resource estimate will ever be upgraded to a higher category.Under Canadian rules, estimates of “Inferred Mineral Resources” may not form the basis of feasibility studies, pre-feasibility studies or other economic studies, except in prescribed cases, such as in a preliminary economic assessment (or New PEA) under certain circumstances. The SEC normally only permits issuers to report mineralization that does not constitute “Reserves” as in-place tonnage and grade without reference to unit measures. Under U.S. standards, mineralization may not be classified as a “Reserve” unless the determination has been made that the mineralization could be economically and legally produced or extracted at the time the Reserve determination is made. U.S. investors are cautioned not to assume that any part or all of a “Inferred”, “Measured” or “Indicated” Mineral Resource exists or is economically or legally mineable. Information concerning descriptions of mineralization and Mineral Resources contained herein may not be comparable to information made public by U.S. companies subject to the reporting and disclosure requirements of the SEC.
Rahill-Bonanza(PG/G)
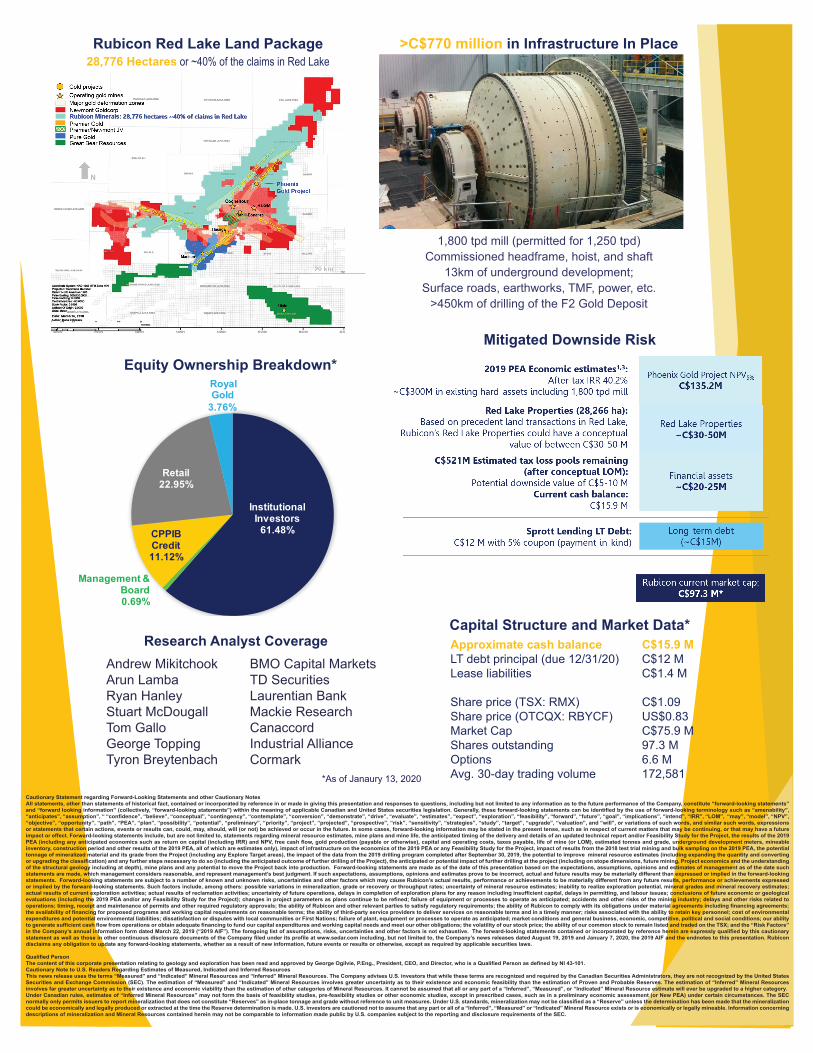
Rubicon Red Lake Land Package28,776 Hectares or ~40% of the claims in Red Lake
McCuaig(RMX)
Capital Structure and Market Data*Approximate cash balance C$15.9 MLT debt principal (due 12/31/20) C$12 MLease liabilities C$1.4 M
Share price (TSX: RMX) C$1.09Share price (OTCQX: RBYCF) US$0.83Market Cap C$75.9 MShares outstanding 97.3 MOptions 6.6 MAvg. 30-day trading volume 172,581
Andrew Mikitchook BMO Capital MarketsArun Lamba TD SecuritiesRyan Hanley Laurentian BankStuart McDougall Mackie ResearchTom Gallo CanaccordGeorge Topping Industrial AllianceTyron Breytenbach Cormark
Research Analyst Coverage
Equity Ownership Breakdown*
*As of Janaury 13, 2020
Mitigated Downside Risk
Rubicon current market
Institutional Investors
61.48%
Management & Board0.69%
CPPIBCredit11.12%
Retail 22.95%
Royal Gold
3.76%
>C$770 million in Infrastructure In Place
1,800 tpd mill (permitted for 1,250 tpd)Commissioned headframe, hoist, and shaft
13km of underground development;Surface roads, earthworks, TMF, power, etc.
>450km of drilling of the F2 Gold Deposit