advancing health equity - home | mnaap
TRANSCRIPT

ADVANCING HEALTH EQUITY: THE CENTRAL CHALLENGE FOR MINNESOTA
Edward P. Ehlinger, MD, MSPH Commissioner Minnesota Department of Health June 13, 2014

Disclosures
I have no relevant financial relationships with the manufacturers(s) of any commercial products(s) and/or provider of commercial services discussed in this CME activity. I do not intend to discuss an unapproved/investigative use of a commercial product/device in my presentation.
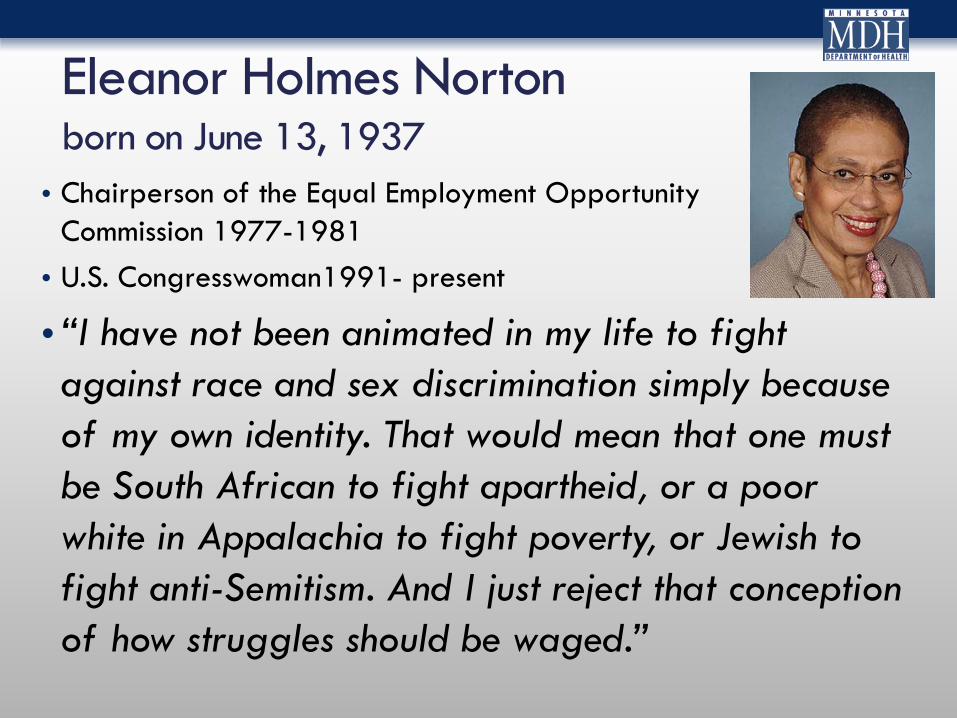
Eleanor Holmes Norton born on June 13, 1937
• Chairperson of the Equal Employment Opportunity Commission 1977-1981
• U.S. Congresswoman1991- present
• “I have not been animated in my life to fight against race and sex discrimination simply because of my own identity. That would mean that one must be South African to fight apartheid, or a poor white in Appalachia to fight poverty, or Jewish to fight anti-Semitism. And I just reject that conception of how struggles should be waged.”

June 13,1967 – Thurgood Marshall nominated as 1st black Supreme Court justice
“In recognizing the humanity of our fellow beings, we pay ourselves the highest tribute.”


What is health? • "Health is a state of complete physical,
mental and social well-being and not merely
the absence of disease or infirmity.“ WHO 1948
• “Health is a resource for everyday life, not
the objective of living. Health is a positive
concept emphasizing social and personal
resources, as well as physical capacities." Ottawa Charter for Health 1986

Community Indicators for Health and Quality of Life

Minnesota Is a Healthy State
Source: United Health Foundation
0
1
2
3
4
5
6
7
1998 1999 2000 2001 2002 2003 2004 2005 2006 2007 2008 2009 2010 2011 2012 2013
Minnesota’s State Health Ranking

Health of MN Seniors Ranked #1 1. Minnesota 0.796 2. Vermont 0.592 3. New Hampshire 0.548 4. Massachusetts 0.542 5. Iowa 0.533 6. Hawaii 0.500 7. Connecticut 0.483 8. Colorado 0.475 9. Utah 0.402 10. Maryland 0.394
41. Tennessee -0.376 42. Nevada -0.394 43. Georgia -0.451 44. Alabama -0.499 45. Kentucky -0.537 46. Arkansas -0.603 47. West Virginia -0.621 48. Louisiana -0.702 49. Oklahoma -0.801 50. Mississippi -0.885

Life Expectancy at Birth – #2 Male life expectancy - #1 Female life expectancy - #2

MN has 6th longest length of life after age 65
1. Hawaii 2. Florida 3. California
4. Arizona 5. Connecticut 6. Minnesota

MN Infant Mortality Rate is Best in the US

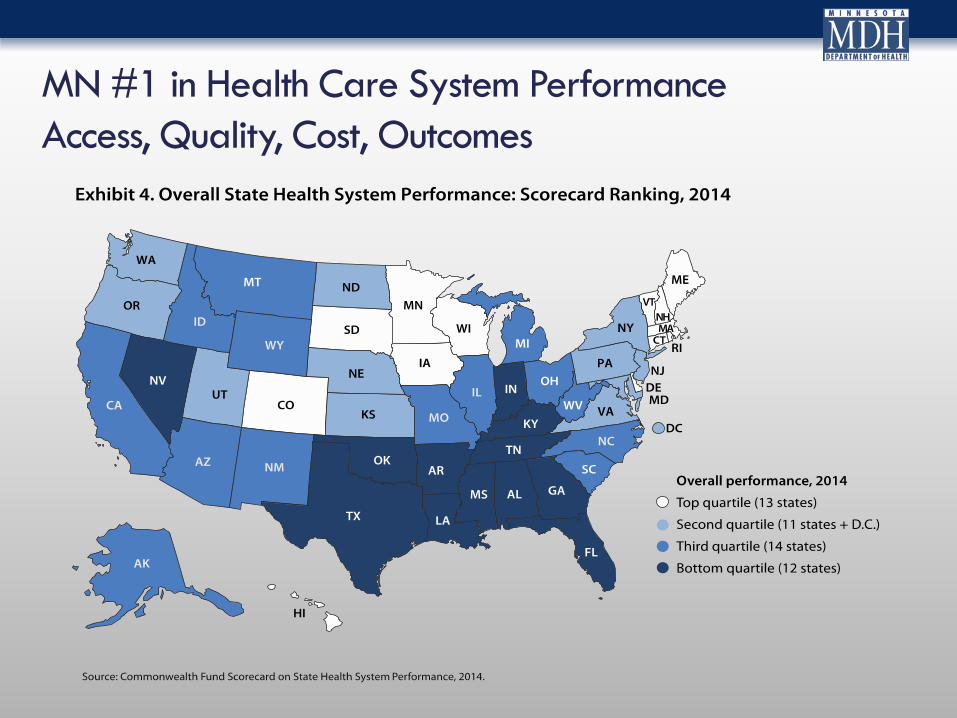
MN #1 in Health Care System Performance Access, Quality, Cost, Outcomes

Excess Black Deaths* by Gestational Age
26% 16% 18% 63%
88% 137%
38% 17%
26% 47%
33%
20%
58%
58%
35%
43%
74% 42%
-1.00
-0.50
0.00
0.50
1.00
1.50
2.00
2.50
OH MI IN IL WI MN^ Total
Exce
ss D
eath
s pe
r 1,
000 due to gestational age
distribution
due to higher mortality among preterm infants
due to higher mortality among term infants
* Compared to All Other Regions ^ US-born Black mothers Ashley Schempf Hirai, PhD, MCHB
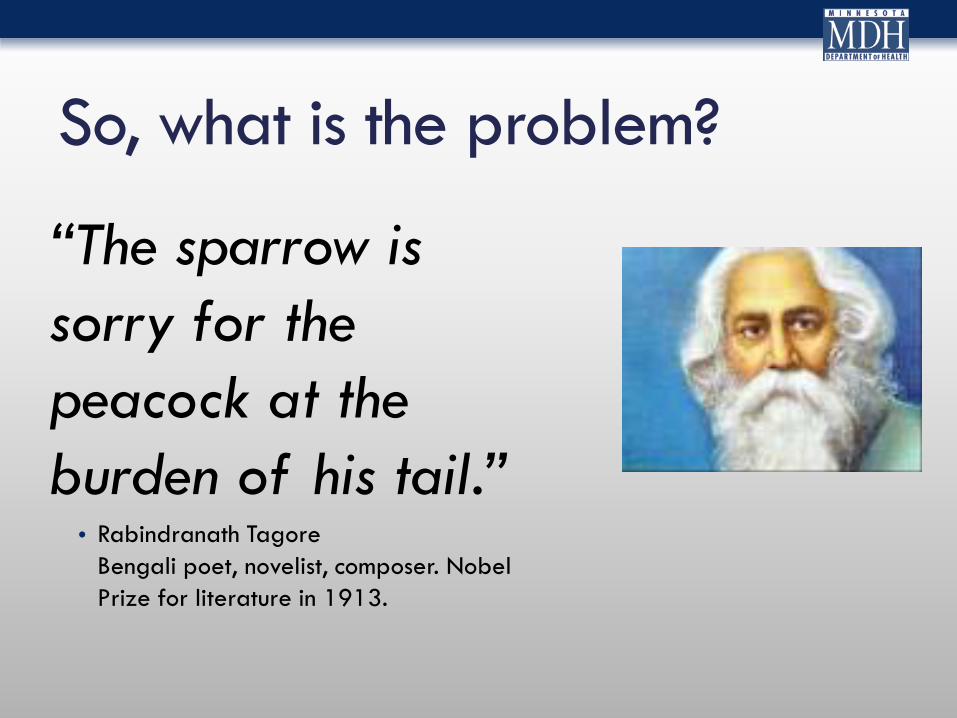
So, what is the problem?
“The sparrow is sorry for the peacock at the burden of his tail.”
• Rabindranath Tagore Bengali poet, novelist, composer. Nobel Prize for literature in 1913.

Minnesota! Where the women are strong, The men are good looking, And all our health statistics are above average – Unless you are a person of color or an American Indian.

Advancing Health Equity Report February 1, 2014
“…the opportunity to be healthy is not equally available everywhere or for everyone in the state.”
Advancing Health Equity in Minnesota

Life Expectancy in Twin Cities
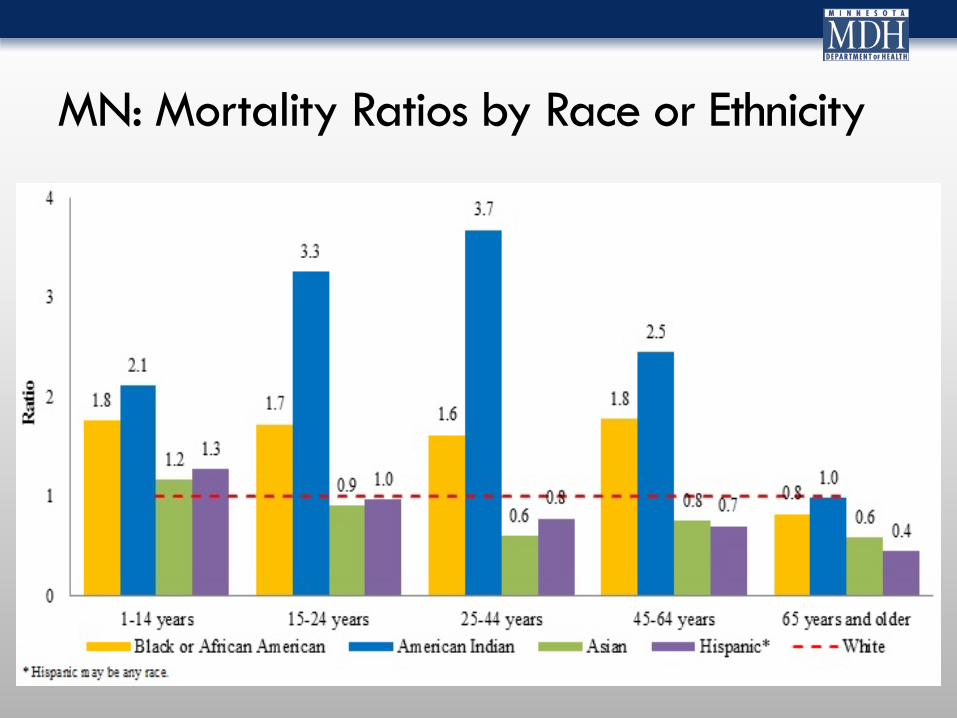
MN: Mortality Ratios by Race or Ethnicity

Black Infant Mortality
12.55
14.54 14.86 14.47 13.64 14.07
11.04
14.07
0.0
2.0
4.0
6.0
8.0
10.0
12.0
14.0
16.0
All Other OH MI IN IL WI MN Total
Dea
ths
per 1
,000
Regions Region V
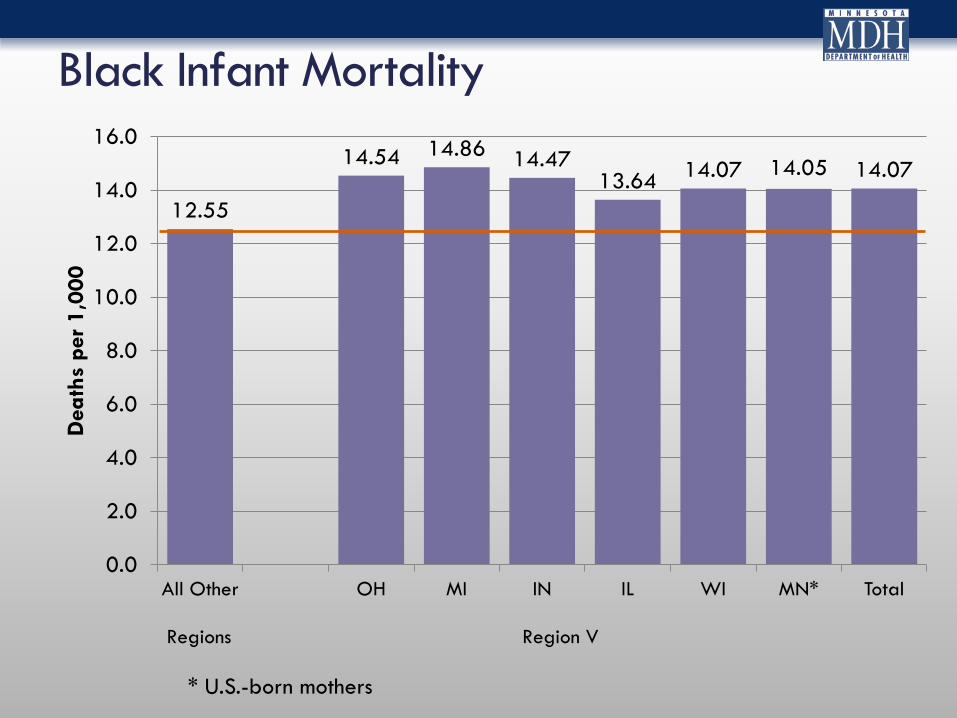
Black Infant Mortality
12.55
14.54 14.86 14.47 13.64 14.07 14.05 14.07
0.0
2.0
4.0
6.0
8.0
10.0
12.0
14.0
16.0
All Other OH MI IN IL WI MN* Total
Dea
ths
per 1
,000
Regions Region V
* U.S.-born mothers

Infant Mortality Black-White Disparity in MN is one of the highest in the US
7.14
8.24 8.94
8.01 8.14 8.71
9.45
8.28
0.00 1.00 2.00 3.00 4.00 5.00 6.00 7.00 8.00 9.00
10.00
All Other OH MI IN IL WI MN* Total
Dea
ths
per 1
,000
Regions Region V
Rate Ratio 2.32 2.31 2.51 2.24 2.48 2.63 3.05 2.43 Population Attributable Fraction 16% 18% 22% 13% 20% 14% 11% 18% *US-born Black mothers

Congenital hearing loss
120
66
0
50
100
150
Baby of black mother
Baby of white mother
Days to Diagnosis
37
64
0
20
40
60
80
Baby of black mother Baby of white mother
Percent Diagnosed within 3 months
71 61
51
0
20
40
60
80
Child of black mother
Child of Asian mother
Child of white mother
Median days to hearing aid fitting

Uninsurance Rates in Minnesota by Race
7.6
18.8
5.7
20.2
0
5
10
15
20
25
White Non White
2011 2013

Source: mncompass.org
Why is advancing health equity important?
36%
17%
24%
0% 5%
10% 15% 20% 25% 30% 35% 40% 45% 50%
1960 1970 1980 1990 2000 2010
Percent Of Color 1960-2010
U.S. MN Twin Cities
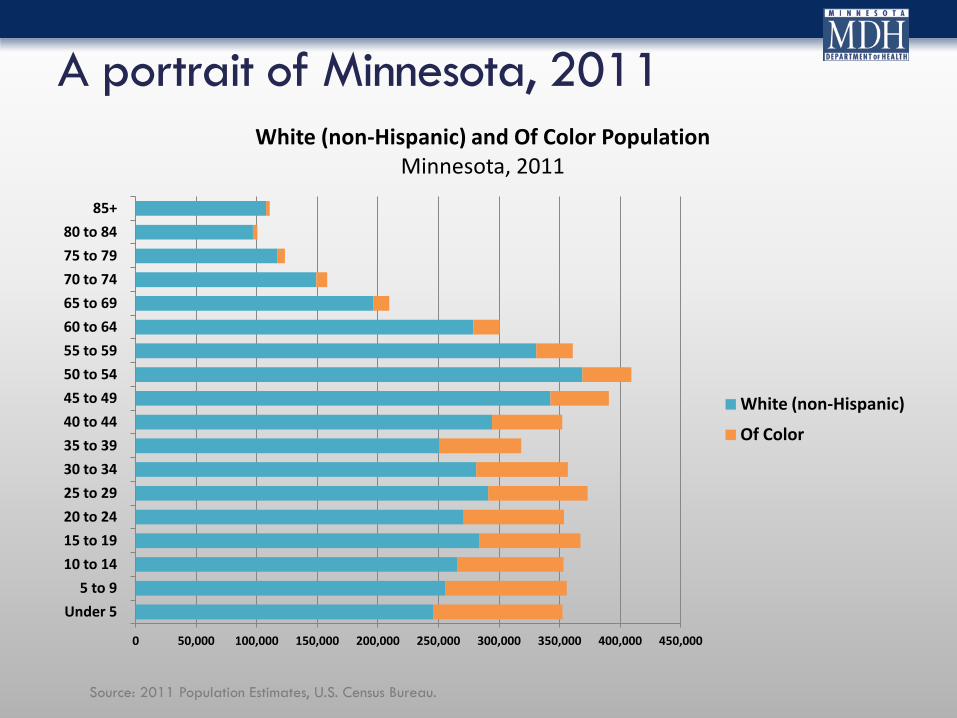
A portrait of Minnesota, 2011
0 50,000 100,000 150,000 200,000 250,000 300,000 350,000 400,000 450,000
Under 5 5 to 9
10 to 14 15 to 19 20 to 24 25 to 29 30 to 34 35 to 39 40 to 44 45 to 49 50 to 54 55 to 59 60 to 64 65 to 69 70 to 74 75 to 79 80 to 84
85+
White (non-Hispanic) and Of Color Population Minnesota, 2011
White (non-Hispanic)
Of Color
Source: 2011 Population Estimates, U.S. Census Bureau.

Social and Economic
Factors 40%
Health Behaviors
30%
Clinical Care 10%
Physical Environment
10%
Genes and Biology
10%
What Creates Health?


Well being increases as economic well being increases

74.1 77.3 79.6 80.7 82.5
50.0
70.0
90.0
Less than $35,000
$35,000 to $44,999
$45,000 to $59,999
$60,000 to $74,999
$75,000 or more
Life
exp
ecan
ty in
Yea
rs
Life expectancy by median household income group of ZIP codes, Twin Cities
1998-2002
Source: The unequal distribution of health in the Twin Cities, Wilder Research www.wilderresearch.org Analyses were conducted by Wilder Research using 1998-2002 mortality data from the Minnesota Department of Health and data from the U.S. Census Bureau (population, median household income, and poverty rate by ZIP code
26.8
14.9 10.0
6.4 3.1
11.7
0.0
10.0
20.0
30.0
40.0
50.0
Less $20,000
$20 to $34,999
$35 to $49,999
$50 to $79,999
$75,000 or more
DK - refused
Perc
ent
Adults 18-64 reporting "fair" or "poor" health status by income, Minnesota 2011
Source: 2011 Behavioral Risk Factor Surveillance System

Personal Behaviors Attributable Causes of Death
Tobacco 42%
Diet/Physical Activity 35%
Alcohol 9%
Microbial Agents 7%
Toxic Agents 5%
Firearms 2%
Tobacco
Diet/Physical Activity
Firearms
Each year in the United States: $15.3 Billion is spent marketing tobacco $6 Billion is spent marketing alcohol $2.9 Billion is spent marketing soda (by just 1 company)

World Health Organization Commission on Social Determinants of Health
Commission on Social Determinants of Health. (2010). A conceptual framework for action on the social determinants of health. Geneva: World Health Organization.

74 75 73
76
57
49
70 69
59
65 64
1.2 1.2 1.2 1.2
1.4
1.7
1.3 1.3 1.4
1.4 1.4
0.0
0.5
1.0
1.5
2.0
2.5
3.0
3.5
4.0
0
10
20
30
40
50
60
70
80
IL IN IA MD MI MN NE NJ OH PA WI
Whi
te/B
lack
Disp
arity
Rat
io
Gra
duat
ion
Rate
Big Ten States
Four Year High School Graduation, SY 2010-2011
Black White/Black Disparity Ratio
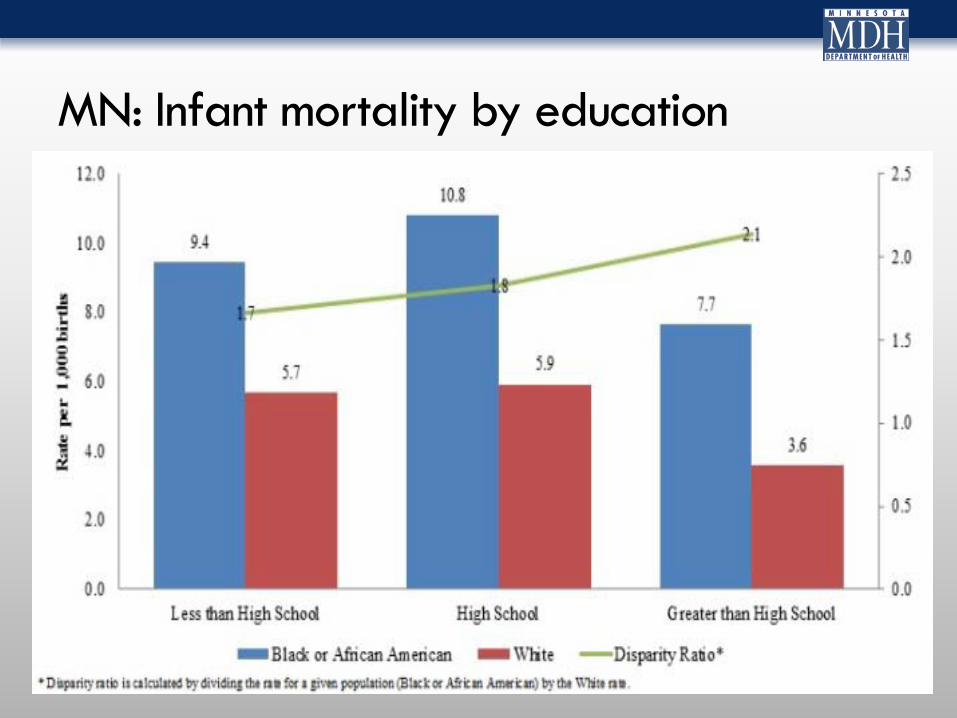
MN: Infant mortality by education

32.0 32.9
35.5
16.3
36.4 37.8
34.2
20.7
35.6
29.5
38.2
28.1
3.0 2.6 3.1 2.3 2.7
4.3 3.2 2.6 2.8 2.8
3.6
0.0
5.0
10.0
15.0
20.0
25.0
30.0
35.0
40.0
45.0
IL IN IA MD MI MN NE NJ OH PA WI US
Perc
ent B
elow
Pov
erty
Big Ten States
Poverty, 2012 ACS
Black US Black Black/White Disparity Ratio

Infants and Toddlers in Poverty
49%
55%
21%
27%
11%
18%
African American American Indian Asian/Pacific Islander
Hispanic White All
Minnesota Department of Health (2014). The Earliest Opportunities Matter
(Children 0-36 months living at or below 100% Federal Poverty Guidelines 2009-2011)

Eleanor Holmes Norton born on June 13, 1937
“Men without jobs do not form families.”
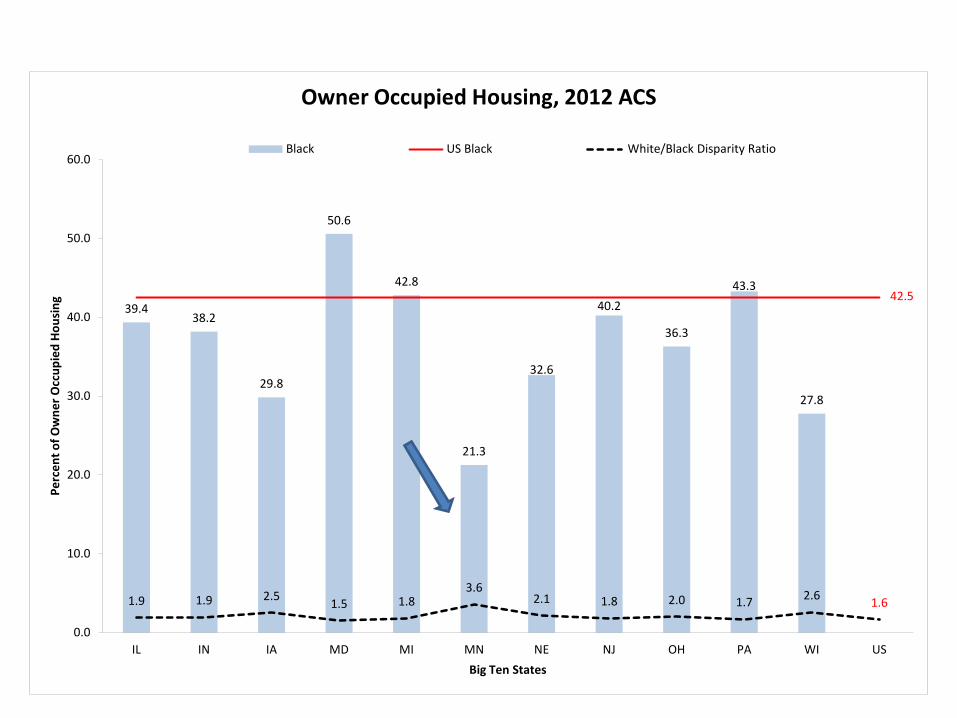
39.4 38.2
29.8
50.6
42.8
21.3
32.6
40.2
36.3
43.3
27.8
42.5
1.9 1.9 2.5 1.5 1.8 3.6
2.1 1.8 2.0 1.7 2.6 1.6
0.0
10.0
20.0
30.0
40.0
50.0
60.0
IL IN IA MD MI MN NE NJ OH PA WI US
Perc
ent o
f Ow
ner O
ccup
ied
Hous
ing
Big Ten States
Owner Occupied Housing, 2012 ACS
Black US Black White/Black Disparity Ratio

Housing
Minnesota Department of Health (2014). The Earliest Opportunities Matter
(Infants and toddler 0-36 months living in households that spend more than 20 percent of their income on housing costs 2009-2010.)
72%
55% 48%
22%
49%
22%
African American Foreign Born African American
American Indian Asian Hispanic White

Health Equity is a Social Justice Issue Health Equity is a Public Health Issue
• “The philosophy behind science is to discover truth.
• The philosophy behind medicine is to use that truth for the benefit of your patient.
• The philosophy behind public health is social justice.”
• William Foege

What’s the problem in Minnesota?
Commission on Social Determinants of Health. (2010). A conceptual framework for action on the social determinants of health. Geneva: World Health Organization.
Disparities in Minnesota • Disparities are not just because of lack of access to health care or to poor individual choices.
• Disparities are mostly the result of policy decisions that systematically disadvantage some populations over others. • Especially, populations of color and American Indians, GLBT, and low income
• Structural Racism

Structural/Institutional Racism
•Structural racism is the normalization of an array of dynamics — historical, cultural, institutional and interpersonal — that routinely advantage white people while producing cumulative and chronic adverse outcomes for people of color and American Indians.

June 13,1967 – Thurgood Marshall nominated as 1st black Supreme Court justice
• “A child born to a Black mother in a state like Mississippi... has exactly the same rights as a white baby born to the wealthiest person in the United States. It's not true, but I challenge anyone to say it is not a goal worth working for.”

Geoffrey Vickers definition of public health •“The landmarks of political, economic, and social history are the moments when some condition passed from the category of the given into the category of the intolerable. I believe that the history of public health might well be written as a record of successive re-definings of the unacceptable.”

Healthy Minnesota 2020
All people in Minnesota enjoy healthy lives and healthy communities.
Minnesota’s vision for health
Health Equity must start in communities and with our children.

Advancing health equity is not about averages It’s about creating opportunities to be healthy

Health/health equity is a community effort
Attitudes
Values Culture
Norms
Laws
...isms
Policies
If we are not all healthy together, none of us is as healthy as we could be.

Thurgood Marshall
•“None of us got where we are solely by pulling ourselves up by our bootstraps. We got here because somebody - a parent, a teacher, an Ivy League crony or a few nuns - bent down and helped us pick up our boots.”

Health In All Policies
• Health in All Policies (HIAP) is a collaborative approach that integrates and articulates health considerations into policy making and programming across sectors, and at all levels, to improve the health of all communities and all people. • HIAP requires health practitioners to collaborate with other sectors to define and achieve mutually beneficial goals.

0 20 40 60 80 100
Distribution of Resources Medical Care Public Health
95 5
Rebalance our investment in health

Average social-service expenditures versus average health-services expenditures as percentages of gross domestic product (GDP) from 1995 to 2005 by country. SOURCE: Bradley et al., 2011:3

Health in All Policies Investment
• An increase in 10 full-time-equivalent weeks of paid maternal leave was associated with a 10% lower neonatal and infant mortality rate and a 9% lower mortality rate for children younger than 5 years of age.
• Analysis of the duration of paid maternal leave and neonatal, infant, and child mortality rates in 141 countries. • Public Health Reports
• A 10% reduction in racial isolation is associated with a 13% decline in Black Very Pre-Term Births (no impact on Whites) Social Science & Medicine, Vol 71, Issue 12, December 2010, Pages 2108–2116

Health care levers to influence disparities • Stability of coverage • Networks to include
• Community health centers • Community providers • Behavioral and mental health
services • Services to include:
• Care coordination • Preventive services • Home visiting • Community Care Teams
• Workforce • Interpreters • Navigators • Community Health Workers • Other kinds of providers
• Emphasis on primary care
• Transportation
• Individual and community education
• Data collection on race, ethnicity, and language
• Tracking of progress
• Cultural Competence
• Integration with public health and social services

What Would It Take To Make Minnesota the “Healthiest State Possible for All Minnesotans?”
• Change the narrative about what creates health • Health is not determined by just
clinical care and personal choices • Health is determined by physical
and social determinants • Health is determined by policies,
systems, and the physical and social environment

What Would It Take To Make Minnesota the “Healthiest State Possible for All Minnesotans?”
• Create expectation that we can and
will address social determinants
• Adopt a Health in All Policies
approach
• Hold decision-makers accountable
for policies, programs
• Organize resources to advance
health/health equity

What Would It Take To Make Minnesota the “Healthiest State Possible for All Minnesotans?”
• Engage all of the population in
creating health
• Empower communities to create
the conditions for health

Seven AHE Recommendations for MDH
• Adopt a “health in all policies” approach
• Change MDH grant making • Strengthen data collection and analysis • Continue efforts that work • Provide statewide leadership • Strengthen community relationships • Make health equity an emphasis

Next Steps for MDH
•Establish the Minnesota Center for Health Equity
•Convene and coordinate a cabinet-level health equity and health in all policies effort
•Begin the process of implementing the recommendations

Determinants of Health • Necessary conditions for
health Peace
Shelter
Education
Food
Income
Stable eco-system
Sustainable resources
Health Care
Social justice and equity
World Health Organization. Ottawa charter for health promotion. International Conference on Health Promotion: The Move Towards a New Public Health, November 17-21, 1986 Ottawa, Ontario, Canada, 1986. Accessed July 12, 2002 at <http://www.who.int/hpr/archive/docs/ottawa.html>.

“Public health is what we, as a society, do collectively to assure the conditions in which (all) people can be healthy.”
-Institute of Medicine (1988), Future of Public Health
Edward P. Ehlinger, MD, MSPH Commissioner, MDH P.O. Box 64975 St. Paul, MN 55164-0975 [email protected]