advances in valuing non-timber forest ecosystem … in valuing non-timber forest ecosystem services...
TRANSCRIPT

Advances in Valuing
Non-Timber Forest Ecosystem
Services (NTFES) in Norway
Ståle Navrud
School of Economics and Business
Norwegian University of Life Sciences (NMBU)
e-mail: [email protected]
Workshop on a “Pan-European approach to valuationof forest ecosystem services”; Belgrade, 24-25 September.
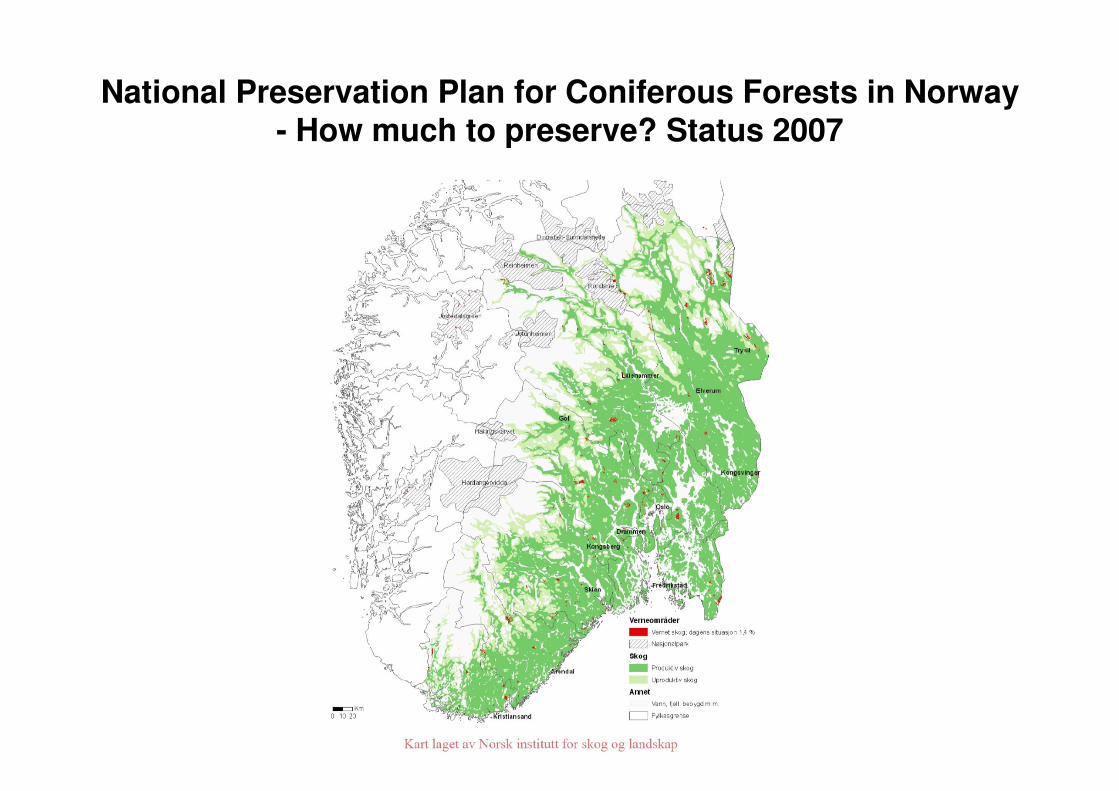
National Preservation Plan for Coniferous Forests in Norway- How much to preserve? Status 2007

Valuing National Preservation Plans for Coniferous Forests in Norway
• Contingent Valuation (CV) internet survey to a webpanel of Norwegian respondents; but also as in-person interviews and mail surveys to subsamples;
• Conducted in September-November 2007 by the survey firm TNS Gallup (incl. focus groups and pilot tests), 2881 respondents, 69 % response rate
• 10 different subsamples (2 for the mail survey, 1 for in-person interviews, 7 for internet survey) – that were all given different treatments (see table 1.)

I
(n=500)
III
(n=300)
IIa
(n=450)
IIb
(n=450)
IIc
(n=450)
IId
(n=450)
IIe
(n=450)
IIf
(n=450)
IIg
(n=450)
Mode type Mail PI Web Web Web Web Web Web Web
Frame Norw Norw Norw Norw Norw Norw Norw
Treatment 1: Modes
Websurvey Oslo X
Pers.int Oslo X
Treatment 2: Scope
Protection 2,8% &
4,5%
Ia: 250 X X X
Protection 2,8% &
10%
Ib: 250 X X X X X
Cheap talk 1: Scope X
Info: # of species X
Treatment 3: Hhld
vs indiv.
WTP household X X X X X X X X X
WTP personally X X
Follow up probe X X
Treatment 4:
Protest & High bids
Cheap talk 2:
High bids
X X X X
Cheap talk 3:
Protest 0
X X X X X X
Websurvey features
Time measure X X X X X X X
Definitions of terms X X X X X X
Table 1 Survey design: Split (sub)samples and different treatments
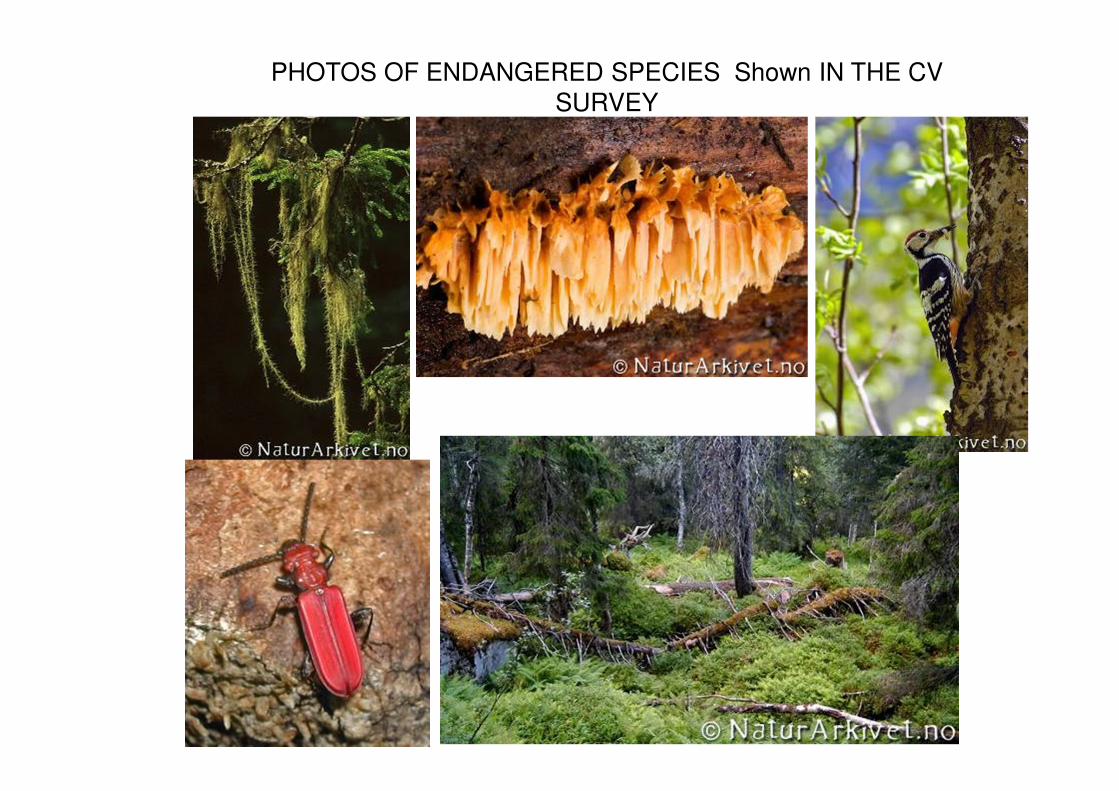
PHOTOS OF ENDANGERED SPECIES Shown IN THE CV
SURVEY

1.4 % (2007) and 2.8 % of productive forest
preserved

4.5 % and 10 % of productive forest preserved

Preservation Plans
Project aternative
Percent conserved (%)
Area conserved (km2)
Reference
(2007)
1.4 % 571 km2
A1 2.8 % + 571 km2
A2 (ecologists´
”minimum alt.”)
4.5 % + 2001 km2
(+ 18.7 mill m3)
A3 (ecologists
”preferred alt.”)
10 % + 5144 km2
(+ 48.1 mill m3)

RESEARCH DESIGN: CV SCENARIO AND OPEN-
ENDED WTP QUESTION (W/ PAYMENT CARD)
”Now we ask you to consider how much the two alternative plans are worth for your
household. Think carefully through how much the 2.8% plan is worth compared to the
current situation, before you give your final answer to the next question. Try to consider what
would be a realistic annual amount given the budget of your household. Your household must
choose whether to spend the amount on the forest conservation plan, or on other things.”
WTP question: ”What is the most your household almost certainly is willing to pay in an
additional annual tax earmarked to a public fund for increased forest conservation from
today’s level of 1.4% to 2.8 (and to 4.5 /10 % ) of the productive forest area? Choose the
highest amount, if anything, your household almost certainly will pay”.
Payment card : Amounts ranging from 0 to 15.000 NOK (1 euro = 8 NOK)

Midpoint estimates of annual, mean WTP per household for the three forest conservation plans, in 2007-NOK (I NOK = 0.12 euro) 95% CI in vertical bars.
Social Benefits
Source: Lindhjem, Grimsrud, Navrud & Kolle (2014): “The Social Benefits and Costs of Preserving Forest Biodiversity and Ecosystem Services”. Forthcoming in Journal of Environmental Economics and Policy

Conservation plan: 2.8% 4.5% 10%
Present value of benefits, PV(B):
Total quantified
conservation benefits
65 957 79 273 82 569
Present value of costs, PV(C):
Compensation costs
(opportunity costs)
2 891 6 196 17 486
Transaction costs 578 1 239 3 497
Inefficiency costs of
taxation
694 1 487 4 197
Total quantified costs 4 164 8 922 25 180
Net present value (NPV) =
PV(B) – PV(C)
61 794 70 351 57 389
Present value (PV) of costs and benefits for three conservation plans;protest zeros removed (in million 2013-NOK; 1 NOK = 0.12 euro)

Conservation plan: 2.8% 4.5% 10%
Present value of benefits, PV(B):
Total quantified forest
conservation benefits
44 012 50 565 55 346
Present value of costs, PV(C):
Compensation costs
(opportunity costs)
2 891 6 196 17 486
Transaction costs 578 1 239 3 497
Inefficiency costs of taxation 694 1 487 4 197
Total quantified costs 4 164 8 922 25 180
Net present value (NPV) =
PV(B) – PV(C)
39 848 41 643 30 167
Sensitivity analysis: Present value (PV) of costs and benefits when“don’t knows” and all zero responses are assumed to be true zero(in million 2013-NOK; 1 NOK = 0.12 euro)

Generalizing Values ���� Benefit Transfer (BT)
• Benefit transfer (BT) = Transfer economic value of public good from study site (primary valuation study) to policy site; both benefits and costs transfer (i.e. rather call it “value transfer”)
• Four basic requirements for valid BT:
1) Complete, searchable and accessible database of domestic and foreign valuation studies � NTFES database
2) Best practise criteria for assessing quality of primary valuation studyCOST E45 Euroforex Revealed (RP) and Stated Preference (SP) Study Protocols for NTFES
3) Benefit transfer techniques; Unit value (wo/w income adjustment), benefit function, meta analysis
4) Best practise criteria for benefit transfer of NTFES COST E45 Euroforex BT protocol, and general BT protocols (e.g. UK Defra BT guidelines and Danish EPA BT Guidelines)
• Transfer in: i) space, ii) time and iii) area/adding up.

i) Spatial benefit transfer
Often lack time and resources to conduct new primary valuation studies:
- Simple transfers of unit values (WTP per household per year) from existingvaluation studies often used, but often high transfer errors
- Meta-analysis (MA) claims to have the potential to increase precision in benefit transfer (BT); but few have tested this
Lindhjem, H. and S. Navrud 2008: How Reliable are Meta-Analyses for
International Benefit Transfer ? Ecological Economics, 66; 425-435.
• Main research question:
Using data from three countries (Norway, Sweden, Finland), how doesmeta-analytic (MA) BT compare to a simple BT technique (unit value) ?
• Main finding:
Simple unit value transfer from domestic studies performs no worse (in terms of transfer error; ca 50%) on average than MA-BT

ii) Temporal Benefit Transfer- Very few test-retest studies of Stated Preference studies over timeZandersen et al 2007 (Land Economics): Testing Benefits Transfer of ForestRecreation Values over a Twenty-Year Time Horizon- Travel Cost Method applied to forest recreation in 52 public forests inDenmark in 1977 and 1997.
- Preferences for characteristics of the forest e.g. biodiversity and age of the forest, and modes of transportation have chngessignificantly over this 20 year period. Results in a temporal transfer error of 282 %, which can be reduced to 25% if the WTP function is updated with new estimates for theses characteristics. � Temporal transfer of NTB using the consumer price index willlead to biased estimates of forest recreation
- Adjusting WTP for increased income over time���� need income elasticity of WTP
Hökby & Söderqvist (2003) (Environmental and Resource Economics): Elasticites of demand and WTP for environmental services in Sweden – metaanalysis including use and non-use values of forests� Income elasticity of WTP in most studies in the range 0.3-0.7

ii) Transfer in area/ Adding up
• Lindhjem, H. (2007) : 20 years of Stated Preference Valuation of Non-Timber Benefits from Fennoscandian Forests: A Meta Analysis. Journal
of Forest Economics, 12 (4); 251-277.Stated preference (SP) surveys have been conducted to value non-timber benefits (NTBs) from forests in Norway, Sweden and Finland for about 20 years. The paper reviews 28 studies (72 estimates of mean WTP) and summarizes methodological traditions in SP research in the three countries. A meta-regression analysis is conducted explaining systematic variation in Willingness-to-Pay (WTP)
WTP is found to be insensitive to the size of the forest, casting doubt on the use of simplified WTP/area measures for adding up NTFES (especially non-use values) to get national values from local studies �rather conduct national SP studies.

Table 1 Stated preference valuation surveys of non-timber benefits from forests in
Finland, Norway and Sweden, 1985-2005
Main references Year Good1 Gain/
loss
Mode Scope2 Method
# WTP
(USD)
Finland Kniivilä (2004) 2000 P L Mail R, L CV: DC 2 61-107 Lehtonen et al (2003) 2002 P G Mail R CV: DC 5 190-342 Pouta et al (2000; 2002) 1997 P G/L Mail N CV: DC 4 154-227 Pouta (2003; 2004; 2005) 1998 M G Mail N CV: DC 2 287-299 Rekola and Pouta (2005) 1995 M G Mail L CV: DC 1 20 Siikamäki and Layton (2005) 1999 P G Mail N CV: DC, CE 3 79-134 Mäntymaa et al (2002) 1999 P, B G Mail N CV: OE 4 224-380 Horne et al (2005) 1998 P, M G/L Interv. L CE 1 -16 Tyrväinen & Väänänen (1998) 1995 P, O L Mail L CV: OEPC 5 31-124 Tyrväinen (2001) 1996 P, O L/G Mail L CV: OEPC 6 22-248 Norway Simensen and Wind (1990) 1989 P, M G Interv. L CV: OE 3 21-159 Hoen and Winther (1993) 1990 P, M G Interv. N CV: OEPC 6 14-65 Veisten et al (2004a; b) 1992 B L Interv. N CV: OE/OEPC 3 138-210 Sandsbråten (1997) 1997 M L/G Interv. L CV: DC 2 43-45 Leidal (1996) 1996 P L Interv. L CV: DC/OE 3 455-504 Skagestad (1996) 1996 P, M G Interv. L CV: OEPC 1 15 Veisten and Navrud (2006) 1995 P L Mail R CV: DC/OE 4 3-104 Hoen and Veisten (1994) 1992 M G Interv. L CV: OE 1 50 Hoen and Veisten (1994) 1993 M G Interv. L CV: DC 1 48 Strand and Wahl (1997) 1997 P L Interv. L CV: OE/DC 2 172-243 Sweden Bojö (1985) 1985 P G Interv. L CV: DC 1 58 Bostedt and Mattson (1991) 1991 M, O L Mail L CV: OE 1 385 Mattson and Li (1993) 1991 M, O L Mail R CV: OE/DC 2 469-907 Mattson and Li (1994) 1992 M, O L/G Mail R CV: DC, CE 2 440-1280 Kriström (1990a; b) 1987 P G Mail N CV: DC/OE 4 275-725 Johansson (1989) 1987 B L Mail N CV: OE 1 254 Bostedt and Mattson (1995) 1992 M, O G Mail L CV: OE 2 78-84 Fredman & Emmelin (2001) 1998 M, O G Mail R CV: OE 1 92
Total number of estimates 72
1, Good: P = Protection, M = Multiple Use Forestry, B = Primarily forest biodiversity, O = Other; # = Number of estimates in the meta-regression. 2 = Local (L), Regional (R), National (N)