advances in separation methodologies: fatty acid, …
TRANSCRIPT

ADVANCES IN SEPARATION METHODOLOGIES: FATTY ACID, FATTY AMINE,
WATER, AND ETHANOL DETERMINATION BY IONIC LIQUID GAS
CHROMATOGRAPHY AND D-AMINO ACID EVALUATION IN
MAMMALIAN BRAIN BY LIQUID CHROMATOGRAPHY
by
CHOYCE ASHER WEATHERLY
Presented to the Faculty of the Graduate School of
The University of Texas at Arlington in Partial Fulfillment
of the Requirements
for the Degree of
DOCTOR OF PHILOSOPHY
THE UNIVERSITY OF TEXAS AT ARLINGTON
August 2016

ii
Copyright © by Choyce Asher Weatherly 2016
All Rights Reserved

iii
Acknowledgements
I would like to thank my research professor, Dr. Daniel W. Armstrong for the
ability to work in his research group. I appreciate his guidance throughout the PhD
program. I would like to thank my research committee. First, Dr. Kevin Schug who held
me to a higher standard. Secondly, Dr. Peter Kroll who kindly chaired the committee for
all my research updates. Lastly, Dr. Kayunta Johnson-Winters who so kindly substituted
in for Dr. Kroll in the final defense. I would like to thank the entire Armstrong research
group, particularly Zach, John, Sophie, Siqi, Ross, Curran, Farooq, and Barbara. I
worked closely with all of you and appreciate all your assistance in our research.
To my dear family who has been my biggest support. Thank you for your love
and support in these five years of study. To Devan, I appreciate your consistency to help
me along the way. To my parents, thank you for pushing me to further my education.
July 29, 2016
iv
Abstract
ADVANCES IN SEPARATION METHODOLOGIES: FATTY ACID, FATTY AMINE,
WATER, AND ETHANOL DETERMINATION BY IONIC LIQUID GAS
CHROMATOGRAPHY AND D-AMINO ACID EVALUATION IN
MAMMALIAN BRAIN BY LIQUID CHROMATOGRAPHY
Choyce Asher Weatherly, PhD
The University of Texas at Arlington, 2016
Supervising Professor: Daniel W. Armstrong
This dissertation focuses on two chromatographic techniques, gas
chromatography (GC) and high performance liquid chromatography (HPLC). The goal of
the GC work is to describe advances in separation methodologies focusing on the
separation and quantitation of commercially related compounds (i.e. fatty acids, fatty
amines, water, and ethanol). Four ionic liquid (IL) columns were evaluated for rapid
analysis and improved resolution of long-chain methyl and ethyl esters of omega-3,
omega-6, and additional positional isomeric and stereoisomeric blends of fatty acids
found in fish oil, flaxseed oil, and potentially more complicated compositions. The
potential for improved resolution of fatty acid esters is important for complex food and
supplement applications, where different forms of fatty acids can be incorporated. Ionic
liquid based capillary columns for GC were also used to separate trifluoroacetylated fatty
amines focusing on the analysis of a commercial sample. Using an ionic liquid column, it
was possible to separate linear primary fatty amines from C12 to C22 chain length in less
than 25 min. Lastly, an ionic liquid GC method for the simultaneous quantitation of
ethanol and water that is simple, accurate, precise, rapid, and cost-effective is
v
demonstrated. Analysis of ethanol and water in consumer products is important in a
variety of processes and often is mandated by regulating agencies.
The goal of the remaining part of the dissertation is to demonstrate HPLC
application for analyzing L- and D-amino acids in mouse tissues. The most complete
characterization of brain and blood amino acid levels using a mouse model is performed.
Hippocampus, cortex, and blood samples from mice were analyzed for L- and D-amino
acid levels by a heart-cutting two-dimension liquid chromatography method. L- and D-
amino acid levels are examined in terms of anomalies, trends and possible relevance to
the limited existing data on mammalian D-amino acids.

vi
Table of Contents
Acknowledgements .............................................................................................................iii
Abstract .............................................................................................................................. iv
List of Illustrations ............................................................................................................... x
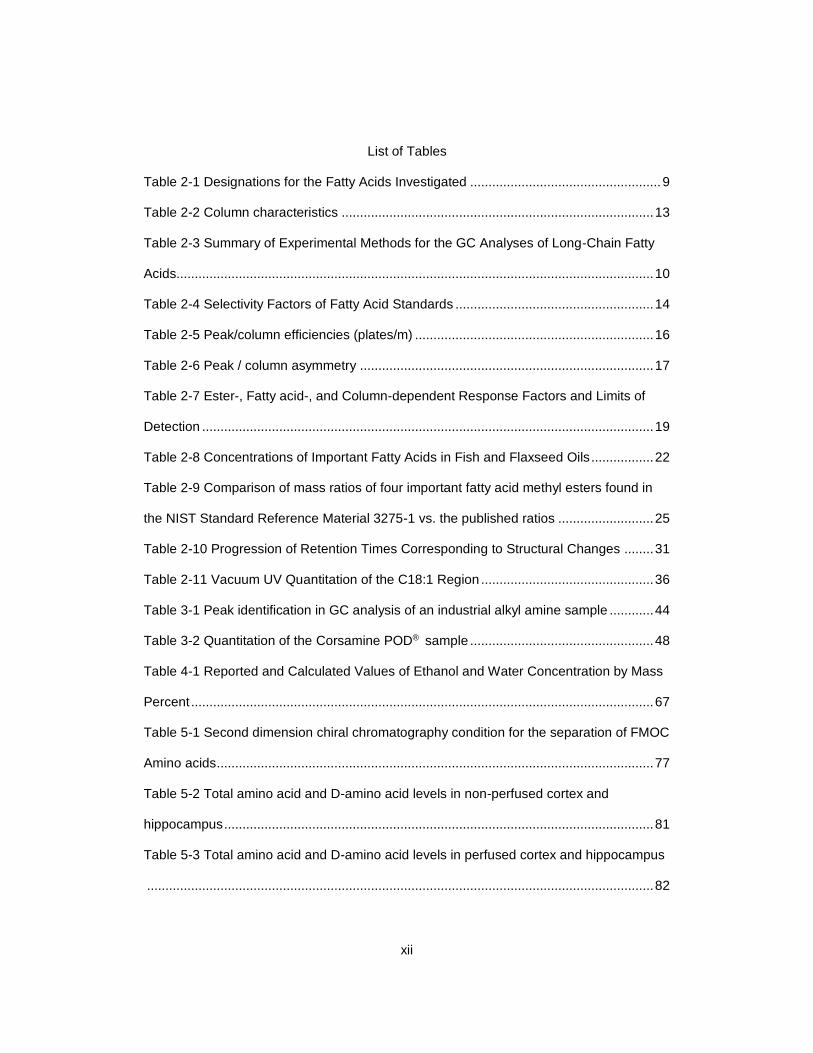
List of Tables ......................................................................................................................xii
Chapter 1 Introduction......................................................................................................... 1
1.1 Organization of Dissertation ..................................................................................... 1
1.2 Ionic Liquid Gas Chromatography ............................................................................ 1
1.2.1 Ionic Liquids ....................................................................................................... 1
1.2.2 Ionic Liquids in Gas Chromatography ............................................................... 3
1.3 Heart-Cut Two Dimension Liquid Chromatography of D-Amino Acids ..................... 4
1.3.1 L- and D- Amino Acids ...................................................................................... 4
1.3.2 Importance of D-Amino Acids in Mammals ....................................................... 5
Chapter 2 Analysis of Long-Chain Unsaturated Fatty Acids by Ionic Liquid
Gas Chromatography .......................................................................................................... 7
2.1 Abstract ..................................................................................................................... 7
2.2 Introduction ............................................................................................................... 7
2.3 Materials and Methods ........................................................................................... 12
2.3.1 Materials .......................................................................................................... 12
2.3.2 Columns .......................................................................................................... 12
2.3.3 GC-FID and GC-MS Methods ......................................................................... 13
2.3.4 GC-Vacuum UV Method .................................................................................. 14
2.3.5 Sample Preparation ......................................................................................... 11
2.4 Results and Discussion .......................................................................................... 12
2.4.1 Thermal Profiles .............................................................................................. 12
vii
2.4.2 Retention Time and Selectivity ........................................................................ 13
2.4.3 Peak Efficiency and Symmetry ........................................................................ 15
2.4.4 Quantitation of EPA and DHA in Fish Oil and ALA in Flaxseed Oil ................ 17
2.4.5 Separation of Arachidonic Acid (12c), Eicosapentaenoic Acid
(14c), and Docosahexaenoic Acid (17c) .................................................................. 26
2.4.6 Separation of Unconjugated cis- and trans-Fatty Acids .................................. 27
2.4.7 Separation of Mixtures of Selected FAMEs/FAEEs ........................................ 27
2.4.8 Thermal Programs for Mixed Isomers and Esters ........................................... 29
2.4.9 Vacuum UV Detection for Additional Resolution ............................................. 29
2.5 Conclusions ............................................................................................................ 32
Chapter 3 Development and evaluation of gas chromatographic methods for
the analysis of fatty amines ............................................................................................... 37
3.1 Abstract ................................................................................................................... 37
3.2 Introduction ............................................................................................................. 37
3.3 Materials and Methods ........................................................................................... 39
3.3.1 Chemicals ........................................................................................................ 39
3.3.2 Equipment ....................................................................................................... 39
3.3.3 GC Procedure .................................................................................................. 40
3.4 Results and Discussion .......................................................................................... 40
3.4.1 Gas chromatography separation of alphatic amines ....................................... 40
3.4.2 Saturated alkylamine column calibration ......................................................... 41
3.4.3 Analysis of an industrial sample ...................................................................... 42
3.4.4 Unsaturated alkylamines ................................................................................. 46
3.4.5 GC-FID quantitation ........................................................................................ 47
3.4.6 Comparison with other analytical techniques .................................................. 48

viii
3.5 Conlusions .............................................................................................................. 50
Chapter 4 Rapid Analysis of Ethanol and Water in Commercial Products
Using Ionic Liquid Capillary Gas Chromatography with Thermal Conductivity
Detection and/or Barrier Discharge Ionization Detection .................................................. 51
4.1 Abstract ................................................................................................................... 51
4.2 Introduction ............................................................................................................. 51
4.3 Materials and Methods ........................................................................................... 55
4.3.1 Materials .......................................................................................................... 55
4.3.2 Methods ........................................................................................................... 56
4.4 Results and Discussion .......................................................................................... 57
4.4.1 Method Range ................................................................................................. 59
4.4.2 Calibration and Quantitation ............................................................................ 63
4.5 Conclusions ............................................................................................................ 68
Chapter 5 Level and function of D-amino acids in mouse brain tissue and
blood.................................................................................................................................. 70
5.1 Abstract ................................................................................................................... 70
5.2 Introduction ............................................................................................................. 70
5.3 Materials and Methods ........................................................................................... 73
5.3.1 Materials .......................................................................................................... 73
5.3.2 Derivatization of amino acid standards ........................................................... 73
5.3.3 Mouse brain non-perfused tissues .................................................................. 74
5.3.4 Mouse brain perfused tissues ......................................................................... 74
5.3.5 Blood Samples ................................................................................................ 75
5.3.6 Animal Subjects ............................................................................................... 75
5.3.7 Free amino acid extraction .............................................................................. 75

ix
5.3.8 Two Dimension HPLC instrumentation and method ....................................... 76
5.4 Results .................................................................................................................... 80
5.5 Discussion .............................................................................................................. 87
5.5.1 Broad trends .................................................................................................... 87
5.5.1.1 Effect of perfusion .................................................................................... 87
5.5.1.2 Amino Acid Levels: Homeostasis? .......................................................... 88
5.5.1.3 Cortex vs. Hippocampus amino acid levels ............................................. 89
5.5.1.4 Percent D-amino acid levels .................................................................... 91
5.5.2 Specific Amino Acids ....................................................................................... 92
5.5.2.1 D-Glutamic Acid (Glutamate) and D-Glutamine ....................................... 92
5.5.2.2 D-Aspartic Acid (Aspartate) and D-Serine ............................................... 94
5.5.2.3 D-Branched chain amino acids (D-Leucine, D-Valine, D-
Isoleucine, and D-Allo-Isoleucine) ....................................................................... 94
5.5.2.4 D-phenylalanine, D-alanine and D-asparagine ........................................ 95
5.6 Conclusions ............................................................................................................ 95
Chapter 6 General Conclusion .......................................................................................... 97
Appendix A
Names Of Co-Contribution Authors ................................................................................ 100
Appendix B
Rights and Permissions .................................................................................................. 101
References ...................................................................................................................... 109
Biographical Information ................................................................................................. 130

x
List of Illustrations
Figure 1-1 Structure of a few common cations and anions of ionic liquids ......................... 2
Figure 2-1 Chemical structures/names of the ionic liquid stationary phases .................... 11
Figure 2-2 Temperature profiles for the Omegawax 250, SLB-IL111, SLB-IL65, SLB-IL
60, and SLB-IL59 columns ................................................................................................ 13
Figure 2-3 Chromatograms obtained from five polar capillary columns for rapid analysis
of three important diet-derived long-chain unsaturated fatty acids ................................... 14
Figure 2-4 Chromatograms of commercial samples of fish oil esters. .............................. 21
Figure 2-5 Chromatograms of commercial samples of flaxseed oil esters. ...................... 23
Figure 2-6 Chromatogram of an approximately 1:1 blend of flaxseed and fish oils ......... 25
Figure 2-7 Separation of Arachidonic Acid, Eicosapentaenoic Acid, Docosahexaenoic
Acid, trans linolelaidic acid, and cis linoleic acid ............................................................... 26
Figure 2-8 Separation of eleven C18, C20, and C22 fatty acids of varying structural
isomers and degree of unsaturation ................................................................................. 28
Figure 2-9 Comparison of two thermal gradient programs ............................................... 30
Figure 2-10 Vacuum ultraviolet spectra resolved of the C18:1 fatty acids ....................... 33
Figure 2-11 A comparison of the average cis and trans vacuum ultraviolet spectra of the
methyl and ethyl esters of the C18:1 fatty acids ............................................................... 34
Figure 2-12 Separation of the mixture of selected FAMEs and FAEEs with vacuum UV
deconvolution .................................................................................................................... 35
Figure 3-1 GC–MS chromatograms of the trifluoroacetylated Corsamine POD® sample 42
Figure 3-2 Mass spectra of the three C15 peaks shown in Fig. 3-1 ................................. 45
Figure 4-1 Chromatographic separation and data of ethanol and water using thermal
conductivity detector (TCD). ............................................................................................. 58
xi
Figure 4-2 Column stability after 800 injections of a sample containing 10 percent by
mass ethanol and 90 percent by mass water. .................................................................. 59
Figure 4-3 Water and ethanol method range .................................................................... 60
Figure 4-4 Thermal conductivity detector (TCD) experimental linear range of peak area
response vs. mass percent of ethanol and water. ............................................................ 62
Figure 4-5 Barrier discharge ionization detector (BID) experimental linear range of peak
area response vs. mass percent of ethanol and water. .................................................... 63
Figure 4-6 Water and ethanol calibrations ........................................................................ 64
Figure 4-7 Chromatogram of commercial almond extract sample analyzed with barrier
discharge ionization detection. .......................................................................................... 68
Figure 5-1 Representative chromatograms of the first and second dimension separations
of standard FMOC amino acids. ....................................................................................... 79
Figure 5-2 The average value of total amino acid levels (µg/mg) in blood, non-perfused
cortex, and non-perfused hippocampus............................................................................ 84
Figure 5-3 The average value of D-amino acid levels (µg/mg) in blood, non-perfused
cortex, and non-perfused hippocampus............................................................................ 85
Figure 5-4 Linear plots of the total amino acid levels in perfused and non-perfused
samples and normalized data (with respect to glutamic acid) in comparison to raw data.
.......................................................................................................................................... 86
Figure 5-5 A) Comparison of total amino acid levels in the cortex vs. hippocampus. B)
Comparison of D-amino acid levels in the cortex vs. hippocampus. ................................ 90
Figure 5-6 A) Plot of hippocampus %D amino acid levels vs. total amino acid levels. B)
Plot of cortex %D amino acid levels vs. total amino acid levels. ...................................... 92
xii
List of Tables
Table 2-1 Designations for the Fatty Acids Investigated .................................................... 9
Table 2-2 Column characteristics ..................................................................................... 13
Table 2-3 Summary of Experimental Methods for the GC Analyses of Long-Chain Fatty
Acids.................................................................................................................................. 10
Table 2-4 Selectivity Factors of Fatty Acid Standards ...................................................... 14
Table 2-5 Peak/column efficiencies (plates/m) ................................................................. 16
Table 2-6 Peak / column asymmetry ................................................................................ 17
Table 2-7 Ester-, Fatty acid-, and Column-dependent Response Factors and Limits of
Detection ........................................................................................................................... 19
Table 2-8 Concentrations of Important Fatty Acids in Fish and Flaxseed Oils ................. 22
Table 2-9 Comparison of mass ratios of four important fatty acid methyl esters found in
the NIST Standard Reference Material 3275-1 vs. the published ratios .......................... 25
Table 2-10 Progression of Retention Times Corresponding to Structural Changes ........ 31
Table 2-11 Vacuum UV Quantitation of the C18:1 Region ............................................... 36
Table 3-1 Peak identification in GC analysis of an industrial alkyl amine sample ............ 44
Table 3-2 Quantitation of the Corsamine POD® sample .................................................. 48
Table 4-1 Reported and Calculated Values of Ethanol and Water Concentration by Mass
Percent .............................................................................................................................. 67
Table 5-1 Second dimension chiral chromatography condition for the separation of FMOC
Amino acids ....................................................................................................................... 77
Table 5-2 Total amino acid and D-amino acid levels in non-perfused cortex and
hippocampus ..................................................................................................................... 81
Table 5-3 Total amino acid and D-amino acid levels in perfused cortex and hippocampus
.......................................................................................................................................... 82

xiii
Table 5-4 Total amino acid and D-amino acid levels in blood .......................................... 83

1
Chapter 1
Introduction
1.1 Organization of Dissertation
This dissertation focuses on two chromatographic techniques, gas
chromatography (GC) and high performance liquid chromatography (HPLC). Chapter 1
gives an introduction to the back ground relating to ionic liquid column origins and D-
amino acids. Chapters 2, 3, and 4 focus on GC advances in separation methodologies
focusing on the separation and quantitation of commercially related compounds (i.e. fatty
acids, fatty amines, water, and ethanol). Chapter 2 focuses on four ionic liquid (IL)
columns that were evaluated for rapid analysis and improved resolution of long-chain
methyl and ethyl esters of omega-3, omega-6, and additional positional isomeric and
stereoisomeric blends of fatty acids found in fish oil, flaxseed oil, and potentially more
complicated compositions. Chapter 3 discusses ionic liquid based GC capillary columns
separating trifluoroacetylated fatty amines in a commercial sample. Chapter 4 focuses on
ionic liquid GC simultaneous quantitation of ethanol and water. Chapter 5 demonstrates
HPLC application for analyzing L- and D-amino acids in mouse tissues, and is the most
complete characterization of brain and blood amino acid levels using a mouse model.
1.2 Ionic Liquid Gas Chromatography
1.2.1 Ionic Liquids
The history of ionic liquids began in 1888 when Gabriel and Weiner reported
ethanolammonium nitrate exhibiting a melting point range of 52 – 55 °C.1 Following this
initial discovery was the report of an even lower melting point ionic liquid, ehtylammonium
nitrate (m.p. 12 °C), in 1914.2 Today, the term “ionic liquid” (IL) is used to describe a
class of salts which have a melting point below 100 °C.3 Room temperature ionic liquids
(RTILs) describe a class of salts which have a melting point below 25 °C.3 Ionic liquids’

2
unique properties are a byproduct of their ionic nature, like metallic salts. Accordingly, ILs
behave rather differently compared to common solvents and liquids.
Ionic liquids in gas chromatography are room temperature ionic liquids. RTILs
contain organic cations consisting of ammonium, imidazolium, pyrrolidinium, and
phosphonium species, and anionis consisting of Cl-, PF6-, BF4
-, trifluoromethylsulfonate,
and several others. Figure 1-1 shows the structures of a few common cations and anions
of ionic liquids. The low melting point of ionic liquids is due to two factors. One factor is
the relatively large anion and cation size of one or both species, and the other factor is
their low symmetry.4 These factors also contribute to ILs unique properties which include
wide liquid ranges, low volatilities (negligible vapor pressure), good thermal stabilities,
Figure 1-1 Structure of a few common cations and anions of ionic liquids
electrolytic conductivity, wide range of viscosities, adjustable miscibility, reusability,
nonflammability, and many other utilizations.3 One of the most important aspect of ILs
(especially in ionic liquid gas chromatography) is the fact that the ions can be “tunable”
for the desired application.3 That means various IL cations and anions can be combined
to make custom ionic liquids for a desired purpose. There are an estimated 1018
combinations of ILs with currently known IL cations and anions.5
Even though ILs have been utilized since the early 1900s, their application in
analytical chemistry was not realized until the 1990s. Since that time there has been a

3
plethora of publications in the field of analytical chemistry utilizing ionic liquid in a variety
of techniques. Some of these techniques include gas chromatography,6–13 matrix-
assisted laser desorption/ionization (MALDI) in mass spectrometry,14,15 paired ion
electrospray ionization (PIESI) in anion mass spectrometry analysis,16–27 solid-phase
microextraction (SPME) in GC analysis,28,29 and ionic liquid – liquid extractions.30–32
1.2.2 Ionic Liquids in Gas Chromatography
Low volatility, high viscosity, good thermal stability, and variable polarities are
properties of room temperature ionic liquids that make them idyllic for GC stationary
phases. Ionic liquid imidazolium based GC stationary phases were among the first IL
phases that achieved great success.6 IL-GC has an unusual dual nature regarding
retention behavior. It has been noted that IL-GC has the ability to separate both nonpolar
and polar analytes. Four years later, Anderson and Armstrong created one of the first
highly stable IL class GC stationary phases based on 1-benzyl-3-methylimidazolium
trifluoromethanesulfonate ([BeMIM][TfO]) and 1-(4-methoxyphenyl)-3-methylimidazolium
trifluoromethanesulfonate ([MPMIM][TfO]).7 These phases were able to provide highly
efficient separations of analyte mixtures including alkanes, alcohols, polycyclic aromatic
hydrocarbons, and isomeric sulfoxides. In 2005 a cross-link based ionic liquid column
was developed and showed high selectivity and temperature stabilities up to 280 °C.8
Today, more highly cross-linked IL stationary phases are available at higher temperature
ranges of 300 – 400 °C.33–37 IL-GC stationary phases are the first class of new
commercial GC stationary phases that have become available in several decades.38
Since the commercialization of ionic liquid columns in the last decade, IL based
columns have been used to create new GC methods for analysis of commercial and
industrial related chemicals and products. It has been found that IL columns have been
useful in the analysis of fatty compounds (i.e. fatty acids and fatty amines), ethanol, and
4
water.39–41 Ionic liquid gas chromatography analyses of fatty acids have been performed
using one dimensional GC and multidimensional GC x GC.42–48 This dissertation reports
using different types of ionic liquid columns to evaluate long-chain methyl and ethyl
esters of omega-3, omega-6, and additional positional isomeric and stereoisomeric
blends of fatty acids found in fish oil, flaxseed oil, and potentially more complicated
compositions. This is one of the first reports of comparing different IL-GC phases in the
analysis of methyl and ethyl ester fatty acids. In addition to fatty acids, fatty amines were
also analyzed using IL-GC based columns. This is the only report on this class of
compounds using an IL-GC phase. Lastly, IL-GC columns have gained interest in water
analysis because IL based column are relatively inert to water and yield a symmetrical
chromatographic peak for water analysis (which is ideal for quantitation purposes).49–53
This dissertation reports that ethanol and water were simultaneously quantified in
commercial samples using a water suitable IL based column.
1.3 Heart-Cut Two Dimension Liquid Chromatography of D-Amino Acids
1.3.1 L- and D- Amino Acids
Amino acids are among the most important molecules in nature. Amino acids are
organic compounds that contain an amine and a carboxylic acid functional groups, and
they have a side-chain (R-group) for each specific amino acid. They are biological
molecules that are abundant in nature. Amino acids predominantly appear in a polymeric
form as proteins. However, amino acids also exist in their monomeric form. Monomeric or
non-proteinogenic amino acids are less abundant, but still are a vital component of
biological systems. In 1851 Louis Pasteur revealed the optical activity of asparagine and
aspartic acid.54 Paving the way for the realization that common amino acids, excluding
glycine, have optical activity arising from their differing orientation around the α-carbon.55

5
The L- and D- notation of amino acids, ascribed to Emil Fischer, is used to notate the
difference in absolute configuration between L- and D- amino acids by utilizing the chiral
reference, glyceraldehyde.56,57
1.3.2 Importance of D-Amino Acids in Mammals
The initial discovery and configurational assignment of amino acids led to the
opinion that L-configuration amino acids were solely found in nature, and D-amino acids
were laboratory artifacts.58,59 Dispelling the notion that D-amino acids are “unnatural” or
not biologically relevant began in the mid-20th century with the report that D-amino acids
were an integral part of the bacterial peptidoglycan.60 It was the first report that D-amino
acids, specifically D-alanine and D-glutamic acid, were appurtenant biological entities.
Subsequent evidence began to emerge supporting the idea that D-amino acids were not
uncommon in living systems. In 1969 J. Corrigan published a review with 30 examples of
D-amino acids found in invertebrates.58 In some cases a functional role was implied while
in many others it was unknown. By the end of the last century with the advent of new
bioanalytical techniques, scientists were able to easily isolate and identify D-amino acids
in a greater variety of biological samples and in particular, vertabrates.61–65 Investigations
into the role and function of specific D-amino acids in mammalian systems is an intriguing
but relatively neoteric area of investigations.
It has been found that D-serine is a co-agonist of the N-methyl-D-aspartate
(NMDA) receptor, and it can occupy the glycine binding site.66,67 Free D-serine has been
determined to be localized primarily in the mammalian forebrain where the highest
concentrations for NMDA receptors can be found.68–71 In addition, D-serine has been
used as a moderately successful drug for treatment of schizophrenia.72 Recently, D-
leucine has been applied as an effective treatment for seizures in mice.73 However, the
exact mechanism through which D-leucine acts to inhibit seizure activity remains

6
unknown. D-serine and D-leucine are just two examples of D-amino acid function in brain
tissues. This dissertation provides the most complete characterization of brain and blood
amino acid levels using a well-known mouse model. Further, the levels are examined in
terms of anomalies, trends and possible relevance to the limited existing data on
mammalian D-amino acids.

7
Chapter 2
Analysis of Long-Chain Unsaturated Fatty Acids by Ionic Liquid Gas Chromatography
2.1 Abstract
Four ionic liquid (IL) columns, SLB-IL59, SLB-IL60, SLB-IL65, and SLB-L111,
were evaluated for more rapid analysis or improved resolution of long-chain methyl and
ethyl esters of omega-3, omega-6, and additional positional isomeric and stereoisomeric
blends of fatty acids found in fish oil, flaxseed oil, and potentially more complicated
compositions. The three structurally distinct IL columns provided shorter retention times
and more symmetric peak shapes for the fatty acid methyl or ethyl esters than a
conventional polyethylene glycol column (PEG), resolving cis- and trans-fatty acid
isomers that coeluted on the PEG column. The potential for improved resolution of fatty
acid esters is important for complex food and supplement applications, where different
forms of fatty acids can be incorporated. Vacuum ultraviolet detection contributed to
further resolution for intricate mixtures containing cis- and trans-isomers, as exemplified
in a fatty acid blend of shorter chain C18:1 esters with longer chain polyunsaturated fatty
acid (PUFA) esters.
2.2 Introduction
That long-chain polyunsaturated fatty acids (PUFAs) might be essential for
human health was originally inferred from studies in the 1920s in which mammals, birds,
fish, and insects on diets deprived of PUFAs subsequently developed external symptoms
and anatomical and physiological changes.74 These studies, an outgrowth of
investigations of nutrients essential for animal health, led to recognition that recovery
could be achieved by addition of linoleates, sources of omega-6 fatty acids, to the diet.75
From nutritional analysis of multiple tissues it was discovered that linoleate
supplementation was correlated with a decrease in the triene to tetraene ratio for longer

8
chain polyunsaturated fatty acids. Review of instances of human deficiency established a
consistency across species, suggesting the need for PUFAs observed in the diets of
animals was translatable to that of humans.76 Subsequently, the structure of a family of
immune modulating biologically active molecules, the prostaglandins, was determined,
and the biosynthetic pathways of these diterpenoid derived autocrine or paracrine
hormones indicated dependence on sources of PUFAs.77 Gradually, a more subtle
understanding of the nutritional requirements for a balance of omega-3 to omega-6
PUFAs emerged from studies of other functions beyond wound healing and in the context
of diseases associated with low-level, but chronic, inflammation.78–80 The inference was
that the proinflammatory omega-6 fatty acids, essential for wound healing, needed to be
balanced by the anti-inflammatory activity of the omega-3 fatty acids. The most important
of these, listed in Table 2-1, have been found to be α-linolenic acid, 7 (ALA),
eicosopentaenoic acid, 14 (EPA), and docosahexaenoic acid, 17 (DHA). Epidemiologic
evidence of the impact of PUFA insufficiency on cardiovascular disease81–83 and the
influence on progression of age-related macular degeneration84,85 supported the
significance of adequate levels of PUFAs in the human diet. Benefits have been inferred
for neural development and improved cognition,86,87 for the treatment of aggression or
hostility, and in preclinical studies.88,89 Detrimental effects were observed from depleted
levels of dietary PUFAs on changes in neuroreceptors90 and, as recognized by
government regulation, from an excess of trans-fatty acids.91,92 Concomitant with recent
advances in separation science has come the appreciation that other fatty acids and their
metabolites may be critical to human health, for example, conjugated linoleic acids
(CLAs), resolvins, and neurotrophins.93,94
Gradual recognition of the extensive functional and critical physiological roles of
essential fatty acids (EFAs) emerged in parallel with improvements in analytical methods

9
required for isolating and identifying them. Application of multiple chromatographic
techniques, alone or in combination, became a resource for separating and, in
conjunction with mass spectrometric detection, identifying fatty acids or their esters by
chain length, degree of unsaturation, location of double bonds, and stereochemistry.95–99
Table 2-1 Designations for the Fatty Acids Investigated
The number designations in the first column, different by chain length and number and
positions of double bonds, are used to identify the fatty acids for which esters are
specified in the chromatograms. The stereochemistry, cis or trans, is indicated by a
following c or t. The esters are labeled with either a trailing m for a methyl or trailing e for
an ethyl ester. For example, 2te is the ethyl ester of petroselaidic acid. The fatty acids
designated here are unconjugated.
No. Fatty Acid Shorthand Notation
Systematic Name
1 Octadecenoic acid C18:1 octadecenoic acid 2t Petroselaidic acid C18:1t6 trans-octadec-6-enoic acid 2c Petroselinic acid C18:1c6 cis-octadec-6-enoic acid 3t Elaidic acid C18:1t9 trans-octadec-9-enoic acid 3c Oleic acid C18:1c9 cis-octadec-9-enoic acid 4t Vaccenic acid C18:1t11 trans-octadec-11-enoic acid 4c Vaccenic acid C18:1c11 cis-octadec-11-enoic acid 5 Octadecadienoic acid C18:2 octadecadienoic acid 6t Linolelaidic acid C18:2 all-t9,12 all-trans-octadeca-9,12-di-enoic acid 6c Linoleic acid C18:2 all-c9,12 all-cis-octadeca-9,12-di-enoic acid 7c α-Linolenic acid
(ALA) C18:3 all-c9,12,15
or C18:3(n-3) all- cis-octadeca-9,12,15-tri-enoic acid
8c ᵞ-Linolenic acid (GLA)
C18:3 all-c6,9,12 or C18:3(n-6)
all-cis-octadeca-6,9,12-tri-enoic acid
9 Eicosenoic acid C20:1 eicosenoic acid 10 Eicosadienoic acid C20:2 eicosadienoic acid 11 Eicosatrienoic acid C20:3 eicosatrienoic acid 12c Arachidonic acid
(AA) C20:4 all-c5,8,11,14 or
C20:4(n-6) all-cis-eicosa-5,8,11,14-tetra-enoic acid
13 Eicosatetraenoic acid C20:4 eicosatetraenoic acid 14c Eicosapentaenoic
acid (EPA)
C20:5 all-c5,8,11,14,17 or C20:5(n-3)
all cis-eicosa-5,8,11,14,17-penta-enoic acid
15 Docosenoic acid C22:1 docosenoic acid 16 Docosapentenoic C22:5 docosapentenoic

10
Table 2-1 Continued
No. Fatty Acid Shorthand Notation
Systematic Name
17c Docosahexaenoic acid (DHA)
C22:6 all-c4,7,10,13,16,19 or C22:6(n-3)
all-cis-docosa-4,7,10,13,16,19-hexa-enoic acid
18 Palmitic acid 16:0 hexadecanoic acid 19 Stearic acid 18:0 octadecanoic acid 20 Arachidic acid 20:0 eicosanoic acid 21 Behenic acid 22:0 docosanoic acid 22 Tricosanoic acid 23:0 tricosanoic acid
With the application of ionic liquids as stationary phases for capillary gas chromatography
(GC) columns to impart multiple polar functionalities to silica surfaces, higher resolution
has been achieved, often adequate to supplant the need for multiple tandem
techniques.100,101 Han and Armstrong102 have recently reviewed the growing use of ionic
liquids in GC separations. Most recently, an ionic liquid column of greater polarity, SLB-
IL111, has been developed and applied to the analysis of a wide array of analytes,
including but not limited to fatty acid methyl esters (FAMES),103–105 flavors and
fragrances,106 biological samples,107 conjugated linoleic acids and milk fat,108
pesticides,109 and wastewater.110 Of particular relevance to this work have been
investigations of marine oils and linoleic acids, with publications illustrating the high
resolution and quantitation achievable in the analysis of multicomponent oils.111,112 This
study focuses on two aspects: rapid analyses for the most important PUFAs and
thorough characterization of complex mixtures presented as mixtures of methyl and ethyl
esters, the latter more commonly in foods, to avoid potential toxicity.113
In this study we established separations achievable by six columns, four
structurally distinct columns, three ionic liquid columns with well-known chemical
structures (Figure 2-1) and a contrasting PEG column for the analysis of complex PUFA
mixtures containing methyl and ethyl esters of C18−C22 PUFA standards. These

11
evaluations can be important for both raw materials and commercial products, so the
performance of these columns was investigated for the qualitative and quantitative
analysis of PUFAs in fish oil and flaxseed oil, distinguishing cis- and trans-isomers and
contrasting the effects of methyl or ethyl esterification. Accurate quantitation of the major
fatty acids was substantiated by comparison with assessments provided by the NIST
standard, SRM 3275 (Table 2-9). Because in a few instances there remained unresolved
separations, vacuum UV spectroscopic responses were used to provide decomposition
(or deconvolution), offering the possibility of quantitation.114 These techniques are also
applicable for another class of interesting, fatty acids, the conjugated linoleic acids.
Figure 2-1 Chemical structures/names of the ionic liquid stationary phases
Chemical structures/names of the ionic liquid stationary phases of increasing polarity
used in the five IL columns investigated in this study: (A) C12 bis(tri-propyl phosphonium)
dicationic IL, in columns SLB-IL59 and SLB-IL60; (B) C12 bis(tri-phenyl phosphonium)
dicationic IL, in column SLB-IL65; (C) C5 bis(di-methyl imidazolium) dicationic IL, in
columns SLB-IL111 and SLB-IL111i. The counterion, the perfluorinated amidate, is
unchanged amongst the columns. The structure of the stationary phase of the reference
column, Omegawax 250, is PEG.

12
2.3 Materials and Methods
2.3.1 Materials
The coding used to designate the fatty acid analytes is listed in Table 2-1. The
all-cis-α-linolenic acid (7c), eicosapentaenoic acid ethyl ester (14ce), and
docosahexaenoic acid ethyl ester (17ce) sourced from fermentation, linolelaidic acid
methyl ester (6tm), petroselaidic acid methyl ester (2tm), oleic acid methyl ester (3cm),
linoleic acid methyl ester (6cm), elaidic acid methyl ester (3tm), trans-vaccenic acid
methyl ester (4tm), cis-vaccenic acid methyl ester (4cm), petroselinic acid methyl ester
(2cm), eicosapentaenoic acid methyl ester (14cm), docosahexaenoic methyl ester
(17cm), and arachidonic acid methyl ester (12cm) were purchased from Nu Chek Prep,
Inc. (Elysian, MN, USA). Tricosanoic acid methyl ester (22m), tricosanoic acid (22),
methanolic HCl solution, and isooctane were purchased from Sigma Aldrich (St. Louis,
MO, USA). In this study tricosanoic acid methyl ester, methyl tricosanoate (MT), was
directly used as internal standard for quantifying methyl and ethyl esters of the fatty
acids.115 SRM 3275, used to confirm the validity of quantitation, was purchased from
NIST (Gaithersburg, MD, USA).116 Highly refinedomega-3 fish oil esterified as ethyl esters
was provided by DSM Nutritional Products (Parsippany, NJ, USA) and flaxseed oil (Henry
Lamotte Oils GmbH, Bremen, Germany) was provided by Patheon Softgels B.V. (Tilburg,
The Netherlands).
2.3.2 Columns
All columns were obtained from Supelco (Bellefonte, PA, USA). The structures of
the three distinct ionic liquid phases used in the five columns evaluated are available
from, and have been published by, the manufacturer (Figure 2-1). Both aliphatic
phosphonium capillary columns of intermediate polarity,117 SLB-IL59 and SLB-IL60, are
coated with P,P′-(dodecane-1,12-diyl)bis(trin-propylphosphonium) bis- (trifluoromethane-

13
sulfonyl) amidate. The aromatic phosphonium column of intermediate polarity, SLB-IL65,
is coated with P,P′- (dodecane-1,12-diyl)bis(triphenyl phosphonium) bis-
(trifluoromethanesulfonyl) amidate. The two columns with the greatest polarity, and least
hydrophobic, ionic liquid, N,N′-(pentane-1,5- diyl)bis(2,3-dimethylimidazolium)
bis(trifluloromethanesulfonyl)- amidate, are SLB-IL111 and SLB-IL111i. In both the SLB-
IL60 and SLB-IL111i the improvements are generated by coating deactivated silica
surfaces. All of these GC columns were 30 m × 0.25 mm unless otherwise indicated; film
thickness was 0.2 μm for the IL columns and 0.25 μm for the Omegawax 250 (Table 2-2).
Table 2-2 Column characteristics
Column Length
(m)
Inner Diameter
(mm)
Film Thickness
df (µm)
Recommended Temperature
Range (°C)
Omegawax 250 30 0.25 0.25 50 - 280 SLB-IL59 30 0.25 0.2 10 - 300 SLB-IL60 30 0.25 0.2 35 - 300 SLB-IL65 30 0.25 0.2 40 - 290 SLB-IL111 30 0.25 0.2 50 - 270 SLB-IL111-60 60 0.25 0.2 50 - 270 SLB-IL111i-60 60 0.25 0.2 50 - 270
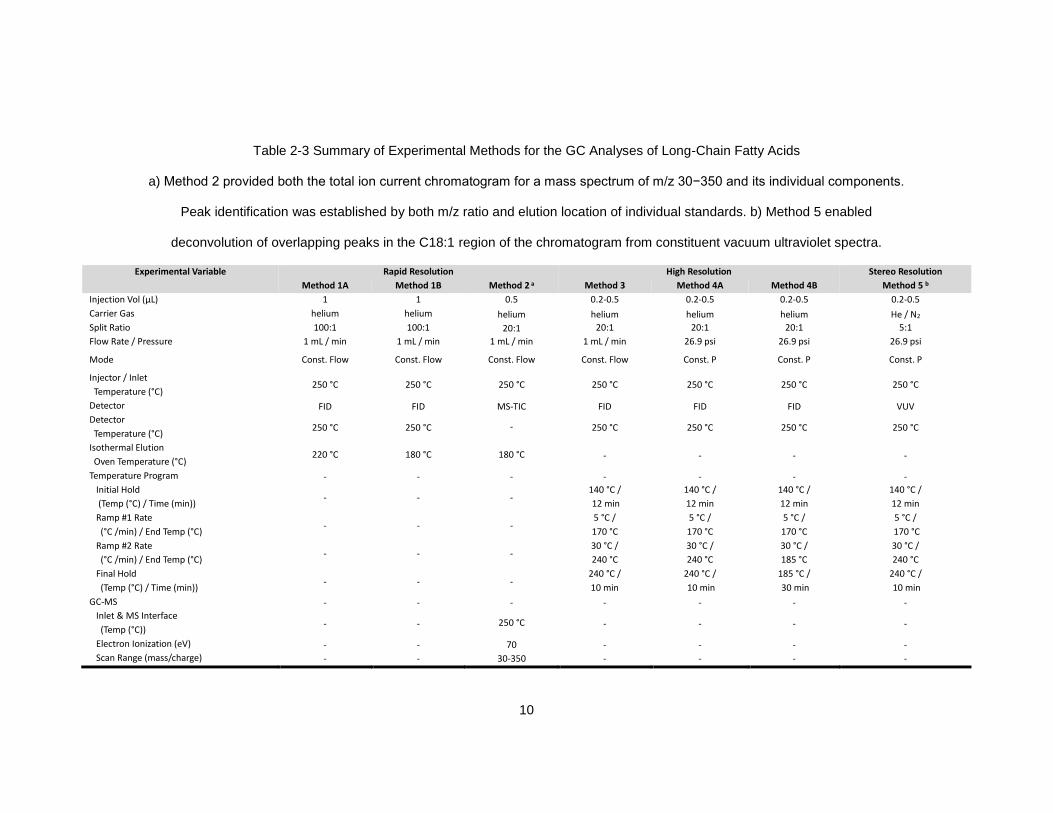
2.3.3 GC-FID and GC-MS Methods
Gas chromatography was performed with an Agilent 6890N gas chromatograph
equipped with a flame ionization detector and a 7683B series autosampler (Agilent
Technologies, Inc., Santa Clara, CA, USA). The chromatographic software used for the
analysis was provided by Agilent Chem Station Rev. D.02.00.275 (Agilent Technologies,
Inc.). Several methods and conditions were investigated in the evaluations of multiple
mixtures of the fatty acids and are summarized in Table 2-3. Note methods 1, 3, and 4
used FID detection. Method 2, utilized primarily in the identification of long-chain fatty
acids in samples of formulated commercial products, was performed with the Agilent

14
6890N chromatograph equipped with an electron ionization (EI) source and mass
spectrometric detection (5975MSD) (Agilent Technologies, Inc.).
2.3.4 GC-Vacuum UV Method
A Shimadzu GC-2010 gas chromatograph (Shimadzu Scientific Instrument, Inc.,
Columbia, MD, USA) was coupled to a VGA-100 vacuum UV detector (VUV Analytics,
Inc., Cedar Park, TX, USA) and used to collect data from a variety of samples. The data
collection rate was set at 1.3 Hz. The transfer line and flow cell temperatures were both
set at 275 °C, and the makeup gas pressure (nitrogen) was set to 0.15 psi. The column
used was SLB-IL111i, with settings from method 5 (Table 2-3). In brief, analysis of
coeluting peaks was accomplished by deconvolution using eq 1.114,118 The expression for
the absorption at each increment in wavelength is given by
𝐴(𝜆𝑗) = ∑ 𝑓𝑖𝑛𝑖=1 × 𝐴𝑖
𝑟𝑒𝑓(𝜆𝑗) (eq. 1)
where 𝑓𝑖 are the fit parameters to be optimized and 𝐴𝑖𝑟𝑒𝑓
(𝜆𝑗) are the reference spectra for
the coeluting components at each increment in wavelength, which runs from 125 to 240
nm in 0.05 nm increments. The 𝐴𝑖𝑟𝑒𝑓
(𝜆𝑗) also serve as basis functions for a linear
optimization and fitting procedure that yields the set of optimized parameters, the 𝑓𝑖 i in eq
1.119 These optimal scaling parameters are substituted back into the equation to
determine the calculated absorbance spectrum. When analyte reference spectra are
used in the model, the optimized 𝑓𝑖 reflect the amount of the 𝑖th component relative to the
𝑖th reference spectrum represented in the measured absorbance. When the model is
applied to a chromatographic peak composed of coeluting components, new curves are
generated that represent the contribution of each of these analytes to the original peak.
10
Table 2-3 Summary of Experimental Methods for the GC Analyses of Long-Chain Fatty Acids
a) Method 2 provided both the total ion current chromatogram for a mass spectrum of m/z 30−350 and its individual components.
Peak identification was established by both m/z ratio and elution location of individual standards. b) Method 5 enabled
deconvolution of overlapping peaks in the C18:1 region of the chromatogram from constituent vacuum ultraviolet spectra.
Experimental Variable Rapid Resolution High Resolution Stereo Resolution
Method 1A Method 1B Method 2 a Method 3 Method 4A Method 4B Method 5 b
Injection Vol (µL) 1 1 0.5 0.2-0.5 0.2-0.5 0.2-0.5 0.2-0.5
Carrier Gas helium helium helium helium helium helium He / N2
Split Ratio 100:1 100:1 20:1 20:1 20:1 20:1 5:1
Flow Rate / Pressure 1 mL / min 1 mL / min 1 mL / min 1 mL / min 26.9 psi 26.9 psi 26.9 psi
Mode Const. Flow Const. Flow Const. Flow Const. Flow Const. P Const. P Const. P
Injector / Inlet
Temperature (°C) 250 °C 250 °C 250 °C 250 °C 250 °C 250 °C 250 °C
Detector FID FID MS-TIC FID FID FID VUV
Detector
Temperature (°C) 250 °C 250 °C - 250 °C 250 °C 250 °C 250 °C
Isothermal Elution
Oven Temperature (°C) 220 °C 180 °C 180 °C - - - -
Temperature Program - - - - - - -
Initial Hold
(Temp (°C) / Time (min)) - - -
140 °C /
12 min
140 °C /
12 min
140 °C /
12 min
140 °C /
12 min
Ramp #1 Rate
(°C /min) / End Temp (°C) - - -
5 °C /
170 °C
5 °C /
170 °C
5 °C /
170 °C
5 °C /
170 °C
Ramp #2 Rate
(°C /min) / End Temp (°C) - - -
30 °C /
240 °C
30 °C /
240 °C
30 °C /
185 °C
30 °C /
240 °C
Final Hold
(Temp (°C) / Time (min)) - - -
240 °C /
10 min
240 °C /
10 min
185 °C /
30 min
240 °C /
10 min
GC-MS - - - - - - -
Inlet & MS Interface
(Temp (°C)) - - 250 °C - - - -
Electron Ionization (eV) - - 70 - - - -
Scan Range (mass/charge) - - 30-350 - - - -
11
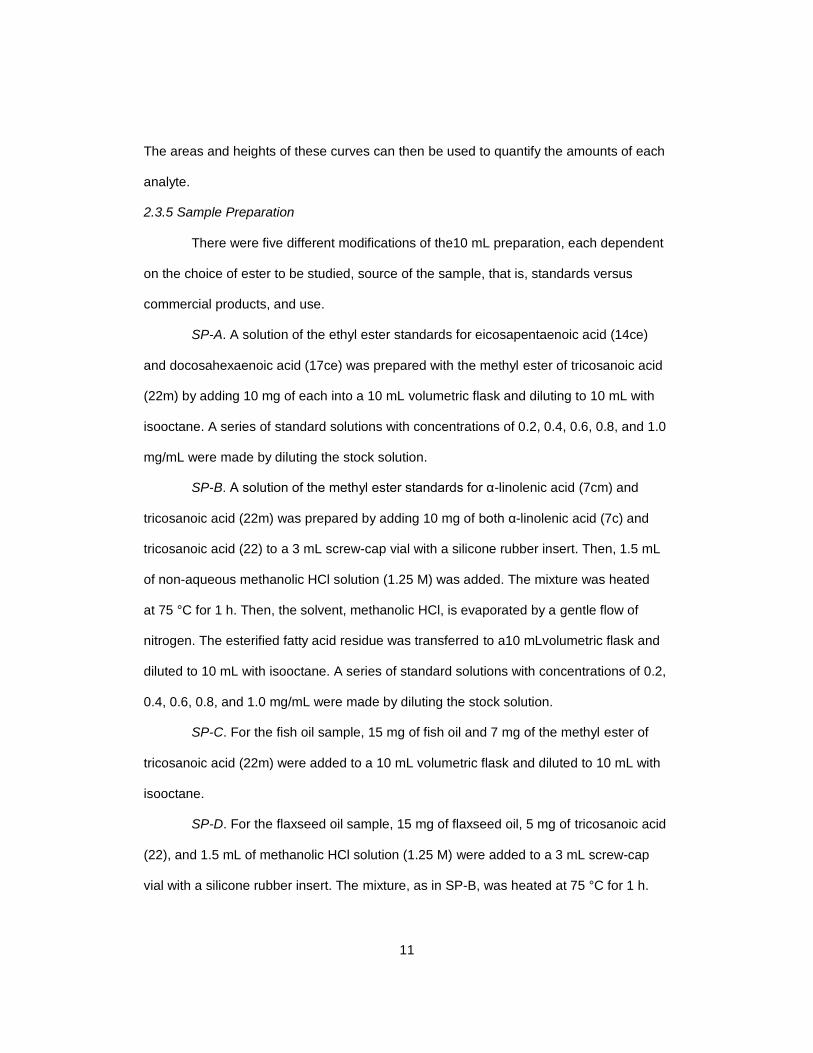
The areas and heights of these curves can then be used to quantify the amounts of each
analyte.
2.3.5 Sample Preparation
There were five different modifications of the10 mL preparation, each dependent
on the choice of ester to be studied, source of the sample, that is, standards versus
commercial products, and use.
SP-A. A solution of the ethyl ester standards for eicosapentaenoic acid (14ce)
and docosahexaenoic acid (17ce) was prepared with the methyl ester of tricosanoic acid
(22m) by adding 10 mg of each into a 10 mL volumetric flask and diluting to 10 mL with
isooctane. A series of standard solutions with concentrations of 0.2, 0.4, 0.6, 0.8, and 1.0
mg/mL were made by diluting the stock solution.
SP-B. A solution of the methyl ester standards for α-linolenic acid (7cm) and
tricosanoic acid (22m) was prepared by adding 10 mg of both α-linolenic acid (7c) and
tricosanoic acid (22) to a 3 mL screw-cap vial with a silicone rubber insert. Then, 1.5 mL
of non-aqueous methanolic HCl solution (1.25 M) was added. The mixture was heated
at 75 °C for 1 h. Then, the solvent, methanolic HCl, is evaporated by a gentle flow of
nitrogen. The esterified fatty acid residue was transferred to a10 mLvolumetric flask and
diluted to 10 mL with isooctane. A series of standard solutions with concentrations of 0.2,
0.4, 0.6, 0.8, and 1.0 mg/mL were made by diluting the stock solution.
SP-C. For the fish oil sample, 15 mg of fish oil and 7 mg of the methyl ester of
tricosanoic acid (22m) were added to a 10 mL volumetric flask and diluted to 10 mL with
isooctane.
SP-D. For the flaxseed oil sample, 15 mg of flaxseed oil, 5 mg of tricosanoic acid
(22), and 1.5 mL of methanolic HCl solution (1.25 M) were added to a 3 mL screw-cap
vial with a silicone rubber insert. The mixture, as in SP-B, was heated at 75 °C for 1 h.
12
The solvent was evaporated with a gentle flow of nitrogen. The residue was transferred to
a 10 mL volumetric flask and diluted to 10 mL with isooctane.
SP-E. For the mixtures of selected fatty acid methyl and ethyl esters, including
the FAME standards and their complementary FAEE standards as well as mixtures of
methyl and/or ethyl esters of arachidonic acid (12c), eicosapentaenoic acid (14c),
docosahexaenoic acid (17c), linolelaidic (6t), and linoleic acids (6c), with the methyl
tricosanoic acid standard (22m), these esters were simply dissolved in isooctane at 1
mg/mL.
2.4 Results and Discussion
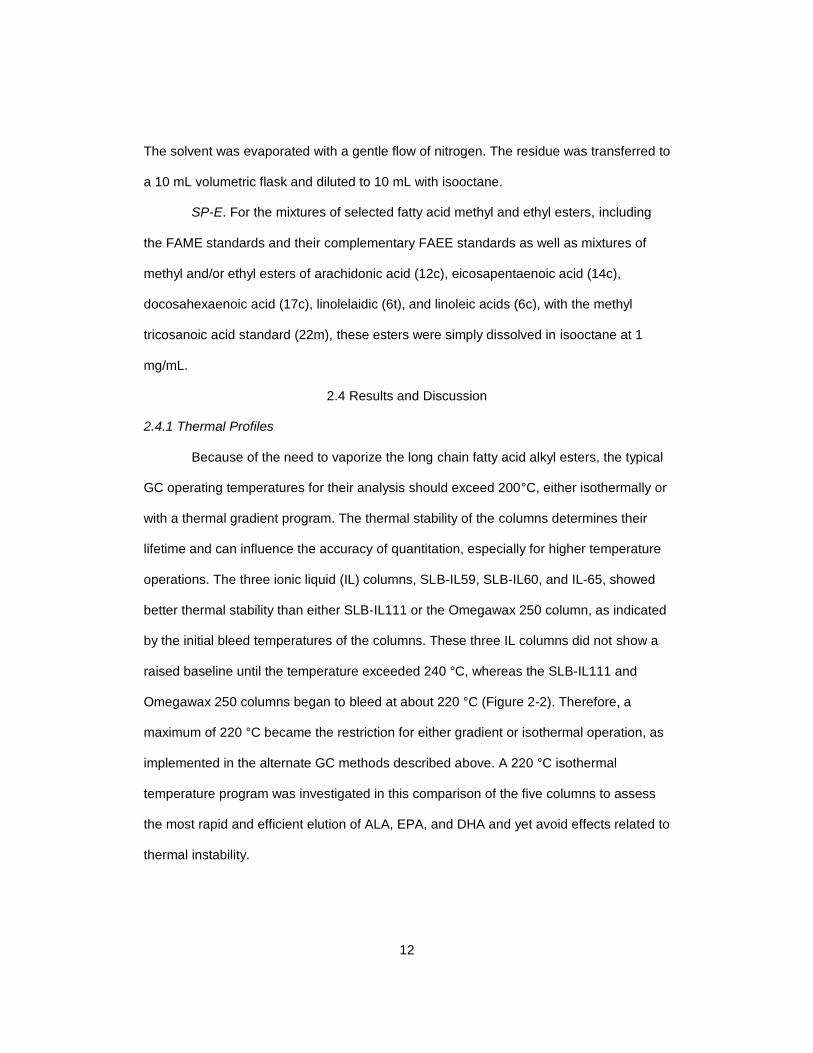
2.4.1 Thermal Profiles
Because of the need to vaporize the long chain fatty acid alkyl esters, the typical
GC operating temperatures for their analysis should exceed 200°C, either isothermally or
with a thermal gradient program. The thermal stability of the columns determines their
lifetime and can influence the accuracy of quantitation, especially for higher temperature
operations. The three ionic liquid (IL) columns, SLB-IL59, SLB-IL60, and IL-65, showed
better thermal stability than either SLB-IL111 or the Omegawax 250 column, as indicated
by the initial bleed temperatures of the columns. These three IL columns did not show a
raised baseline until the temperature exceeded 240 °C, whereas the SLB-IL111 and
Omegawax 250 columns began to bleed at about 220 °C (Figure 2-2). Therefore, a
maximum of 220 °C became the restriction for either gradient or isothermal operation, as
implemented in the alternate GC methods described above. A 220 °C isothermal
temperature program was investigated in this comparison of the five columns to assess
the most rapid and efficient elution of ALA, EPA, and DHA and yet avoid effects related to
thermal instability.
13
Figure 2-2 Temperature profiles for the Omegawax 250, SLB-IL111, SLB-IL65, SLB-IL
60, and SLB-IL59 columns
Gradient: 100 ˚C ramped at 10 ˚C/min to 300 ˚C
2.4.2 Retention Time and Selectivity
The SLB-IL111 column achieved baseline separations of methyl tricosanoate
(22m), ethyl eicosapentaenoate (14ce), and ethyl docosahexaenoate (17ce) within 5 min
at 220 °C (Figure 2-3A). The SLB-IL59 and SLB-IL60 columns showed very similar
retention times and selectivity toward these fatty acid ester compounds, whereas the
IL65 column had slightly longer retention times for these analytes at the same
temperature. Retention of methyl α-linolenic acid (7cm) was ≤5 min on all of the IL
columns, even at a lower temperature (180 °C) on SLB-IL111 (Figure 2-3B). Retention
times of all analytes on the four IL columns were 1/3rd-1/9th those observed with the
Omegawax 250 column. The selectivity of these separations for the five polar columns
and primary PUFAs relative to the internal standard methyl tricosanoate (22m) is shown

14
Figure 2-3 Chromatograms obtained from five polar capillary columns for rapid analysis
of three important diet-derived long-chain unsaturated fatty acids
Analyzed using method 1A, specified in Table 2-3, and preparation SP-E: (A)
chromatograms for the ethyl esters, ethyl eicosapentaenoate (14ce) (EPA) and ethyl
docosahexaenoate (17ce) (DHA), and the standard methyl tricosanoate (22m) (MT); (B)
chromatograms for α-methyl linolenate (7cm) (ALA)) and methyl tricosanoate (22m).
Method 1B was employed for ALA (7cm) on column SLB-IL111 to compensate for its
short retention time.
Table 2-4 Selectivity Factors of Fatty Acid Standards
The selectivity factors for standards M-ALA (7cm), E-EPA (14ce), and E-DHA (17ce) to
MT were determined using method 1A, and preparation SP-E, on 30 m columns.

15
Chromatograms illustrating these characteristics are shown in Figure 2-3. b) Because of
the diminished retention of the ALA standard on the SLB-111, the selectivity, efficiency,
and asymmetry were determined using method 1A for ALA dissolved in a
dichloromethane.
in Table 2-4. SLB-IL60 provides statistically improved selectivity for ALA, α-methyl
linolenate (7cm), and EPA, ethyl eicosapentaenoate (14ce), relative to the other three
columns, averaged, and similarly with SLB-IL111 for DHA, ethyl docosahexaenoate
(17ce), indicating that the more polar IL columns, with the least retention, retained
selectivity. Retention of analytes can be significantly affected by the choice of stationary
phase. The stationary phases with various ionic liquid functionalities provide a range of
polar interactions with the analytes distinct from those of PEG. SLB-IL111 had the
greatest polarity tested, which on the Mondello squalene-based polarity scale was nearly
double that for the SLB-IL59, SLBIL60, IL65, and PEG stationary phases, consistent with
the shortest retention times for the fatty acid esters. Retention of its high selectivity was
remarkable.
2.4.3 Peak Efficiency and Symmetry
The peak efficiencies, theoretical plates per meter, of each column for each
omega-3 analyte, and the internal standard followed were consistent with resolution
(Table 2-5).
GC Column M-ALA to MT b
(7cm to 22m) E-EPA to MT (14ce to 22m)
E-DHA to MT (17ce to 22m)
Omegawax 250 1.19 0.93 0.89
SLB-IL59 1.14 0.96 0.97
SLB-IL60 1.52 1.08 0.93
SLB-IL65 1.31 1.01 0.94
SLB-IL111 1.23b 1.04 1.06

16
Table 2-5 Peak/column efficiencies (plates/m)
Using the same conditions as Table 2-4. ‡) Because of the short retention time of ALA,
the efficiency was determined more accurately using a 60-meter column (SLB-111-60)
and preparation SP-E.
GC Column M-ALA (7cm)
E-EPA (14ce)
E-DHA (17ce)
MT (22m)
Mean Efficiency
Omegawax 250 3100 3500 3400 3300
3325
SLB-IL59 4000 4000 4200 3900 4025
SLB-IL60 5000 4300 5000 4800 4775
SLB-IL65 4200 4000 5200 4200 4400
SLB-IL111 4600‡ 4800 4500 4400 4567
Notably, the mean efficiencies of SLBIL60 and SLB-IL111 are greater than the mean
efficiencies of the three remaining columns, the latter maintaining efficiency even with its
considerably shorter retention times. Peak asymmetry, conventionally represented as As
and defined at 10% of the peak height,120 is undesirable, potentially compromising
efficiency, resolution, and quantitation. The Omegawax 250 and the two IL columns SLB-
IL60 and SLB-IL65 all have minimal asymmetry (Table 2-6). The source of the larger and
significant asymmetry of SLB-IL59 was reduced in SLB-IL60, where its highest efficiency
and best peak symmetry toward most of the analytes among the four IL columns are
noteworthy. This suggests that the source of the asymmetry is the silica surface, not the
ionic liquid. The significant asymmetry of SLB-IL111 also should be amenable to
deactivation of the silica. Whereas this ionic liquid has diminished interaction with the
analytes, indicated by its considerably reduced retention times, its interaction sites are
possibly slightly overloaded, suggesting a somewhat lower concentration might improve

17
efficiency. This increment of asymmetry does not compromise the column’s selectivity
significantly.
Table 2-6 Peak / column asymmetry
Using the same conditions as Table 2-4. The asymmetry is measured at 10% of the peak
height. The peak width is also that at 10% of the peak height. Because of the diminished
retention of the ALA standard on the SLB-111, the selectivity, efficiency, and asymmetry
were determined using Method 1A for ALA dissolved in a dichloromethane.
Column M-ALA (7cm)
E-EPA (14ce)
E-DHA (17ce)
MT (22m)
Mean As
Asymm Factor
(As)
Peak Width (min)
Asymm Factor
(As)
Peak Width (min)
Asymm Factor
(As)
Peak Width (min)
Asymm Factor
(As)
Peak Width (min)
Omegawax 250 0.91 0.14 1.22 .25 0.81 0.48 1.11 0.32 1.01 SLB-IL59 1.20 0.06 1.18 0.09 1.18 0.11 1.19 0.11 1.19 SLB-IL60 0.94 0.05 0.96 0.08 0.93 0.12 1.08 0.10 0.98 SLB-IL65 1.12 0.07 1.10 0.11 0.95 0.16 1.05 0.12 1.05 SLB-IL111 1.68* 0.12* 1.36 0.09 1.27 0.11 1.14 0.06 1.26
2.4.4 Quantitation of EPA and DHA in Fish Oil and ALA in Flaxseed Oil
Calibration curves and response factors were determined for both methyl and
ethyl esters of the three omega-3 fatty acids and methyl and ethyl tricosanoate (Table 2-
7). The response factor, F, was calculated using the following equation.
𝐹 =
𝑃𝐴𝑛𝐶𝐴𝑛𝑃𝑆𝑡𝐶𝑆𝑡
= 𝑚𝐴𝑛
𝑚𝑆𝑡 (eq. 2)
Where 𝑃𝐴𝑛 is analyte peak area; 𝐶𝐴𝑛 is analyte concentration; 𝑃𝑆𝑡 is standard peak area;
𝐶𝑆𝑡 is standard concentration; 𝑚𝐴𝑛 is the slope (peak are vs. concentration) of the
analyte; 𝑚𝑆𝑡 is the slope (peak are vs. concentration) of the standard. On rearranging, the
equation used for computing the concentration of analyte from the peak areas of internal
standard and analyte, known concentration of the standard, and the response factor is:

18
𝐶𝐴𝑛 = 𝑃𝐴𝑛
𝑃𝑆𝑡 ×
𝐶𝑆𝑡
𝐹 (eq. 3)
The response factors for the three analytes (methyl ester of tricosanoic acid, and ethyl
esters of eicosapentaenoic acid and docosahexaenoic acid) vs. tricosanoic acid as a
standard for the four IL and the carbowax columns are provided in Table 2-7.
The chromatograms in Figure 2-4A identify and quantify, using the corresponding
response factors, the omega-3 ethyl ester components in the source of fish oil for all five
columns. The quantification of EPA, ethyl eicosapentaenoate (14ce), and DHA, ethyl
docosahexaenoate (17ce), esters in the fish oil are compared with the manufacturer’s
labeled amount in Table 2-8. The response factors were larger for the methyl esters, but
limits of detection (LODs) were comparable (Table 2-7). Whereas all of the
determinations were in excess of the manufacturer’s label, the number of samples that
could be determined at a time with the SLB-IL111 would be about 6 times that which
could be determined with the PEG column. Furthermore, if greater emphasis were placed
on the spectrum of fatty acids present in a product, a slower elution achieved simply by
reducing oven temperature may be adequate (Figure 2-4B).
Quantitation of the ALA, α-methyl linolenate (7cm), methyl ester, using the same
approach, was established from the chromatograms in Figure 2-5A, and the results are
listed in Table 2-8. The α-methyl linolenate (7cm) and methyl tricosanoate (22m)
peaks were eluted within 6 min on SLB-IL111 at 180 °C and within 9 min on the other
three IL columns at 220 °C. The level of ALA in the acid form agreed with the
manufacturer’s specifications. Similarly, a more complete assessment of the other fatty
acid esters can be achieved with slower elution at lower oven temperature (Figure 2-5B).

19
Table 2-7 Ester-, Fatty acid-, and Column-dependent Response Factors and Limits of
Detection
Comparison of column and ester (Ethyl and Methyl) response factors and detection limits
for alpha-linolenic acid (ALA, 7c), eicosapentaenoic acid (EPA, 14c), docosahexaenoic
acid (DHA, 17c) and the MT standard (22). *) Method 1B was used for the analytical
method; otherwise, Method 1A was used.
Column Fatty Acid
Ethyl Ester Methyl Ester
Slope (mg /
(mL*AU)) RF
LOD (mg/mL)
Slope (mg /
(mL*AU)) RF
LOD (mg/mL)
Omegawax 250
ALA 182.3 0.96 0.015 183.1 1.2 0.012
EPA 177.0
0.94 0.015 173.2 1.13 0.017
DHA 169.1 0.89 0.021 160.5 1.05 0.016
MT 189.1 0.031 153.0 0.015
SLB-IL59
ALA 150.7 0.94 0.035 140.1 1.14 0.023
EPA 152.4 0.95 0.040 140.1 1.14 0.024
DHA 154.6 0.97 0.038 139.1 1.13 0.025
MT 160.0 0.035 122.9 0.019
SLB-IL60
ALA 151.5 1.12 0.041 145.5 1.39 0.022
EPA 143.8 1.06 0.058 137.9 1.32 0.016
DHA 127.5 0.94 0.072 127.5 1.22 0.023
MT 135.5 0.062 104.7 0.028
SLB-IL65
ALA 147.8 1.04 0.028 145.4 1.31 0.022
EPA 143.3 1.01 0.031 137.8 1.24 0.026

20
Table 2-7 Continued
Column Fatty Acid
Ethyl Ester Methyl Ester
Column Fatty Acid
Ethyl Ester Methyl Ester
Column Fatty Acid
Slope (mg /
(mL*AU)) RF
Slope (mg /
(mL*AU)) RF
SLB-IL65
DHA 133.0 0.93 0.019 126.3 1.14 0.033
MT 142.3 0.024 110.8 0.034
SLB-IL111
ALA 100.6* 1.34* 0.050*
EPA 126.8 1.04 0.018
DHA 129.5 1.06 0.016
MT 121.9 0.016 75.17* 0.045*

21
Figure 2-4 Chromatograms of commercial samples of fish oil esters.
(A) Chromatograms obtained using method 1A and preparation SP-C providing rapid
analyses of commercial samples of fish oil esters, adequate for the quantitation reported
in Table 2-8 of EPA (14ce), DHA (17ce), and the MT standard (22m) by five commercial
columns. (B) Chromatograms obtained using method 2, preparation SP-C, and the SLB-
IL111-60 column, providing high resolution of fatty acids in the commercial samples of
fish oil esters. The identities of the fish oil components were determined from mass
spectrometric total ion chromatograms.

22
Table 2-8 Concentrations of Important Fatty Acids in Fish and Flaxseed Oils
Concentrations (in mass % of free acid form) of EPA (14c) and DHA (17c) in fish oil,
using method 1A and preparation SP-C, and ALA (7c) in flaxseed oil, using method 1A
and preparation SP-D, measured on the five columns at 220 °C. No significant amounts
of ALA (7cm or 7ce) were noted in the commercial fish oil, Figure 2-4B, and no significant
amounts of EPA (14cm or 14ce) or DHA (17cm or 17ce) were noted in the commercial
flaxseed oil, Figure 2-5B and extensions of it to longer retention times. *) SLB-IL111
results were obtained using method 1B, not method 1A. †) Labeled amount is as the fatty
acid form in the product, ethyl ester for EPA and DHA, free acid for ALA.
Column Fish Oil Flaxseed Oil
% EPA (14ce) % DHA (17ce) % ALA (7cm) Experimental Labeled† Experimental Labeled† Experimental Labeled‡
Omegawax 250 38.7±0.1 42 20.6± 0.3 22 49.8±0.1 50 SLB-IL59 40.1±0.2 42 20.9± 0.1 22 50.3±0.1 50 SLB-IL60 41.9±0.3 42 21.5± 0.1 22 49.4±0.4 50 SLB-IL65 38.6±0.6 42 21.4± 0.1 22 51.2±0.7 50 SLB-IL111 38.3±0.6 42 20.6±0.6 22 49.0±0.7* 50

23
Figure 2-5 Chromatograms of commercial samples of flaxseed oil esters.
(A) Chromatograms obtained using method 1A and preparation SP-D providing rapid
analyses of commercial samples of flaxseed oil esters, adequate for quantitation reported
in Table 2-8 of ALA (7cm) and the MT standard (22m) by five commercial columns. (B)
Chromatograms obtained using method 2, preparation SP-D, and the SLB-IL111 30 m
column, providing high resolution of fatty acids in the commercial samples of flaxseed oil

24
esters. The identities of the flaxseed oil components were determined from mass
spectrometric total ion chromatograms.
Composition profiles of the two commercial products illustrate contrasts. The fish
oil sample contained a larger number of minor additional unsaturated fatty acids than
flaxseed oil. The total amount of these minor components often is a small fraction of the
major components and attributable to both sourcing and the esterification steps in the
refining of the raw material. Conversely, the few additional flaxseed components as a
whole approximate the amount of ALA, the primary omega-3 component. In addition,
flaxseed oil includes C18:1, C18:2, and saturated fatty acids.
Commercial products, as in the two previous examples, are often in one form,
whereas composite products and blends can exhibit multiple forms and generate an
additional level of complexity. Figure 2-6, an approximately 1:1 blend of flaxseed and fish
oil, is illustrative. This blend contains both methyl and ethyl esters of fatty acids of various
chain lengths, positional isomers and stereoisomers, and single to multiple levels of
unsaturation. The chromatogram in Figure 2-6, an isothermal run at 180 °C, is still
capable of separations for most of these mixed esters.

25
Figure 2-6 Chromatogram of an approximately 1:1 blend of flaxseed and fish oils
Chromatogram showing resolution and identification of the component fatty esters,
methyl esters from the flaxseed oil, and ethyl esters from the fish oil. The analysis
proceeded by using isothermal method 2 and preparation using SP-C and SP-D for the
fish oil and flaxseed oil, respectively, and the SLB-IL111-60 column. Co-elution of C18:1
ethyl esters of fatty acids 3ce and 4ce, the oleate and vaccinate, the cis-9 and cis-11
isomers, respectively, as well as 10 and 15, the C20:1 and C22:1 ethyl esters, and also
11 and 12, the C20:3 and C20:4 ethyl esters, was observed. Co-elution of methyl and
ethyl esters of the same fatty acid, stearates, 19m and 19e, also occurred.
Accurate quantitation of the major fatty acids was substantiated by comparison
with assessments provided by the NIST standard, SRM 3275 (Table 2-9).
Table 2-9 Comparison of mass ratios of four important fatty acid methyl esters found in
the NIST Standard Reference Material 3275-1 vs. the published ratios
Fatty Acid
Mass
Ratio
(mg / g)
Error % Error
Mass
Ratio
(mg / g)
Error % Error
ALA 1.2 0.03 2.6 1.21 0.05 4%
EPA 113 1 1.1 113 12 11%
DHA 417 7 1.6 429 15 3%
Methyl Ester
Determination
Methyl Ester
NIST Published Value
26
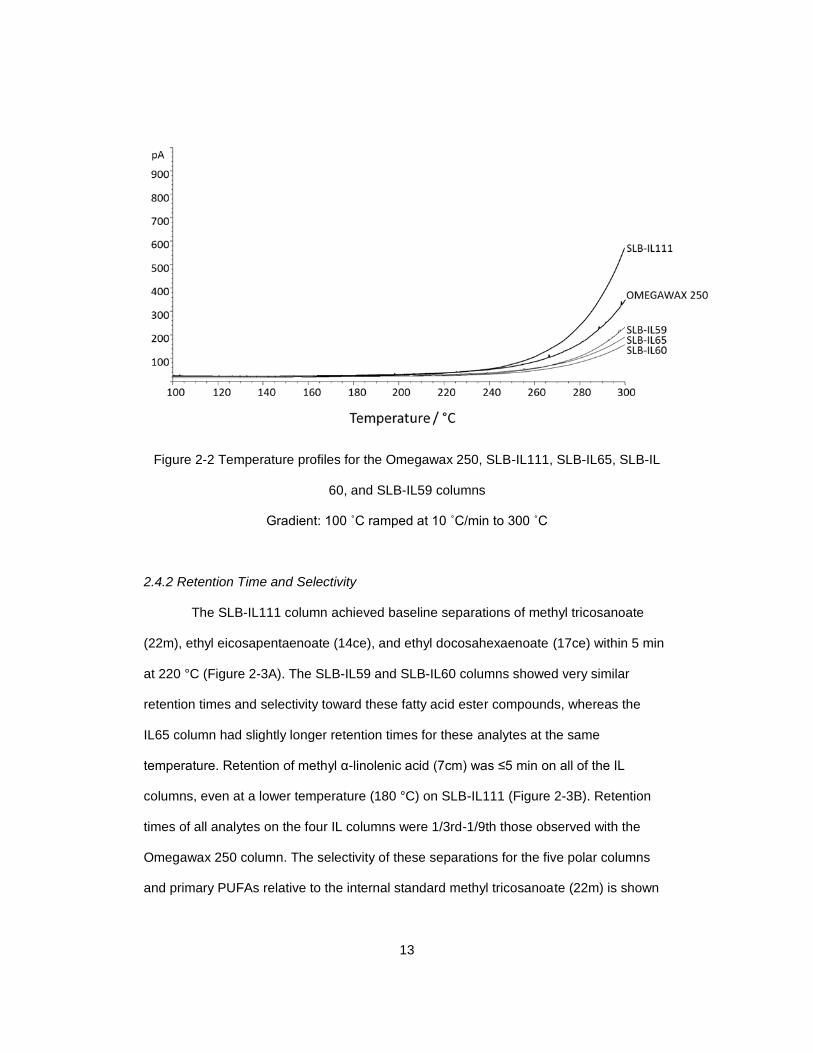
2.4.5 Separation of Arachidonic Acid (12c), Eicosapentaenoic Acid (14c), and
Docosahexaenoic Acid (17c)
The ratio of omega-3 to omega-6 fatty acids in human serum or blood, typically
extractable with an organic solvent such as hexane, has attracted great attention
because of observed correlations with the risk of certain diseases.121 The SLB-IL111
column is capable of resolving the esters of these fatty acids rapidly with baseline
separation and simple isothermal, 200°C, elution (Figure 2-7A).
Figure 2-7 Separation of Arachidonic Acid, Eicosapentaenoic Acid, Docosahexaenoic
Acid, trans linolelaidic acid, and cis linoleic acid

27
Comparative column performance: (A) separations by the five columns of the two C20
methyl esters, arachidonic acid (the C20:4, 12cm) from eicosapentaenoic acid (the
C20:5, 14cm) using an isothermal method, GC-M1 at 200 ˚C, and SP-E, both well
separated from docosahexaenoic acid ester (the C22:6,17cm); (B) separations by the five
columns of the two C18:2 methyl esters, the all-trans linolelaidic acid (6tm) from the all-
cis linoleic acid (6cm) using an isothermal method, GC-M1 at 200 ˚C, and SP-E.
2.4.6 Separation of Unconjugated cis- and trans-Fatty Acids
The all-trans-9,12 C18:2 linoelaidic acid ester (6t) and the all-cis-9,12 C18:2
linoleic acid ester (6c) were selected to test the ability of the five columns to resolve cis-
and trans-fatty acid isomers. The methyl esters of the two isomers were baseline
separated on the SLB-IL59 and SLB-IL60 columns at 200 °C, with selectivity improved for
SLB-IL60 (Figure 2-7B). Their partial separation on SLB-IL111 could be improved by
lowering the operating temperature further, possible because retention of the two
analytes was as short as 3 min. All of the IL columns but SLB-IL65 had better selectivity
toward cis- and trans-fatty acid isomers than the Omegawax 250 column.
2.4.7 Separation of Mixtures of Selected FAMEs/FAEEs
Preliminary assessment using a thermal gradient program for the separation of
11 selected FAMEs was performed on the 60 m SLB-IL111 column. The selected fatty
acid esters included three unconjugated C18:1 cis-trans pairs, an unconjugated C18:2
all-cis and all-trans pair, and three unconjugated long-chain all-cis polyunsaturated fatty
acid esters. A consistent pattern emerged showing increased retention with chain length,
ethyl esterification, degree of unsaturation, and cis isomerization, although with
nonequivalent increments for each characteristic, the consequence of which is some
coelution (Figure 2-8).

28
Figure 2-8 Separation of eleven C18, C20, and C22 fatty acids of varying structural
isomers and degree of unsaturation
The separation using thermal gradient elution, method GC-M3 and SP-E and the 60 m
SLB-IL111: (A) chromatogram for selected FAMES; (B) chromatogram for selected
FAEES. The fatty acid length, degree of unsaturation and location of bonds, and
stereoisomer is identified fatty acid number designation. Only one peak was an
unresolved co-elution, vaccenic (4tm) and petroselinic (2cm), consistent for both methyl
(A) and ethyl (B) ester pairs. While not all baseline separated, the elution pattern was

29
sufficient to infer increased retention with chain length, ethyl esterification, degree of
unsaturation, and cis isomerization.
2.4.8 Thermal Programs for Mixed Isomers and Esters
Consequently, thermal programs were evaluated for improving fatty acid ester
resolution. Several examples of alternate programs tested are summarized in Table 2-3,
methods 3-5, and a comparison of the chromatographic distinctions resulting from
reducing the final upper temperature is presented in Figure 2-9, panels A and B, the latter
with the lower temperature extending retention times and in some cases, such as the two
esters of arachidonic acid (12cm, 12ce), improving resolution and in others, such as the
two esters of palmitic acid (18m, 18e), degrading resolution. Note both of these programs
provide resolution of the two esters of ALA (8cm, 8ce) from one another and from GLA
(7cm). Both programs indicate the good baseline stability achieved by SLB-IL111i (Figure
2-8). Neither program, however, completely resolves all of the potential C18:1
stereoisomers and positional isomers as their methyl or ethyl esters. On comparing
retention time differences using Table 2-10, where the patterns of increments attributable
to chain length, isomerization, and esterification show variability, there is inevitability of
overlap. Adding another distinguishing characteristic, distinctions in absorbance in the
vacuum ultraviolet region of the spectrum, provides an attribute with the promise of
enhancing resolution.
2.4.9 Vacuum UV Detection for Additional Resolution
As discussed earlier, the functions of fatty acids and their metabolites are diverse
and significant and ultimately require comprehensive identification. We therefore utilized
the potential of additional resolution of the C18:1 family of fatty acids through application
of vacuum UV detection. To apply the analyses described above, determining the 𝑓𝑖′
values of eq 1, the vacuum UV absorbances of the standards, the 𝐴𝑖𝑟𝑒𝑓
(𝜆)′ values, were

30
Figure 2-9 Comparison of two thermal gradient programs
Both programs employ the constant pressure mode selected for method 5, explored to
achieve improved separation. Identical mixtures of chain lengths and esters were
selected, prepared using SP-E and evaluated on SLB-IL111i. (A) Chromatogram
achieved with method 4A, having higher final temperature, with the C18:1–C18:3 regions
compressed, although with little loss of resolution and with improved resolution for the
longer chain homologues. (B) Chromatogram achieved with method 4B, having lower
final temperature. Identification of the peaks, some of which indicate coelution, was
established from the elution characteristics of subsets of the standards.
31
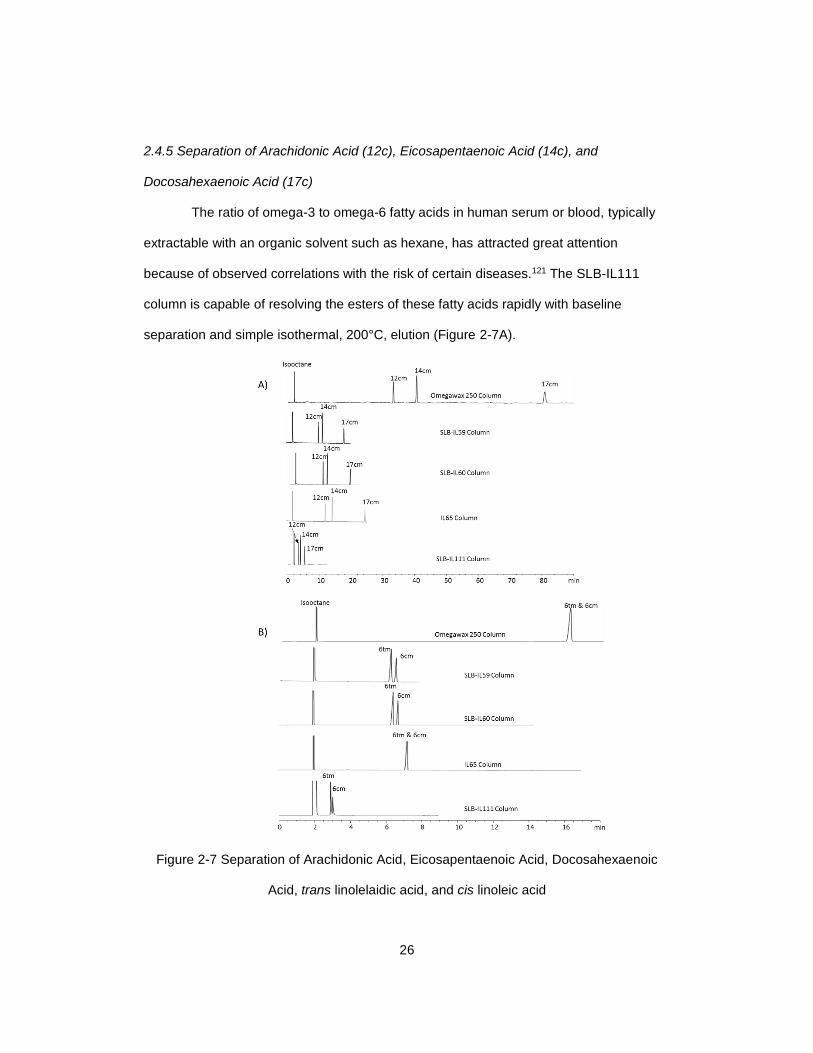
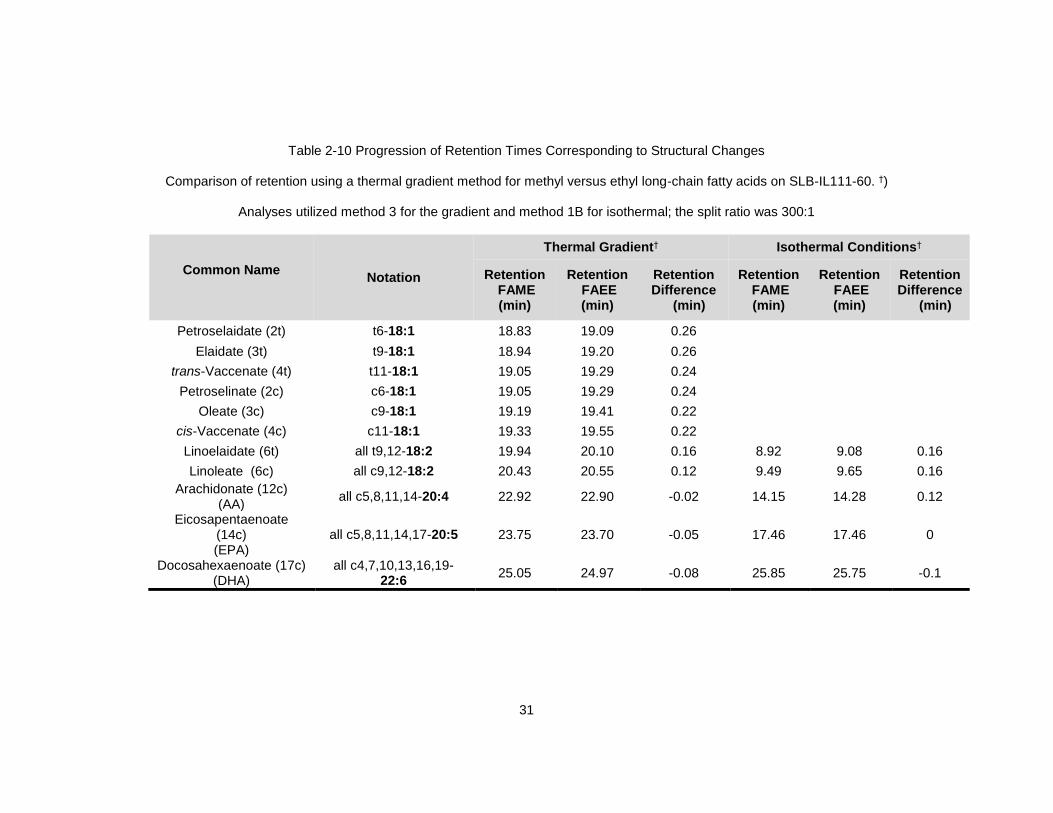
Table 2-10 Progression of Retention Times Corresponding to Structural Changes
Comparison of retention using a thermal gradient method for methyl versus ethyl long-chain fatty acids on SLB-IL111-60. †)
Analyses utilized method 3 for the gradient and method 1B for isothermal; the split ratio was 300:1
Common Name
Notation
Thermal Gradient† Isothermal Conditions†
Retention FAME (min)
Retention FAEE (min)
Retention Difference
(min)
Retention FAME (min)
Retention FAEE (min)
Retention Difference
(min)
Petroselaidate (2t) t6-18:1 18.83 19.09 0.26
Elaidate (3t) t9-18:1 18.94 19.20 0.26
trans-Vaccenate (4t) t11-18:1 19.05 19.29 0.24
Petroselinate (2c) c6-18:1 19.05 19.29 0.24
Oleate (3c) c9-18:1 19.19 19.41 0.22
cis-Vaccenate (4c) c11-18:1 19.33 19.55 0.22
Linoelaidate (6t) all t9,12-18:2 19.94 20.10 0.16 8.92 9.08 0.16
Linoleate (6c) all c9,12-18:2 20.43 20.55 0.12 9.49 9.65 0.16
Arachidonate (12c) (AA)
all c5,8,11,14-20:4 22.92 22.90 -0.02 14.15 14.28 0.12
Eicosapentaenoate (14c) (EPA)
all c5,8,11,14,17-20:5 23.75 23.70 -0.05 17.46 17.46 0
Docosahexaenoate (17c) (DHA)
all c4,7,10,13,16,19-22:6
25.05 24.97 -0.08 25.85 25.75 -0.1

32
evaluated. There were insufficient differences in the spectroscopic responses among the
methyl versus ethyl esters to distinguish them from each other; therefore, they need to be
separated chromatographically. However, on utilizing their spectroscopic composites,
there was adequate contrast to distinguish cis- from trans-isomers (Figures 2-10 and 2-
11).
Deconvolution of the overlapping C18:1 methyl and ethyl ester peaks in the
mixture analyzed in Figure 2-9 was achieved as illustrated by Figure 2-12 and quantified
in Table 2-11. There is good fidelity between the red composite curve, summed and from
the individual contributions of all of the isomers, with the black curve representing the
original chromatogram. The sum of the deconvoluted areas agrees with the sum of the
original eight chromatographic peaks to within 5%, supporting the utility of vacuum UV
detection and software for providing additional quantitation of mixtures of ever more
complex composition. Whereas in some instances there can be some loss in resolution
and efficiency (about 30% or higher) of equivalently resolved peaks, although only little
loss of selectivity (Figure 2-9 and 2-12), vacuum UV detection can provide
complementary resolution of unresolved peaks.
2.5 Conclusions
Our results support the versatility of ionic liquid gas chromatography for resolving
and quantifying either rapidly the primary PUFA esters or more thoroughly the full
complement of fatty acid components likely to be isolated from food, oil, or physiological
matrices. Supplementing FID with vacuum UV detection provides another increment of
resolution for evaluating even more complex mixtures, offering a component of method
independence as in the use of multiple column chromatography.122

33
Figure 2-10 Vacuum ultraviolet spectra resolved of the C18:1 fatty acids
Vacuum ultraviolet spectra resolved at 0.5 nm increments of the different positional and
stereo isomers of the methyl and ethyl esters of the C18:1 fatty acids that exhibit
significant overlap in the region from 19-21 minutes: (A) demonstrates the near
equivalence of all of the cis isomers of the C18:1 esters, methyl and ethyl not
distinguishable; (B) demonstrates the near equivalence of all of the trans isomers of the
C18:1 esters, again methyl and ethyl not distinguishable. For both panels the average
spectra are designated in red, and compared in Figure 2-11.

34
Figure 2-11 A comparison of the average cis and trans vacuum ultraviolet spectra of the
methyl and ethyl esters of the C18:1 fatty acids
The C18:1 fatty acids shown elute from 19-21 minutes in the chromatogram in Figure 2-
12, and that were generated and shown in Figure 2-10. These spectral responses are
sufficiently distinct to allow resolution of the cis and trans isomers, deconvolution of the
chromatographic components, and the quantification established in Figure 2-12 and
Table 2-10.

35
Figure 2-12 Separation of the mixture of selected FAMEs and FAEEs with vacuum UV
deconvolution
Separation of the mixture of selected FAMEs and FAEEs, consisting of C18, C20, and
C22 fatty acids of various structural isomers and degrees of unsaturation, determined
using the constant-pressure method 5 with the vacuum UV detector, preparation SP-E,
and column SLB-IL111i. The vacuum UV detection used 125–160 nm spectral filtering.
Some loss of resolution, observed on comparing the full chromatogram with that in Figure
2-9A, is attributable to the extra column band broadening associated with vacuum UV
detection. (Inset) Expansion of the C18:1 portion of the chromatogram attributed to the
identified and designated 12 fatty acid esters, 6 cis-isomers and 6 trans-isomers.
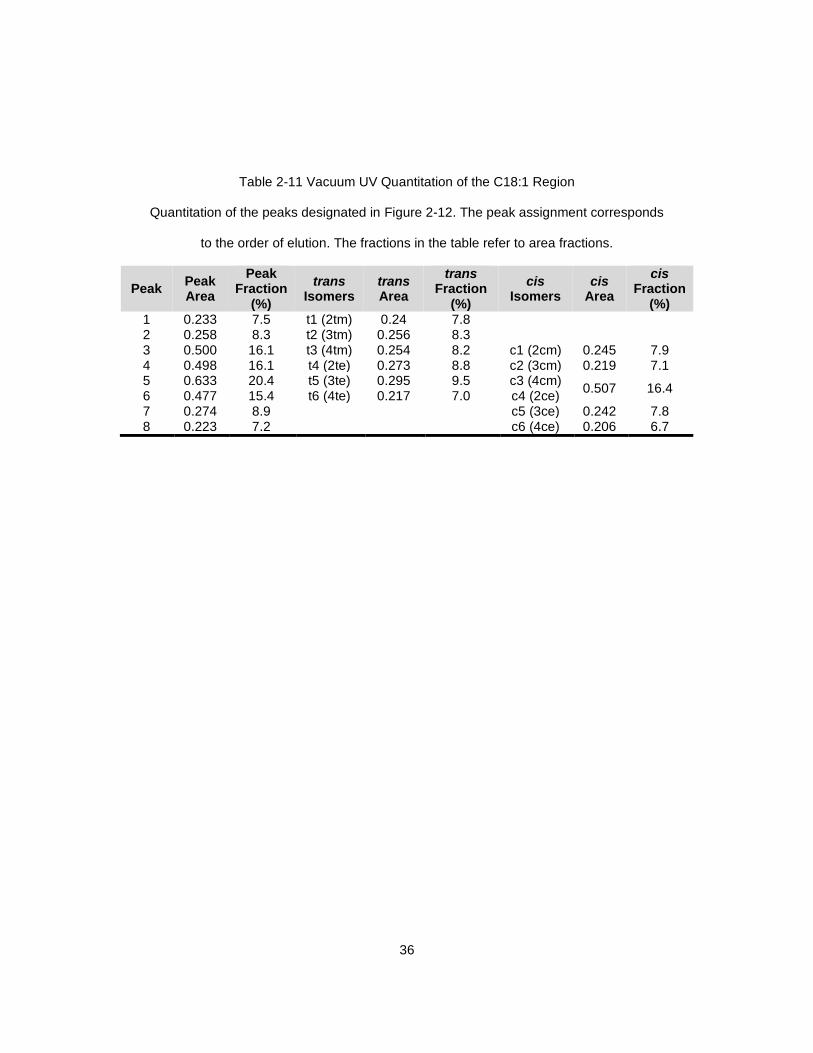
36
Table 2-11 Vacuum UV Quantitation of the C18:1 Region
Quantitation of the peaks designated in Figure 2-12. The peak assignment corresponds
to the order of elution. The fractions in the table refer to area fractions.
Peak Peak Area
Peak Fraction
(%)
trans Isomers
trans Area
trans Fraction
(%)
cis Isomers
cis Area
cis Fraction
(%) 1 0.233 7.5 t1 (2tm) 0.24 7.8 2 0.258 8.3 t2 (3tm) 0.256 8.3 3 0.500 16.1 t3 (4tm) 0.254 8.2 c1 (2cm) 0.245 7.9 4 0.498 16.1 t4 (2te) 0.273 8.8 c2 (3cm) 0.219 7.1 5 0.633 20.4 t5 (3te) 0.295 9.5 c3 (4cm)
0.507 16.4 6 0.477 15.4 t6 (4te) 0.217 7.0 c4 (2ce) 7 0.274 8.9 c5 (3ce) 0.242 7.8 8 0.223 7.2 c6 (4ce) 0.206 6.7

37
Chapter 3
Development and evaluation of gas chromatographic methods for the analysis of fatty
amines
3.1 Abstract
In contrast to the plethora of publications on the separation of fatty acids,
analogous studies involving fatty amines are scarce. A ionic-liquid-based capillary column
for GC was used to separate trifluoroacetylated fatty amines focusing on the analysis of a
commercial sample. Using the ionic liquid column (isothermal mode at 200°C) it was
possible to separate linear primary fatty amines from C12 to C22 chain length in less than
25 min with MS identification. The log of the amine retention factors are linearly related to
the alkyl chain length with a methylene selectivity of 0.117 kcal/mol for the saturated
amines and 0.128 kcal/mol for the mono-unsaturated amines. The sp2 selectivity for
unsaturated fatty amines also could be calculated as 0.107 kcal/mol for the ionic liquid
column. The commercial sample was quantified by GC with flame ionization detection
(FID). The analysis of the commercial sample returned results coherent with those
obtained by GC–FID and with the manufacturer’s data.
3.2 Introduction
Fatty amines are non-natural chemicals mainly produced industrially by
hydrogenation of fatty nitrile intermediates coming from naturally occurring fatty acids.
Commercially available fatty amines consist of mixtures of carbon chain lengths from C8
to C22 primary amines. The 2011 world production of fatty amines was about 800,000
metric tons, which is only 4% of the fatty acid world production (20 million tons).123 Fatty
amines are mainly used in home products such as fabric softeners, dishwashing liquids,
car wash detergents, or carpet cleaners. In industrial products, they are used as

38
anticaking agents for hydrophilic salts and/or fertilizers, flotation agents, dispersants,
emulsifiers and bitumen or asphalt additives, corrosion inhibitors, and fungicides,
bactericides or algaecides.124
In most of their industrial applications, fatty amines are used as mixtures of
homologues coming from a particular fatty acid natural source. Industrial companies sell
lines of alkyl amines giving only, as chemical description, the initial natural product.
Coconut amine, tallow amine or palmolein amine are actually mixtures of alkyl amines
containing a large amount, i.e. between 40 and 60%, of laurylamine (C12), palmitylamine
(C16), or oleylamine (C18 with a cis unsaturation), respectively, with significant amounts
of the even numbered saturated and/or unsaturated fatty amines surrounding the most
abundant homologue.125 Standard procedures for amine analysis using packed silicone
or apiezon grease columns for gas liquid chromatography were established in the
1960s.126–128 Although GC has significantly improved over the years, there are few
reports on the analysis of primary fatty amines in commercial products using state of the
art techniques.129 Further, it should be noted that it is particularly difficult to distinguish
between cis and trans fatty amine stereoisomers.130
The goal of this work is to evaluate the capability of a recently introduced new
class of stationary phases for GC (i.e. ionic liquid (IL)-based stationary phases) for their
ability to separate fatty amine components. IL capillary columns have rapidly become the
method of choice for the separation of fatty acid esters and, especially, fatty acid methyl
esters (FAMEs).131–133 This is due to their greater thermal stability, unique selectivity, and
resistance to degradation by water and oxygen.134–137 IL-GC capillary columns have
enhanced selectivity and fast separation at higher temperatures for FAME compounds
compared to classical columns. Just as fatty acids are esterified, fatty amines must also
be derivatized to form volatile species (herein by trifluoroacetylation) to be analyzed by
39
GC. It must be assessed if these IL-GC columns can produce similar analytical
improvements when working with fatty amines (i.e. trifluoroacetylated amide derivatives).
3.3 Materials and Methods
3.3.1 Chemicals
Dichloromethane, formic acid, ammonia, and the fatty amine standards,
dodecylamine (CAS 124–22–1), tetradecylamine (CAS 2016–42–1), pentadecylamine
(CAS 2570–26–5), hexadecylamine (CAS 143–27–1), and octadecylamine (CAS 124–
30–1), as well as 4-decylaniline (CAS 375–30–9) selected as the GC internal standard
(IS) were all obtained from Sigma–Aldrich, Saint Louis, MO. Trifluoroacetic anhydride
was from obtained TCI America, Portland, OR.
The commercial fatty amine sample was Corsamine® POD from CorsiTech,
Corsicana, TX. It is a distilled primary oleyl amine fraction obtained from natural oleyl
fatty acid.
3.3.2 Equipment
The gas chromatograph was a Model 6890 from Agilent Technologies, Santa
Clara, CA. The GC column was a 60 m, 250 µm id capillary column, coated with a 0.2 µm
layer of 1,5-di(2,3-dimethylimidazolium)pentane bis(trifluoromethylsulfonyl)imide, column
code SLB-IL111 from Supelco, Bellefonte, PA. Helium was the carrier gas throughout.
Electron impact MS was used as a qualitative detector for the identification of all fatty
amine components in the Corsamine® POD sample. Here the MS used was a 5875MSD
(Agilent), which was equipped with the NIST mass spectral search program 2.0 d.
Subsequent to the identification of all sample components by GC–MS, GC with flame
ionization detection (FID) was used for quantitation.
40
3.3.3 GC Procedure
All fatty amines were trifluoroacetylated. For derivatization, 10 mg of amine or
sample was added to 10 mg of the internal standard, 4-decylaniline, in a 3 mL capped
vial. One milliliter of dichloromethane was added to obtain a homogeneous mixture to
which 0.5 mL of trifluoroacetic anhydride was introduced. The vial was shaken for 5 min
at room temperature and the solvent and generated trifluoroacetic acid were evaporated
with dry argon. The residue was redissolved in 1 mL dichloromethane for manual
injection (0.5 L) into the GC–MS or GC–FID split injector (split ratio 50:1, temperature
300°C) on the 60 m SLB-IL111 capillary column maintained at a constant temperature of
200°C and constant helium flow of 1 mL/min. For FID detection, the detector was
maintained at 300°C. For electron impact-MS detection, 70 eV were used for ionization
with a full-scan range of 30–400 (m/z).
3.4 Results and Discussion
3.4.1 Gas chromatography separation of alphatic amines
Ionic liquids (ILs) are salts with melting points lower than 100°C.131,138–140 This
new class of non-molecular solvents have gained interest due to their low volatility and
versatility stemming from the fact that both anions and cations can be easily
interchanged. Recently, ILs have been introduced as GC capillary columns that range
from moderately polar to extremely polar stationary phases, some of which exceed the
polarity range of traditional polyoxyethylene wax and 1,2,3-tris(2-cyanoethoxy)propane
columns.138–143 They also can work up to a maximum temperature of 400°C, depending
on the nature of the IL, with very low bleed profiles with MS detection.131,141,142 The IL
column selectivity is also different from the classical polar columns.131,139,142–145

41
3.4.2 Saturated alkylamine column calibration
The IL-GC column was first used to separate the mixture of alkylamine standards
(i.e. C12, C14, C15, C16, and C18) at a temperature of constant 200°C and constant He
flow rate of 1 mL/min. Following Kovats, who developed an identification method based
on retention factors of homologues separated at constant temperature,146 the retention
factors, k, of a homologous series of compounds, such as the linear alkylamines, should
be related by:
lnk = ΔG/RT - lnVs/Vm (Eq. 1)
in which ΔG is the solute-free energy of transfer from the gas phase to the liquid
stationary phase and Vs and Vm are respectively the liquid stationary phase and helium
mobile phase volumes inside the capillary column. In the case of a homologous series,
the free energy of transfer, ΔG, can be expressed as the terminal group-free energy
(trifluoroacetamide in the case of the derivatized alkylamines) plus the methylene group
contribution proportional to n, the carbon chain length:
ΔG = ΔGNH3 + nΔGCH2 (Eq. 2)
Incorporating the terminal group contribution and the phase ratio in a constant A, Eqs. (1)
and (2) give the relationship:
lnk = A + n ΔGCH2/RT (Eq. 3)
in which ΔGCH2 is the “methylene selectivity” of the studied stationary phase and
homologous series easily obtained using the slope of the lnk versus alkyl chain length
plot.147
The isothermal analysis of five standards at 200°C on the 60 m SLB-IL111
capillary column gave retention times and retention factors that allowed preparation of a
linear lnk versus n plot [Eq. (3)] with a slope of 0.124, intercept of –1.034, and regression
coefficient r2 of 0.999. The column methylene selectivity for the alkylamines at 200°C

42
(473 K) is computed as ΔGCH2 = 488 J/mol or 0.117 kcal/mol. This regression line allows
one to predict the 200°C retention factor for alkylamines without having a pure standard
(e.g. for alkylamines with n = 11, 17, 19, 20, and longer).
3.4.3 Analysis of an industrial sample
Figure 3-1 GC–MS chromatograms of the trifluoroacetylated Corsamine POD® sample
Experimental conditions: 60 m column SLB-IL111 (0.25 mm id, 0.2 µm IL thickness);
carrier gas He constant average flow 1.0 mL/min, oven temperature isothermal 200°C,
injector temperature 300°C, injection volume 0.5 µL, split ratio 50:1, split injection liner

43
cup design packed with deactivated glass wool. (A) Full-scale chromatogram (total ion
current, TIC) of the sample plus 4-decylaniline as electron impact internal standard (IS);
(B) 50× amplified chromatogram of the same sample without internal standard. See
Table 1 for full identification. The blue arrow points to the coelution of a C17 and a C16:1
peak.
Figure 3-1 shows GC–MS chromatograms of the industrial sample Corsamine
POD® after trifluoroacetylation. GC–MS was used for peak identification of the mono and
polyunsaturated amines. The presence of a double bond in the alkyl chain is easily
detected by the mass spectrometer as it shows a molecular ion peak two m/z units
smaller than the saturated amine. Two double bonds correspond to a 4 m/z shift and so
on. By injecting a Corsamine POD® assay without the internal standard, it was
determined that some of the isomers of the C18:3 components (linolenylamines)
overlapped with the 4-decylaniline peak used as the internal standard (Fig. 3-1B).
The technical data sheet of the industrial alkylamine sample (Corsamine POD® )
states that it was obtained by hydrogenation of nitriles coming from oleyl fatty acids. The
fatty oleic acid C18:1 isomers cis and trans make more than 70% of the fatty acids
obtained from palm oil with a largely dominant cis–C18:1 isomer. Hence, the tallest peak
at 15.13 min, identified by MS to be indeed a C18:1 isomer, must be the cis-C18:1 isomer
(Fig. 3-1A). The smaller preceding peak at 4.3 min, also identified by MS as C18:1, must
be the trans isomer. Generalizing the observation that the most retained mono-
unsaturated alkylamine is the cis isomer, Table 3-1 lists the structures and retention data
of the experimentally obtained peaks shown in Fig. 3-1 along with the corresponding
molecular weights and retention factors.
Odd numbered alkylamines, namely, pentadecylamines and heptadecylamines
were identified by MS at retention times around 9.5 and 11.5 min, respectively (Fig. 3-

44
1B). Odd numbered fatty acids are only present in very small amounts in natural animal
fat or vegetable oils and it should be noted that small amounts of C15 (∼0.5% w/w) and
C17 (∼1% w/w) were reported in the industrial fatty acid batch used to produce the fatty
amine industrial sample.
Table 3-1 Peak identification in GC analysis of an industrial alkyl amine sample
Experimental conditions: 60 m column SLB-IL111 (0.25 mm id, 0.2 µm IL thickness);
carrier gas He constant average flow 1.0 mL/min, oven temperature isothermal 200°C,
injector temperature 300°C, injection volume 0.5 µL of trifluoroacetyl derivatives, split
ratio 50:1, FID temperature 300°C. Hold-up time used for retention factor computation is
2.93 min. Retention time of C13 was computed using the ln k versus nC line. No C13 was
found in the sample.
Code Compound Common Name M.W.Retention Time
(min)k
C12 Dodecylamine Lauryl 185.21 7.63 1.604
C12:1c 183.20 8.26 1.818
C13 Tridecylamine 199.23 (8.15) (1.783)
C14 Tetradecylamine Myristyl 213.25 8.79 2.002
C14:1c Myristoleyl 211.23 9.93 2.389
C15 Pentadecylamine 227.43 9.25 2.157
C15 227.43 9.54 2.256
C15 227.43 9.68 2.304
C15:1 225.41 10.95 2.739
C16 Hexadecylamine Palmityl 241.28 10.44 2.563
C16:1t 239.26 11.69 2.990
C16:1c Palmitoleyl 239.26 12.13 3.140
C17 Heptadecylamine Margaryl 255.29 11.57 2.949
C17:1c 253.27 13.37 3.563
C18 Octadecylamine Stearyl 269.31 12.78 3.362
C18:1t 267.29 14.30 3.881
C18:1c 9-Octadecylamine Oleyl 267.29 15.13 4.162
C18:2 265.28 17.24 4.884
C18:2 Linoleyl 265.28 17.49 4.969
C18:2 265.28 18.20 5.212
C18:3 263.26 21.10 6.201
C18:3 Linolenyl 263.26 22.20 6.577
C18:3 263.26 23.30 6.952
C20 Eicosanoylamine Arachidyl 297.34 15.40 4.256
C20 297.34 16.10 4.495
C20:1t 295.33 18.60 5.348
C20:1c 11-Eicosenoylamine Gondoyl 295.33 18.85 5.433
C22 Docosanoylamine Behenoyl 325.36 18.90 5.451
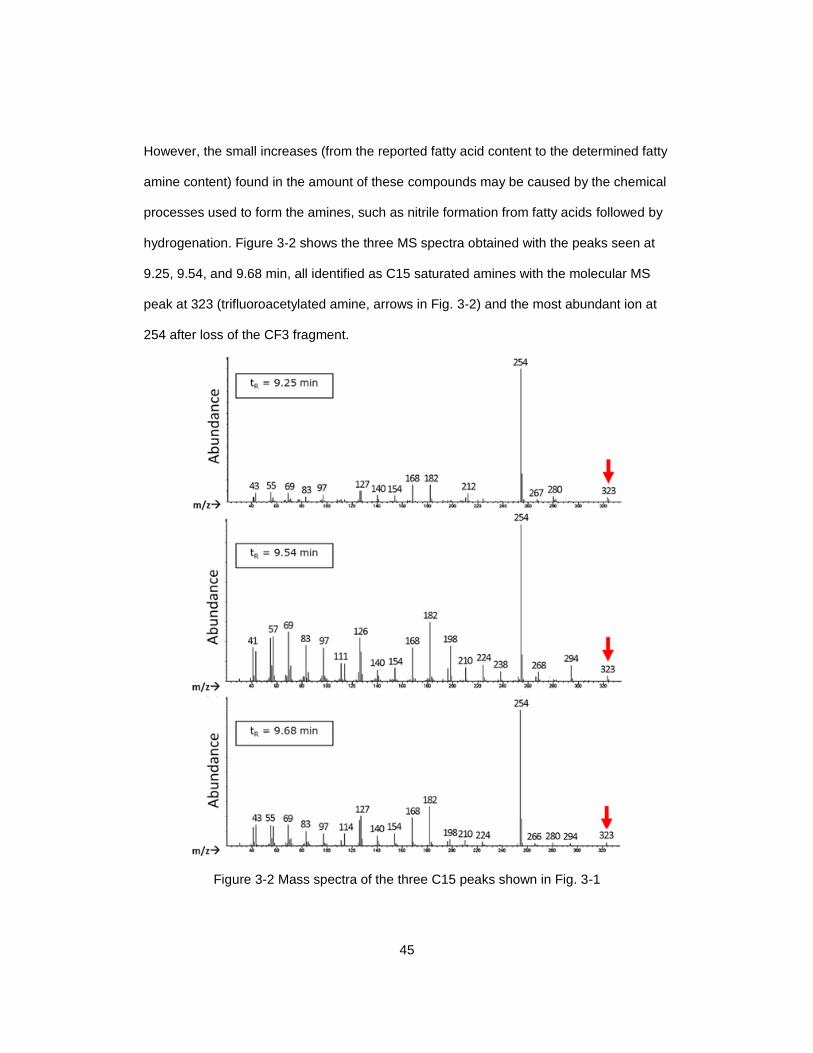
45
However, the small increases (from the reported fatty acid content to the determined fatty
amine content) found in the amount of these compounds may be caused by the chemical
processes used to form the amines, such as nitrile formation from fatty acids followed by
hydrogenation. Figure 3-2 shows the three MS spectra obtained with the peaks seen at
9.25, 9.54, and 9.68 min, all identified as C15 saturated amines with the molecular MS
peak at 323 (trifluoroacetylated amine, arrows in Fig. 3-2) and the most abundant ion at
254 after loss of the CF3 fragment.
Figure 3-2 Mass spectra of the three C15 peaks shown in Fig. 3-1

46
The arrow points the molecular ion at 323 (perfluoroacetylated pentadecylamine). The
most abundant peak at 254 corresponds to the loss of the CF3 group (69 m/z). See
Materials and Methods for additional mass spectrometer operating conditions.
The intermediate peak at 9.54 min was determined to be the linear C15 pentadecylamine
since its retention time falls exactly on the regression line obtained for the linear
alkylamines. Therefore, the remaining C15 saturated amines must be branched isomers.
3.4.4 Unsaturated alkylamines
The GC–MS did not allow for the differentiation of cis and trans isomers, but the
ionic liquid column separated them fully. With the clear identification of the cis-C18:1
isomer being more retained than trans-C18:1 and published similar results obtained with
FAMEs on IL columns,132,133,137 it is reasonable to assume that other cis isomers will elute
just after the corresponding trans isomer. With this assumption, the plot of the lnk values
for the cis mono-unsaturated alkyl amines, versus the alkyl chain length, returned a
straight line with a slope of 0.136, an intercept of –1.033, and a regression coefficient of
0.9995. The –1.033 value obtained for the intercept of the monounsaturated alkylamine
line is exactly the same as that obtained with the saturated alkylamine line. This result is
logical since the intercept corresponds to the trifluoroacetamide retention factor in both
cases [n = 0 in Eqs. (2) and (3)]. The 0.136 slope gives a methylene selectivity of ΔGCH2
= 545 J/mol or 0.128 kcal/mol, or 9% higher than the saturated alkyl methylene
selectivity.
It is also interesting to estimate the sp2 selectivity of the IL column to probe the
differences in separations due to the presence of unsaturated bonds in the fatty amine
structure. Making another assumption that the all-cis isomer of the C18 amines is the
most retained, the plot of the C18:X amine retention factors with X being 0

47
(stearylamine), 1 (oleylamine), 2 (linoleylamine), or 3 (linolenylamine) returned a straight
line with slope 0.114, intercept +1.196 and regression coefficient 0.9998. The sp2
selectivity is estimated with the slope of the line to be 448 J/mol or 0.107 Kcal/mol
keeping in mind that the sp2 carbon increment goes necessarily by two. This highly
regular effect is unique and apparently predictable for IL columns.
3.4.5 GC-FID quantitation
GC–FID was used to quantitate the studied fatty amine sample (Corsamine
POD®) rather than the GC–MS due to the significantly higher FID reproducibility. The
alkylamine standards (i.e. C12, C14, C15, C16, and C18) were used to calibrate the peak
areas produced by the FID detector. Taking into account the stated purities of the
standards, relative response factors (RRF) between 96 and 97% (relative to the 4-
decylanaline internal standard) were obtained. The concentration of fatty amines in the
industrial sample was determined by applying a 97% RRF to the experimental areas (i.e.
for analyte peak area and IS peak area) obtained. The MS detector established a
coelution of one isomeric form of C17 and one of C16:1 (blue arrow in Fig. 3-1B). Since
this coeluting peak was a very minor peak, it was estimated that 50% of the coeluting
peak was from the C17 species and 50% from the C16:1 species. Table 3-2 reports the
alkylamine amounts expressed in weight%, summing all identified isomers. As expected
for an amine sample coming from oleyl fatty acid, the dominant amine is oleylamine
C18:1 making up 71% w/w of the sample, both cis and trans isomers. A rough estimate is
that 78% of the C18:1 content is the cis isomer, thus making up 55.4% w/w of the total
Corsamine POD® sample.
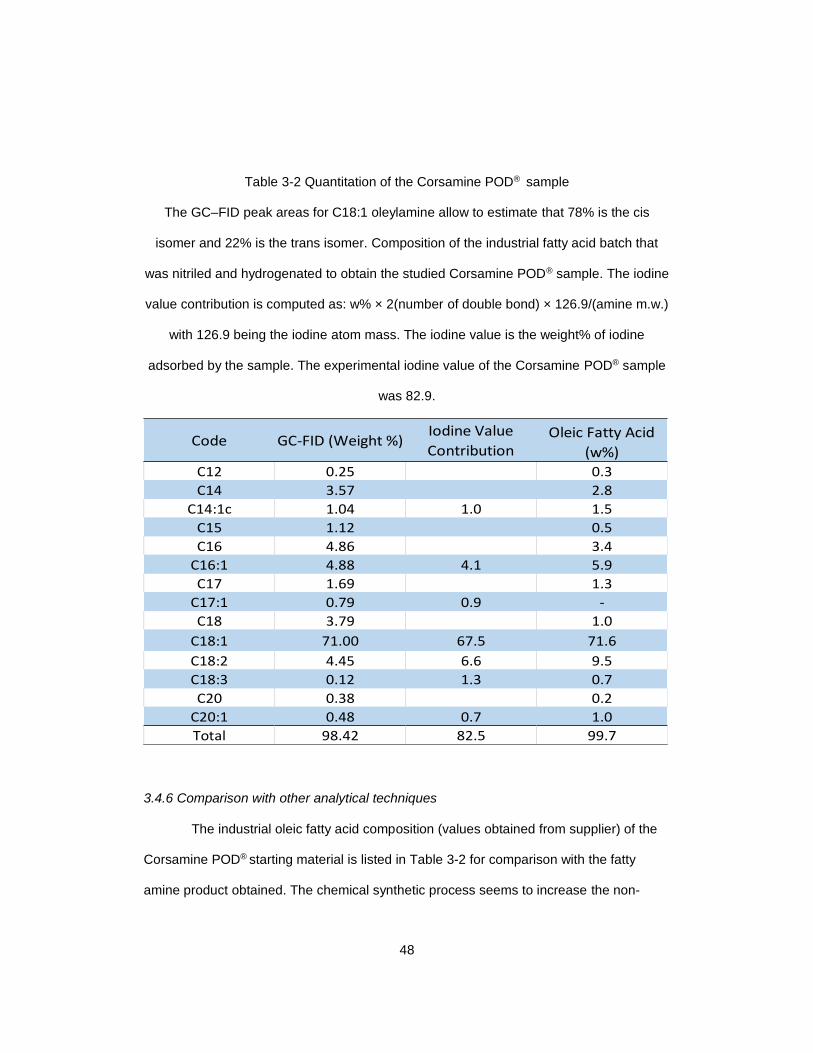
48
Table 3-2 Quantitation of the Corsamine POD® sample
The GC–FID peak areas for C18:1 oleylamine allow to estimate that 78% is the cis
isomer and 22% is the trans isomer. Composition of the industrial fatty acid batch that
was nitriled and hydrogenated to obtain the studied Corsamine POD® sample. The iodine
value contribution is computed as: w% × 2(number of double bond) × 126.9/(amine m.w.)
with 126.9 being the iodine atom mass. The iodine value is the weight% of iodine
adsorbed by the sample. The experimental iodine value of the Corsamine POD® sample
was 82.9.
Code GC-FID (Weight %)Iodine Value
ContributionOleic Fatty Acid
(w%)C12 0.25 0.3
C14 3.57 2.8
C14:1c 1.04 1.0 1.5
C15 1.12 0.5
C16 4.86 3.4
C16:1 4.88 4.1 5.9
C17 1.69 1.3
C17:1 0.79 0.9 -
C18 3.79 1.0
C18:1 71.00 67.5 71.6
C18:2 4.45 6.6 9.5
C18:3 0.12 1.3 0.7
C20 0.38 0.2
C20:1 0.48 0.7 1.0
Total 98.42 82.5 99.7
3.4.6 Comparison with other analytical techniques
The industrial oleic fatty acid composition (values obtained from supplier) of the
Corsamine POD® starting material is listed in Table 3-2 for comparison with the fatty
amine product obtained. The chemical synthetic process seems to increase the non-

49
natural C15 and C17 isomer concentrations with the presence of a C17:1 amine when
the C17:1 fatty acid was not reported in the starting material. Also the C18 contents are
somewhat different. It seems that the nitrile hydrogenation also hydrogenated some
double bonds of the alkyl chains: the C18:2 amine concentration, 4.4% w/w, is half what
the C18:2 fatty acid concentration was, 9.5% w/w. Also a significant increase in C18
amines (∼4% w/w) is observed compared to the initial 1% w/w C18 fatty acid (Table 3-2).
Other than that, the chain length profile of the fatty acid material matches that of the fatty
amine product produced.
The total primary amine weight percentage of the Corsamine POD® was also
found. This value was obtained by HCl titration of the amine sample, providing the total
amine value (TAV) of the sample. Next, the sample is reacted with salicylaldehyde.
Salicylaldehyde forms alkylimino methyl phenols with primary amines only.148 Secondary
and tertiary amines cannot react and, therefore, do not interfere with the primary amine
reaction. The mixture is titrated again by HCl for the secondary and tertiary amines giving
a V2/3 value. The primary amine percentage is given by: (TAV - V2/3)/TAV. In our case,
the V2/3 value for secondary and tertiary amines was almost nil and very close to the
blank value. Overall, the titration yielded a 98.7% primary amine content. Clearly, the
GC–FID method, which determined a 98.42% primary amine content, agrees with this
result. Of course, the GC method results in a complete understanding of each amine
component, whereas the titration only gives the total primary amine amount.
The iodine value of an oily sample is the weight percent of absorbed iodine
obtained by titration with an iodine/chlorine reagent (Wijs procedure).149 This value gives
an overall assessment of the amount of unsaturated bonds in the fatty amine sample.
The experimental titration gave an iodine value of 82.9. Counting the double bonds found
by the GC analysis, an iodine value of 82.5 is estimated (Table 3-2), corresponding well
50
with the experimental titration value. Again, the GC method gives more detailed
information about the unsaturated components than the iodine value does.
3.5 Conlusions
Gas chromatography yields comparable results and considerably more product
details than classical methods of analysis. The advantages of GC–FID on IL columns are
ease of quantification and high selectivity for separating closely related compounds and
isomers. The advantage of GC–MS is in identifying fatty amine compounds and isomers
for which there are no standards (qualitative analysis). The disadvantages of the GC
approach include the need for derivatization with trifluoroacetic anhydride and difficulties
in eluting trialkylamines, which cannot be derivatized.
51
Chapter 4
Rapid Analysis of Ethanol and Water in Commercial Products Using Ionic Liquid Capillary
Gas Chromatography with Thermal Conductivity Detection and/or Barrier Discharge
Ionization Detection
4.1 Abstract
Analysis of ethanol and water in consumer products is important in a variety of
processes and often is mandated by regulating agencies. A method for the simultaneous
quantitation of ethanol and water that is simple, accurate, precise, rapid, and cost
effective is demonstrated. This approach requires no internal standard for the quantitation
of both ethanol and water at any/all levels in commercial products. Ionic liquid based gas
chromatography (GC) capillary columns are used to obtain a fast analysis with high
selectivity and resolution of water and ethanol. Typical run times are just over 3 minutes.
Examination of the response range of water and ethanol with GC, thermal conductivity
detection (TCD) and barrier ionization detection (BID) is performed. Quantitation of both
ethanol and water in consumer products is accomplished with both TCD and BID GC
detectors using a non-linear calibration. Validation of method accuracy is accomplished
by using standard reference materials.
4.2 Introduction
Quantitation of ethanol and water is important in manufacturing, processing, and
quality control of many commercial products. Consumer products, such as, beer, wine,
liquor, mouthwash, and flavor extracts contain ethanol and water usually in concentration
ranges of 4 – 50 % (v/v) ethanol and 50 – 96 % (v/v) water. There is a need for a simple,
rapid, cost effective, precise, and accurate method for the quantitation of both ethanol
and water that will also enhance throughput, efficiency.150
52
An array of methods are used to quantitate ethanol and water and many of them
do so in two separate experiments (i.e., one for ethanol and one for water). Some of the
techniques used for the determination of ethanol consist of pycnometry151, densimetry151,
refractive index analysis152,153, dichromate oxidation spectrophotometry 154,155, enzymatic
methods156–159, modular Raman spectrometry160, near-infrared spectroscopy152,161–163,
capillary electrophoresis164, high performance liquid chromatography165,166, gas
chromatography (GC)154,167–173, and flow injection analysis174–176. These techniques used
for ethanol determination have some disadvantages such as long analysis time, low
reproducibility, and complexity.151,158,160 For example, ethanol determination using
pycnometry, densimetry, and dichromate oxidation spectrophotometry require a large
amount of sample and moderate to long analysis times.151,155,167 Refractive index analysis
of ethanol is simple but is applicable only for simple solvents, and requires good
temperature stability for method precision.153 Characteristically enzymatic methods have
low accuracy, low reproducibility, and low stability of the enzyme substrate.158 Modular
Raman spectrometry requires laser precautions and has detection limits of only 1 % (v/v)
ethanol.160 Capillary electrophoresis yields lower precision compared to GC.164 Near-
infrared spectroscopy can be time consuming and requires complex calibration
procedures.152,162 Gas chromatography is the best suited analytical technique to yield the
goal of a simple, accurate, precise, rapid, and cost effective method.167,169,173
Early quantitation of ethanol in commercial products were performed by gas
chromatography equipped with flame ionization detectors.171,177 Quantitation methods
consisted of an internal standard, n-butanol, and packed column GC (e.g. Poropak Q, 50-
80 mesh177 or 3 % Carbowax 600 on Chromosorb T, 40-60 mesh171). These packed
columns had low resolution. The official method of analysis of the AOAC utilized packed
columns and the same aforementioned methodology.178 There are methods that use
53
capillary open tubular GC column to achieve fast and more efficient quantitation of
ethanol. These methods use an internal standard such as n-propanol.167,173
Some of the techniques used for the determination of water consist of fluorine
nuclear magnetic resonance spectroscopy179, gas chromatography180–189, gravimetry190,
isotope ratio mass spectrometry 191, Karl Fischer titration192,193, near infrared
spectroscopy180,194–196, solvatochromic sensing191,197, and many others. The most widely
used method for the determination of water is the Karl Fischer titration. It has limitations
that prevent it from being a universal method. These limitations include sample
insolubility198, pH problems180, reagent instability199, and interferences from side
reactions185. Gas chromatography is a method that can overcome these problems.
Early quantitation of water using gas chromatography consisted of methods
using packed molecular sieve columns, and these methods used direct detection with
thermal conductivity detectors (TCD)183–185,187,189 and indirect detection methods
(acetylene produced from water reacting with calcium carbide) with flame ionization
detector181. These methods yielded poor peak symmetry, poor sensitivity, and poor
efficiency due to the strong adsorption of water to the stationary phase. To improve peak
symmetry capillary GC columns were used186, however, virtually all GC stationary phases
are degraded by water although bonded and cross-linked varieties are somewhat more
stable.200
The aim of this work is to develop a method for the simultaneous quantitation of
ethanol and water that is simple, accurate, precise, rapid, and cost effective. This is done
by using the response of water or ethanol to normalize reproducibility from injection to
injection instead of using an internal standard. The use of water in the gas
chromatographic quantitation of commercial products that contain both water and ethanol
has been ignored mainly due to the high concentrations of water present in most
54
samples. The concentration of water can exceed the linearity of the detectors, and it can
only be observed by a few detectors.201
Gas chromatography detectors suitable for water detection are thermal
conductivity detectors and ionization detectors that can produce energies higher than
12.6 eV (the ionization energy of water). Helium ionization detectors202 and barrier
discharge ionization detector (BID)203 are examples of GC ionization detectors. The
detectors used in this study were the thermal conductivity detector and barrier discharged
ionization detector. The TCD is widely used and available. The BID is chosen because of
its high sensitivity to water and being optimally designed to reduce baseline fluctuation.203
It was reported that the BID is 100 times more sensitive to water than the TCD.204 It is
known that TCDs are non-linear at high concentrations of water and ethanol.201 The
degree of linearity of the BID response to water and ethanol has not been reported.
Column considerations for water analysis consist of column stability, peak
efficiency and symmetry, and selectivity between water and ethanol. Armstrong et al.
showed that new ionic liquid (IL) based GC capillary columns have far superior selectivity
and stability towards water in all solvents tested as compared to traditional commercial
columns.205–212 In addition the ionic liquid column containing bis-3-
hydroxyalkylimidazolium-polyethylene glycol triflate (SLB-IL107) is shown to have good
peak shape and symmetry for water.205
Herein we outline an effective and accurate method for the quantitation of both
ethanol and water at any/all levels in commercial products. Typical run times are just over
3 minutes. This report examines the determination of ethanol and water in commercial
products using their individual responses rather than an internal standard to improve
method precision. Examination of the responses of water and ethanol over a broad range
of concentrations, with the TCD and BID GC detectors are performed. To our knowledge
55
this is the first report that uses: (a) both the responses of water and ethanol to maintain
method precision, (b) a non-linear based calibration, (c) ionic liquid based GC capillary
columns, and (d) a barrier discharged ionization detector in the simultaneous
determination of ethanol and water in a variety of commercial products.
4.3 Materials and Methods
4.3.1 Materials
Chemicals. Anhydrous 200 proof ethanol was purchased from Sigma-Aldrich
(Milwaukee, WI, USA). Deionized water was produced by a Milli-Q system (Billerica,
MA,USA).
Standards. Standard reference materials were purchased from National Institute
of Standards and Technology (NIST, Gaithersburg, MD, USA): 1847, ethanol-water
solution set. The NIST2 sample contained 1.55 ± 0.02 mass percent ethanol, NIST6
contained 6.04 ± 0.04 mass percent ethanol, and NIST25 contained 25.2 ± 0.2 mass
percent ethanol. Ethanol reference standards also were purchased from Sigma-Aldrich
(Milwaukee, WI, USA): E2385, ethanol standards 10% (v/v), and this sample was
identified in this work as Sigma10. Sigma-Aldrich reported Sigma10 to contain 7.7 mass
percent ethanol.
Samples. The commercial products, such as, beer, wine, liquor, mouthwash, and
flavor extracts used was Bud Light (Anheuser-Busch Inc., St. Louis, MO, USA),
Chardonnay (Gallo Family Vineyards, Modesto, CA, USA), Crown Royal (The Crown
Royal Company, Norwalk, CT, USA), Scope Mint (Procter & Gamble Company,
Cincinnati, OH, USA), and pure almond extract (Penzeys Spices, Arlington, TX, USA).
Gas Chromatography-TCD. Gas chromatography was performed with an
Agilent 6890N gas chromatograph equipped with a thermal conductivity detector and a
7683B series autosampler (Agilent Technologies, Inc., Santa Clara, CA, USA).

56
Gas Chromatography-BID. Gas chromatography was performed using a
Shimadzu Tracera GC system consisting of a Shimadzu barrier discharge ionization
detector (BID) coupled with a Shimadzu GC-2010 Plus capillary gas chromatograph and
a Shimadzu AOC-5000 liquid GC injection system (Shimadzu Corporation, Kyoto,
Japan).
Gas Chromatography Column. The column selected for all analyses was bis(3-
hydroxyalkylimidazolium)-polyethylene glycol triflate: SLB-IL107, 30 m × 0.25 mm i.d. ×
0.20 μm (Supelco, Bellefonte, PA, USA).
Software. The chromatographic software analysis was performed on an Agilent
ChemStation Rev. B.01.03 (Agilent Technologies, Inc., Santa Clara, CA, USA) and
Shimadzu GCsolution version 2.41 (Shimadzu Corporation, Kyoto, Japan). The nonlinear
regression was completed using Microsoft Excel 2013 (Microsoft Corporation, Redmond,
WA, USA). The calculations for solving the polynomials was performed using Wolfram
Mathematica 9 (Wolfram Research, Champaign, IL, USA).
4.3.2 Methods
Gas Chromatography-TCD. Instrumental conditions were isothermal at 110 ˚C,
constant flow 1 mL/min, 0.1 μL injection, split 100 : 1 or 200:1, TCD and inlet at 250 ˚C,
and column selection of bis-3-hydroxyalkylimidazolium-polyethylene glycol triflate: SLB-
IL107, 30 m x 0.25 mm ID x 0.20 μm (Supelco, Bellefonte, Pa).
Gas Chromatography-BID. Instrumental conditions were isothermal at 110 ˚C,
flow 1 mL/min, 0.1 μL injection, split 100 : 1 or 200:1, BID and inlet at 250 ˚C, and column
selection of bis-3-hydroxyalkylimidazolium-polyethylene glycol triflate: SLB-IL107, 30 m x
0.25 mm ID x 0.20 μm (Supelco, Bellefonte, Pa).
Standards. Ethanol and water standards for calibration were made
gravimetrically using anhydrous ethanol and water with the concentration in mass percent

57
(m/m). Conversion of concentration to volume percent (v/v) was performed by density
values at measured temperatures.
Samples. All commercial samples and standards were injected neat.
Calculations. The retention factor (k) was calculated using k = (tr – to)/tr, where tr
is the retention time, to is the dead time, which is determined by the air peak in TCD and
BID. Selectivity (α) was calculated by α = k2/k1, where k1 and k2 are the retention factors
of the first and second species. The resolution (Rs) was determined using Rs = 2 x (tr2 –
tr1)/(w1 + w2), where w1 and w2 is the base peak width of the first and second species.
Efficiency or plate count, N, was determined by N = 16 (tr/wb)2 where wb is the width at
the base of the peak tr is the retention time of the analyte. Peak symmetry factor, As, was
determined by As = b/a, where b is the distance from the point at peak midpoint to the
trailing edge of the peak measured at 10% of peak height and a is the distance from the
leading edge of the peak to the midpoint of the peak measured at 10% of peak height.
4.4 Results and Discussion
The separation of ethanol and water standards were obtained in under 3.5 min
(Figure 4-1) using a capillary ionic liquid column at isothermal conditions of 110 ˚C.
Chromatographic data is shown in Figure 4-1. Peak symmetry factors (As) for ethanol and
water were 0.95 and 1.3, respectively. Selectivity (α) between ethanol and water is 1.6,
and resolution (Rs) between ethanol and water is 6.4. The chromatographic data shows
excellent selectivity between ethanol and water and excellent method resolution. Injector
considerations are important when water is a large component of the injected sample.
Water can cause inlet backflash given its large expansion volume.200 The direct injection
of water requires small injection volumes and appropriate inlet liner selection. The inlet
liner used is a cup style liner with glass wool that allowed turbulent flow for adequate
sample vaporization and mixing. Injection volume was chosen to be 0.1 μL to avoid

58
backflash and error in quantitation. The split ratio was adjusted between 100:1 and 200:1.
The calibration and quantitation used a split ratio of 200:1. To investigate column stability
a standard consisting of 10 percent by mass ethanol and 90 percent by mass water was
injected 800 times on the SLB-IL107 ionic liquid capillary column. The chromatogram at
injection one is overlaid with the chromatogram at injection 800 (Figure 4-2). No changes
in column performance can be seen.
Figure 4-1 Chromatographic separation and data of ethanol and water using thermal
conductivity detector (TCD).
Instrument conditions were isothermal at 110 ˚C, flow 1 mL/min, 0.1 μL injection, split
100:1, sample 60 % ethanol and 40 % water (m/m), TCD and inlet at 250 ˚C, column
SLB-IL107 (30 m x 0.25 mm ID x 0.20 μm). See method section for the equations of
retention factor (k), plate count (N), peak asymmetry factor (As), selectivity (α), and

59
resolution (Rs). *Selectivity and resolution is calculated using the ethanol and the water
peak.
Figure 4-2 Column stability after 800 injections of a sample containing 10 percent by
mass ethanol and 90 percent by mass water.
Chromatographic separation using thermal conductivity detector (TCD). Instrument
conditions were isothermal at 110 ˚C, flow 1 mL/min, 0.1 μL injection, split 100:1, TCD
and inlet at 250 ˚C, column SLB-IL107 (30 m x 0.25 mm ID x 0.20 μm).
4.4.1 Method Range
The method range can be seen in Figure 4-3. The concentrations of water and
ethanol are usually high in commercial products, such as, beer, wine, liquor, mouthwash,
and flavor extracts. Consequently, an examination of the method response to water and
ethanol over a broad range of concentrations was performed. Consequently, an

60
examination of the method response to water and ethanol over a broad range of
concentrations was performed.
Figure 4-3 Water and ethanol method range
(A) Thermal conductivity detector (TCD) experimental linear range of peak area
response versus mass percent of ethanol and water. TCD was set at 250 °C.
Water showed a nonlinear response that yielded a polynomial best fit equation y
= 0.0072x2 + 2.2633x - 2.0212 with a square correlation coefficient of 0.9984.
Ethanol showed a linear response that yielded a best fit equation y = 2.2523x +
9.4708 with a square correlation coefficient of 0.993. (B) Barrier discharge
ionization detector (BID) experimental linear range of peak area response versus
mass percent of ethanol and water. BID was set at 250 °C. Water showed a
linear response that yielded a best fit equation y = 100786x + 88459 with a

61
square correlation coefficient of 0.997. Ethanol showed a nonlinear response that
yielded a polynomial best fit equation y = -797.35x2 + 251945x - 76451459 with a
square correlation coefficient of 0.9996. For both panels A and B, the standards
consisted of a binary solution of water and ethanol that ranged in concentration
from 0 to 100 mass %. See Materials and Methods for method details.
Analysis using TCD, shown in Figure 4-3A, produced a non-linear plot of the
peak area of water vs. concentration of water (m/m) at a split ratio of 200:1, whereas,
ethanol shows linearity through all concentrations. The TCD nonlinear response of water
is due to the high concentration of water saturating the TCD flow cell, and this causes a
positive deviation from linearity. In addition, the response of water is linear at
concentrations lower than approximately 50% by mass.
Performing the same analysis using a BID (see Materials and Methods and
Figure 4-3B) shows a nonlinear plot for the peak area of ethanol versus concentration at
a split ratio of 200:1, whereas water shows a linear range through all concentrations. The
BID nonlinear response of ethanol is due to the ionizability of water as compared to
ethanol. The ionization energies of water and ethanol are 12.6 and 10.6 eV, respectively.
The ionization energy of water is higher compared to that of ethanol, and thus the BID is
more sensitive to ethanol than to water. The nonlinear response of ethanol using the BID
is due to the saturation of the detector causing a negative deviation from linearity due to
the ease of ionizability of ethanol. The linearity in the BID detectors also is dependent on
the gas phase concentration of ethanol or water in the detector cell. In addition, the BID
response to ethanol is linear at concentrations lower than approximately 30% by mass.
A study was performed to observe changes in the linear range in the TCD and
BID by adjusting the split ratio from 200:1 to 100:1 (Figures 4-3-, 4-4, and 4-5). The

62
decrease in the split ratio to 100:1 reduced the linear range of both the TCD response to
water and the BID response to ethanol by almost 10 mass %.
Figure 4-4 Thermal conductivity detector (TCD) experimental linear range of peak area
response vs. mass percent of ethanol and water.
Instrument conditions were isothermal at 110 ˚C, flow 1 mL/minute, 0.1 μL injection, split
100 : 1, TCD and inlet at 250 ˚C, column SLB-IL107 (30 m x 0.25 mm ID x 0.20 μm). The
standards consisted of a binary solution of water and ethanol that ranged in concentration
from 0 to 100 mass percent. Water showed a nonlinear response that yielded a
polynomial best fit equation y = 0.0743x2 + 8.0618x + 24.478 with a square correlation
coefficient of 0.9948. Ethanol showed a linear response that yielded a best fit equation y
= 11.075x + 14.832 with a square correlation coefficient of 0.9988.
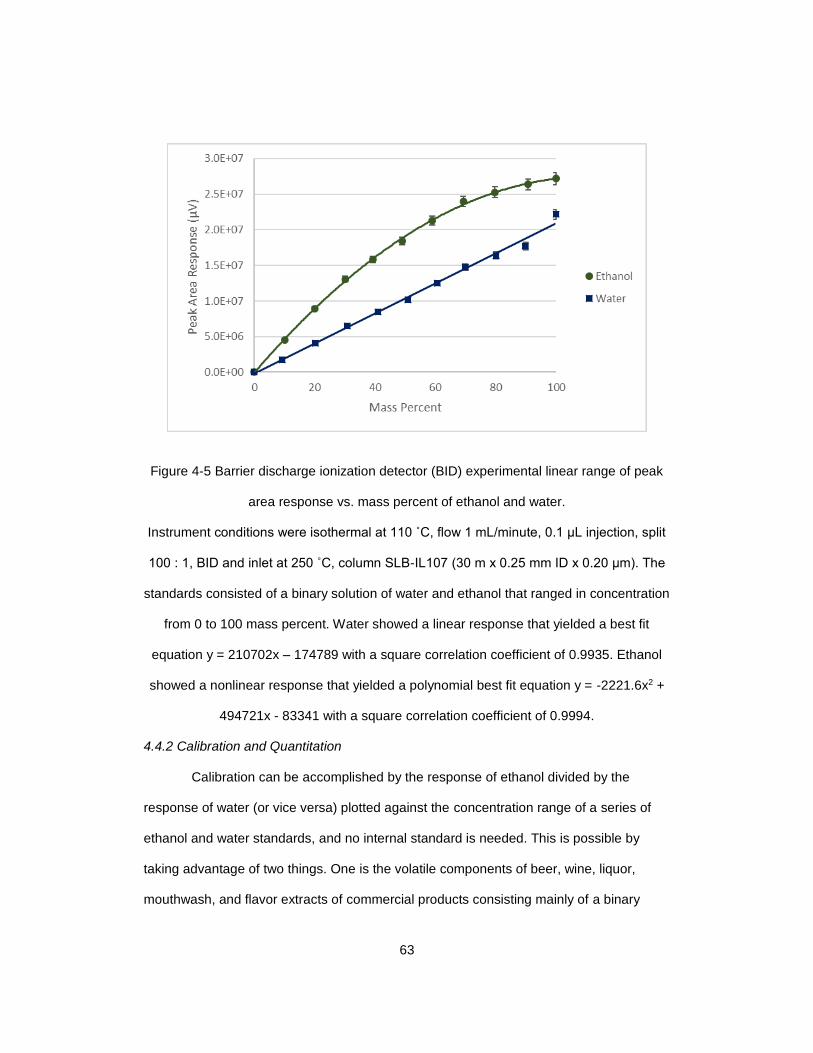
63
Figure 4-5 Barrier discharge ionization detector (BID) experimental linear range of peak
area response vs. mass percent of ethanol and water.
Instrument conditions were isothermal at 110 ˚C, flow 1 mL/minute, 0.1 μL injection, split
100 : 1, BID and inlet at 250 ˚C, column SLB-IL107 (30 m x 0.25 mm ID x 0.20 μm). The
standards consisted of a binary solution of water and ethanol that ranged in concentration
from 0 to 100 mass percent. Water showed a linear response that yielded a best fit
equation y = 210702x – 174789 with a square correlation coefficient of 0.9935. Ethanol
showed a nonlinear response that yielded a polynomial best fit equation y = -2221.6x2 +
494721x - 83341 with a square correlation coefficient of 0.9994.
4.4.2 Calibration and Quantitation
Calibration can be accomplished by the response of ethanol divided by the
response of water (or vice versa) plotted against the concentration range of a series of
ethanol and water standards, and no internal standard is needed. This is possible by
taking advantage of two things. One is the volatile components of beer, wine, liquor,
mouthwash, and flavor extracts of commercial products consisting mainly of a binary
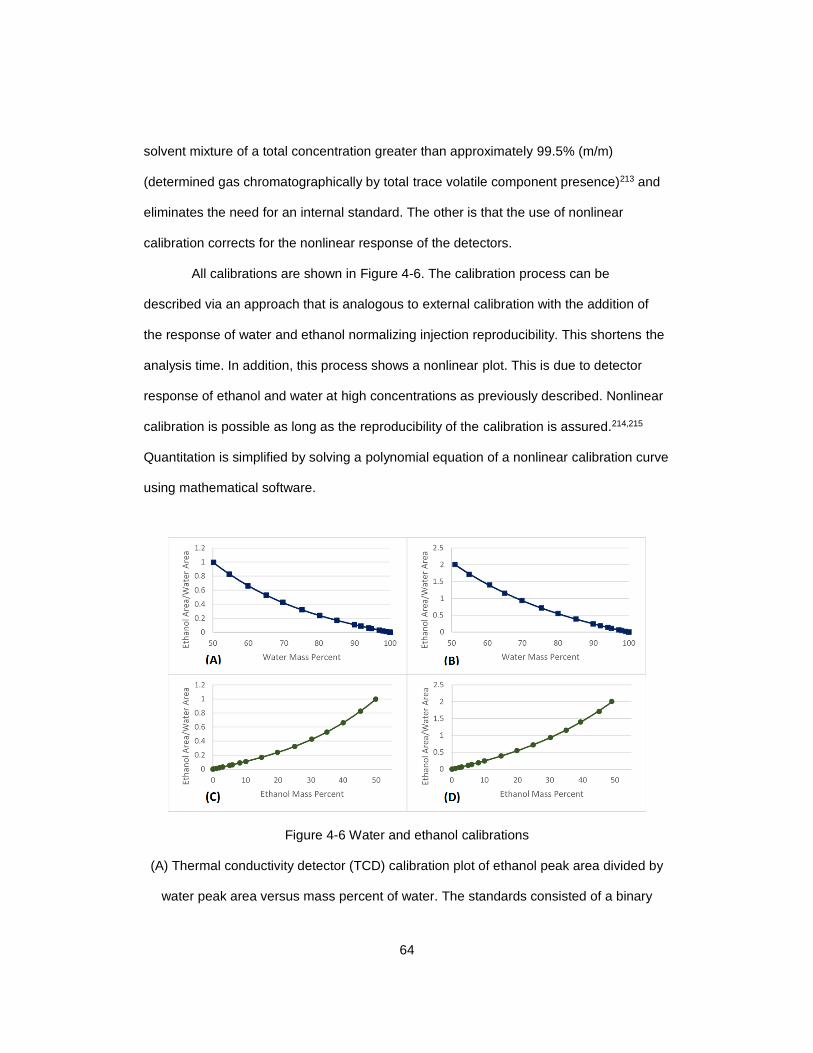
64
solvent mixture of a total concentration greater than approximately 99.5% (m/m)
(determined gas chromatographically by total trace volatile component presence)213 and
eliminates the need for an internal standard. The other is that the use of nonlinear
calibration corrects for the nonlinear response of the detectors.
All calibrations are shown in Figure 4-6. The calibration process can be
described via an approach that is analogous to external calibration with the addition of
the response of water and ethanol normalizing injection reproducibility. This shortens the
analysis time. In addition, this process shows a nonlinear plot. This is due to detector
response of ethanol and water at high concentrations as previously described. Nonlinear
calibration is possible as long as the reproducibility of the calibration is assured.214,215
Quantitation is simplified by solving a polynomial equation of a nonlinear calibration curve
using mathematical software.
Figure 4-6 Water and ethanol calibrations
(A) Thermal conductivity detector (TCD) calibration plot of ethanol peak area divided by
water peak area versus mass percent of water. The standards consisted of a binary

65
solution of water and ethanol that ranged in concentration from 50 to 100 mass % water.
(B) Barrier discharge ionization detector (BID) calibration plot of ethanol peak area
divided by water peak area versus mass percent of water. The standards consisted of a
binary solution of water and ethanol that ranged in concentration from 50 to 100 mass %
water. (C) TCD calibration plot of ethanol peak area divided by water peak area versus
mass percent of ethanol. The standards consisted of a binary solution of water and
ethanol that ranged in concentration from 0 to 50 mass % ethanol. (D) BID calibration plot
of ethanol peak area divided by water peak area versus mass percent of ethanol. BID
was set at 250 °C. The standards consisted of a binary solution of water and ethanol that
ranged in concentration from 0 to 50 mass % ethanol. See Materials and Methods for
method details.
The standards for calibration consisted of binary solutions of water and ethanol
that ranged in concentration from 0 to 50 mass % ethanol and from 50 to 100 mass %
water. All of the calibration curves (Figure 4-6) could be described with third order
polynomials created in Microsoft Excel using the response data to obtain the best fit
model. The GC split ratio of 200:1 was chosen for the calibration and quantitation. Figure
4A shows the TCD calibration plot of water (ethanol peak area divided by water peak
area vs mass percent of water), and the calibration plot (Figure 4-6A) yielded a
polynomial best fit equation y = -4 × 10-6x3 + 0.0011x2 - 0.1234x + 4.821 with a square
correlation coefficient of 0.9999. Figure 4-6B shows the BID calibration plot of water
(ethanol peak area divided by water peak area vs mass percent of water), and the
calibration plot (Figure 4-6B) yielded a polynomial best fit equation y = -5 × 10-6x3 +
0.0016x2 - 0.1977x + 8.496 with a square correlation coefficient of 0.9999. Figure 4-6C
shows the TCD calibration plot of ethanol (ethanol peak area divided by water peak area
vs mass percent of ethanol), and the calibration plot (Figure 4-6C) yielded a polynomial
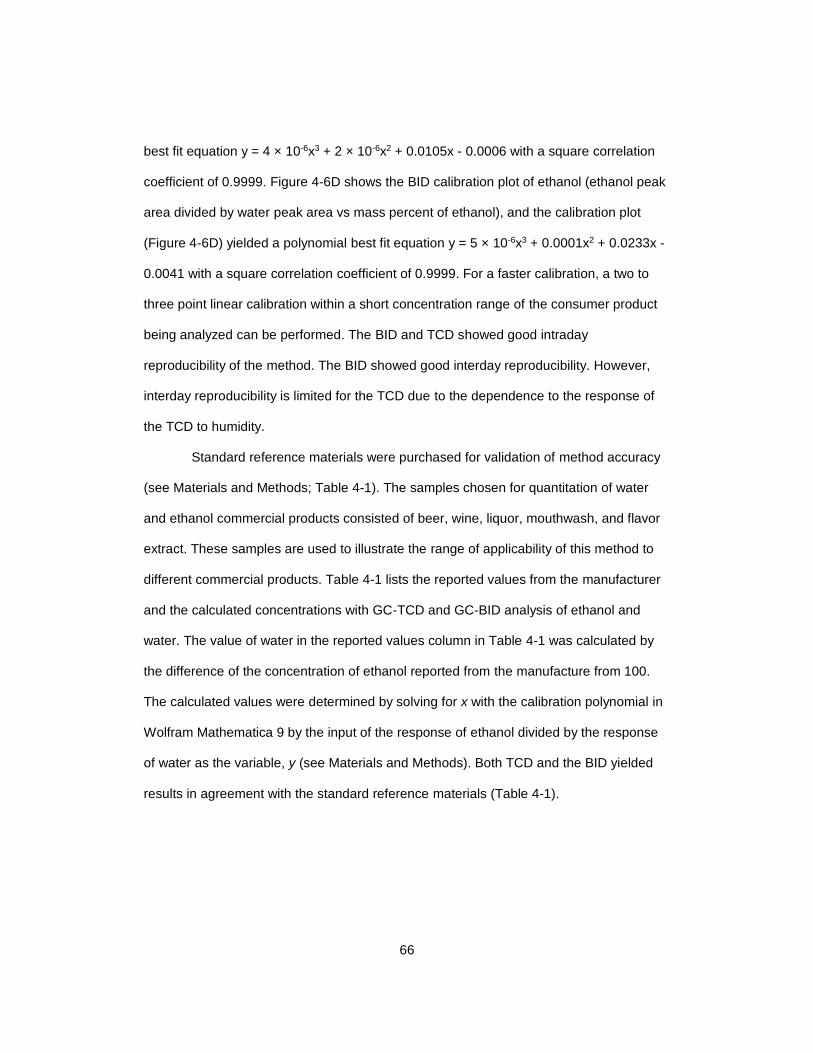
66
best fit equation y = 4 × 10-6x3 + 2 × 10-6x2 + 0.0105x - 0.0006 with a square correlation
coefficient of 0.9999. Figure 4-6D shows the BID calibration plot of ethanol (ethanol peak
area divided by water peak area vs mass percent of ethanol), and the calibration plot
(Figure 4-6D) yielded a polynomial best fit equation y = 5 × 10-6x3 + 0.0001x2 + 0.0233x -
0.0041 with a square correlation coefficient of 0.9999. For a faster calibration, a two to
three point linear calibration within a short concentration range of the consumer product
being analyzed can be performed. The BID and TCD showed good intraday
reproducibility of the method. The BID showed good interday reproducibility. However,
interday reproducibility is limited for the TCD due to the dependence to the response of
the TCD to humidity.
Standard reference materials were purchased for validation of method accuracy
(see Materials and Methods; Table 4-1). The samples chosen for quantitation of water
and ethanol commercial products consisted of beer, wine, liquor, mouthwash, and flavor
extract. These samples are used to illustrate the range of applicability of this method to
different commercial products. Table 4-1 lists the reported values from the manufacturer
and the calculated concentrations with GC-TCD and GC-BID analysis of ethanol and
water. The value of water in the reported values column in Table 4-1 was calculated by
the difference of the concentration of ethanol reported from the manufacture from 100.
The calculated values were determined by solving for x with the calibration polynomial in
Wolfram Mathematica 9 by the input of the response of ethanol divided by the response
of water as the variable, y (see Materials and Methods). Both TCD and the BID yielded
results in agreement with the standard reference materials (Table 4-1).
67
Table 4-1 Reported and Calculated Values of Ethanol and Water Concentration by Mass
Percent
Calculated values were extrapolated from the calibration curves. Chromatographic
conditions were isothermal at 110 °C, flow = 1 mL/min, 0.1 μL injection, split 200:1,
thermal conductivity detector (TCD), barrier discharge ionization detector (BID), and inlet
at 250 °C, column SLB-IL107 (30 m × 0.25 mm i.d. × 0.20 μm). See Materials and
Methods for descriptions of samples. *) Deviation of the reported values is listed only for
NIST samples. Other manufacturers did not provide a deviation for the values shown.
The reported value for water was determined from the difference of the concentration of
ethanol from 100%. ≠) Adjusted for nonvolatile component. Nonvolatile component mass
percent is determined by weight of residue after drying from an initial weight of consumer
product.
Sample Reported Value* TCD BID
Ethanol Mass
% Water Mass
% Ethanol Mass
% Water Mass
% Ethanol Mass
% Water Mass
%
NIST2 1.55 ± 0.02 98.4 1.5 ± 0.1 99 ± 2 1.5 ± 0.1 98 ± 4
NIST6 6.04 ± 0.04 94.0 5.8 ± 0.2 94 ± 2 6.0 ± 0.3 94 ± 6
NIST25 25.2 ± 0.2 74.8 24.7 ± 0.3 75 ± 1 25.0 ± 0.2 75 ± 1
Sigma 10 7.7 92.3 7.6 ± 0.1 92 ± 1 7.7 ± 0.3 92 ± 3
Almond Extract
25.3 74.7 24.4 ± 0.4 76 ± 1 24.9 ± 0.8 75 ± 3
Bud Light 3.3 96.7 3.2 ± 0.2 97 ± 7 3.3 ± 0.1 97 ± 2
Scope Mint 15.0 85.0 15.5 ± 0.2 84 ± 1 15.5 ± 0.1 85 ± 1
Chardonnay 10.6 87.1≠ 11.0 ± 0.3≠ 88 ± 3≠ 11.1 ± 0.2≠ 88 ± 2≠
Crown Royal 34.5 65.5 32.8 ± 0.5 67 ± 2 33.4 ± 0.6 67 ± 2
Figure 4-7 shows a chromatogram of the commercial almond extract sample
analyzed using the BID. This chromatogram shows the method’s effectiveness in the
analysis of the commercial products with ample efficiency and selectivity for water and
ethanol and no trace components observed. The overall water and ethanol content

68
determined for the commercial products was similar to the values stated by the
manufacturers. However, initial analysis of the wine sample, chardonnay, resulted in a
low value for ethanol (8.3% mass) compared to the manufacturer’s reported value (10.6%
mass). It was found that this deviation was due to the presence of nonvolatiles, such as
sugar, in the wine sample. Adjustment for nonvolatile components can be made by
weight analysis of the residue by drying. The nonvolatile component mass percent was
determined by the measurement of the weight of residue after drying from an initial
weight of the wine product. The wine was found to consist of 2.3% mass of nonvolatiles.
The final value of the ethanol and water mass percent was adjusted using the residue
value, and the adjusted results agreed with the manufacturer’s reported values. The
uncertainties in the measurements of the water analysis compared to ethanol analysis
were slightly larger. This was due to the high concentration of water in the samples and
the dependency on humidity. To reduce the error, all samples and standards were
parafilm sealed and stored at 4 °C. In addition, all samples and standards were minimally
exposed to the atmosphere when opened.
Figure 4-7 Chromatogram of commercial almond extract sample
analyzed with barrier discharge ionization detection.
4.5 Conclusions
A method for the quantitation of both ethanol and water that is simple, rapid,
cost-effective, precise, and accurate has been developed. Simplicity, reduction of cost,
and decreased analysis time have been accomplished by the removal of the internal

69
standard method. This was accomplished by using the response of ethanol divided by the
response of water (or vice versa) plotted against the concentration range of a series of
ethanol and water standards. Using capillary ionic liquid gas chromatography, a fast
analysis with high selectivity and resolution of the water and ethanol was obtained. This
method shows both ethanol and water can be determined at all concentrations in
commercial products. This method is transferable to other binary solvent systems other
than ethanol and water. The BID is linear at all concentrations of water with the described
method. This makes it advantageous for development of external calibration methods for
water analysis that cannot be performed with a TCD.

70
Chapter 5
Level and function of D-amino acids in mouse brain tissue and blood
5.1 Abstract
Hippocampus, cortex, and blood samples from FVB/NJ mice were analyzed for
comprehensive L- and D-amino acid levels. Sixteen free amino acids were examined of
which 12 could be quantitated in brain tissue samples. Perfusion of blood in brain tissue
was performed. The effect of tissue perfusion on the reduction of amino acid levels and
decreasing the mouse to mouse tissue variability was discussed. Total amino acid levels
(L- and D- enantiomers) in brain tissue are up to 10 times higher than in blood. D-amino
acid levels in brain tissue are typically 10 to 100 times higher than blood levels. Total
amino acid levels in the hippocampus compared to the cortex were found to be the same,
but there was a 13% reduction in almost all measured D-amino acid levels in the cortex
compared to the hippocampus. Data indicates that there is an approximate inverse
relationship between the prevalence of an amino acid and the percentage of its D-
enantiomeric form. A notable result from this study is that glutamic acid had no
quantifiable level of its D-antipode. Our results suggest that the D-glutamate metabolism
is likely a unidirectional process and not a cycle as per the L-glutamate/glutamine cycle.
5.2 Introduction
Amino acids are among the most important molecules in nature. The history of
amino acids begins with the discovery of asparagine isolated from asparagus extract in
1806.216 Subsequently the analysis of protein hydrolysates revealed additional analogous
compounds that are now referred to as amino acids.217 In 1851 Louis Pasteur revealed
the optical activity of asparagine and aspartic acid,54 leading to the realization that most

71
common amino acids have optical activity arising from their differing orientation around
the α-carbon.55 The initial discovery and configurational assignment of amino acids led to
the opinion that L-configuration amino acids were solely found in nature, and D-amino
acids were laboratory artifacts.58,59
Dispelling the notion that D-amino acids are “unnatural” or not
biologically relevant began in the mid-20th century with the report that D-amino acids
were an integral part of the bacterial peptidoglycan.60 It was the first report that D-amino
acids, specifically D-alanine and D-glutamic acid, were appurtenant biological entities.
Subsequent evidence began to emerge supporting the notion that D-amino acids were
not uncommon in living systems. In 1969 J. Corrigan published a review with 30
examples of D-amino acids found in invertebrates.58 In some cases a functional role was
implied while in many others it was unknown. By the end of the last century with the
advent of new bioanalytical techniques, scientists were able to easily isolate and identify
D-amino acids in a greater variety of biological samples and in particular, vertabrates.61–65
In 1986 free D-aspartic acid was found in human and animal tissue.65 Subsequently free
L- and D- amino acids were reported in pathologically relevant human urine, plasma,
cerebrospinal fluid, and amniotic fluid.61,62 A nonproteinic amino acid, D-pipecolic acid,
was found to be an indicator of the severity of a neurological genetic disease.218
Additional reports showed that D-amino acid containing peptides had distinct functions
including binding to specific opiate receptors and acting as neurotoxins blocking voltage-
sensitive calcium channels.219,220 Since the early 2000s, there have been additional
reports of free D-amino acids in various mammalian tissues.221–227
Investigations into the role and function of specific D-amino acids in mammalian
systems is an intriguing but relatively neoteric area of investigations. It has been found

72
that D-serine is a co-agonist of the N-methyl-D-aspartate (NMDA)-type glutamate
receptor, and it can occupy the glycine binding site.66,67 Free D-serine has been
determined to be localized primarily in the mammalian forebrain where the highest
concentrations for NMDA receptors can be found.68–71 Recently, D-leucine has been
applied as an effective treatment for seizures in mice.73 However, the exact mechanism
through which D-leucine acts to inhibit seizure activity remains unknown. D-serine and D-
leucine are just two examples of D-amino acid found in brain tissues.
Transcardial perfusion is a standard technique for the vascular perfusion of
anesthetized animals for preparing and preserving tissues for analysis.228,229 It is unclear
how much of each amino acid is in the intravascular and extravascular spaces, which
could provide useful information about their potential physiological roles. Regarding D-
amino acid analyses, perfusion has only been applied to the determination of D-serine
and its function in the activity of D-amino acid oxidase (DAO) in the human central
nervous system.230 The effect of perfusion in the analysis of a spectrum of L and D-amino
acids in brain tissues has not been examined.
As evidence accrues on the unique biological roles of D-amino acids, it has
become evident that there has never been a fundamental study on normal, baseline
levels of L- and D- amino acids in the brain and blood of any mammalian entity.
Hippocampus and cortex regions of the brain are two of the most common anatomical
sources of epilepsy.231 Examination of theses tissues to determine baseline levels of D-
amino acids will aid in finding function relating to neurological pathology and many other
unexplored D-amino acid processes. In this work we provide the most complete
characterization of brain and blood amino acid levels in mice. Further, the levels are
examined in terms of anomalies, trends and possible relevance to the limited existing
data on mammalian D-amino acids.
73
5.3 Materials and Methods
5.3.1 Materials
All amino acid standards, teicoplanin, fluorenylmethyloxycarbonyl chloride,
amantadine hydrochloride, and boric acid were purchased from Sigma-Aldrich (St. Louis,
MO). High performance liquid chromatography (HPLC) grade acetonitrile and methanol
were purchased from Sigma-Aldrich, and deionized water was obtained from a Milli-Q
water system (Millipore, Bedford, MA). An octadecylsilane derivatized superficially porous
particle (SPP) based HPLC column (Poroshell 120 EC-C18, 4.6 x 150 mm i.d. 2.7 µm
particles) was purchased from Agilent Technologies (Wilmington, DE). Another HPLC
column was prepared in-house utilizing teicoplanin covalently bonded to SPPs and slurry
packed into a 4.6 x 100 mm i.d stainless steel column (IDEX Health and Science, Oak
Harbor, WA). The synthesis and packing of the teicoplanin HPLC column was prepared
as described by Patel et al.232
5.3.2 Derivatization of amino acid standards
The derivatization of standards was performed in autosampler vials. Standard L-
and D- amino acids were prepared in deionized water at concentrations around 0.03 M.
Into the autosampler vial 50 µL of amino acid standards was pipetted. A 0.8 M borate
buffer was prepared with boric acid and potassium chloride. The borate buffer pH was
adjusted with 0.8 M NaOH to pH 9. Into the autosampler vial 400 µL of borate buffer was
pipetted. In addition, 500 µL of acetonitrile was pipetted into the autosampler vial. A
fluorenylmethyloxycarbonyl chloride (FMOC) solution was prepared by dissolving 0.13 g
in 5 mL acetonitrile (0.1 M), and 50 µL of the FMOC solution was pipetted into the
autosampler vial. The mixture was then allowed to react at room temperature after the
addition of the FMOC solution for 20 minutes. After the reaction was completed, 50 µL of
0.8 M amantadine solution was added to the autosampler vial to quench the remaining

74
FMOC reagent. The 0.8 M amantadine solution was prepared with acetonitrile and water,
1:1, mixture. All standards, reagents, and solutions were stored at 4 °C while not in use.
5.3.3 Mouse brain non-perfused tissues
The study was carried out under experimental protocols approved by the Johns
Hopkins Animal Care and Use Committee (ACUC). All efforts were made to minimize
animal suffering. In all experiments FVB/NJ strain mice (Jackson Laboratory, Bar Harbor,
ME) aged 5-6 weeks (body weight 25-30 g) were used. The mice were housed 3-5 per
cage, with a simulated 14-hour light/10-hour dark cycle. The mice were fed a rodent
chow diet (Teklad Global 2018SX, Madision, WI) and tap water ad lib.
Mice were sacrificed by rapid cervical dislocation. Surgical scissors were used to
remove the head and to complete the brain dissection. The hippocampus and cortex
were dissected using a dissecting microscope.
5.3.4 Mouse brain perfused tissues
Mice were anesthetized lightly with carbon dioxide. A midline incision was made
at the thoracic costal margin, followed by visualization of the and incision of the right
atrium. Heparin/saline (APP Pharmaceuticals, LLC 1,000 USP Units/mL, Schaumburg,
IL) and a blood collection set (BD Vacutainer, Four Oaks, NC) were injected using a 25-
gauge butterfly needle into the apex of the left ventricle until a swelling of the heart was
observed. The injection was thereafter continued at a low rate. The proximal end of the
collection set was removed from the flush syringe when the effluent was clear. A 20 mL
syringe was used to slowly inject a 10% neutral buffered formalin (NBF) solution (Sigma
Life Science, St. Louis, MO) and when cardiac muscle contraction stopped, perfusion
was complete. A 3 mL syringe and 25 gauge one-inch needle were used to infuse the
intestines and lungs with 10% NBF, working from the proximal to distal end. Brains were
then dissected rapidly according to the procedure previously described.
75
5.3.5 Blood Samples
Mice were anesthetized with carbon dioxide and blood was collected rapidly by a
cardiac puncture technique using a 22-gauge needle The blood was collected and stored
until analysis.
5.3.6 Animal Subjects
A total of nineteen mice (FVB/NJ strain) were utilized for the analysis of 12 non-
protein amino acids in hippocampus tissue, cortex tissue, and blood samples. Seven
mice were utilized for the non-perfused tissue analysis of the hippocampus and cortex.
Another seven mice were utilized for the perfused tissue analysis of the hippocampus
and cortex. The last five mice were used for the blood analysis. A total of fourteen
samples were used for perfused tissue analysis (seven hippocampus tissue samples and
seven cortex tissue samples). Also, a total of fourteen samples were used for non-
perfused tissue analysis (seven hippocampus tissue samples and seven cortex tissue
samples).
5.3.7 Free amino acid extraction
The hippocampus, cortex, and blood samples obtained from the dissection and
collection processes were weighed and placed into micro centrifugation tubes. To all
samples 100 µL of an internal standard was added. The internal standard consisted of
8.38 mM norleucine in water. Next, 1 mL of 0.1 N perchloric acid was pipetted into the
tube. Then the samples were homogenized for 30 seconds (three 10 seconds pulses)
with a Q-Sonica CL-18 probe (Newtown, CT). The samples were placed on ice during the
homogenization process. After the homogenization the samples were centrifuged at
13,000 RPM for 20 minutes at 4 °C. The supernatant was removed and stored at - 80 °C
while not in use. 100 µL aliquots of supernatant was derivatized by following the
derivatization procedure described for the amino acid standards.

76
5.3.8 Two Dimension HPLC instrumentation and method
The chromatography system consisted of an Agilent 1200 HPLC system (Santa
Clara, CA) and an LC system consisting of a Shimadzu LC-6A pump, RF-10A
fluorescence detector, and CR-6A integrator (Kyoto, Japan). A Rheodyne 7000 six port
stream switching valve (Rohnert Park, CA) was used for the heart-cut from the first
dimension to the second dimension. The first dimension utilized a C18 SPP column, and
the second dimension utilized an in house constructed chiral teicoplanin SPP column.
Both columns were described in the material section. First dimension signal monitoring
was done using ChemStation software from Agilent, and the second dimension signal
was monitored by a CR-6A integrator from Shimadzu. Two reverse phase HPLC
gradients for individual amino acid isolation was performed in the first dimension. The first
gradient consisted of mobile phase A (20 mM H2PO4 buffer adjusted to pH 2.5 with
H3PO4) and mobile phase B (acetonitrile). The gradient method began with 5% B (0-2
min) followed by a linear ramp from 15-80% B (2.01-35 min) then 80-95%B (35-38 min).
Finally, the gradient concluded with a 2-minute ramp down to 5% B. The flow rate was
0.75 mL/min. For the second reverse phase gradient, mobile phase A was 0.025 M
sodium acetate, and mobile phase B was a 23/22 (v/v) mixture of 0.05 M sodium
acetate/acetonitrile. The gradient method began with a ramp from 30-37% B (0-3.75 min)
followed by a ramp from 37-73% B (3.75-26.25 min) and finally brought to 100% B over
the concluding 5 min. For the first dimension a diode array detector (DAD) monitored
signals at 254 nm and the detector outlet was connected to the six port switching valve.
Effluent bands were manually cut or redirected to the second dimension column. Manual
cuts lasted approximately 0.1 to 1 seconds. In the second dimension amino acid
enantiomers were separated on the teicoplanin SPP column using isocratic reverse
phase methods. Table 5-1 lists the conditions for the separation of each chiral amino acid
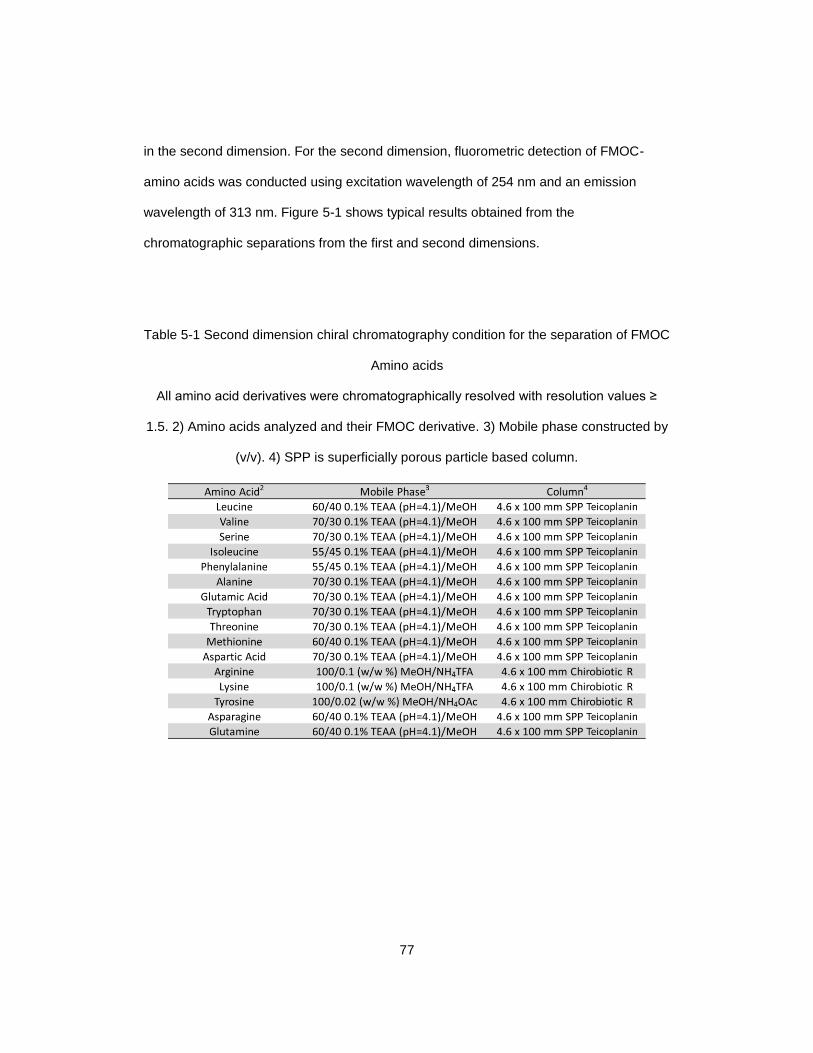
77
in the second dimension. For the second dimension, fluorometric detection of FMOC-
amino acids was conducted using excitation wavelength of 254 nm and an emission
wavelength of 313 nm. Figure 5-1 shows typical results obtained from the
chromatographic separations from the first and second dimensions.
Table 5-1 Second dimension chiral chromatography condition for the separation of FMOC
Amino acids
All amino acid derivatives were chromatographically resolved with resolution values ≥
1.5. 2) Amino acids analyzed and their FMOC derivative. 3) Mobile phase constructed by
(v/v). 4) SPP is superficially porous particle based column.

79
Figure 5-1 Representative chromatograms of the first and second dimension separations of standard FMOC amino acids.
Conditions are described in the experimental section. Serine (ser), aspartic acid (asp), alanine (ala), threonine (thr), leucine (leu),
and glutamic acid (glu) are shown with the resolved separation of enantiomers in the second dimension.

80
The method described was able to evaluate 16 amino acids (Table 5-1 and
Figure 5-1). The levels of 12 non-protein amino acids were determined in the blood and
brain tissues. Other methods also reported low detection levels for similar amino acids in
rat brains (e.g. cysteine, tyrosine, methionine, and D-glutamate).233,234
5.4 Results
Tables 5-2 and 5-3 provide the amino acid data for both the cortex and
hippocampus of non-perfused and perfused mice, respectively. Table 5-4 gives both the
total and D-amino acid levels in the blood. Upon comparison of the non-perfused
hippocampus, non-perfused cortex, and blood data in Tables 5-2 and 5-4 (also illustrated
in Figures 5-2 and 5-3) both the total amino acid and D-amino acid levels are usually
significantly lower in the blood (often by an order of magnitude). Figure 5-2 shows 12
averaged concentration levels of total amino acids (i.e. D- plus L-amino acids) in the
sampled mice. The three amino acids with the highest levels in brain tissues are glutamic
acid, glutamine, and aspartic acid. Figure 5-3 shows 12 averaged concentration levels of
D-amino acids in the mice sampled. Concentrations of D-glutamine and D-aspartic acid
have the highest values. No detectable amounts of D-glutamic acid were observed. This
was unexpected because the concentration of total glutamic acid is significantly higher
than all other amino acids, and all other amino acids detected have significant levels of
their D-enantiomers. Concentrations of D-phenylalanine, D-leucine, D-isoleucine, and D-
allo-isoleucine are among the lowest values. Concentrations of D-amino acid levels are
almost always lower than the corresponding L-amino acid levels (Figure 5-2 vs. Figure 5-
3). For example, concentrations of D-glutamine in the non-perfused cortex and
concentrations of D-isoleucine in the non-perfused hippocampus are approximately four
times less than their total amino acid values.
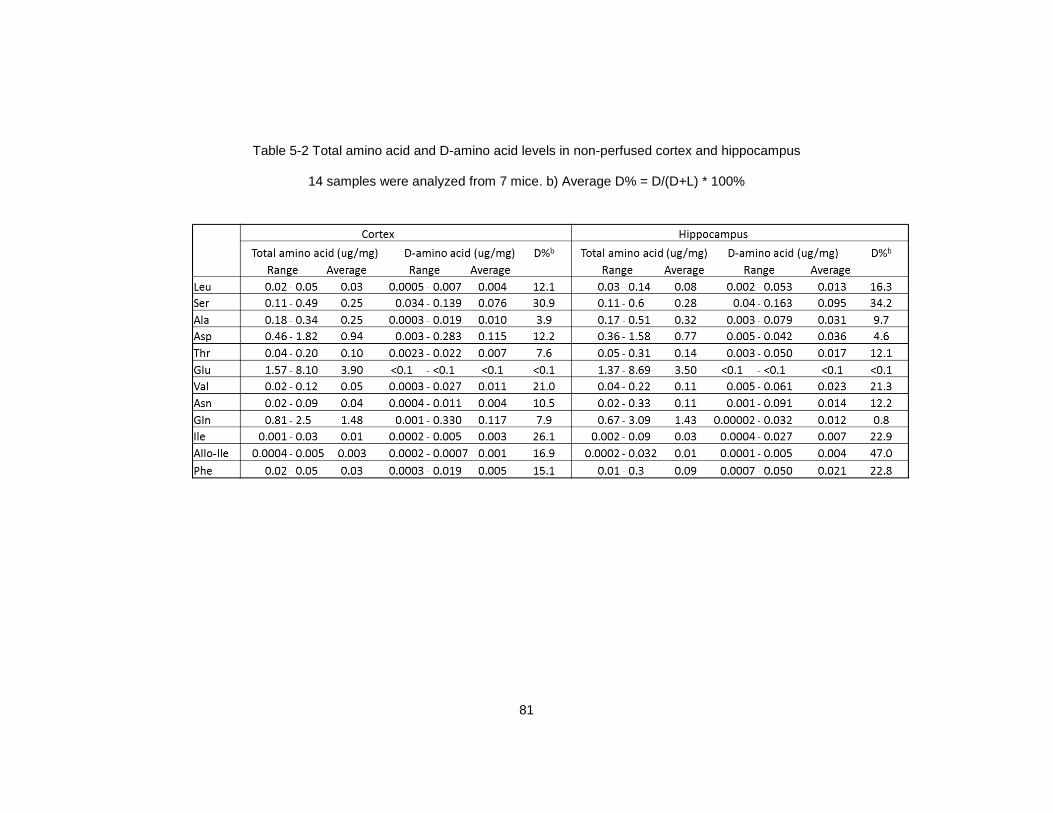
81
Table 5-2 Total amino acid and D-amino acid levels in non-perfused cortex and hippocampus
14 samples were analyzed from 7 mice. b) Average D% = D/(D+L) * 100%

82
Table 5-3 Total amino acid and D-amino acid levels in perfused cortex and hippocampus
14 samples were analyzed from 7 mice. b) Average D% = D/(D+L) * 100%

83
Table 5-4 Total amino acid and D-amino acid levels in blood
14 samples were analyzed from 7 mice. b) Average D% = D/(D+L) * 100%

84
Figure 5-2 The average value of total amino acid levels (µg/mg) in blood, non-perfused
cortex, and non-perfused hippocampus.
The range of the average values can be seen in Table 2. Average value for blood with n
= 5. Average value for non-perfused cortex with a n = 7. Average value for non-perfused
hippocampus with n = 7.
Free amino acid concentrations obtained from perfused tissue may give a more
accurate cellular and extracellular/extravascular levels. 230,235 Table 5-3 lists the amino
acid values obtained from the perfused tissues and Figure 5-4 shows the effect of
perfusion on the amino acid levels measured in the cortex and hippocampus. A plot of
the average amino acid values of perfused tissue vs. non-perfused tissue is linear (see
Figure 5-4). Each data point is an amino acid, and the measure of R2 (how close the data
are fitted to the regression line) represents the uniformity of the effect of perfusion. In the
raw data of Figure 5-4B for the hippocampus tissues and Figure 5-4D for the cortex
tissues, the slope of the line is approximately 0.85. This represents an average 15%
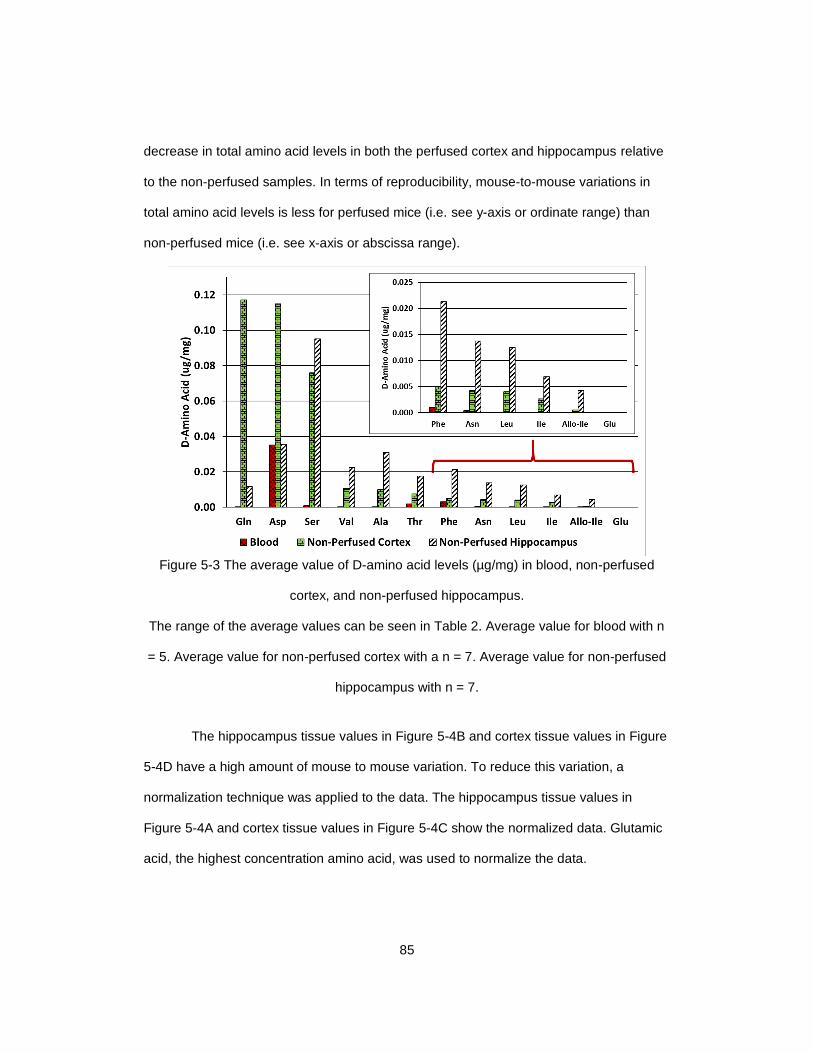
85
decrease in total amino acid levels in both the perfused cortex and hippocampus relative
to the non-perfused samples. In terms of reproducibility, mouse-to-mouse variations in
total amino acid levels is less for perfused mice (i.e. see y-axis or ordinate range) than
non-perfused mice (i.e. see x-axis or abscissa range).
Figure 5-3 The average value of D-amino acid levels (µg/mg) in blood, non-perfused
cortex, and non-perfused hippocampus.
The range of the average values can be seen in Table 2. Average value for blood with n
= 5. Average value for non-perfused cortex with a n = 7. Average value for non-perfused
hippocampus with n = 7.
The hippocampus tissue values in Figure 5-4B and cortex tissue values in Figure
5-4D have a high amount of mouse to mouse variation. To reduce this variation, a
normalization technique was applied to the data. The hippocampus tissue values in
Figure 5-4A and cortex tissue values in Figure 5-4C show the normalized data. Glutamic
acid, the highest concentration amino acid, was used to normalize the data.

86
Figure 5-4 Linear plots of the total amino acid levels in perfused and non-perfused samples and normalized data (with respect to
glutamic acid) in comparison to raw data.
A) Hippocampus plot of normalized total amino acid levels of perfused tissue vs. non-perfused tissue. B) Hippocampus plot of raw
total amino acid levels of perfused tissue vs. non-perfused tissue. C) Cortex plot of normalized total amino acid levels of perfused
tissue vs. non-perfused tissue. D) Cortex plot of raw total amino acid levels of perfused tissue vs. non-perfused tissue.
87
Normalization considerably reduces the mouse to mouse variation in amino acid values in the
perfused and non-perfused tissues (see Figures 5-4A and 5-4C vs. Figures 5-4B and 5-4D).
However, the average values of all the amino acid levels (defined by the slope of the lines)
show no significant change.
5.5 Discussion
5.5.1 Broad trends
5.5.1.1 Effect of perfusion
The presence of blood in brain tissue is an additional variable. The cerebral blood
volume (CBV) and vascularization pattern may vary between mice.236 Perfusion largely corrects
this source of variation between mice, representing a significant technical advance. Figure 5-4
shows that both the hippocampus and the cortex have an approximate 15% reduction in total
amino acid levels due to perfusion of blood. The question arises, what percentage of the brain
is blood vs. tissue.
In previous work, micro-computed tomography (MCT) was used to measure the
cerebral blood volume in mouse brain regions.236 It was found that cortex CBV was 7.9 ± 0.7
percent and hippocampus CBV is 3.7 ± 0.7 percent.236 In another work that utilized nuclear
magnetic resonance (NMR) to obtain the cerebral blood volume of mice only the normalized
CBV were reported.237 Normalized cerebral blood volume is obtained by taking the CBV value
of a particular brain region (i.e. hippocampus or cortex) and normalize it to the total CBV.
Normalized CBV in the nuclear magnetic resonance experiment was 1.03 for cortex and 0.801
for hippocampus.237 To compare the NMR and MCT results, the MCT data must be normalized.
Normalized CBV in the MCT experiment was 1.4 for cortex and 0.6 for hippocampus.236 The
MCT normalized CBV results were higher than the NMR experiment, and the cortex and
hippocampus values had an approximate 30% difference between the two methods. Total CBV
is unknown for our experiment, and normalization of CBV was not performed. The data from our
experiment compared to MCT method and indirectly (via normalized CBV) to the NMR method

88
suggests that CBV is higher in the hippocampus and cortex tissues of the mice used in this
study.
If it is assumed that the concentrations of amino acids in the cerebral blood and tissue
are equivalent (which they are not, see Results), then the CBV in the hippocampus and cortex
would have to be ~ 15%, which is significantly greater than other reported values (vide supra).
There are at least three other possible explanations. One is that the volume of blood in the brain
of these mice is actually 2 - 4 times greater than previously reported, but this large of a
discrepancy seems unlikely. Another possibility is that the blood in the brain has higher amino
acid levels than the blood in the rest of the body, something that has not been observed or
reported previously to our knowledge. Perhaps it is most likely that perfusion leaches some of
the amino acids from the surrounding tissues where they are much more concentrated.
5.5.1.2 Amino Acid Levels: Homeostasis?
D-Amino acids are introduced into biological systems from food, bacterium sources,
and indigenous biological processes.238 As D-amino acids are introduced to biological systems,
a variety of processes must be present to regulate D-amino acid levels. Regional brain levels of
five D-amino acids (D-serine, D-alanine, D-aspartic acid, D-leucine, and D-proline) administered
to mice (ddy/DAO+) and mice lacking D-amino acid oxidase activity (ddy/DAO-) have been
reported.239 Upon exogenous administration, D-Asp levels increased in the pituitary and pineal
glands of both strains of mice. In the ddy/DAO+ strain of mice, all other amino acids levels did
not significantly change. However, the mice lacking D-amino acid oxidase activity (ddy/DAO-)
showed increased levels of D-serine in all regions except cerebrum and hippocampus. The
levels of D-leucine and D-alanine increased in all brain regions, but D-proline levels did not
significantly change. One of the conclusions of this work was that D-amino acid oxidase was
important for regulating levels of some D-amino acids.239 Indeed it is thought that D-amino acid
oxidase is crucial to help control levels of D-serine which is known to have function in the
NMDA-type glutamate receptor. 66,67 Biological processes are present to control levels of amino

89
acids in mammalian brain tissues, and it is possible these processes help control biological flux
or homeostasis of amino acid levels.
5.5.1.3 Cortex vs. Hippocampus amino acid levels
The plot of the cortex and hippocampus total amino acid levels is linear with a slope of
1, indicating that there is little difference between the total amino acid levels in the cortex and
hippocampus (Figure 5-5A). In contrast, a similar plot of D-amino acid levels showed a slope of
0.87, indicating that on average, levels of D-amino acids are 13% lower in the cortex (Figure 5-
5B). The only exception is D-aspartic acid, which is 2 times higher in the cortex. As noted
previously, D-Asp has the highest concentration of any D-amino acid in blood, and there is more
D-Asp in blood than all the other D-amino acids combined.
One process for the control of multiple D-amino acids levels is the expression or activity
of D-amino acid oxidase (DAO).240 D-amino acid oxidase oxidizes D-amino acids, except for
aspartic acid and glutamic acid, to the corresponding imino acids, producing ammonia and
hydrogen peroxide.240 Note that hydrogen peroxide is a reactive oxygen species associated with
oxidative stress.241 In this work baseline amino acid levels from healthy wild-type mice exhibited
unique regional discrepancies between the hippocampus and cortex tissues. The approximate
13% decrease in D-amino acid levels in the cortex is an indication that there may be regional
differences in D-amino acid synthesis and degradation. DAO might be one of the enzymes
responsible for this difference. However, immunoblot and immunocytochemical studies in rodent
and human tissue have not shown a difference in immunoreactivity or protein levels between
hippocampus and cortex.242,243 These findings may support the hypothesis that additional
processes exist other than DAO to control levels of D-amino acids in brain tissues. In fact, it has
been shown that formation of D-serine from L-serine, via serine racemase enzyme, is one
process that both synthesizes and degrades D-serine in rat brain.244
In contrast to most of the other D-amino acids, the outlier D-aspartic acid (see Figure 5-
5B) is not oxidized by DAO but rather, is oxidized by D-aspartate oxidase.245–247 Figure 5-5B

90
shows D-aspartic acid has a 2 times higher concentration in the cortex tissues. This suggests
the activity (or expression) of D-aspartate oxidase is expressed less in cortex tissues. It was
found D-aspartate oxidase, visualized by enzyme histochemistry, was present in cortex and
hippocampus tissues of rats.246 However, D-aspartate oxidase was almost two times more
concentrated in the hippocampus.246 However, other processes may contribute to D-aspartic
acid metabolism in the cortex relative to the hippocampus.
Figure 5-5 A) Comparison of total amino acid levels in the cortex vs. hippocampus. B)
Comparison of D-amino acid levels in the cortex vs. hippocampus.
Asp, circled in red, is not included in the calibration. In both plots each data point represent an
individual amino acid value that is averaged from N = 7.
91
5.5.1.4 Percent D-amino acid levels
Figure 5-6 shows plots of % D-amino acids versus total amino acids in the
hippocampus and cortex tissues. Such plots of % D-amino acid levels allow for the detection of
interesting relationships and possible anomalies. These plots indicate that there is an
approximate inverse relationship between the prevalence of an amino acid and its percent D-
enantiomeric form. With the exception of allo-isoleucine in the hippocampus tissues, all % D-
amino acid levels are similar between the two tissues. There are at least two additional highly
interesting features revealed in these data. First, glutamic acid, the most prevalent of all free
amino acids, had no measurable level of its D-antipode, the only amino acid where this was
noted. This may reflect D-glutamic acid metabolism but the biological relevance is unknown.
Second, the least prevalent of the measured amino acids, allo-isoleucine, was found to have
approximately equal amounts of it D- and L- antipodes in the hippocampus (discussed below).
High % D-serine is observed in both brain regions (see Figure 5-6). As noted
previously, D-serine plays a role in NMDA-type glutamate receptor function.66,67 D-amino acid
oxidase only affects the D-serine, but D-serine racemase, a reversible enzyme, affects levels of
both L- and D- isomers of serine.243,244,248,249 Formation of D-serine from L-serine, via serine
racemase, is an important mechanism for maintaining the levels of D-serine in rat brain.244
Ratios of D- to L- amino acid interconversion rates (reported as %D-amino acid values) may be
an indication of racemase activity. Currently serine and aspartate racemases are the only D-
amino acid racemase reportedly found in mammalian brains.244,250 Our results suggest that there
might be other D-amino acid racemases in mammalian brains that cause high levels of % D-
amino acid values in Figure 5-6 (e.g. phenylalanine, asparagine, isoleucine, etc.). This does not
exclude the probability that other biological processes are affecting levels of L-amino acids that
these can be reflected in the %D-amino acid levels.

92
Figure 5-6 A) Plot of hippocampus %D amino acid levels vs. total amino acid levels. B) Plot of
cortex %D amino acid levels vs. total amino acid levels.
In both plots each data point represent an individual amino acid value that is averaged from N =
7.
5.5.2 Specific Amino Acids
5.5.2.1 D-Glutamic Acid (Glutamate) and D-Glutamine
At physiological pH, L- and D- glutamic acid exist as their carboxylate anion, L- and D-
glutamate. L-glutamate is the most abundant and principal excitatory neurotransmitter in the
brain.251 Given its importance, it is not surprising that L-glutamate has a well-known regulatory
pathway, the glutamate-glutamine cycle.251 In this cycle, L-glutamate is supplied to the central
nervous system from L-glutamine.252,253 Astrocytes convert L-glutamate to L-glutamine via
glutamine synthetase.252 L-glutamine is then released into the extracellular space.252
Conversely, L-glutamine is metabolized into L-glutamate in presynaptic terminals by the
mitochondrial enzyme glutaminase.252 The levels of L-glutamate and L-glutamine found in the
hippocampus and cortex of FVB/NJ mice were not only higher than any of the other amino
acids, but they were also an order of magnitude higher than the blood levels (Figure 5-2). Only

93
serine had comparably elevated levels in brain tissues relative to blood levels. More
surprisingly, D-glutamic acid was the only D-amino acid not found (i.e., below quantitation limits)
in either the brain or blood. Conversely, D-glutamine was the most prevalent D-amino acid in
the cortex with hippocampus levels about 10 times lower and blood levels 100 times lower
(Figure 5-3).
The relative lack of D-glutamic acid is the one of the most intriguing results in this study,
particularly since L-glutamic acid is the most prevalent amino acid and all other lower
abundance amino acids show appreciable levels of their D-antipodes. One other recent study
also found no or trace D-glutamate in brain tissue.234 D-glutamic acid is enzymatically converted
to D-pyrrolidone carboxylic acid (in rat liver and kidney), then excreted.254 The concurrent high
level of D-glutamine may indicate that it is a product of an active D-glutamate reaction or
removal pathway. However, unlike the L-glutamate to L-glutamine cycle, this D-glutamate to D-
glutamine pathway is largely a unidirectional process.
D-glutamate and D-aspartate also are metabolized by D-aspartate oxidase (DDO) in
mammals.234 However, in this work, D-aspartate levels are high even though DDO is more
selective to D-aspartate than to D-glutamate. Therefore, it is likely that the additional processes
that involve D-glutamine are limiting D-glutamate levels in the hippocampus and cortex tissues.
In one previous study it was reported that D-glutamate was taken up by glial cells and converted
to D-glutamine.255 It was found that D-glutamate can be converted to D-glutamine by the glial
enzyme glutamine synthetase.255 It appears glutamine synthetase is not enantiospecific and can
catalyze aminations of both L- and D- glutamate.255 However, there are no reports showing that
glutaminase, which converts L-glutamine into L-glutamate, is selective for D-glutamine. This
supports the conclusion that the D-glutamate pathway is largely a unidirectional process and not
part of a cycle, like the L-glutamate to L-glutamine cycle. The relevance of low D-glutamate
levels is unclear. D-glutamine is a biomarker for kidney injuries. 256 In the brain, D-glutamine
increased the uptake of tryptophan in the brain.257 D-glutamine also appeared to produce

94
retrograde amnesia and seizures.258 Further work is needed to delineate the impact of errors in
endogenous metabolism of D-glutamate.
5.5.2.2 D-Aspartic Acid (Aspartate) and D-Serine
Levels of D-aspartate and D-serine in the mouse hippocampus and cortex tissues are
high compared to other D-amino acids, except for D-glutamine (see Figure 5-3). The high levels
of D-serine and D-aspartate are assumed to be due to their function as neurotransmitters.67,227
D-serine is probably the most studied D-amino acid biologically. Reviews by Wolosker and
Schell thoroughly discuss D-serine function in regard to the NMDA receptor.259,260 D-aspartate
has different properties as a neurotransmitter, compared to D-serine.227 D-aspartate is present
in high concentrations in synaptic vesicles of axon terminals and the origin of D-aspartate
occurs in neurons via D-aspartate racemases.227,250 D-aspartate is involved in synthesis and
release of testosterone and luteinizing hormone in rat pituitary gland.261,262 In addition, free D-
aspartic acid is found in white and gray matter in human brains, but free D-aspartic acid levels
are twice as high in gray matter with subjects diagnosed with Alzheimer’s disease.263,264 More
recently, D-aspartate was found to regulate neuronal dendritic morphology, synaptic plasticity,
gray matter volume, and brain activity in rats.265,266
5.5.2.3 D-Branched chain amino acids (D-Leucine, D-Valine, D-Isoleucine, and D-Allo-
Isoleucine)
The branched chain aliphatic amino acids leucine, isoleucine, allo-isoleucine, and valine
all have low total amino acid levels but high % D-amino acid levels (Table 5-3 and Figure 5-6).
Recently it has been discovered that D-leucine, but not D-valine, can be used to treat seizures
in mice.73 The levels of D-branched chain amino acids (D-BCAA) in the brain are fairly similar
(Figure 5-3). In view of D-leucine’s use in the treatment of seizures, it may be worth examining
the action of other D-BCAAs. It was reported that prolinase, which is present in brain tissue, is
strongly inhibited by L-BCAAs.267 Conversely, D-BCAAs were found to enhance prolinase’s
function.267 In glial-enriched cultures from mouse brain tissues D-valine has been used in media

95
to inhibit growth of fibroblasts, causing cultures to be characterized as over 80% astrocytic, and
having suppressed growth rates.268 The results of this experiment suggest that D-valine might
have an influence in brain tissue growth in mice. There are no reports for function of D-allo-
isoleucine in mammalian tissues.
5.5.2.4 D-phenylalanine, D-alanine and D-asparagine
Other D-amino acids worth noting are D-phenylalanine, D-alanine and D-asparagine
(Table 5-3). D-asparagine and D-phenylalanine exhibited similar concentrations. The total
amino acid levels and D-amino acid levels were comparatively low, but the % D-amino acid
values were relatively high (~ 10 – 30% range). D-phenylalanine may alleviate neurological
stress through trapping of reactive oxygen species in neurological tissue. 269 D-phenylalanine
also may treat emotional stress.270 Free D-asparagine has not been reported to be involved in
any neurological process. However, hydrolysis converts D-asparagine to D-aspartate. D-
aspartate function has been reported in brain tissue (see section 5.5.2.2). A D-asparagine to D-
aspartate cycle analogous to the glutamate to glutamine cycle has not yet been identified. D-
alanine showed moderate levels of total amino acid, D-amino acid, and %D-amino acid values
in this study. D-alanine levels were found to be the same in brain white matter of tissue from
normal patients and those with Alzheimer disease but D-Ala levels were twice as high in
Alzheimer gray matter compared to normal gray matter.271 D-alanine administration can lead to
hypofunction of NMDA neurotransmission, and it has been used as a promising approach for
the pharmacotherapy of schizophrenia.272
5.6 Conclusions
This study provides the most complete baseline analysis of L- and D-amino acids in
mouse brain tissues. This study is the first to show perfusion of blood reduces the variation in
brain tissue amino acid levels among mice, and suggests free amino acid concentrations
obtained from perfused tissue may give a more accurate cellular and extracellular/extravascular
levels. Plots of total amino acid levels in the hippocampus compared to the cortex shows little

96
difference between total amino acid levels, but there is an approximate 13% reduction in almost
all measured D-amino acid levels in the cortex compared to the hippocampus. The only
exception is D-aspartic acid which is 2 times higher in the cortex. These results suggest the
hypothesis that additional processes exist other than DAO that control broad levels of D-amino
acids in brain tissues. Plots of % D-amino acids indicate that there is an approximate inverse
relationship between the prevalence of an amino acid and the percentage of its D-enantiomeric
form. This result suggests that there might be other D-amino acid racemases in mammalian
brains that cause high levels of % D-amino acid values. The most notable result from the
experiment is that glutamic acid, the most prevalent of all free amino acids, had no measurable
level of its D-antipode. It is possible that the D-glutamate metabolism is a unidirectional process
and not a cycle (i.e., in comparison to the L-glutamate/glutamine cycle).

97
Chapter 6
General Conclusion
This dissertation focused on two chromatographic techniques, gas chromatography
(GC) and high performance liquid chromatography (HPLC). The GC work described advances
in separation methodologies focusing on the separation and quantitation of commercially related
compounds. Chapter 2 showed four ionic liquid (IL) columns evaluated for rapid analysis and
improved resolution of long-chain methyl and ethyl esters of omega-3, omega-6, and additional
positional isomeric and stereoisomeric blends of fatty acids found in fish oil, flaxseed oil, and
potentially more complicated compositions. The potential for improved resolution of fatty acid
esters is important for complex food and supplement applications, where different forms of fatty
acids can be incorporated. Our results support the versatility of ionic liquid gas chromatography
for resolving and quantifying primary PUFA esters and a full complement of fatty acid
components likely to be isolated from food, oil, or physiological matrices. Supplementing FID
with vacuum UV detection provides another increment of resolution for evaluating even more
complex mixtures, offering a component of method independence as in the use of multiple
column chromatography.
Chapter 3 showed IL based capillary columns for GC were also used to separate
trifluoroacetylated fatty amines focusing on the analysis of a commercial sample. Using an ionic
liquid column, it was possible to separate linear primary fatty amines from C12 to C22 chain
length in less than 25 min. GC yields comparable results and considerably more product details
than classical methods of analysis. The advantages of GC–FID on IL columns are ease of
quantification and high selectivity for separating closely related compounds and isomers. The
advantage of GC–MS is in identifying fatty amine compounds and isomers for which there are
no standards (qualitative analysis). The disadvantages of the GC approach include the need for
derivatization with trifluoroacetic anhydride and difficulties in eluting trialkylamines, which cannot
be derivatized.

98
Chapter 4 discussed the analysis of ethanol and water in consumer products is
important in a variety of processes and often is mandated by regulating agencies. A method for
the quantitation of both ethanol and water that is simple, rapid, cost-effective, precise, and
accurate has been developed. Simplicity, reduction of cost, and decreased analysis time have
been accomplished by the removal of the internal standard method. This was accomplished by
using the response of ethanol divided by the response of water (or vice versa) plotted against
the concentration range of a series of ethanol and water standards. Using capillary ionic liquid
gas chromatography, a fast analysis with high selectivity and resolution of the water and ethanol
was obtained. This method shows both ethanol and water can be determined at all
concentrations in commercial products. This method is transferable to other binary solvent
systems other than ethanol and water. The BID is linear at all concentrations of water with the
described method. This makes it advantageous for development of external calibration methods
for water analysis that cannot be performed with a TCD.
Chapter 5 discussed a HPLC application for analyzing L- and D-amino acids in mouse
tissues. This is the most complete characterization of brain and blood amino acid levels using a
mouse model. Hippocampus, cortex, and blood samples from mice were analyzed for L- and D-
amino acid levels by a heart-cutting two-dimension liquid chromatography method. L- and D-
amino acid levels were examined in terms of anomalies, trends and possible relevance to the
limited existing data on mammalian D-amino acids. It was found that the perfusion of blood
reduces the variation in amino acid levels from mouse to mouse. However, there is a possibility
that perfusion may leach amino acids from tissues. The slope obtained from the plot of the total
amino acid levels in the hippocampus compared to the cortex shows little difference between
total amino acid levels. Yet, there is an approximate 13% reduction in almost all measured D-
amino acid levels in the cortex compared to the hippocampus. The only exception is D-aspartic
acid which is 2 times higher in the cortex. These results suggest the notion that additional
processes exist other than DAO that control broad levels of D-amino acids in brain tissues.

99
Plots of % D-amino acids indicate that there is an approximate inverse relationship between the
prevalence of an amino acid and the percentage of its D-enantiomeric form. This result
suggests that there might be other D-amino acid racemases in mammalian brains that cause
high levels of % D-amino acid values. The most notable result from the experiment is that
glutamic acid, the most prevalent of all free amino acids, had no measurable level of its D-
antipode. It is possible that the D-glutamate pathway is likely a one-way process and not a cycle
in comparison to the L-glutamate to L-glutamine cycle. In summary, there are processes being
performed in the cortex and hippocampus regarding the control of D-amino acids levels, and
many of these processes are probably unknown.
This dissertation focused on two chromatographic techniques, gas chromatography
(GC) and high performance liquid chromatography (HPLC). The future work of IL based
columns in GC analysis of commercially related compounds will continue. Researchers are
finding faster and cheaper ways of performing these analyses. The work focusing on fatty acids,
fatty amines, ethanol, and water will expand into other applications (e.g. headspace GC, GC x
GC applications, VUV detection, BID detection etc.). The work discussed in this dissertation will
assist future researchers in complicated fatty acid, fatty amine, water and ethanol analysis by
laying a foundation of different IL GC columns’ behavior to specific classes of analytes. The
HPLC application for analyzing L- and D-amino acids in mouse tissues is an intriguing but
relatively neoteric area of investigations. Investigations and future research into the role and
function of specific D-amino acids in mammalian systems is critically needed due to the limited
existing data on mammalian D-amino acids.

100
Appendix A
Names Of Co-Contribution Authors
Chapter 2: Choyce A. Weatherly, Ying Zhang, Jonathan P. Smuts, Hui Fan, Chengdong
Xu, Kevin A. Schug, John C. Lang, and Daniel W. Armstrong
Chapter 3: Zachary S. Breitbach, Choyce A. Weatherly, Ross M. Woods, Chengdong Xu,
Glenda Vale, Alain Berthod, and Daniel W. Armstrong
Chapter 4: Choyce A. Weatherly, Ross M. Woods, and Daniel W. Armstrong
Chapter 5: Choyce A. Weatherly, Siqi Du, Curran Parpia, Polan T. Santos, Adam L.
Hartman, and Daniel W. Armstrong

101
Appendix B
Rights and Permissions
Chapter 2: Analysis of Long-Chain Unsaturated Fatty Acids by Ionic Liquid Gas
Chromatography
“Reprinted with permission from: Weatherly CA, Zhang Y, Smuts JP, Fan H, Xu C,
Schug KA et al. Analysis of Long-Chain Unsaturated Fatty Acids by Ionic Liquid Gas Chromatography. J Agric Food Chem 2016; 64: 1422–1432. Copyright (2016) American Chemical Society.”

102
Chapter 3: Development and evaluation of gas chromatographic methods for the
analysis of fatty amines
Reprinted with permission from: “Breitbach ZS, Weatherly CA, Woods RM, Xu C, Vale G,
Berthod A et al. Development and evaluation of gas and liquid chromatographic methods
for the analysis of fatty amines. J Sep Sci 2014; 37: 558–565. Copyright (2014) John
Wiley and Sons.
Terms and Conditions
The materials you have requested permission to reproduce or reuse (the "Wiley
Materials") are protected by copyright.
You are hereby granted a personal, non-exclusive, non-sub licensable (on a stand-
alone basis), non-transferable, worldwide, limited license to reproduce the Wiley
Materials for the purpose specified in the licensing process. This license, and any

103
CONTENT (PDF or image file) purchased as part of your order, is for a one-
time use only and limited to any maximum distribution number specified in the
license. The first instance of republication or reuse granted by this license must be
completed within two years of the date of the grant of this license (although copies
prepared before the end date may be distributed thereafter). The Wiley Materials
shall not be used in any other manner or for any other purpose, beyond what is
granted in the license. Permission is granted subject to an appropriate
acknowledgement given to the author, title of the material/book/journal and the
publisher. You shall also duplicate the copyright notice that appears in the Wiley
publication in your use of the Wiley Material. Permission is also granted on the
understanding that nowhere in the text is a previously published source
acknowledged for all or part of this Wiley Material. Any third party content is
expressly excluded from this permission.
With respect to the Wiley Materials, all rights are reserved. Except as expressly
granted by the terms of the license, no part of the Wiley Materials may be copied,
modified, adapted (except for minor reformatting required by the new Publication),
translated, reproduced, transferred or distributed, in any form or by any means, and
no derivative works may be made based on the Wiley Materials without the prior
permission of the respective copyright owner.For STM Signatory Publishers
clearing permission under the terms of the STM Permissions Guidelines only,
the terms of the license are extended to include subsequent editions and for
editions in other languages, provided such editions are for the work as a whole
in situ and does not involve the separate exploitation of the permitted figures or
extracts, You may not alter, remove or suppress in any manner any copyright,
trademark or other notices displayed by the Wiley Materials. You may not license,
rent, sell, loan, lease, pledge, offer as security, transfer or assign the Wiley Materials
on a stand-alone basis, or any of the rights granted to you hereunder to any other
person.
The Wiley Materials and all of the intellectual property rights therein shall at all
times remain the exclusive property of John Wiley & Sons Inc, the Wiley
Companies, or their respective licensors, and your interest therein is only that of
having possession of and the right to reproduce the Wiley Materials pursuant to
Section 2 herein during the continuance of this Agreement. You agree that you own
no right, title or interest in or to the Wiley Materials or any of the intellectual
property rights therein. You shall have no rights hereunder other than the license as
provided for above in Section 2. No right, license or interest to any trademark, trade
name, service mark or other branding ("Marks") of WILEY or its licensors is granted

104
hereunder, and you agree that you shall not assert any such right, license or interest
with respect thereto
NEITHER WILEY NOR ITS LICENSORS MAKES ANY WARRANTY OR
REPRESENTATION OF ANY KIND TO YOU OR ANY THIRD PARTY,
EXPRESS, IMPLIED OR STATUTORY, WITH RESPECT TO THE MATERIALS
OR THE ACCURACY OF ANY INFORMATION CONTAINED IN THE
MATERIALS, INCLUDING, WITHOUT LIMITATION, ANY IMPLIED
WARRANTY OF MERCHANTABILITY, ACCURACY, SATISFACTORY
QUALITY, FITNESS FOR A PARTICULAR PURPOSE, USABILITY,
INTEGRATION OR NON-INFRINGEMENT AND ALL SUCH WARRANTIES
ARE HEREBY EXCLUDED BY WILEY AND ITS LICENSORS AND WAIVED
BY YOU.
WILEY shall have the right to terminate this Agreement immediately upon breach of
this Agreement by you.
You shall indemnify, defend and hold harmless WILEY, its Licensors and their
respective directors, officers, agents and employees, from and against any actual or
threatened claims, demands, causes of action or proceedings arising from any breach
of this Agreement by you.
IN NO EVENT SHALL WILEY OR ITS LICENSORS BE LIABLE TO YOU OR
ANY OTHER PARTY OR ANY OTHER PERSON OR ENTITY FOR ANY
SPECIAL, CONSEQUENTIAL, INCIDENTAL, INDIRECT, EXEMPLARY OR
PUNITIVE DAMAGES, HOWEVER CAUSED, ARISING OUT OF OR IN
CONNECTION WITH THE DOWNLOADING, PROVISIONING, VIEWING OR
USE OF THE MATERIALS REGARDLESS OF THE FORM OF ACTION,
WHETHER FOR BREACH OF CONTRACT, BREACH OF WARRANTY, TORT,
NEGLIGENCE, INFRINGEMENT OR OTHERWISE (INCLUDING, WITHOUT
LIMITATION, DAMAGES BASED ON LOSS OF PROFITS, DATA, FILES, USE,
BUSINESS OPPORTUNITY OR CLAIMS OF THIRD PARTIES), AND
WHETHER OR NOT THE PARTY HAS BEEN ADVISED OF THE
POSSIBILITY OF SUCH DAMAGES. THIS LIMITATION SHALL APPLY
NOTWITHSTANDING ANY FAILURE OF ESSENTIAL PURPOSE OF ANY
LIMITED REMEDY PROVIDED HEREIN.
Should any provision of this Agreement be held by a court of competent jurisdiction
to be illegal, invalid, or unenforceable, that provision shall be deemed amended to
achieve as nearly as possible the same economic effect as the original provision, and

105
the legality, validity and enforceability of the remaining provisions of this
Agreement shall not be affected or impaired thereby.
The failure of either party to enforce any term or condition of this Agreement shall
not constitute a waiver of either party's right to enforce each and every term and
condition of this Agreement. No breach under this agreement shall be deemed
waived or excused by either party unless such waiver or consent is in writing signed
by the party granting such waiver or consent. The waiver by or consent of a party to
a breach of any provision of this Agreement shall not operate or be construed as a
waiver of or consent to any other or subsequent breach by such other party.
This Agreement may not be assigned (including by operation of law or otherwise) by
you without WILEY's prior written consent.
Any fee required for this permission shall be non-refundable after thirty (30) days
from receipt by the CCC.
These terms and conditions together with CCC's Billing and Payment terms and
conditions (which are incorporated herein) form the entire agreement between you
and WILEY concerning this licensing transaction and (in the absence of fraud)
supersedes all prior agreements and representations of the parties, oral or written.
This Agreement may not be amended except in writing signed by both parties. This
Agreement shall be binding upon and inure to the benefit of the parties' successors,
legal representatives, and authorized assigns.
In the event of any conflict between your obligations established by these terms and
conditions and those established by CCC's Billing and Payment terms and
conditions, these terms and conditions shall prevail.
WILEY expressly reserves all rights not specifically granted in the combination of (i)
the license details provided by you and accepted in the course of this licensing
transaction, (ii) these terms and conditions and (iii) CCC's Billing and Payment terms
and conditions.
This Agreement will be void if the Type of Use, Format, Circulation, or Requestor
Type was misrepresented during the licensing process.
This Agreement shall be governed by and construed in accordance with the laws of
the State of New York, USA, without regards to such state's conflict of law rules.
Any legal action, suit or proceeding arising out of or relating to these Terms and
Conditions or the breach thereof shall be instituted in a court of competent
jurisdiction in New York County in the State of New York in the United States of
106
America and each party hereby consents and submits to the personal jurisdiction of
such court, waives any objection to venue in such court and consents to service of
process by registered or certified mail, return receipt requested, at the last known
address of such party.
WILEY OPEN ACCESS TERMS AND CONDITIONS
Wiley Publishes Open Access Articles in fully Open Access Journals and in Subscription
journals offering Online Open. Although most of the fully Open Access journals publish
open access articles under the terms of the Creative Commons Attribution (CC BY) License
only, the subscription journals and a few of the Open Access Journals offer a choice of
Creative Commons Licenses. The license type is clearly identified on the article.
The Creative Commons Attribution License
The Creative Commons Attribution License (CC-BY) allows users to copy, distribute and
transmit an article, adapt the article and make commercial use of the article. The CC-BY
license permits commercial and non-
Creative Commons Attribution Non-Commercial License
The Creative Commons Attribution Non-Commercial (CC-BY-NC)License permits use,
distribution and reproduction in any medium, provided the original work is properly cited
and is not used for commercial purposes.(see below)
Creative Commons Attribution-Non-Commercial-NoDerivs License
The Creative Commons Attribution Non-Commercial-NoDerivs License (CC-BY-NC-ND)
permits use, distribution and reproduction in any medium, provided the original work is
properly cited, is not used for commercial purposes and no modifications or adaptations are
made. (see below)
Use by commercial "for-profit" organizations
Use of Wiley Open Access articles for commercial, promotional, or marketing purposes
requires further explicit permission from Wiley and will be subject to a fee.
Further details can be found on Wiley Online Library
http://olabout.wiley.com/WileyCDA/Section/id-410895.html

107
Other Terms and Conditions:
v1.10 Last updated September 2015
Questions? [email protected] or +1-855-239-3415 (toll free in the US) or
+1-978-646-2777.

108
Chapter 4: Analysis of Ethanol and Water in Commercial Products Using Ionic Liquid
Capillary Gas Chromatography with Thermal Conductivity Detection and/or Barrier
Discharge Ionization Detection
“Reprinted with permission from: Weatherly CA, Woods RM, Armstrong DW. Rapid
Analysis of Ethanol and Water in Commercial Products Using Ionic Liquid Capillary Gas Chromatography with Thermal Conductivity Detection and/or Barrier Discharge Ionization Detection. J Agric Food Chem 2014; 62: 1832–1838. Copyright (2014) American Chemical Society.”

109
References
1 Gabriel S, Weiner J. Ueber einige abkömmlinge des propylamins. Berichte Dtsch
Chem Ges 1888; 21: 2669–2679.
2 Walden P. Ueber die Molekulargrösse und elektrische Leitfähigkeit einiger geschmolzenen Salze. Известия Российской Академии Наук Серия Математическая 1914; 8: 405–422.
3 Sun P, Armstrong DW. Ionic liquids in analytical chemistry. Anal Chim Acta 2010; 661: 1–16.
4 Krossing I, Slattery JM, Daguenet C, Dyson PJ, Oleinikova A, Weingaertner H. Why are ionic liquids liquid? A simple explanation based on lattice and solvation energies. J Am Chem Soc 2006; 128: 13427–13434.
5 Carmichael AJ, Seddon KR. Polarity study of some 1-alkyl-3-methylimidazolium ambient-temperature ionic liquids with the solvatochromic dye, Nile Red. J Phys Org Chem 2000; 13: 591–595.
6 Armstrong DW, He L, Liu Y-S. Examination of Ionic Liquids and Their Interaction with Molecules, When Used as Stationary Phases in Gas Chromatography. Anal Chem 1999; 71: 3873–3876.
7 Anderson JL, Armstrong DW. High-stability ionic liquids. A new class of stationary phases for gas chromatography. Anal Chem 2003; 75: 4851–4858.
8 Anderson JL, Armstrong DW. Immobilized ionic liquids as high-selectivity/high-temperature/high-stability gas chromatography stationary phases. Anal Chem 2005; 77: 6453–6462.
9 Anderson JL, Ding R, Ellern A, Armstrong DW. Structure and Properties of High Stability Geminal Dicationic Ionic Liquids. J Am Chem Soc 2005; 127: 593–604.
10 Payagala T, Huang J, Breitbach ZS, Sharma PS, Armstrong DW. Unsymmetrical Dicationic Ionic Liquids: Manipulation of Physicochemical Properties Using Specific Structural Architectures. Chem Mater 2007; 19: 5848–5850.
11 Armstrong DW, Payagala T, Sidisky LM. The advent and potential impact of ionic liquid stationary phases in GC and GCxGC. LCGC N Am 2009; 27: 596, 598, 600–602, 604–605.

110
12 Payagala T, Zhang Y, Wanigasekara E, Huang K, Breitbach ZS, Sharma PS et al. Trigonal tricationic ionic liquids: A generation of gas chromatographic stationary phases. Anal Chem Wash DC U S 2009; 81: 160–173.
13 Zapadlo M, Krupcik J, Majek P, Armstrong DW, Sandra P. Use of a polar ionic liquid as second column for the comprehensive two-dimensional GC separation of PCBs. J Chromatogr A 2010; 1217: 5859–67.
14 Armstrong DW, Zhang L-K, He L, Gross ML. Ionic liquids as matrixes for matrix-assisted laser desorption/ionization mass spectrometry. Anal Chem 2001; 73: 3679–3686.
15 Berthod A, Crank JA, Rundlett KL, Armstrong DW. A second-generation ionic liquid matrix-assisted laser desorption/ionization matrix for effective mass spectrometric analysis of biodegradable polymers. Rapid Commun Mass Spectrom 2009; 23: 3409–3422.
16 Martinelango PK, Anderson JL, Dasgupta PK, Armstrong DW, Al-Horr RS, Slingsby RW. Gas-Phase Ion Association Provides Increased Selectivity and Sensitivity for Measuring Perchlorate by Mass Spectrometry. Anal Chem 2005; 77: 4829–4835.
17 Soukup-Hein RJ, Remsburg JW, Dasgupta PK, Armstrong DW. A General, Positive Ion Mode ESI-MS Approach for the Analysis of Singly Charged Inorganic and Organic Anions Using a Dicationic Reagent. Anal Chem Wash DC U S 2007; 79: 7346–7352.
18 Breitbach ZS, Warnke MM, Wanigasekara E, Zhang X, Armstrong DW. Evaluation of Flexible Linear Tricationic Salts as Gas-Phase Ion-Pairing Reagents for the Detection of Divalent Anions in Positive Mode ESI-MS. Anal Chem Wash DC U S 2008; 80: 8828–8834.
19 Warnke MM, Breitbach ZS, Dodbiba E, Crank JA, Payagala T, Sharma P et al. Positive mode electrospray ionization mass spectrometry of bisphosphonates using dicationic and tricationic ion-pairing agents. Anal Chim Acta 2009; 633: 232–237.
20 Warnke MM, Breitbach ZS, Dodbiba E, Wanigasekara E, Zhang X, Sharma P et al. The evaluation and comparison of trigonal and linear tricationic ion-pairing reagents for the detection of anions in positive mode ESI-MS. J Am Soc Mass Spectrom 2009; 20: 529–538.
21 Dodbiba E, Xu C, Payagala T, Wanigasekara E, Moon MH, Armstrong DW. Use of ion pairing reagents for sensitive detection and separation of phospholipids in the positive ion mode LC-ESI-MS. Anal Camb U K 2011; 136: 1586–1593.
22 Dodbiba E, Xu C, Wanigasekara E, Armstrong DW. Sensitive analysis of metal cations in positive ion mode electrospray ionization mass spectrometry using commercial chelating agents and cationic ion-pairing reagents. Rapid Commun Mass Spectrom 2012; 26: 1005–1013.

111
23 Xu C, Armstrong DW. High-performance liquid chromatography with paired ion electrospray ionization (PIESI) tandem mass spectrometry for the highly sensitive determination of acidic pesticides in water. Anal Chim Acta 2013; 792: 1–9.
24 Xu C, Guo H, Breitbach ZS, Armstrong DW. Mechanism and Sensitivity of Anion Detection Using Rationally Designed Unsymmetrical Dications in Paired Ion Electrospray Ionization Mass Spectrometry. Anal Chem Wash DC U S 2014; 86: 2665–2672.
25 Guo H, Dolzan MD, Spudeit DA, Xu C, Breitbach ZS, Sreenivasan U et al. Sensitive detection of anionic metabolites of drugs by positive ion mode HPLC-PIESI-MS. Int J Mass Spectrom 2015; 389: 14–25.
26 Guo H, Breitbach ZS, Armstrong DW. Reduced matrix effects for anionic compounds with paired ion electrospray ionization mass spectrometry. Anal Chim Acta 2016; 912: 74–84.
27 Guo H, Riter LS, Wujcik CE, Armstrong DW. Direct and sensitive determination of glyphosate and aminomethylphosphonic acid in environmental water samples by high performance liquid chromatography coupled to electrospray tandem mass spectrometry. J Chromatogr A 2016; 1443: 93–100.
28 Wanigasekara E, Perera S, Crank JA, Sidisky L, Shirey R, Berthod A et al. Bonded ionic liquid polymeric material for solid-phase microextraction GC analysis. Anal Bioanal Chem 2010; 396: 511–524.
29 Ho TD, Canestraro AJ, Anderson JL. Ionic liquids in solid-phase microextraction: A review. Anal Chim Acta 2011; 695: 18–43.
30 Yao C, Anderson JL. Dispersive liquid-liquid microextraction using an in situ metathesis reaction to form an ionic liquid extraction phase for the preconcentration of aromatic compounds from water. Anal Bioanal Chem 2009; 395: 1491–1502.
31 Yao C, Twu P, Anderson JL. Headspace single drop microextraction using micellar ionic liquid extraction solvents. Chromatographia 2010; 72: 393–402.
32 Clark KD, Nacham O, Purslow JA, Pierson SA, Anderson JL. Magnetic ionic liquids in analytical chemistry: A review. Anal Chim Acta 2016; : Ahead of Print.
33 Huang K, Han X, Zhang X, Armstrong DW. PEG-linked geminal dicationic ionic liquids as selective, high-stability gas chromatographic stationary phases. Anal Bioanal Chem 2007; 389: 2265–2275.
34 Payagala T, Huang J, Breitbach ZS, Sharma PS, Armstrong DW. Unsymmetrical Dicationic Ionic Liquids: Manipulation of Physicochemical Properties Using Specific Structural Architectures. Chem Mater 2007; 19: 5848–5850.

112
35 Sharma PS, Payagala T, Wanigasekara E, Wijeratne AB, Huang J, Armstrong DW. Trigonal Tricationic Ionic Liquids: Molecular Engineering of Trications to Control Physiochemical Properties. Chem Mater 2008; 20: 4182–4184.
36 Breitbach ZS, Armstrong DW. Characterization of phosphonium ionic liquids through a linear solvation energy relationship and their use as GLC stationary phases. Anal Bioanal Chem 2008; 390: 1605–1617.
37 Payagala T, Zhang Y, Wanigasekara E, Huang K, Breitbach ZS, Sharma PS et al. Trigonal tricationic ionic liquids: A generation of gas chromatographic stationary phases. Anal Chem Wash DC U S 2009; 81: 160–173.
38 Armstrong DW, Payagala T, Sidisky LM. The advent and potential impact of ionic liquid stationary phases in GC and GCxGC. LCGC N Am 2009; 27: 596, 598, 600–602, 604–605.
39 Weatherly CA, Zhang Y, Smuts JP, Fan H, Xu C, Schug KA et al. Analysis of Long-Chain Unsaturated Fatty Acids by Ionic Liquid Gas Chromatography. J Agric Food Chem 2016; 64: 1422–1432.
40 Breitbach ZS, Weatherly CA, Woods RM, Xu C, Vale G, Berthod A et al. Development and evaluation of gas and liquid chromatographic methods for the analysis of fatty amines. J Sep Sci 2014; 37: 558–565.
41 Weatherly CA, Woods RM, Armstrong DW. Rapid Analysis of Ethanol and Water in Commercial Products Using Ionic Liquid Capillary Gas Chromatography with Thermal Conductivity Detection and/or Barrier Discharge Ionization Detection. J Agric Food Chem 2014; 62: 1832–1838.
42 Ragonese C, Tranchida PQ, Dugo P, Dugo G, Sidisky LM, Robillard MV et al. Evaluation of use of a dicationic liquid stationary phase in the fast and conventional gas chromatographic analysis of health-hazardous C18 cis/trans fatty acids. Anal Chem Wash DC U S 2009; 81: 5561–5568.
43 Delmonte P, Fardin Kia A-R, Kramer JKG, Mossoba MM, Sidisky L, Rader JI. Separation characteristics of fatty acid methyl esters using SLB-IL111, a new ionic liquid coated capillary gas chromatographic column. J Chromatogr A 2011; 1218: 545–554.
44 Delmonte P, Fardin-Kia AR, Kramer JKG, Mossoba MM, Sidisky L, Tyburczy C et al. Evaluation of highly polar ionic liquid gas chromatographic column for the determination of the fatty acids in milk fat. J Chromatogr A 2012; 1233: 137–146.
45 Zeng AX, Chin S-T, Nolvachai Y, Kulsing C, Sidisky LM, Marriott PJ. Characterisation of capillary ionic liquid columns for gas chromatography-mass spectrometry analysis of fatty acid methyl esters. Anal Chim Acta 2013; 803: 166–173.

113
46 Fan H, Smuts J, Bai L, Walsh P, Armstrong DW, Schug KA. Gas chromatography-vacuum ultraviolet spectroscopy for analysis of fatty acid methyl esters. Food Chem 2016; 194: 265–271.
47 Nolvachai Y, Kulsing C, Marriott PJ. In Silico Modeling of Hundred Thousand Experiments for Effective Selection of Ionic Liquid Phase Combinations in Comprehensive Two-Dimensional Gas Chromatography. Anal Chem Wash DC U S 2016; 88: 2125–2131.
48 Weatherly CA, Zhang Y, Smuts JP, Fan H, Xu C, Schug KA et al. Analysis of Long-Chain Unsaturated Fatty Acids by Ionic Liquid Gas Chromatography. J Agric Food Chem 2016; 64: 1422–1432.
49 Jayawardhana DA, Woods RM, Zhang Y, Wang C, Armstrong DW. Rapid, efficient quantification of water in solvents and solvents in water using an ionic liquid-based GC column. LCGC N Am 2012; 30: 142, 144, 146, 148, 150, 152, 154, 157–158.
50 Frink LA, Armstrong DW. Water determination in active pharmaceutical ingredients using ionic liquids as diluents with headspace gas chromatography. In: Abstracts, 69th Southwest Regional Meeting of the American Chemical Society, Waco, TX, United States, November 16-19. American Chemical Society, 2013, p SWRM-59.
51 Frink LA, Weatherly CA, Armstrong DW. Water determination in active pharmaceutical ingredients using ionic liquid headspace gas chromatography and two different detection protocols. J Pharm Biomed Anal 2014; 94: 111–117.
52 Frink LA, Armstrong DW. The utilization of two detectors for the determination of water in honey using headspace gas chromatography. Food Chem 2016; 205: 23–27.
53 Frink LA, Armstrong DW. Water Determination in Solid Pharmaceutical Products Utilizing Ionic Liquids and Headspace Gas Chromatography. J Pharm Sci 2016; : Ahead of Print.
54 Gal J. Louis Pasteur, language, and molecular chirality. I. Background and Dissymmetry. Chirality 2011; 23: 1–16.
55 GREENSTEIN JP, BIRNBAUM SM, OTEY MC. Optical and enzymatic characterization of amino acids. J Biol Chem 1953; 204: 307–21.
56 Freudenberg K. Emil Fischer and his contribution to carbohydrate chemistry. Adv Carbohydr Chem Biochem 1966; 21: 1–38.
57 Goodman M, Cai W, Smith ND. The bold legacy of Emil Fischer. J Pept Sci Off Publ Eur Pept Soc 2003; 9: 594–603.
58 Corrigan JJ. D-Amino acids in animals. Sci Wash DC U S 1969; 164: 142–9.
114
59 Cline DB. On the determination of the physical origin of homochirality in life. Comments Nucl Part Phys 1997; 22: 131–154.
60 Stevens CM, Halpern PE, Gigger RP. Occurrence of D-amino acids in some natural materials. J Biol Chem 1951; 190: 705–10.
61 Armstrong DW, Gasper M, Lee SH, Zukowski J, Ercal N. D-Amino acid levels in human physiological fluids. Chirality 1993; 5: 375–8.
62 Armstrong DW, Duncan JD, Lee SH. Evaluation of D-amino acid levels in human urine and in commercial L-amino acid samples. Amino Acids 1991; 1: 97–106.
63 Aswad DW. Determination of d- and l-aspartate in amino acid mixtures by high-performance liquid chromatography after derivatization with a chiral adduct of o-phthaldialdehyde. Anal Biochem 1984; 137: 405–409.
64 D’Aniello A. D-Aspartic acid: an endogenous amino acid with an important neuroendocrine role. Brain Res Rev 2007; 53: 215–234.
65 Dunlop DS, Neidle A, McHale D, Dunlop DM, Lajtha A. The presence of free D-aspartic acid in rodents and man. Biochem Biophys Res Commun 1986; 141: 27–32.
66 Fuchs SA, Berger R, Klomp LWJ, de KTJ. D-amino acids in the central nervous system in health and disease. Mol Genet Metab 2005; 85: 168–80.
67 Mothet J-P, Parent AT, Wolosker H, Brady RO Jr, Linden DJ, Ferris CD et al. D-Serine is an endogenous ligand for the glycine site of the N-methyl-D-aspartate receptor. Proc Natl Acad Sci U S A 2000; 97: 4926–4931.
68 Hashimoto A, Nishikawa T, Hayashi T, Fujii N, Harada K, Oka T et al. The presence of free D-serine in rat brain. FEBS Lett 1992; 296: 33–6.
69 Hamase K, Homma H, Takigawa Y, Fukushima T, Santa T, Imai K. Regional distribution and postnatal changes of D-amino acids in rat brain. Biochim Biophys Acta Gen Subj 1997; 1334: 214–222.
70 Nagata Y, Horiike K, Maeda T. Distribution of free D-serine in vertebrate brains. Brain Res 1994; 634: 291–5.
71 Hashimoto A, Kumashiro S, Nishikawa T, Oka T, Takahashi K, Mito T et al. Embryonic development and postnatal changes in free D-aspartate and D-serine in the human prefrontal cortex. J Neurochem 1993; 61: 348–51.
72 de Koning TJ, Klomp LW. Serine-deficiency syndromes. Curr Opin Neurol 2004; 17.http://journals.lww.com/co-neurology/Fulltext/2004/04000/Serine_deficiency_syndromes.19.aspx.

115
73 Hartman AL, Santos P, O’Riordan KJ, Stafstrom CE, Marie Hardwick J. Potent anti-seizure effects of D-leucine. Neurobiol Dis 2015; 82: 46–53.
74 Burr GO, Burr MM. The nature and role of the fatty acids essential in nutrition. J Biol Chem 1930; 86: 587–621.
75 Holman RT. Essential fatty acid deficiency. Prog Chem Fats Other Lipids 1968; 9: 279–348.
76 SINCLAIR HM. Deficiency of essential fatty acids and atherosclerosis, etcetera. Lancet Lond Engl 1956; 270: 381–3.
77 Bergstrom S, Carlson LA, Weeks JR. The prostaglandins; a family of biologically active lipids. Pharmacol Rev 1968; 20: 1–48.
78 Thompson RH. Simplifying fatty acid analyses using a standard set of gas-liquid chromatographic conditions: II. Equivalent chain length values for cis- and trans- isomers of monoethylenic C18 fatty acid methyl esters for Carbowax-20M liquid phase. J Chromatogr Sci 1997; 35: 598–602.
79 Yehuda S, Carasso RL. Modulation of learning, pain thresholds, and thermoregulation in the rat by preparations of free purified α-linolenic and linoleic acids: Determination of the optimal ω3-to-ω6 ratio. Proc Natl Acad Sci U S A 1993; 90: 10345–9.
80 Holman RT. ω3 and ω6 Essential fatty acid status in human health and disease. In: Handb. Essent. Fatty Acid Biol. Humana, 1997, pp 139–182.
81 Tvrzicka E, Kremmyda L-S, Stankova B, Zak A. Fatty acids as biocompounds: their role in human metabolism, health and disease - a review. Part 1: classification, dietary sources and biological functions. Biomed Pap 2011; 155: 117–130.
82 Jakobsen MU, O’Reilly EJ, Heitmann BL, Pereira MA, Balter K, Fraser GE et al. Major types of dietary fat and risk of coronary heart disease: a pooled analysis of 11 cohort studies. Am J Clin Nutr 2009; 89: 1425–1432.
83 Riediger ND, Othman RA, Suh M, Moghadasian MH. A systemic review of the roles of n-3 fatty acids in health and disease. J Am Diet Assoc 2009; 109: 668–679.
84 Cho E, Hung S, Willett WC, Spiegelman D, Rimm EB, Seddon JM et al. Prospective study of dietary fat and the risk of age-related macular degeneration. Am J Clin Nutr 2001; 73: 209–218.
85 San Giovanni JP, Agron E, Meleth AD, Reed GF, Sperduto RD, Clemons TE et al. ω-3 Long-chain polyunsaturated fatty acid intake and 12-y incidence of neovascular age-related macular degeneration and central geographic atrophy: AREDS report 30, a prospective cohort study from the Age-Related Eye Disease Study. Am J Clin Nutr 2009; 90: 1601–1607.

116
86 Ottoboni F, Ottoboni A. Can attention deficit-hyperactivity disorder result from nutritional deficiency. J Am Physicians Surg 2003; 8: 58–60.
87 Hibbeln JR, Ferguson TA, Blasbalg TL. Omega-3 fatty acid deficiencies in neurodevelopment, aggression and autonomic dysregulation: opportunities for intervention. Int Rev Psychiatry 2006; 18: 107–118.
88 Covington MB. Omega-3 fatty acids. Am Fam Physician 2004; 70: 133–40.
89 Hamazaki T, Hamazaki K. Fish oils and aggression or hostility. Prog Lipid Res 2008; 47: 221–232.
90 Davis PF, Ozias MK, Carlson SE, Reed GA, Winter MK, McCarson KE et al. Dopamine receptor alterations in female rats with diet-induced decreased brain docosahexaenoic acid (DHA): interactions with reproductive status. Nutr Neurosci 2010; 13: 161–169.
91 US Food and Drug Administration. Guidance for industry: trans fatty acids in nutrition labeling, nutrient content claims, health claims; Small entity compliance guide. 2003.
92 U.S. FDA. 21 CFR 101.36 Nutrition Labeling of Dietary Supplements. 2006.
93 Dilzer A, Park Y. Implication of Conjugated Linoleic Acid (CLA) in Human Health. Crit Rev Food Sci Nutr 2012; 52: 488–513.
94 Grosso G, Galvano F, Marventano S, Malaguarnera M, Bucolo C, Drago F et al. Omega-3 fatty acids and depression: scientific evidence and biological mechanisms. Oxid Med Cell Longev 2014; : 313570/1-313570/17.
95 Slover HT, Lanza E. Quantitative analysis of food fatty acids by capillary gas chromatography. J Am Oil Chem Soc 1979; 56: 933–43.
96 Sidisky LM, Stormer PL, Nolan L, Keeler MJ, Bartram RJ. High-temperature partially cross-linked cyanosilicone capillary column for general-purpose gas chromatography. J Chromatogr Sci 1988; 26: 320–4.
97 Sehat N, Kramer JKG, Mossoba MM, Yurawecz MP, Roach JAG, Eulitz K et al. Identification of conjugated linoleic acid isomers in cheese by gas chromatography, silver ion high performance liquid chromatography and mass spectral reconstructed ion profiles. Comparison of chromatographic elution sequences. Lipids 1998; 33: 963–971.
98 Delmonte P, Kia A-RF, Hu Q, Rader JI. Review of methods for preparation and gas chromatographic separation of trans and cis reference fatty acids. J AOAC Int 2009; 92: 1310–1326.
99 Michaud AL, Yurawecz MP, Delmonte P, Corl BA, Bauman DE, Brenna JT. Identification and Characterization of Conjugated Fatty Acid Methyl Esters of Mixed

117
Double Bond Geometry by Acetonitrile Chemical Ionization Tandem Mass Spectrometry. Anal Chem 2003; 75: 4925–4930.
100 Ragonese C, Tranchida PQ, Dugo P, Dugo G, Sidisky LM, Robillard MV et al. Evaluation of use of a dicationic liquid stationary phase in the fast and conventional gas chromatographic analysis of health-hazardous C18 cis/trans fatty acids. Anal Chem Wash DC U S 2009; 81: 5561–5568.
101 Ragonese C, Tranchida PQ, Sciarrone D, Mondello L. Conventional and fast gas chromatography analysis of biodiesel blends using an ionic liquid stationary phase. J Chromatogr A 2009; 1216: 8992–8997.
102 Han X, Armstrong DW. Ionic liquids in separations. Acc Chem Res 2007; 40: 1079–1086.
103 Delmonte P, Fardin Kia A-R, Kramer JKG, Mossoba MM, Sidisky L, Rader JI. Separation characteristics of fatty acid methyl esters using SLB-IL111, a new ionic liquid coated capillary gas chromatographic column. J Chromatogr A 2011; 1218: 545–554.
104 Delmonte P, Fardin-Kia AR, Rader JI. Separation of Fatty Acid Methyl Esters by GC-Online Hydrogenation × GC. Anal Chem Wash DC U S 2013; 85: 1517–1524.
105 Nosheen A, Mitrevski B, Bano A, Marriott PJ. Fast comprehensive two-dimensional gas chromatography method for fatty acid methyl ester separation and quantification using dual ionic liquid columns. J Chromatogr A 2013; 1312: 118–123.
106 Ragonese C, Sciarrone D, Tranchida PQ, Dugo P, Dugo G, Mondello L. Evaluation of a Medium-Polarity Ionic Liquid Stationary Phase in the Analysis of Flavor and Fragrance Compounds. Anal Chem Wash DC U S 2011; 83: 7947–7954.
107 Turner TD, Karlsson L, Mapiye C, Rolland DC, Martinsson K, Dugan MER. Dietary influence on the m. longissimus dorsi fatty acid composition of lambs in relation to protein source. Meat Sci 2012; 91: 472–477.
108 Delmonte P, Fardin-Kia AR, Kramer JKG, Mossoba MM, Sidisky L, Tyburczy C et al. Evaluation of highly polar ionic liquid gas chromatographic column for the determination of the fatty acids in milk fat. J Chromatogr A 2012; 1233: 137–146.
109 de Boer J, Blok D, Ballesteros-Gomez A. Assessment of ionic liquid stationary phases for the determination of polychlorinated biphenyls, organochlorine pesticides and polybrominated diphenyl ethers. J Chromatogr A 2014; 1348: 158–163.
110 Reyes-Contreras C, Dominguez C, Bayona JM. Determination of nitrosamines and caffeine metabolites in wastewaters using gas chromatography mass spectrometry and ionic liquid stationary phases. J Chromatogr A 2012; 1261: 164–170.
118
111 Fardin-Kia AR, Delmonte P, Kramer JKG, Jahreis G, Kuhnt K, Santercole V et al. Separation of the Fatty Acids in Menhaden Oil as Methyl Esters with a Highly Polar Ionic Liquid Gas Chromatographic Column and Identification by Time of Flight Mass spectrometry. Lipids 2013; 48: 1279–1295.
112 Srigley CT, Rader JI. Content and composition of fatty acids in marine oil omega-3 supplements. J Agric Food Chem 2014; 62: 7268–7278.
113 Mishra VK, Temelli F, Ooraikul B. Extraction and purification of ω-3 fatty acids with an emphasis on supercritical fluid extraction - a review. Food Res Int 1993; 26: 217–26.
114 Schug KA, Sawicki I, Carlton DD, Fan H, McNair HM, Nimmo JP et al. Vacuum Ultraviolet Detector for Gas Chromatography. Anal Chem Wash DC U S 2014; 86: 8329–8335.
115 Timmins A, Macpherson EJ, Ackman RG. Direct use of methyl tricosanoate as an internal standard and overcoming a potential error in the quantitation of the omega-3 long-chain polyunsaturated fatty acids of marine oils as ethyl esters. Food Chem 2000; 70: 425–426.
116 National Institute of Standards and Technology (NIST). Standard Reference Material 3275, Omega-3 and Omega-6 Fatty Acids in Fish Oil. 2015.
117 Rohrschneider L. Chromatographic characterization of liquid phases and solutes for column selection and identification. J Chromatogr Sci 1973; 11: 160–6.
118 VUV Analytics, Inc. VUV Absorption Fitter 9.0. .
119 Press WH. Numerical recipes 3rd edition: The art of scientific computing. Cambridge university press, 2007.
120 Foley JP, Dorsey JG. Equations for calculation of chromatographic figures of merit for ideal and skewed peaks. Anal Chem 1983; 55: 730–7.
121 Ninomiya T, Nagata M, Hata J, Hirakawa Y, Ozawa M, Yoshida D et al. Association between ratio of serum eicosapentaenoic acid to arachidonic acid and risk of cardiovascular disease: The Hisayama Study. Atheroscler Amst Neth 2013; 231: 261–267.
122 Schantz MM, Sander LC, Sharpless KE, Wise SA, Yen JH, Nguyen Pho A et al. Development of botanical and fish oil standard reference materials for fatty acids. Anal Bioanal Chem 2013; 405: 4531–4538.
123 Rupilius W. Fatty amines from palm oil and palm kernel oil. J Oil Palm Res 2011; 23: 1222–1226.
124 Visek K. Amines, fatty. In: Kirk-Othmer Encycl. Chem. Technol. (5th Ed.). John Wiley & Sons, Inc., 2004, pp 518–537.

119
125 Dauqan E, Sani HA, Abdullah A, Kasim ZM. Fatty Acids Composition of Four Different Vegetable Oils (Red Palm Olein, Palm Olein, Corn Oil and Coconut Oil) by Gas Chromatography. Int Proc Chem Biol Environ Eng 2011; 14: 31–34.
126 Nelson J, Milun A. Gas chromatography of high-molecular-weight fatty primary amines. Chem Ind Lond U K 1960; : 663–4.
127 Grossi G, Vece R. Gas chromatographic analysis of primary, secondary, and tertiary fatty amines, and of corresponding quaternary ammonium compounds. J Gas Chromatogr 1965; 3: 170–3.
128 Morrissette RA, Link WE. The analysis of fatty nitrogen compounds as trifluoroacetyl derivatives. J Gas Chromatogr 1965; 3: 67–8.
129 Kuz’mina NV, Khizbullin FF, Gadomskii TY, Maistrenko VN. Gas-chromatographic determination of aliphatic amines in natural surface water and wastewater. J Anal Chem 2008; 63: 664–667.
130 Metcalfe LD, Wang CN. Gas chromatographic separation of cis and trans isomers of long chain amines. JAOCS J Am Oil Chem Soc 1981; 58: 823–5.
131 Anderson JL, Armstrong DW, Wei G-T. Ionic Liquids in Analytical Chemistry. Anal Chem 2006; 78: 2893–2902.
132 Delmonte P, Fardin Kia A-R, Kramer JKG, Mossoba MM, Sidisky L, Rader JI. Separation characteristics of fatty acid methyl esters using SLB-IL111, a new ionic liquid coated capillary gas chromatographic column. J Chromatogr A 2011; 1218: 545–554.
133 Delmonte P, Fardin-Kia AR, Kramer JKG, Mossoba MM, Sidisky L, Tyburczy C et al. Evaluation of highly polar ionic liquid gas chromatographic column for the determination of the fatty acids in milk fat. J Chromatogr A 2012; 1233: 137–146.
134 Anderson JL, Ding R, Ellern A, Armstrong DW. Structure and Properties of High Stability Geminal Dicationic Ionic Liquids. J Am Chem Soc 2005; 127: 593–604.
135 Payagala T, Zhang Y, Wanigasekara E, Huang K, Breitbach ZS, Sharma PS et al. Trigonal tricationic ionic liquids: A generation of gas chromatographic stationary phases. Anal Chem Wash DC U S 2009; 81: 160–173.
136 Breitbach ZS, Armstrong DW. Characterization of phosphonium ionic liquids through a linear solvation energy relationship and their use as GLC stationary phases. Anal Bioanal Chem 2008; 390: 1605–1617.
137 Armstrong DW, Payagala T, Sidisky LM. The advent and potential impact of ionic liquid stationary phases in GC and GCGC. LC-GC Eur 2009; 22: 459–460, 462, 464, 466.

120
138 Armstrong DW, He L, Liu Y-S. Examination of Ionic Liquids and Their Interaction with Molecules, When Used as Stationary Phases in Gas Chromatography. Anal Chem 1999; 71: 3873–3876.
139 Anderson JL, Ding J, Welton T, Armstrong DW. Characterizing Ionic Liquids On the Basis of Multiple Solvation Interactions. J Am Chem Soc 2002; 124: 14247–14254.
140 Berthod A, Ruiz-Angel MJ, Carda-Broch S. Ionic liquids in separation techniques. J Chromatogr A 2008; 1184: 6–18.
141 Anderson JL, Armstrong DW. High-stability ionic liquids. A new class of stationary phases for gas chromatography. Anal Chem 2003; 75: 4851–4858.
142 Sun P, Armstrong DW. Ionic liquids in analytical chemistry. Anal Chim Acta 2010; 661: 1–16.
143 Jayawardhana DA, Woods RM, Zhang Y, Wang C, Armstrong DW. Rapid, efficient quantification of water in solvents and solvents in water using an ionic liquid-based GC column. LCGC N Am 2012; 30: 142, 144, 146, 148, 150, 152, 154, 157–158.
144 Poole CF, Poole SK. Ionic liquid stationary phases for gas chromatography. J Sep Sci 2011; 34: 888–900.
145 Gonzalez-Alvarez J, Blanco-Gomis D, Arias-Abrodo P, Diaz-Llorente D, Rios-Lombardia N, Busto E et al. Characterization of hexacationic imidazolium ionic liquids as effective and highly stable gas chromatography stationary phases. J Sep Sci 2012; 35: 273–279.
146 Kovats E. Gas chromatographic characterization of organic compounds. I. Retention indexes of aliphatic halides, alcohols, aldehydes, and ketones. Helv Chim Acta 1958; 41: 1915–32.
147 Sandra P, David F, Proot M, Diricks G, Verstappe M, Verzele M. Selectivity and selectivity tuning in capillary gas chromatography. HRC CC J High Resolut Chromatogr Chromatogr Commun 1985; 8: 782–98.
148 Johnson JB, Funk GL. Determination of primary aliphatic amines by an acidimetric salicylaldehyde reaction. Anal Chem 1956; 28: 1977–9.
149 Standard Test Method for Iodine Value of Drying Oils and Fatty Acids. ASTM International: West Conshohocken, PA.
150 Official Methods of Analysis of the AOAC [Association of Official Analytical Chemists]. 13th Ed. AOAC, 1980.
151 Brereton P, Hasnip S, Bertrand A, Wittkowski R, Guillou C. Analytical methods for the determination of spirit drinks. TrAC Trends Anal Chem 2003; 22: 19–25.

121
152 Castritius S, Kron A, Schafer T, Radle M, Harms D. Determination of Alcohol and Extract Concentration in Beer Samples Using a Combined Method of Near-Infrared (NIR) Spectroscopy and Refractometry. J Agric Food Chem 2010; 58: 12634–12641.
153 Gerogiannaki-Christopoulou M, Kyriakidis NV, Athanasopoulos PE. New refractive index method for measurement of alcoholic strength of small volume samples. J AOAC Int 2003; 86: 1232–1235.
154 Bouthilet RJ, Caputi A, Ueda M. Analysis of ethanol in wine by gas-liquid partition chromatography. J Assoc Off Agric Chem 1961; 44: 410–14.
155 Caputi A, Wright D. Alcoholic beverages. Collaborative study of the determination of ethanol in wine by chemical oxidation. J - Assoc Off Anal Chem 1969; 52: 85–8.
156 Fernandes EN, Reis BF. Automatic flow procedure for the determination of ethanol in wine exploiting multicommutation and enzymatic reaction with detection by chemiluminescence. J AOAC Int 2004; 87: 920–926.
157 Mason M. Ethanol determination in wine with an immobilized enzyme electrode. Am J Enol Vitic 1983; 34: 173–5.
158 Ethanol determination via immobilized enzyme. J Am Soc Brew Chem 1983; 41: 89–90.
159 McCloskey LP, Replogle LL. Evaluation of an enzymic method for estimating ethanol in wines using an enzyme kit. Am J Enol Vitic 1974; 25: 194–7.
160 Sanford CL, Mantooth BA, Jones BT. Determination of ethanol in alcohol samples using a modular Raman spectrometer. J Chem Educ 2001; 78: 1221–1225.
161 Baumgarten GF. The determination of alcohol in wines by means of near infrared technology. South Afr J Enol Vitic 1987; 8: 75–7.
162 Gallignani M, Garrigues S, De la G. Direct determination of ethanol in all types of alcoholic beverages by near-infrared derivative spectrometry. Anal Camb U K 1993; 118: 1167–72.
163 Van DB, Van O, Smilde AK. Process analytical chemistry in the distillation industry using near-infrared spectroscopy. Process Control Qual 1997; 9: 51–57.
164 Collins TS, Miller CA, Altria KD, Waterhouse AL. Development of a rapid method for the analysis of ethanol in wines using capillary electrophoresis. Am J Enol Vitic 1997; 48: 280–284.
165 Martin E, Iadaresta V, Giacometti JC, Vogel J. Determination of ethanol by high-performance liquid chromatography (HPLC). Mitteilungen Aus Dem Geb Leb Hyg 1986; 77: 528–34.
122
166 Yarita T, Nakajima R, Otsuka S, Ihara T, Takatsu A, Shibukawa M. Determination of ethanol in alcoholic beverages by high-performance liquid chromatography-flame ionization detection using pure water as mobile phase. J Chromatogr A 2002; 976: 387–391.
167 Wang M-L, Choong Y-M, Su N-W, Lee M-H. A rapid method for determination of ethanol in alcoholic beverages using capillary gas chromatography. Yaowu Shipin Fenxi 2003; 11: 133–140.
168 Antonelli A. Ethanol determination by packed GLC: A quick method with small sample amount and high sensitivity. Wein-Wiss 1994; 49: 165–17.
169 Caputi A, Mooney DP. Gas chromatographic determination of ethanol in wine: collaborative study. J - Assoc Off Anal Chem 1983; 66: 1152–7.
170 Cutaia AJ. Malt beverages and brewing materials: gas chromatographic determination of ethanol in beer. J - Assoc Off Anal Chem 1984; 67: 192–3.
171 Stackler B, Christensen EN. Quantitative determination of ethanol in wine by gas chromatography. Am J Enol Vitic 1974; 25: 202–7.
172 Naviglio D, Ramano R, Attanasio G. Rapid determination of ethanol content in spirits and in beer by high resolution gas chromatography. Ind Delle Bevande 2001; 30: 113–115.
173 Wang M-L, Wang J-T, Choong Y-M. Simultaneous quantification of methanol and ethanol in alcoholic beverage using a rapid gas chromatographic method coupling with dual internal standards. Food Chem 2004; 86: 609–615.
174 Mattos IL, Sartini RP, Zagatto EAG, Reis BF, Gine MF. Spectrophotometric flow injection determination of ethanol in distilled spirits and wines involving permeation through a silicon tubular membrane. Anal Sci 1998; 14: 1005–1008.
175 Taniai T, Sukuragawa A, Okutani T. Fluorometric determination of ethanol in liquor samples by flow-injection analysis using an immobilized enzyme-reactor column with packing prepared by coupling alcohol oxidase and peroxidase onto chitosan beads. J AOAC Int 2001; 84: 1475–1483.
176 Wagner K, Bilitewski U, Schmid RD. Flow injection analysis of wine-accomplishments and needs. Microchem J 1992; 45: 114–20.
177 Trachman H. Determination of ethanol in beer by gas chromatography. Wallerstein Lab Commun 1969; 32: 111–14.
178 Horwitz W (ed.). Offical Methods of Analysis of the AOAC. Thirteenth Edition. Association of Offical Analytical Chemists: Washington, DC, 1980.
179 Sun H, Wang B, DiMagno SG. A method for detecting water in organic solvents. Org Lett 2008; 10: 4413–4416.
123
180 Streim HG, Boyce EA, Smith JR. Determination of water in 1,1-dimethylhydrazine, diethylenetriamine, and mixtures. Anal Chem 1961; 33: 85–9.
181 Knight HS, Weiss FT. Determination of traces of water in hydrocarbons. A calcium carbide gas-liquid chromatography method. Anal Chem 1962; 34: 749–51.
182 Quiram ER. Wide-diameter open tubular columns in gas chromatography. Anal Chem 1963; 35: 593–5.
183 Hogan JM, Engel RA, Stevenson HF. Versatile internal standard technique for the gas chromatographic determination of water in liquids. Anal Chem 1970; 42: 249–52.
184 MacDonald JC, Brady CA. Substitute method for the Karl Fischer titration. Gas chromatographic determination of water in ketonic solvents by use of the method of standard addition. Anal Chem 1975; 47: 947–8.
185 Houston TE. Methods for the determination of water in coatings. Met Finish 1997; 95: 36–38.
186 Jalbert J, Gilbert R, Tetreault P. Determination of the analytical performance of a headspace capillary gas chromatographic technique and Karl Fischer coulometric titration by system calibration by using oil samples containing known amounts of moisture. Anal Chem 1999; 71: 3283–3291.
187 Nussbaum R, Lischke D, Paxmann H, Wolf B. Quantitative GC determination of water in small samples. Chromatographia 2000; 51: 119–121.
188 Lee C-T, Chang S-Y. A GC-TCD method for measuring the liquid water mass of collected aerosols. Atmos Environ 2002; 36: 1883–1894.
189 O’Keefe WK, Ng FTT, Rempel GL. Validation of a gas chromatography/thermal conductivity detection method for the determination of the water content of oxygenated solvents. J Chromatogr A 2008; 1182: 113–118.
190 De J, Huizenga JR, Wolthers BG, Jansen HG, Uges DRA, Hindriks FR et al. Comparison of the precision of seven analytical methods for the water concentration in human serum and urine. Clin Chim Acta 1987; 166: 187–94.
191 Jamin E, Guerin R, Retif M, Lees M, Martin GJ. Improved Detection of Added Water in Orange Juice by Simultaneous Determination of the Oxygen-18/Oxygen-16 Isotope Ratios of Water and Ethanol Derived from Sugars. J Agric Food Chem 2003; 51: 5202–5206.
192 Fischer K. A new method for the analytical determination of the water content of liquids and solids. Angew Chem 1935; 48: 394–6.
193 Scholz E. Karl Fischer titrations of aldehydes and ketones. Anal Chem 1985; 57: 2965–71.

124
194 Vornheder PF, Brabbs WJ. Moisture determination by near-infrared spectrometry. Anal Chem 1970; 42: 1454–6.
195 Li M, Pacey GE. Spectrophotometric determination of trace water in organic solvents with a near infrared absorbing dye. Talanta 1997; 44: 1949–1958.
196 Zhou X, Hines PA, White KC, Borer MW. Gas chromatography as a reference method for moisture determination by near-infrared spectroscopy. Anal Chem 1998; 70: 390–394.
197 Pinheiro C, Lima JC, Parola AJ. Using hydrogen bonding-specific interactions to detect water in aprotic solvents at concentrations below 50ppm. Sens Actuators B Chem 2006; 114: 978–983.
198 Isengard HD, Striffler U. Karl Fischer titration in boiling methanol. Fresenius J Anal Chem 1992; 342: 287–91.
199 Scholz E. Karl Fischer titration : determination of water. Springer: Berlin ;New York, 1984.
200 Kuhn ER. Water injections in GC - how wet can you get?. LCGC N Am 2002; 20: 474–475, 478.
201 Patterson PL, Gatten RA, Kolar J, Ontiveros C. Improved linear response of the thermal conductivity detector. J Chromatogr Sci 1982; 20: 27–32.
202 Andrawes F, Greenhouse S. Applications of the helium ionization detector in trace analysis. J Chromatogr Sci 1988; 26: 153–9.
203 Shinada K, Horiike S, Uchiyama S, Takechi R, Nishimoto T. Development of new ionization detector for gas chromatography by applying dielectric barrier discharge. Shimadzu Hyoron 2012; 69: 255–263.
204 Frink LA, Weatherly CA, Armstrong DW. Water determination in active pharmaceutical ingredients using ionic liquid headspace gas chromatography and two different detection protocols. J Pharm Biomed Anal 2014; 94: 111–117.
205 Jayawardhana DA, Woods RM, Zhang Y, Wang C, Armstrong DW. Rapid, efficient quantification of water in solvents and solvents in water using an ionic liquid-based GC column. LCGC N Am 2012; 30: 142, 144, 146, 148, 150, 152, 154, 157–158.
206 Armstrong DW, He L, Liu Y-S. Examination of Ionic Liquids and Their Interaction with Molecules, When Used as Stationary Phases in Gas Chromatography. Anal Chem 1999; 71: 3873–3876.
207 Anderson JL, Ding J, Welton T, Armstrong DW. Characterizing Ionic Liquids On the Basis of Multiple Solvation Interactions. J Am Chem Soc 2002; 124: 14247–14254.

125
208 Anderson JL, Armstrong DW. High-stability ionic liquids. A new class of stationary phases for gas chromatography. Anal Chem 2003; 75: 4851–4858.
209 Anderson JL, Armstrong DW. Immobilized ionic liquids as high-selectivity/high-temperature/high-stability gas chromatography stationary phases. Anal Chem 2005; 77: 6453–6462.
210 Anderson JL, Ding R, Ellern A, Armstrong DW. Structure and Properties of High Stability Geminal Dicationic Ionic Liquids. J Am Chem Soc 2005; 127: 593–604.
211 Huang K, Han X, Zhang X, Armstrong DW. PEG-linked geminal dicationic ionic liquids as selective, high-stability gas chromatographic stationary phases. Anal Bioanal Chem 2007; 389: 2265–2275.
212 Armstrong DW, Payagala T, Sidisky LM. The advent and potential impact of ionic liquid stationary phases in GC and GCxGC. LCGC N Am 2009; 27: 596, 598, 600–602, 604–605.
213 Restek. Analyzing alcoholic beverages by gas chromatography. www.restek.com/pdfs/59462.pdf (accessed 18 Jul2016).
214 Hinshaw JV. Non-linear calibration. LC-GC Eur 2002; 15: 722–724, 726–727.
215 Hinshaw JV. Non-linearity in a chromatographic system. LC-GC Eur 2002; 15: 406, 408–409.
216 Vauquelin LN, Robiquet PJ. The discovery of a new plant principle in Asparagus sativus. Ann Chim 1806; 57: 88–93.
217 Vickery HB, Schmidt CLA. History of the discovery of the amino acids. Chem Rev Wash DC U S 1931; 9: 169–318.
218 Armstrong DW, Zukowski J, Ercal N, Gasper M. Stereochemistry of pipecolic acid found in the urine and plasma of subjects with peroxisomal deficiencies. J Pharm Biomed Anal 1993; 11: 881–6.
219 Janecka A, Fichna J, Janecki T. Opioid receptors and their ligands. Curr Top Med Chem Sharjah United Arab Emir 2004; 4: 1–17.
220 Heck SD, Siok CJ, Krapcho KJ, Kelbaugh PR, Thadeio PF, Welch MJ et al. Functional consequences of posttranslational isomerization of Ser46 in a calcium channel toxin. Sci Wash C 1994; 266: 1065–8.
221 Miyoshi Y, Koga R, Oyama T, Han H, Ueno K, Masuyama K et al. HPLC analysis of naturally occurring free D-amino acids in mammals. J Pharm Biomed Anal 2012; 69: 42–49.

126
222 Morikawa A, Hamase K, Inoue T, Konno R, Niwa A, Zaitsu K. Determination of free d-aspartic acid, d-serine and d-alanine in the brain of mutant mice lacking d-amino-acid oxidase activity. J Chromatogr B Biomed Sci App 2001; 757: 119–125.
223 Bathena SP, Huang J, Epstein AA, Gendelman HE, Boska MD, Alnouti Y. Rapid and reliable quantitation of amino acids and myo-inositol in mouse brain by high performance liquid chromatography and tandem mass spectrometry. J Chromatogr B Analyt Technol Biomed Life Sci 2012; 893–894: 15–20.
224 Lu X, Lu J, Liu C-W, Zhao S-L. Determination of D-aspartic acid and D-glutamic acid in midbrain of Parkinson’s disease mouse by reversed phase high performance liquid chromatography. Fenxi Huaxue 2007; 35: 1151–1154.
225 Hamase K, Inoue T, Morikawa A, Konno R, Zaitsu K. Determination of free D-proline and D-leucine in the brains of mutant mice lacking D-amino acid oxidase activity. Anal Biochem 2001; 298: 253–258.
226 Yamanaka M, Miyoshi Y, Ohide H, Hamase K, Konno R. d-Amino acids in the brain and mutant rodents lacking d-amino-acid oxidase activity. Amino Acids 2012; 43: 1811–1821.
227 D’Aniello S, Somorjai I, Garcia-Fernandez J, Topo E, D’Aniello A. D-Aspartic acid is a novel endogenous neurotransmitter. FASEB J 2011; 25: 1014–1027, 10-168492.
228 Kasukurthi R, Brenner MJ, Moore AM, Moradzadeh A, Ray WZ, Santosa KB et al. Transcardial perfusion versus immersion fixation for assessment of peripheral nerve regeneration. J Neurosci Methods 2009; 184: 303–9.
229 Gage GJ, Kipke DR, Shain W. Whole Animal Perfusion Fixation for Rodents. J Vis Exp JoVE 2012; : 3564.
230 Sasabe J, Suzuki M, Imanishi N, Aiso S. Activity of D-amino acid oxidase is widespread in the human central nervous system. Front Synaptic Neurosci 2014; 6: 14/1-14/10, 10 .
231 Ure JA, Perassolo M. Update on the pathophysiology of the epilepsies. J Neurol Sci 2000; 177: 1–17.
232 Patel DC, Breitbach ZS, Wahab MF, Barhate CL, Armstrong DW. Gone in Seconds: Praxis, Performance, and Peculiarities of Ultrafast Chiral Liquid Chromatography with Superficially Porous Particles. Anal Chem Wash DC U S 2015; 87: 9137–9148.
233 Mangas A, Coveñas R, Bodet D, Geffard M, Aguilar LA, Yajeya J. Immunocytochemical visualization of d-glutamate in the rat brain. Neuroscience 2007; 144: 654–664.
234 Han H, Miyoshi Y, Koga R, Mita M, Konno R, Hamase K. Changes in D-aspartic acid and D-glutamic acid levels in the tissues and physiological fluids of mice with various D-aspartate oxidase activities. J Pharm Biomed Anal 2015; 116: 47–52.

127
235 Riljak V, Milotova M, Jandova K, Langmeier M, Maresova D, Pokorny J et al. Repeated kainic acid administration and hippocampal neuronal degeneration. Prague Med Rep 2005; 106: 75–8.
236 Chugh BP, Lerch JP, Yu LX, Pienkowski M, Harrison RV, Henkelman RM et al. Measurement of cerebral blood volume in mouse brain regions using micro-computed tomography. NeuroImage 2009; 47: 1312–8.
237 Wu EX, Tang H, Asai T, Yan SD. Regional cerebral blood volume reduction in transgenic mutant APP (V717F, K670N/M671L) mice. Neurosci Lett 2004; 365: 223–227.
238 Friedman M. Origin, microbiology, nutrition, and pharmacology of D-amino acids. In: D-Amino Acids Chem., Life Sci., Biotechnol. Verlag Helvetica Chimica Acta, 2011, pp 173–212.
239 Morikawa A, Hamase K, Inoue T, Konno R, Zaitsu K. Alterations in D-amino acid levels in the brains of mice and rats after the administration of D-amino acids. Amino Acids 2007; 32: 13–20.
240 Pollegioni L, Piubelli L, Sacchi S, Pilone MS, Molla G. Physiological functions of D-amino acid oxidases: from yeast to humans. Cell Mol Life Sci 2007; 64: 1373–1394.
241 Veal EA, Day AM, Morgan BA. Hydrogen peroxide sensing and signaling. Mol Cell 2007; 26: 1–14.
242 Moreno S, Nardacci R, Cimini A, Ceru MP. Immunocytochemical localization of D-amino acid oxidase in rat brain. J Neurocytol 1999; 28: 169–185.
243 Bendikov I, Nadri C, Amar S, Panizzutti R, De MJ, Wolosker H et al. A CSF and postmortem brain study of D-serine metabolic parameters in schizophrenia. Schizophr Res 2007; 90: 41–51.
244 Wolosker H, Blackshaw S, Snyder SH. Serine racemase: a glial enzyme synthesizing D-serine to regulate glutamate-N-methyl-D-aspartate neurotransmission. Proc Natl Acad Sci U S A 1999; 96: 13409–13414.
245 Han H, Miyoshi Y, Koga R, Mita M, Konno R, Hamase K. Changes in d-aspartic acid and d-glutamic acid levels in the tissues and physiological fluids of mice with various d-aspartate oxidase activities. Recent Adv -Amino Acid Res 2015; 116: 47–52.
246 Schell MJ, Cooper OB, Snyder SH. d-aspartate localizations imply neuronal and neuroendocrine roles. Proc Natl Acad Sci U S A 1997; 94: 2013–2018.
247 Zaar K, Köst H-P, Schad A, Völkl A, Baumgart E, Fahimi HD. Cellular and subcellular distribution of D-aspartate oxidase in human and rat brain. J Comp Neurol 2002; 450: 272–282.
128
248 Dixon M, Kleppe K. D-Amino acid oxidase. II. Specificity, competitive inhibition, and reaction sequence. Biochim Biophys Acta Nucleic Acids Protein Synth 1965; 96: 368–82.
249 Madeira C, Freitas ME, Vargas-Lopes C, Wolosker H, Panizzutti R. Increased brain d-amino acid oxidase (DAAO) activity in schizophrenia. Schizophr Res 2008; 101: 76–83.
250 Kim PM, Duan X, Huang AS, Liu CY, Ming G-L, Song H et al. Aspartate racemase, generating neuronal D-aspartate, regulates adult neurogenesis. Proc Natl Acad Sci U S A 2010; 107: 3175–3179, S3175/1–S3175/4.
251 Meldrum BS. Glutamate as a neurotransmitter in the brain: review of physiology and pathology. J Nutr 2000; 130: 1007S–1015S.
252 Daikhin Y, Yudkoff M. Compartmentation of brain glutamate metabolism in neurons and glia. J Nutr 2000; 130: 1026S–1031S.
253 Shen J, Petersen KF, Behar KL, Brown P, Nixon TW, Mason GF et al. Determination of the rate of the glutamate/glutamine cycle in the human brain by in vivo 13C NMR. Proc Natl Acad Sci U S A 1999; 96: 8235–8240.
254 Wilson WE, Koeppe RE. Metabolism of D- and L-glutamic acid in the rat. J Biol Chem 1961; 236: 365–9.
255 Pow DV, Crook DK. Direct immunocytochemical evidence for the transfer of glutamine from glial cells to neurons: use of specific antibodies directed against the D-stereoisomers of glutamate and glutamine. Neurosci Oxf 1996; 70: 295–302.
256 Liang Q, Liu H, Xing H, Jiang Y, Zhang T, Zhang A-H. High-resolution mass spectrometry for exploring metabolic signatures of sepsis-induced acute kidney injury. RSC Adv 2016; 6: 29863–29868.
257 Gorgievski-Hrisoho M, Colombo JP, Bachmann C. Stimulation of tryptophan uptake into brain microvessels by D-glutamine. Brain Res 1986; 367: 395–7.
258 Davis JL, Cherkin A. D-Glutamine produces seizures and retrograde amnesia in the chick. Pharmacol Biochem Behav 1981; 15: 367–9.
259 Wolosker H. NMDA receptor regulation by D-serine: new findings and perspectives. Mol Neurobiol 2007; 36: 152–164.
260 Schell MJ. The N-methyl D-aspartate receptor glycine site and D-serine metabolism: an evolutionary perspective. Philos Trans R Soc Lond B Biol Sci 2004; 359: 943–964.
261 D’ANIELLO A, DI FIORE MM, FISHER GH, MILONE A, SELENI A, D’ANIELLO S et al. Occurrence of D-aspartic acid and N-methyl-D-aspartic acid in rat

129
neuroendocrine tissues and their role in the modulation of luteinizing hormone and growth hormone release. FASEB J 2000; 14: 699–714.
262 D’Aniello A, Cosmo AD, Cristo CD, Annunziato L, Petrucelli L, Fisher G. Involvement of D-Aspartic acid in the synthesis of testosterone in rat testes. Life Sci 1996; 59: 97–104.
263 D’Aniello A, Lee JM, Petrucelli L, Di Fiore MM. Regional decreases of free D-aspartate levels in Alzheimer’s disease. Neurosci Lett 1998; 250: 131–134.
264 Fisher GH, D’Aniello A, Vetere A, Padula L, Cusano GP, Man EH. Free D-aspartate and D-alanine in normal and Alzheimer brain. Brain Res Bull 1991; 26: 983–5.
265 Topo E, Soricelli A, Di Maio A, D’Aniello E, Di Fiore MM, D’Aniello A. Evidence for the involvement of d-aspartic acid in learning and memory of rat. Amino Acids 2010; 38: 1561–1569.
266 Errico F, Nistico R, Di Giorgio A, Squillace M, Vitucci D, Galbusera A et al. Free D-aspartate regulates neuronal dendritic morphology, synaptic plasticity, gray matter volume and brain activity in mammals. Transl Psychiatry 2014; 4: e417.
267 Wang W, Liu G, Yamashita K, Manabe M, Kodama H. Characteristics of prolinase against various iminodipeptides in erythrocyte lysates from a normal human and a patient with prolidase deficiency. Clin Chem Lab Med 2004; 42: 1102–1108.
268 Estin C, Vernadakis A. Primary glial cells and brain fibroblasts: Interactions in culture. Brain Res Bull 1986; 16: 723–731.
269 Oeckl P, Ferger B. Analysis of hydroxylation and nitration products of D-phenylalanine for in vitro and in vivo radical determination using high-performance liquid chromatography and photodiode array detection. J Chromatogr B Analyt Technol Biomed Life Sci 2009; 877: 1501–1508.
270 Yumatov AE, Sarychev EI, Kozlovskii II, Mineeva MF, Demidov VM, Morozov IS et al. Increasing stability to emotional stress by means of D-phenylalanine. Zhurnal Vysshei Nervn Deyatelnosti Im P Pavlova 1991; 41: 156–61.
271 Fisher GH, D’Aniello A, Vetere A, Padula L, Cusano GP, Man EH. Free D-aspartate and D-alanine in normal and Alzheimer brain. Brain Res Bull 1991; 26: 983–5.
272 Tsai GE, Yang P, Chang Y-C, Chong M-Y. D-alanine added to antipsychotics for the treatment of schizophrenia. Biol Psychiatry 2006; 59: 230–234.
130
Biographical Information
Choyce Asher Weatherly obtained his Bachelor of Science degree in
chemistry in 2011 from the University of Texas at Arlington. Directly following, in the Fall
of 2011 Choyce became a graduate student at the University of Texas in Arlington. That
same year he joined the Armstrong research group and focused his research on GC and
HPLC. His research interests are all forms of chromatography and separation science.
He plans to continue his research with the Armstrong research group and consult with
AZYP, LLC.