advances in secure and networked information systems the adit
TRANSCRIPT

Festschrift in honor ofprofessor NAHID SHAHMEHRI
Advances in Secure and
Networked Information Systems–
The ADIT Perspective
Edited by:Patrick Lambrix

ISBN: 978-91-7519-717-3 (printed version) - printed by LiU-TryckISBN: 978-91-7519-716-6 (electronic version) - published by LiU Electronic Press
Preface
This book contains contributions by current and former colleagues and PhD studentsof professor Nahid Shahmehri in celebration of her 60th birthday. Although it would bedifficult to cover the full range of her academic contributions, we have at least been ableto hint the importance and the breadth of her work. We have chosen the title ‘Advancesin Secure and Networked Information Systems - The ADIT Perspective’ as many ofthe contributions of Nahid and her group have been in these areas, given a fairly broadinterpretation of “networked information systems”. In this collection we have gatheredboth republications of past work as well as newly written articles.
I met Nahid for the first time when I was a beginning PhD student and she was aboutto finish her PhD. At that time we belonged to different groups and our research hadnot so much in common. I do remember attending her PhD defence and learning aboutslicing in debugging1 of programs. As Mariam Kamkar’s contribution shows, this wasan important new technique.
I met Nahid again, after she had worked for a few years in industry. At that time shewas hired to become the leader of the group in which I worked. While continuing withthe work that was ongoing in the group, she also started to introduce her own focus.Under Nahid’s leadership the group began to work in new fields including computersecurity, peer-to-peer networks, vehicular communication and assistive technologies.Nahid has always been a visionary and I have always admired her intuition for whatresearch will be important in the future.
Her largest body of recent work is in the area of computer security where she was,among other things, project manager of the FP7 SHIELDS project and research directorof the iTRUST Center for Information Security. Several of her current and former PhDstudents have contributed a republication describing different aspects of the work onsecurity performed within the group. The contribution of Claudiu Duma deals withkey management for multicast for distributing data in a secure way. Martin Karresandcontributes an article about a method for determining the probable file type of binarydata fragments. Shanai Ardi presents work on a unified process for software security.The most recent work includes Anna Vapen’s contribution about security levels for webauthentication using mobile phones and Rahul Hiran’s contribution on spam filtering.Lin Han contributes a personal statement about her experience in Linkoping and theimportance of this experience for her later career as an information security expert.
In the area of assistive technologies Nahid co-defined the research direction of theNational Institute for the Study of Ageing and Later Life. In this book there are twocontributions from former students in assistive technologies. The contribution of JohanAberg presents the findings from a field study of a general user support model for webinformation systems. The article by Dennis Maciuszek, now at the University of Ros-tock and the University of Education Schwabisch Gmund, builds a bridge between hiswork in Linkoping and his current work on virtual worlds for learning.
1 Interestingly, although Nahid has long since moved on to other topics, I started working about20 years later on debugging - not of programs, but of ontologies.

In the area of peer-to-peer computing Nahid co-founded2 the International Con-ference on Peer-to-Peer Computing series of which the 12th edition was organized in2012.
When the ADIT division at the Department of Computer and Information Sciencewas created in 2000, Nahid became the director of the division. Current senior re-searchers at ADIT have contributed articles about their work within the division. PatrickLambrix describes the contributions of the ADIT division to the area of ontology en-gineering, in particular to ontology alignment (with Rajaram Kaliyaperumal) and on-tology debugging (with Valentina Ivanova and Zlatan Dragisic). Jose M Pena and DagSonntag present an overview of the ADIT contributions in the area of learning chaingraphs under different interpretations. The article by Fang Wei-Kleiner describes a so-lution for the Steiner problem. This problem has received much attention due to itsapplication in the keyword search query processing over graph-structured data. NiklasCarlsson reflects on whether an up-to-date music collection would be an appropriatebirthday gift for Nahid based on his work on popularity dynamics. Leonardo Martuccidescribes his work on privacy in Cloud Computing, Smart Grids and participatory sens-ing.
Further, two former senior researchers at ADIT have contributed articles related totheir current work. Lena Stromback now works at the Swedish Meteorological and Hy-drological Institute (SMHI). She presents an overview of the work of the hydrologicalgroup at SMHI from a data management perspective. He Tan, now at Jonkoping Uni-versity, presents an ontology-based approach for building a domain corpus annotatedwith semantic roles.
I am grateful to Brittany Shahmehri for proofreading, and to Behnam Nourparvarand Jalal Maleki for designing the cover of this book.
With this book we congratulate Nahid and thank her for what she has done for usover the years. As her research continues, we look forward to many future successes.
Patrick LambrixDecember 2012
2 Together with our recently deceased former colleague Ross Lee Graham.

Table of Contents
Republications
Bug Localization by Algorithmic Debugging and Program Slicing . . . . . . . 1
Mariam Kamkar
An Empirical Study of Human Web Assistants: Implications for UserSupport in Web Information Systems . . . . . . . . . . . . . . . . . . . . . . . . . . . . . . . . 19
Johan Aberg
A Flexible Category-Based Collusion-Resistant Key ManagementScheme for Multicast . . . . . . . . . . . . . . . . . . . . . . . . . . . . . . . . . . . . . . . . . . . . . . 29
Claudiu Duma
Oscar - File Type Identification of Binary Data in Disk Clusters andRAM Pages . . . . . . . . . . . . . . . . . . . . . . . . . . . . . . . . . . . . . . . . . . . . . . . . . . . . . . 43
Martin Karresand
Towards a Structured Unified Process for Software Security . . . . . . . . . . . . 57
Shanai Ardi
Security Levels for Web Authentication Using Mobile Phones . . . . . . . . . . . 67
Anna Vapen
TRAP: Open Decentralized Distributed Spam Filtering . . . . . . . . . . . . . . . . 83
Rahul Hiran
Original articles
Contributions of LiU/ADIT to Ontology Alignment . . . . . . . . . . . . . . . . . . . 97
Patrick Lambrix and Rajaram Kaliyaperumal
Contributions of LiU/ADIT to Debugging Ontologies and OntologyMappings . . . . . . . . . . . . . . . . . . . . . . . . . . . . . . . . . . . . . . . . . . . . . . . . . . . . . . . . 109
Patrick Lambrix, Valentina Ivanova and Zlatan Dragisic
Contributions of LiU/ADIT to Chain Graphs . . . . . . . . . . . . . . . . . . . . . . . . . 121
Jose M. Pena and Dag Sonntag
Contributions of LiU/ADIT to Steiner Tree Computation over LargeGraphs . . . . . . . . . . . . . . . . . . . . . . . . . . . . . . . . . . . . . . . . . . . . . . . . . . . . . . . . . . 131
Fang Wei-Kleiner
Pages 3-17, 21-28, 31-42, 45-56, 59-65, 69-82, 85-96 have been removed due to Copyright issues.

Broadening the Audience: Popularity Dynamics and Scalable ContentDelivery Techniques . . . . . . . . . . . . . . . . . . . . . . . . . . . . . . . . . . . . . . . . . . . . . . . 139
Niklas Carlsson
Contributions of LiU/ADIT to Informational Privacy . . . . . . . . . . . . . . . . . . 145Leonardo A. Martucci
From Databases and Web Information Systems to Hydrology andEnvironmental Information Services . . . . . . . . . . . . . . . . . . . . . . . . . . . . . . . . . 157
Lena Stromback
Semantic Role Labeling for Biological Event . . . . . . . . . . . . . . . . . . . . . . . . . . 165He Tan
Intelligent Assistance in Virtual Worlds for Learning . . . . . . . . . . . . . . . . . . 175Dennis Maciuszek
IISLAB, Nahid and Me . . . . . . . . . . . . . . . . . . . . . . . . . . . . . . . . . . . . . . . . . . . . 187Lin Han
Bug Localization by Algorithmic Debuggingand Program Slicing
Mariam Kamkar
Department of Computer and Information ScienceLinkoping University, 581 83 Linkoping, Sweden
Republication of:Mariam Kamkar, Nahid Shahmehri and Peter Fritzson. Bug Localization byAlgorithmic Debugging and Program Slicing. In Proceedings of the Interna-tional Conference on Programming Language Implementation and Logic Pro-gramming, LNCS 456, 60-74, Springer-Verlag, 1990.http://dx.doi.org/10.1007/BFb0024176.With kind permission of Springer Science+Business Media.
Introduction
This paper is one of the early papers in bug localization based on combining Nahid’sresearch on algorithmic debugging with my research on program slicing.
Nahid’s contribution made it possible to use algorithmic debugging not only forProlog programs with no side-effects but also for programs in procedural languageswith side-effects.
My reason for choosing this paper comes from two good memories I have. Firstof all it received the highest score in evaluation from all reviewers in a top-rankedconference which was exciting for us as PhD students.
Secondly it inspired the initial idea of organizing the 1st International Workshopon Automated and Algorithmic Debugging, AADEBUG’93 in Linkoping, which wasfollowed by a number of AADEBUG conferences around the world.
1

An Empirical Study of Human Web Assistants:Implications for User Support in Web Information
Systems
Johan Aberg
Department of Computer and Information ScienceLinkoping University, 581 83 Linkoping, Sweden
Republication of:Johan Aberg and Nahid Shahmehri. An Empirical Study of Human Web As-sistants: Implicationsfor User Support in Web Information Systems. In Proceedings of the SIGCHIConference on Human Factors in Computing Systems, 404-411, ACM, 2001.http://doi.acm.org/10.1145/365024.365305c©2001 Association for Computing Machinery, Inc. Reprinted by permission.
Introduction
The present paper was the culmination of my PhD project on Live Help systems, aproject which was supervised by Nahid Shahmehri.
A funny thing is that the topic of Live Help systems was in fact a fairly large devi-ation from the topic proposed to me by Nahid. I had gotten stuck on my original topicand was desperately seeking a way forward. The idea of Live Help systems came tome as I was reading a science fiction novel by Tad Williams. I was quickly sold by thegeneral idea and tried to package it as a PhD project and convince Nahid as well. It tooka couple of discussions and a small experiment before I got her on board. But after thatthings moved fast and we could fairly quickly implement a live help system and set up alarge scale field study. This paper presentes some of the most interesting findings fromthat study.
I would like to take this opportunity to express my sincere gratitude towards NahidShahmehri as my supervisor. She was incredibly supporting, and also a good role modelfor my future career.
19

A Flexible Category-Based Collusion-Resistant KeyManagement Scheme for Multicast.
Claudiu Duma
Department of Computer and Information ScienceLinkoping University, 581 83 Linkoping, Sweden
Republication of:Claudiu Duma, Nahid Shahmehri and Patrick Lambrix. A Flexible Category-Based Collusion-Resistant Key Management Scheme for Multicast. In Securityand Privacy in the Age of Uncertainty - Proceedings of the 18th IFIP Interna-tional Information Security Conference, Dimitris Gritzalis, Sabrina de Capitanidi Vimercati, Pierangela Samarati, and Sokratis Katsikas (eds.), pp 133 – 144,Kluwer, 2003.With kind permission of Springer Science+Business Media.
29


Oscar file type identification of binary data in diskclusters and RAM pages
Martin Karresand
Computer Forensic Group
Forensic Document and Information Technology Unit
Swedish National Laboratory of Forensic Science
S-581 94 Linköping, Sweden
Republication of:
Martin Karresand and Nahid Shahmehri. Oscar file type identification of binary
data in disk clusters and RAM pages. In Proc. IFIP Security and Privacy inDynamic Environments, vol. 201, pp. 413 – 424, Springer US, 2006.
http://dx.doi.org/10.1007/0-387-33406-8_35.
With kind permission of Springer Science+Business Media.
Introduction
In 2005 a friend of mine asked me to help him recover some lost digital photos of
his newborn child. He had made no backup of his computer and because of a failed
security update of the operating system the data on the hard disk had been corrupted. I
used all the data recovery tools that I had available, but without any success, the photos
were lost. At that time I was one of Professor Nahid Shahmehri’s PhD students, doing
research in the area of intrusion detection in overlay networks. My friend’s question
changed that and with Professor Shahmehri’s approval I instead started to explore the
world of computer forensics. My new goal was to find a way to categorise fragments of
unknown data and then put the pieces together again into (hopefully) complete files. To
help my friend I based the research around jpeg images.
The chosen paper is important to me because it was the first publication in a series of
papers about file carving in extreme situations. It also introduced a new sub-field within
the file carving research area according to Anandabrata Pal and Nasir Memon, who
wrote “Classifications for File Carving: Karresand et al. [. . . ] were the first to look at
classifying individual data clusters and not entire files.”1 Hence Professor Shahmehri is
one of the founders of a completely new research field, which since then has expanded
into a well established field with several active research groups around the world.
What about my friend’s photos, then? Well, I managed to recover 10 odd images for
him, so the story has a happy ending.
1 Page 69 in Anandabrata Pal and Nasir Memon. The evolution of file carving. In IEEE SignalProcessing Magazine, vol. 26, issue 2, pp. 59 – 71, http://dx.doi.org/10.1109/MSP.2008.931081
43

Towards a Structured Unified Process forSoftware Security
Shanai Ardi
Republication of:Shanai Ardi, David Byers and Nahid Shahmehri. Towards a Structured UnifiedProcess for Software Security. In Proceedings of the International Workshopon Software Engineering for Secure Systems, 3-10, ACM, 2006.http://doi.acm.org/10.1145/1137627.1137630c©2006 Association for Computing Machinery, Inc. Reprinted by permission.
Introduction
Today, most aspects of critical infrastructure are controlled by, or even defined by, soft-ware and security of such software systems has become important. In order to remaincompetitive, software vendors need to improve their development process and demon-strate self-certification with respect to security assurance. Various ways to address se-curity problems in a software product have been proposed in recent times: intrusionprevention mechanisms; hardware-based solutions to detect and prevent attacks on soft-ware systems; standard approaches such as penetration testing and patch managementor deploying solutions like input filtering. A common shortcoming of these solutions isthat these mechanisms aim at software security after software is already built and arebased on finding and fixing known security problems after they have been exploited infield systems. Another typical problem is that although security failure data and lessonslearned from them can improve the security and survivability of the software systems,existing methods do not focus on preventing the recurrence of vulnerabilities.
In 2005, Professor Shahmehri was among the first researchers in Sweden who iden-tified secure software development as a new problem area. The first step was to performa survey study and learn about the problem area. Later she initiated a research project onthe topic in collaboration with two industrial partners. The article ’Towards a structuredunified process for software security’, of which I am the principle author, was the firstpublished in this project. The article presents a novel solution to identify weaknesses inthe software development process which may lead to software vulnerabilities. Person-ally, I consider Prof. Shahmehri’s role in developing this solution to be very significant.Her supervision, guidance, and feedback enabled us to transform a very rough idea oftracing causes to software vulnerabilities back to development phases, to a structuredprocess improvement method that received very good comments from the research com-munity. The contribution presented in this article was used as the basis for initiating theShields Project (a FP7 EU Project) which was successful and received good reviewresults from the EU commission.
57

Security Levels for Web Authentication UsingMobile Phones
Anna Vapen
Department of Computer and Information ScienceLinkoping University, 581 83 Linkoping, Sweden
Republication of:Anna Vapen and Nahid Shahmehri. Security Levels for Web AuthenticationUsing Mobile Phones. In Privacy and Identity Management for Life, SimoneFischer-Hubner, Penny Duquenoy, Marit Hansen, Ronald Leenes and Ge Zhang(eds.), pp 130 – 143, Springer, 2011.http://dx.doi.org/10.1007/978-3-642-20769-3.With kind permission of Springer Science+Business Media.
Introduction
During my first years as Nahid Shahmehri’s PhD student my main research focus wasauthentication using mobile platforms as authentication devices. This was a naturalcontinuation of my master’s thesis on the use of smartcards in authentication. Insteadof smartcards we shifted our focus to handheld devices such as mobile phones.
Smartphones which combine the computing capacity of handheld computers withthe communication channels of mobile phones were a popular research topic, even ifsmartphones were quite limited at the time. Still, it was clear that smartphones wouldbecome increasingly more powerful and widespread. We discussed smartphones in ourwork, but did not want to be limited to this particular type of device. Instead, we aimedat finding flexible, secure and usable authentication solutions in which almost any mo-bile phone could be used.
We started with a practical publication on optical authentication, giving a specificexample of how mobile phones could be used in authentication. The next step wasto investigate how our authentication solution could be used in different types of au-thentication scenarios requiring different levels of security (e.g. online banking wouldnormally require stronger authentication than social networking does). We compareddifferent authentication solutions in which mobile phones were used and constructed amethod of evaluating and designing these solutions, considering both the security re-lated benefits and drawbacks of using highly communicative devices for authentication.This work on security levels was first presented at PrimeLife/IFIP summer school onprivacy and identity management in 2010 and extended for a republication in the sum-mer school post-proceedings. The PrimeLime post-proceedings paper is the one I havechosen to republish here since it represents an important part of my work with Nahid. Itis represented in my licentiate thesis as well as in a journal article which combines bothsecurity levels and optical authentication. The security level concept is also used in thelatter part of my doctoral studies.
67

68

TRAP: Open Decentralized Distributed Spam Filtering
Rahul Hiran
Department of Computer and Information Science
Linkoping University, 581 83 Linkoping, Sweden
Republication of:
Nahid Shahmehri, David Byers, and Rahul Hiran. TRAP: Open Decentralized
Distributed Spam Filtering. In Trust, Privacy and Security in Digital Busi-ness, Steven Furnell, Costas Lambrinoudakis, Gunther Pernul (eds.), pp 86-97,
Springer-Verlag, 2011.
http://dx.doi.org/10.1007/978-3-642-22890-2 8.
With kind permission of Springer Science+Business Media.
Introduction
As my first scientific publication, this article is very special for me. This was my first
experience of doing research, writing a paper and getting it published.
This was all possible thanks to continuous motivation, support and an occasional
push from Nahid. In fact, Nahid visited the university during her summer break just to
listen to my presentation. She gave comments, asked difficult questions and made sure
that I gave a good presentation. This made things easy for me during the conference
presentation as I was well prepared. In retrospect, all the lessons learned will not end
up being used only for the publication of this paper. I will carry these lessons with
me through out my life and use them every time I write a new paper or give another
presentation. In this sense, besides being my first publication, this article becomes even
more special.
It gives me immense pleasure to express my gratitude to all the support that I have
received from Nahid for my first publication. I wish a very happy birthday to Nahid on
this special day.
83

84

Contributions of LiU/ADIT toOntology Alignment
Patrick Lambrix1,2 and Rajaram Kaliyaperumal1
(1) Department of Computer and Information Science(2) Swedish e-Science Research Centre
Linkoping University, 581 83 Linkoping, Sweden
Abstract. In recent years more and more ontologies have been developed andused in semantically-enabled applications. In many cases, however, there is aneed to use multiple ontologies. Therefore, the issue of ontology alignment, i.e.finding overlap between different ontologies has become increasingly important.In this chapter we present the contributions of the ADIT division at LinkopingUniversity to the field of ontology alignment.
1 Introduction
Researchers in various areas, e.g. medicine, agriculture and environmental sciences, usedata sources and tools to answer different research questions or to solve various tasks,for instance, in drug discovery or in research on the influence of environmental factorson human health and diseases. Due to the recent explosion of the amount of on-lineaccessible data and tools, finding the relevant sources and retrieving the relevant infor-mation is not an easy task. Further, often information from different sources needs to beintegrated. The vision of a Semantic Web alleviates these difficulties. A key technologyfor the Semantic Web are ontologies. Intuitively, ontologies can be seen as defining thebasic terms and relations of a domain of interest, as well as the rules for combiningthese terms and relations [17]. The benefits of using ontologies include reuse, sharingand portability of knowledge across platforms, and improved documentation, mainte-nance, and reliability. Ontologies lead to a better understanding of a field and to moreeffective and efficient handling of information in that field.
Many of the currently developed ontologies contain overlapping information. Forinstance, Open Biological and Biomedical Ontologies (http://www.obofoundry.org/)lists circa 40 different ontologies in the anatomy domain (August 2012). Often wewant to use multiple ontologies. For instance, companies may want to use communitystandard ontologies and use them together with company-specific ontologies. Applica-tions may need to use ontologies from different areas or from different views on onearea. Ontology developers may want to use already existing ontologies as the basisfor the creation of new ontologies by extending the existing ontologies or by combin-ing knowledge from different smaller ontologies. In each of these cases it is importantto know the relationships between the terms in the different ontologies. Further, thedata in different data sources in the same domain may have been annotated with dif-ferent but similar ontologies. Knowledge of the inter-ontology relationships would in
97
this case lead to improvements in search, integration and analysis of data. It has beenrealized that this is a major issue and much research has been performed during thelast decade on ontology alignment, i.e. finding mappings between terms in different on-tologies (e.g. [4]). The probably largest overview of such systems (up to 2009) can befound in [11]. More information can also be found in review papers (e.g. [19, 13, 20,18, 6]), the book [4] on ontology matching, and at http://www.ontologymatching.org/.There is also a yearly event, the Ontology Alignment Evaluation Initiative (OAEI,http://oaei.ontologymatching.org/), that focuses on evaluating the automatic generationof mapping suggestions and in that way it generates important knowledge about theperformance of ontology alignment systems.
In this chapter we describe the contribution to ontology alignment of the ADITdivision at Linkoping University. In Section 2 we describe our framework for ontologyalignment. Further, in Section 3 we describe our contributions to the state of the art inontology alignment. This includes innovative algorithms for the different components ofthe ontology alignment framework, as well as unique additional components. Althoughcurrent ontology alignment systems work well, there are a number of issues that needto be tackled when dealing with large ontologies. In Section 4 we present our ideas fora further development of ontology alignment systems that deals with these issues. Wenote that this would lead to advances in several of the future challenges for ontologyalignment [19].
2 Ontology alignment framework
Many ontology alignment systems are based on the computation of similarity valuesbetween terms in different ontologies and can be described as instantiations of our gen-eral framework shown in Figure 1. This framework was first introduced in [12, 13] andan extension was proposed in [10]. It consists of two parts. The first part (I in Figure1) computes mapping suggestions. The second part (II) interacts with a domain expertto decide on the final mappings.1 Based on our experience and the experience in theOAEI, it is clear that to obtain high-quality mappings, the mapping suggestions shouldbe validated by a domain expert.
An alignment algorithm receives as input two source ontologies. The ontologies canbe preprocessed, for instance, to select pieces of the ontologies that are likely to containmatching terms. The algorithm includes one or several matchers, which calculate sim-ilarity values between the terms from the different source ontologies and can be basedon knowledge about the linguistic elements, structure, constraints and instances of theontology. Also auxiliary information can be used. Mapping suggestions are then deter-mined by combining and filtering the results generated by one or more matchers. Byusing different matchers and combining and filtering the results in different ways weobtain different alignment strategies. The suggestions are then presented to a domainexpert who validates them. The acceptance and rejection of a suggestion may influence
1 Some systems are completely automatic (only part I). Other systems have a completely man-ual mode where a user can manually align ontologies without receiving suggestions from thesystem (only part II). Several systems implement the complete framework (parts I and II) andallow the user to add own mappings as well.
98

further suggestions. Further, a conflict checker is used to avoid conflicts introduced bythe mapping relationships. The output of the ontology alignment system is an alignmentwhich is a set of mappings between terms from the source ontologies.
alignment
ontologies
generaldictionary
instancecorpus
domainthesaurus
matchermatcher
matcher
Preprocessing
checkerconflict
user
II
I
accepted and
suggestionsrejected
filter
combination
suggestionsmapping
Fig. 1. Alignment framework.
3 Contributions to the state of the art
3.1 Evaluations
In our initial work (2002-2003) we evaluated existing tools for ontology alignment andmerging for their use in bioinformatics. The evaluations in [8] are to our knowledgethe first evaluations of ontology tools using bio-ontologies. At that time they were alsoamong the largest evaluations of ontology tools [7]. We investigated the availability,stability, representation language and functionalities of the tools. Further, we evaluatedthe quality of the mapping suggestions. This is usually defined in terms of precision,recall and f-measure. Precision is a measure that is defined as the number of correctmapping suggestions divided by the number of mapping suggestions. Recall is definedas the number of correct mapping suggestions divided by the number of correct map-pings. F-measure combines precision and recall. We also evaluated the user interfaceswith respect to relevance, efficiency, attitude and learnability.
At a later stage, based on our experience using and evaluating our own ontologyalignment system (SAMBO), we developed a framework for evaluating ontology align-ment strategies and their combinations [14]. We also implemented a tool, KitAMO
99
(ToolKit for Aligning and Merging Ontologies), that is based on the framework andsupports the study, evaluation and comparison of alignment strategies and their combi-nations based on their performance and the quality of their alignments on test cases. Italso provides support for the analysis of the evaluation results. It was used for evalua-tions and in applications in e.g. [14, 23, 5].
3.2 Standard components and systems
Most of our work in 2004-2006 dealt with advancing the state of the art in the standardcomponents of the ontology alignment framework.
Matchers. We implemented a number of matchers. Some of these are standard orsmall extensions of standard algorithms. The matcher n-gram computes a similaritybased on 3-grams. An n-gram is a set of n consecutive characters extracted from astring. Similar strings will have a high proportion of n-grams in common. The matcherTermBasic uses a combination of n-gram, edit distance and an algorithm that comparesthe lists of words of which the terms are composed. A Porter stemming algorithm isemployed to each word. The matcher TermWN extends TermBasic by using WordNet[26] for looking up is-a relations. The matcher UMLSM uses the domain knowledgein the Unified Medical Language System (UMLS, [21]) to obtain mappings. We alsoimplemented a structure-based approach based on similarity propagation to ancestorsand desscendants. These are all described in [13].
In [22] we defined an instance-based matcher that makes use of scientific literature.We defined a general framework for document-based matchers. It is based on the intu-ition that a similarity measure between concepts in different ontologies can be definedbased on the probability that documents about one concept are also about the other con-cept and vice versa. In [22] naive Bayes classifiers were generated and used to classifydocuments, while in [16] support vector machines were used. Further, we also imple-mented an approach based on the normalized information distance [24].
Combination. In our implemented system we allow the choice of a weighted-sumapproach or a maximum-based approach. In the first approach each matcher is givena weight and the final similarity value between a pair of terms is the weighted sumof the similarity values divided by the sum of the weights of the used matchers. Themaximum-based approach returns as final similarity value between a pair of terms, themaximum of the similarity values from different matchers.
Filtering. Most systems implement the single threshold filtering approach whichretains concept pairs with a similarity value equal to or higher than a given threshold asmapping suggestions. The other pairs are discarded.
In [1] we proposed the double threshold filtering mechanism where two thresholdsare introduced to improve the alignment results of the strategies. Concept pairs withsimilarity values equal to or higher than the upper threshold are retained as mappingsuggestions. These pairs are also used to partition the ontologies based on the struc-ture of the ontologies. The pairs with similarity values between the lower and upperthresholds are filtered using the partitions. Only pairs of which the elements belongto corresponding elements in the partitions are retained as suggestions - they conformto the existing structures of the ontologies. Pairs with similarity values lower than thelower threshold are rejected as mapping suggestions.
100

Strategies - lessons learned. An alignment strategy contains a preprocessing ap-proach, matchers, a combination strategy and a filtering strategy. In general, the linguistics-based approaches give high recall and low precision for low single thresholds, and highprecision and low recall for high single thresholds. The structure-based approachesfind some mappings, but require a previous round of aligning. The domain knowledgematcher (independent of thresholds) has high precision, but the recall depends on thecompleteness of the domain knowledge - UMLS is quite complete for some topics, butlacks information for others. The document-based approaches also give high precision,but rather low recall. They also need relatively low thresholds. In general, combiningdifferent matchers gives better results. Further, using the double threshold filtering ap-proach may increase precision a lot, while maintaining a similar level of recall.
System. We implemented a system based on our framework and the algorithms forthe components as described above. In 2007 and 2008 we participated in the OAEIwhere we focused on the Anatomy track. SAMBO performed well in 2007 and wonthe track in 2008. SAMBO’s successor, SAMBOdtf, obtained second place in 2008, butwas the best system in a new task where a partial alignment was given [15].
3.3 Additional components
Use of partial alignments. In [10] we added a component to the framework represent-ing already known mappings. These could have been obtained from domain expertsor through previous rounds of aligning. The set of known mappings is a partial align-ment (PA). We investigated how the use of PAs could improve the results of alignmentsystems and developed algorithms for preprocessing, matching and filtering. In our ex-periments with the new algorithms we found that the use of PAs in preprocessing andfiltering reduces the number of mapping suggestions and in most cases leads to an im-provement in precision. In some cases also the recall improved. One of the filteringapproaches should always be used. As expected, for approaches using structural infor-mation (similar to the double threshold filtering) the quality of the structure in the un-derlying ontologies has a large impact. The proposed matchers can be used for findingnew mapping suggestions, but should be used in combination with others. This studywas the first in its kind.
Recommending alignment strategies. We also developed methods that providerecommendations on alignment strategies for a given alignment problem. The first ap-proach [23] requires the user or an oracle to validate all pairs in small segments of theontologies. As a domain expert or oracle has validated all pairs in the segments, fullknowledge is available for these small parts of the ontologies. The recommendation al-gorithm then proposes a particular setting for which matchers to use, which combinationstrategy and which thresholds, based on the performance of the strategies (in terms ofprecision, recall, f-measure) on the validated segments. The second and third approachcan be used when the results of a validation are available. In the second approach therecommendation algorithm proposes a particular setting based on the performance ofthe alignment strategies on all the already validated mapping suggestions. In the thirdapproach we use the segment pairs (as in the first approach) and the results of earliervalidation to compute a recommendation.
101

4 Session-based ontology alignment
Systems based on the existing frameworks function well when dealing with small on-tologies, but there are a number of limitations when dealing with larger ontologies. Forsmall ontologies the computation of mapping suggestions can usually be performed fastand therefore the user can start validation almost immediately and usually can validateall suggestions in relatively short time. However, for large ontologies this is not thecase. The computation of mapping suggestions can take a long time. Currently, to ourknowledge, no system allows to start validating some of the suggestions before everymapping suggestion is computed. There is some work on pruning the search space ofpossible mappings (e.g. [3, 2, 10, 25]) which reduces the computation time, but the com-putation time may still be high and pruning may result in loss of correct suggestions. Adomain expert may, therefore, want to start validating partial results. Further, it is clearthat, in the general case, there are too many mapping suggestions to validate all at once.Therefore, a domain expert may want to validate a sub-set of the computed mappingsuggestions, and continue later on. An advantage of this would be that the validatedmapping suggestions could be used by the system as new information for re-computingor for improving the quality of the mapping suggestions. Further, the validated map-ping suggestions can also be used for evaluating the performance of different alignmentalgorithms and thereby form a basis for recommending which algorithms to use.
In the remainder of this Section, we propose a framework that introduces the no-tion of computation, validation and recommendation sessions. It allows the alignmentsystem to divide the work on the computation of mapping suggestions, it allows thedomain expert to divide the work on validating mapping suggestions and it supportsthe use of validation results in the (re)computation of mapping suggestions and the rec-ommendation of alignment strategies to use. Our work addresses several of the mainchallenges in ontology alignment [19]. We address large-scale ontology matching byintroducing sessions, efficiency of matching techniques by avoiding exhaustive pair-wise comparisons, matching with background knowledge by using previous decisionson mapping suggestions as well as using thesauri and domain-specific corpora, matcherselection, combination and tuning by using an approach for recommending matchers,combinations and filters, and user involvement by providing support in the validationphase based on earlier experiments with ontology engineering systems user interfaces.For a state of the art overview within each of these challenges, we refer to [19]. Further,we introduce an implemented system, based on our session-based framework, that inte-grates solutions for these challenges in one system. The system can be used as ontologyalignment system as well as a system for evaluation of advanced strategies.
4.1 Framework
Our new framework is presented in Figure 2. The input to the system are the ontolo-gies that need to be aligned, and the output is an alignment between the ontologies.The alignment in this case consists of a set of mappings that are accepted after valida-tion. When starting an alignment process the user starts a computation session. When auser returns to an alignment process, she can choose to start or continue a computationsession or a validation session.
102

Fig. 2. Session-based framework.
During the computation sessions mapping suggestions are computed. The computa-tion may involve preprocessing of the ontologies, matching, and combination and filter-ing of matching results. Auxiliary resources such as domain knowledge and dictionariesmay be used. A reasoner may be used to check consistency of the proposed mappingsuggestions in connection with the ontologies as well as among each other. Users maybe involved in the choice of algorithms. This is similar to what most ontology alignmentsystems do. However, in this case the algorithms may also take into account the resultsof previous validation and recommendation sessions. Further, we allow that computa-tion sessions can be stopped and partial results can be delivered. It is therefore possiblefor a domain expert to start validation of results before all suggestions are computed.The output of a computation session is a set of mapping suggestions.
During the validation sessions the user validates the mapping suggestions gener-ated by the computation sessions. A reasoner may be used to check consistency of thevalidations. The output of a validation session is a set of mapping decisions (acceptedand rejected mapping suggestions). The accepted mapping suggestions form a PA andare part of the final alignment. The mapping decisions (regarding acceptance as well asrejection of mapping suggestions) can be used in future computation sessions as wellas in recommendation sessions. Validation sessions can be stopped and resumed at anytime. It is therefore not neccesary for a domain expert to validate all mapping sugges-tions in one session. The user may also decide not to resume the validation but start anew computation session, possibly based on the results of a recommendation session.
The input for the recommendation sessions consists of a database of algorithmsfor the preprocessing, matching, combination and filtering in the computation sessions.During the recommendation sessions the system computes recommendations for which(combination) of those algorithms may perform best for aligning the given ontologies.When validation results are available these may be used to evaluate the different algo-rithms, otherwise an oracle may be used. The output of this session is a recommendation
103

Fig. 3. Screenshot: start session.
for the settings of a future computation session. These sessions are normally run whena user is not validating and results are given when the user logs in into the system again.
We note that most existing systems can be seen as an instantiation of the frameworkwith one or more computation sessions and some systems also include one validationsession.
4.2 Implemented System
We have implemented a prototype based on the framework described above.
Session framework When starting an alignment process for the first time, the user willbe referred immediately to a computation session. However, if the user has previouslystored sessions, then a screen as in Figure 3 is shown and the user can start a new sessionor resume any of the previous sessions.
The information about sessions is stored in the session management database. Thisincludes information about the user, the ontologies, the list of already validated map-pings suggestions, the list of not yet validated mappings suggestions, and last accessdate. In the current implementation only validation sessions can be saved. When a com-putation session is interrupted, a new validation session is created and this can be stored.
Computation Figure 4 shows a screen shot of the system at the start of a computa-tion session. It allows for the setting of the session parameters. The computation ofmapping suggestions uses the following steps. During the settings selection the userselects which algorithms to use for the preprocessing, matching, combining and filter-ing steps. An experienced user may choose her own settings. Otherwise, the suggestionof a recommendation session (by clicking the ’Use recommendations from predefinedstrategies’ button) or a default setting may be used. This information is stored in thesession information database.
When a PA is available, the preprocessing step partitions the ontologies into corre-sponding mappable parts that make sense with respect to the structure of the ontologies
104
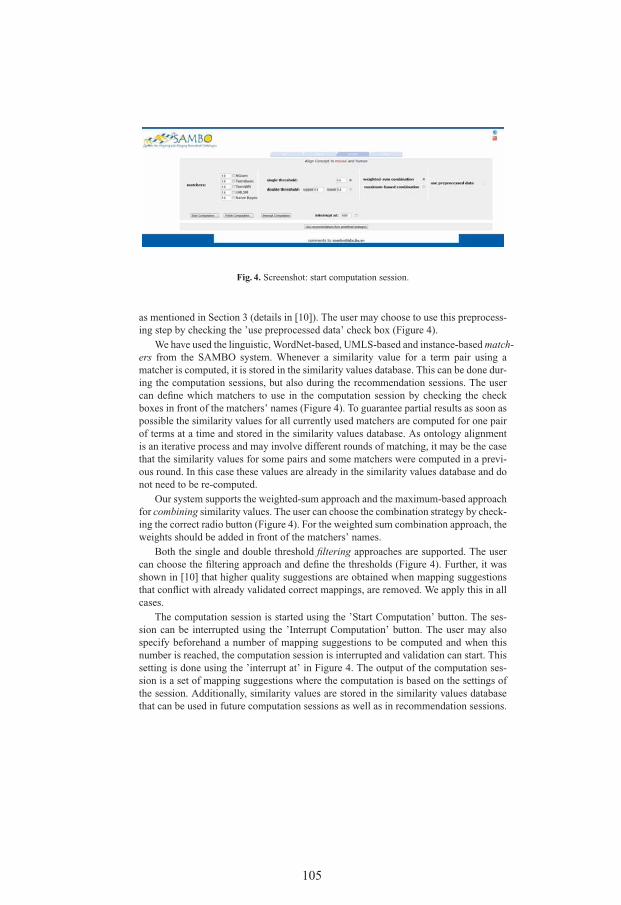
Fig. 4. Screenshot: start computation session.
as mentioned in Section 3 (details in [10]). The user may choose to use this preprocess-ing step by checking the ’use preprocessed data’ check box (Figure 4).
We have used the linguistic, WordNet-based, UMLS-based and instance-based match-ers from the SAMBO system. Whenever a similarity value for a term pair using amatcher is computed, it is stored in the similarity values database. This can be done dur-ing the computation sessions, but also during the recommendation sessions. The usercan define which matchers to use in the computation session by checking the checkboxes in front of the matchers’ names (Figure 4). To guarantee partial results as soon aspossible the similarity values for all currently used matchers are computed for one pairof terms at a time and stored in the similarity values database. As ontology alignmentis an iterative process and may involve different rounds of matching, it may be the casethat the similarity values for some pairs and some matchers were computed in a previ-ous round. In this case these values are already in the similarity values database and donot need to be re-computed.
Our system supports the weighted-sum approach and the maximum-based approachfor combining similarity values. The user can choose the combination strategy by check-ing the correct radio button (Figure 4). For the weighted sum combination approach, theweights should be added in front of the matchers’ names.
Both the single and double threshold filtering approaches are supported. The usercan choose the filtering approach and define the thresholds (Figure 4). Further, it wasshown in [10] that higher quality suggestions are obtained when mapping suggestionsthat conflict with already validated correct mappings, are removed. We apply this in allcases.
The computation session is started using the ’Start Computation’ button. The ses-sion can be interrupted using the ’Interrupt Computation’ button. The user may alsospecify beforehand a number of mapping suggestions to be computed and when thisnumber is reached, the computation session is interrupted and validation can start. Thissetting is done using the ’interrupt at’ in Figure 4. The output of the computation ses-sion is a set of mapping suggestions where the computation is based on the settings ofthe session. Additionally, similarity values are stored in the similarity values databasethat can be used in future computation sessions as well as in recommendation sessions.
105

Fig. 5. Screenshot: mapping suggestion.
In case the user decides to stop a computation session, partial results are available, andthe session may be resumed later on. The ’Finish Computation’ button allows a user tofinalize the alignment process.2
Validation The validation session allows a domain expert to validate mapping sugges-tions (Figure 5). The mapping suggestions can come from a computation session (com-plete or partial results) or be the remaining part of the mapping suggestions of a previousvalidation session. For the validation we extended the user interface of SAMBO.
After validation a reasoner is used to detect conflicts in the decisions and the user isnotified if any such occur.
The mapping decisions are stored in the mapping decisions database. The acceptedmapping suggestions constitute a PA and are partial results for the final output of theontology alignment system. The mapping decisions (both accepted and rejected) canalso be used in future computation and recommendation sessions.
Validation sessions can be stopped at any time and resumed later on (or if so desired- the user may also start a new computation session).
Recommendation We implemented the recommendation strategies described in Sec-tion 3.3. We note that in all approaches, when similarity values for concepts for certainmatchers that are needed for computing the performance, are not yet available, thesewill be computed and added to the similarity values database.
The results of the recommendation algorithms are stored in the recommendationdatabase. For each of the alignment algorithms (including matchers, combinations, andfilters) the recommendation approach and the performance measure are stored. The usercan use the recommendations when starting or continuing a computation session.
4.3 Initial experiments
We performed some initial experiments using the OAEI 2011 Anatomy track (an on-tology containing 2737 concepts and an ontology containing 3298 concepts). We used
2 A similar button is available in validation sessions.
106
the algorithms described above in different combinations, resulting in 4872 alignmentstrategies.
Some of the lessons learned are the following. It is clearly useful to allow a user tointerrupt and resume the different stages of the ontology alignment tasks. Further, usingthe similarity values database and previously computed results gives clear performancegains. It is advantageous when string matchers are used, and even more advantageouswhen more complex matchers are used. The speed-up for the latter may be up to 25%.Further, filtering after the locking of sessions is useful and the worse the initial strategy,the more useful this is. Also, the recommendation is important, especially when theinitial strategy is not good. It is also clear that the approaches using validation decisions,become better the more suggestions are validated. Further, for the approaches usingsegment pairs, the choice of the segment pairs influences the recommendation results.We also note that the system allowed us to perform experiments regarding the differentcomponents of the ontology alignment framework that were not possible with earliersystems. For details we refer to [9].
5 Conclusion
In this chapter we have introduced ontology alignment and described the contributionsof LiU/ADIT in this field. In future work we will continue to develop and evaluate com-putation strategies and recommendation strategies. Especially interesting are strategiesthat reuse validation results in, for instance, preprocessing to reduce the search space orguide the computation. Another track that we will further investigate is the connectionbetween ontology alignment and ontology debugging3.
Acknowledgements
Most of the research was made possible by the financial support of the Swedish Re-search Council (Vetenskapsradet), the Swedish National Graduate School in ComputerScience (CUGS), the Swedish e-Science Research Centre (SeRC) and the Centre forIndustrial Information Technology (CENIIT).
We thank He Tan, Qiang Liu, Wei Xu, Chen Bi, Anna Edberg, Manal Habbouche,Marta Perez, Muzammil Zareen Khan, Shahab Qadeer, Jonas Laurila Bergman, ValentinaIvanova, and Vaida Jakoniene, for previous cooperation on this subject.
References
1. B Chen, P Lambrix, and H Tan. Structure-based filtering for ontology alignment. In IEEEWETICE Workshop on Semantic Technologies in Collaborative Applications, pages 364–369, 2006.
2. H-H Do and E Rahm. Matching large schemas: approaches and evaluation. InformationSystems, 32:857–885, 2007.
3 See chapter Contributions of LiU/ADIT to Debugging Ontologies and Ontology Mappings inthis book.
107

3. M Ehrig and S Staab. QOM - quick ontology mapping. In 3rd International Semantic WebConference, LNCS 3298, pages 683–697, 2004.
4. J Euzenat and P Schvaiko. Ontology Matching. Springer, 2007.5. V Ivanova, J Laurila Bergman, U Hammerling, and P Lambrix. Debugging taxonomies
and their alignments: the ToxOntology - MeSH use case. In 1st International Workshop onDebugging Ontologies and Ontology Mappings, 2012.
6. Y Kalfoglou and M Schorlemmer. Ontology mapping: the state of the art. The KnowledgeEngineering Review, 18(1):1–31, 2003.
7. Knowledge Web, Network of Excellence. State of the art on the scalability of ontology-basedtechnology. 2004. Deliverable D2.1.1,http://knowledgeweb.semanticweb.org.
8. P Lambrix and A Edberg. Evaluation of ontology merging tools in bioinformatics. In PacificSymposium on Biocomputing, pages 589–600, 2003.
9. P Lambrix and R Kaliyaperumal. Session-based ontology alignment. 2012. Research report.10. P Lambrix and Q Liu. Using partial reference alignments to align ontologies. In 6th Euro-
pean Semantic Web Conference, LNCS 5554, pages 188–202, 2009.11. P Lambrix, L Stromback, and H Tan. Information Integration in Bioinformatics with On-
tologies and Standards. In Bry and Maluszynski, editors, Semantic Techniques for the Web:The REWERSE perspective, chapter 8, pages 343–376. Springer, 2009.
12. P Lambrix and H Tan. A framework for aligning ontologies. In 3rd Workshop on Principlesand Practice of Semantic Web Reasoning, LNCS 3703, pages 17–31, 2005.
13. P Lambrix and H Tan. SAMBO - a system for aligning and merging biomedical ontologies.Journal of Web Semantics, 4(3):196–206, 2006.
14. P Lambrix and H Tan. A tool for evaluating ontology alignment strategies. Journal on DataSemantics, LNCS 4380, VIII:182–202, 2007.
15. P Lambrix, H Tan, and Q Liu. SAMBO and SAMBOdtf results for the Ontology AlignmentEvaluation Initiative 2008. In 3rd International Workshop on Ontology Matching, pages190–198, 2008.
16. P Lambrix, H Tan, and X Wei. Literature-based alignment of ontologies. In 3rd InternationalWorkshop on Ontology Matching, pages 219–223, 2008.
17. R Neches, R Fikes, T Finin, T Gruber, and W Swartout. Enabling technology for knowledgeengineering. AI Magazine, 12(3):26–56, 1991.
18. NF Noy. Semantic integration: A survey of ontology-based approaches. SIGMOD Record,33(4):65–70, 2004.
19. P Schvaiko and J Euzenat. Ontology matching: state of the art and future challenges. IEEETransactions on Knowledge and Data Engineering, 2012.
20. P Shvaiko and J Euzenat. A survey of schema-based matching approaches. Journal on DataSemantics, IV:146–171, 2005.
21. Unified Medical Language System. http://www.nlm.nih.gov/research/umls/about umls.html.22. H Tan, V Jakoniene, P Lambrix, J Aberg, and N Shahmehri. Alignment of biomedical on-
tologies using life science literature. In International Workshop on Knowledge Discovery inLife Science Literature, LNBI 3886, pages 1–17, 2006.
23. H Tan and P Lambrix. A method for recommending ontology alignment strategies. In 6thInternational Semantic Web Conference and 2nd Asian Semantic Web Conference, LNCS4825, pages 494–507, 2007.
24. T Wachter, H Tan, A Wobst, P Lambrix, and M Schroeder. A corpus-driven approach for de-sign, evolution and alignment of ontologies. In Winter Simulation Conference, pages 1595–1602, 2006. Invited contribution.
25. P Wang, Y Zhou, and B Xu. Matching large ontologies based on reduction anchors. In 22ndInternational Joint Conference on Artificial Intelligence, pages 2243–2348, 2011.
26. WordNet. http://wordnet.princeton.edu/.
108
Contributions of LiU/ADIT toDebugging Ontologies and Ontology Mappings
Patrick Lambrix, Valentina Ivanova, Zlatan Dragisic
Department of Computer and Information Scienceand Swedish e-Science Research Centre
Linkoping University, 581 83 Linkoping, Sweden
Abstract. In recent years more and more ontologies as well as alignments be-tween ontologies have been developed and used in semantically-enabled applica-tions. To obtain good results these semantically-enabled applications need high-quality ontologies and alignments. Therefore, the issue of debugging, i.e., findingand dealing with defects in ontologies and alignments has become increasinglyimportant. In this chapter we present the pioneering contributions of the ADITdivision at Linkoping University to the field of ontology debugging.
1 Introduction
In recent years many ontologies have been developed. Intuitively, ontologies can beseen as defining the basic terms and relations of a domain of interest, as well as therules for combining these terms and relations [25]. They are a key technology for theSemantic Web. The benefits of using ontologies include reuse, sharing and portabilityof knowledge across platforms, and improved documentation, maintenance, and reli-ability. Ontologies lead to a better understanding of a field and to more effective andefficient handling of information in that field.
Ontologies differ regarding the kind of information they can represent. From aknowledge representation point of view ontologies can have the following components(e.g., [30, 19]). Concepts represent sets or classes of entities in a domain. For instance,in Figure 1 nose represents all noses. The concepts may be organized in taxonomies,often based on the is-a relation (e.g., nose is-a sensory organ in Figure 1) or the part-ofrelation (e.g., nose part-of respiratory system in Figure 1). Instances represent the actualentities. They are, however, often not represented in ontologies. Further, there are manytypes of relations (e.g., chromosone has-sub-cellular-location nucleus). Finally, axiomsrepresent facts that are always true in the topic area of the ontology. These can be suchthings as domain restrictions (e.g., the origin of a protein is always of the type genecoding origin type), cardinality restrictions (e.g., each protein has at least one source),or disjointness restrictions (e.g., a helix can never be a sheet and vice versa). From aknowledge representation point of view, ontologies can be classified according to thecomponents and the information regarding the components they contain. In this chapterwe focus on two kinds of ontologies: taxonomies and ontologies represented as ALC
acyclic terminologies.
109
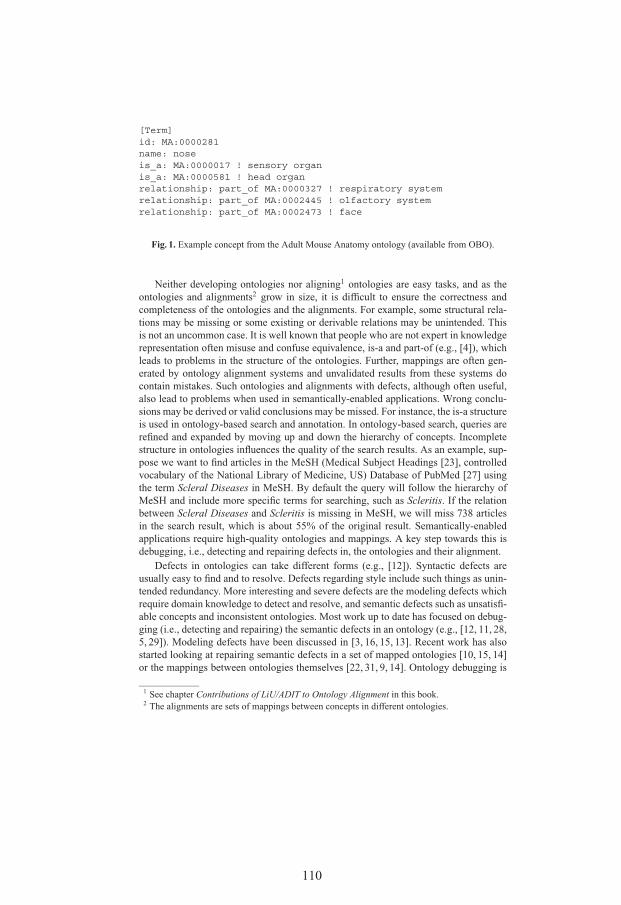
[Term]id: MA:0000281name: noseis_a: MA:0000017 ! sensory organis_a: MA:0000581 ! head organrelationship: part_of MA:0000327 ! respiratory systemrelationship: part_of MA:0002445 ! olfactory systemrelationship: part_of MA:0002473 ! face
Fig. 1. Example concept from the Adult Mouse Anatomy ontology (available from OBO).
Neither developing ontologies nor aligning1 ontologies are easy tasks, and as theontologies and alignments2 grow in size, it is difficult to ensure the correctness andcompleteness of the ontologies and the alignments. For example, some structural rela-tions may be missing or some existing or derivable relations may be unintended. Thisis not an uncommon case. It is well known that people who are not expert in knowledgerepresentation often misuse and confuse equivalence, is-a and part-of (e.g., [4]), whichleads to problems in the structure of the ontologies. Further, mappings are often gen-erated by ontology alignment systems and unvalidated results from these systems docontain mistakes. Such ontologies and alignments with defects, although often useful,also lead to problems when used in semantically-enabled applications. Wrong conclu-sions may be derived or valid conclusions may be missed. For instance, the is-a structureis used in ontology-based search and annotation. In ontology-based search, queries arerefined and expanded by moving up and down the hierarchy of concepts. Incompletestructure in ontologies influences the quality of the search results. As an example, sup-pose we want to find articles in the MeSH (Medical Subject Headings [23], controlledvocabulary of the National Library of Medicine, US) Database of PubMed [27] usingthe term Scleral Diseases in MeSH. By default the query will follow the hierarchy ofMeSH and include more specific terms for searching, such as Scleritis. If the relationbetween Scleral Diseases and Scleritis is missing in MeSH, we will miss 738 articlesin the search result, which is about 55% of the original result. Semantically-enabledapplications require high-quality ontologies and mappings. A key step towards this isdebugging, i.e., detecting and repairing defects in, the ontologies and their alignment.
Defects in ontologies can take different forms (e.g., [12]). Syntactic defects areusually easy to find and to resolve. Defects regarding style include such things as unin-tended redundancy. More interesting and severe defects are the modeling defects whichrequire domain knowledge to detect and resolve, and semantic defects such as unsatisfi-able concepts and inconsistent ontologies. Most work up to date has focused on debug-ging (i.e., detecting and repairing) the semantic defects in an ontology (e.g., [12, 11, 28,5, 29]). Modeling defects have been discussed in [3, 16, 15, 13]. Recent work has alsostarted looking at repairing semantic defects in a set of mapped ontologies [10, 15, 14]or the mappings between ontologies themselves [22, 31, 9, 14]. Ontology debugging is
1 See chapter Contributions of LiU/ADIT to Ontology Alignment in this book.2 The alignments are sets of mappings between concepts in different ontologies.
110

currently establishing itself as a sub-field of ontology engineering. The first workshopon debugging ontologies and ontology mappings was held in 2012 (WoDOOM, [17]).
In this chapter we describe the research on ontology debugging performed at theADIT division at Linkoping University (LiU/ADIT). The group has done pioneeringwork in the debugging of the structure of ontologies. Our earliest work on debuggingstemmed from an analysis of the observation that, in contrast to our expectation, ourontology alignment system SAMBOdtf came in second place in the Anatomy trackof the Ontology Alignment Evaluation Initiative 2008, after our ontology alignmentsystem SAMBO [20]. SAMBOdtf is an extension of SAMBO that makes heavy useof the structure of the ontologies. Our analysis showed that the reason for SAMBOdtfperforming worse than SAMBO was the fact there were many missing is-a relationsin the ontologies. In [16] we therefore developed a method and system for debugginggiven missing is-a structure of taxonomies. This study was the first of its kind. In [21]the methods were extended for networked taxonomies and in [15] we also dealt withwrong is-a relations. Finally, in [14] we presented a unified approach for dealing withmissing and wrong is-a relations in taxonomies, as well as missing and wrong mappingsin the alignments between the taxonomies. In Section 2 we describe the framework forthe unified approach. We note that this framework is not restricted to taxonomies. Abrief overview of our work on debugging taxonomies is given in Section 3. Recently,we have also started working on extending the approaches to ontologies representedin more expressive knowledge representation languages. A first result regarding ALC
acyclic terminologies was presented in [13] and is briefly described in Section 4.
2 Debugging workflow
Our debugging approach [14] is illustrated in Figure 2. The process consists of 6 phases,where the first two phases are for the detection and validation of possible defects, andthe last four are for the repairing. The input is a network of ontologies, i.e., ontologiesand alignments between the ontologies. The output is the set of repaired ontologies andalignments.
In our work we have focused on detecting wrong and missing is-a relations andmappings in the ontology network, based on knowledge that is inherent in the network.Therefore, given an ontology network, we use the domain knowledge represented by theontology network to detect the deduced is-a relations in the network. For each ontologyin the network, the set of candidate missing is-a relations derivable from the ontologynetwork (CMIs) consists of is-a relations between two concepts of the ontology, whichcan be inferred using logical derivation from the network, but not from the ontologyalone. Similarly, for each pair of ontologies in the network, the set of candidate missingmappings derivable from the ontology network (CMMs) consists of mappings betweenconcepts in the two ontologies, which can be inferred using logical derivation fromthe network, but not from the two ontologies and their alignment alone. Therefore, thedebugging process can be started by choosing an ontology in the network and detectCMIs or by choosing a pair of ontologies and their alignment and detect CMMs (Phase1).
111
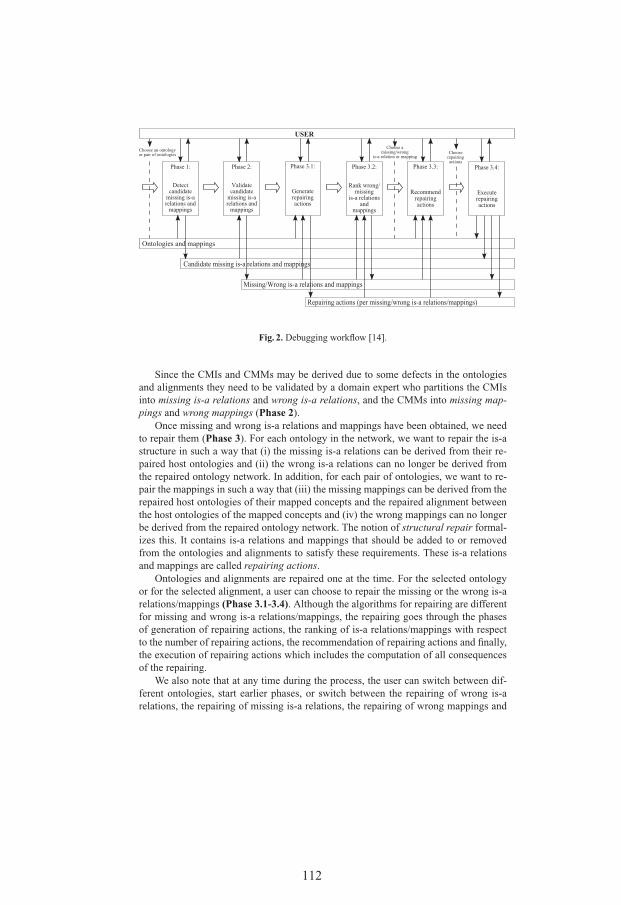
Fig. 2. Debugging workflow [14].
Since the CMIs and CMMs may be derived due to some defects in the ontologiesand alignments they need to be validated by a domain expert who partitions the CMIsinto missing is-a relations and wrong is-a relations, and the CMMs into missing map-pings and wrong mappings (Phase 2).
Once missing and wrong is-a relations and mappings have been obtained, we needto repair them (Phase 3). For each ontology in the network, we want to repair the is-astructure in such a way that (i) the missing is-a relations can be derived from their re-paired host ontologies and (ii) the wrong is-a relations can no longer be derived fromthe repaired ontology network. In addition, for each pair of ontologies, we want to re-pair the mappings in such a way that (iii) the missing mappings can be derived from therepaired host ontologies of their mapped concepts and the repaired alignment betweenthe host ontologies of the mapped concepts and (iv) the wrong mappings can no longerbe derived from the repaired ontology network. The notion of structural repair formal-izes this. It contains is-a relations and mappings that should be added to or removedfrom the ontologies and alignments to satisfy these requirements. These is-a relationsand mappings are called repairing actions.
Ontologies and alignments are repaired one at the time. For the selected ontologyor for the selected alignment, a user can choose to repair the missing or the wrong is-arelations/mappings (Phase 3.1-3.4). Although the algorithms for repairing are differentfor missing and wrong is-a relations/mappings, the repairing goes through the phasesof generation of repairing actions, the ranking of is-a relations/mappings with respectto the number of repairing actions, the recommendation of repairing actions and finally,the execution of repairing actions which includes the computation of all consequencesof the repairing.
We also note that at any time during the process, the user can switch between dif-ferent ontologies, start earlier phases, or switch between the repairing of wrong is-arelations, the repairing of missing is-a relations, the repairing of wrong mappings and
112

the repairing of missing mappings. The process ends when there are no more CMIs,CMMs, missing or wrong is-a relations and mappings to deal with.
3 Debugging taxonomies
Taxonomies are, from a knowledge representation point of view, simple ontologies.They contain named concepts and is-a relations. They do not contain instances and theonly kind of axioms are axioms stating the existence of is-a relations between namedconcepts. Many of the current ontologies are taxonomies. In this Section we give abrief overview on our work on debugging taxonomies. We show how the frameworkin Section 2 is instantiated, and describe our implemented system RepOSE. We giveexamples and intuitions, but for the algorithms and underlying theory we refer to [14].
3.1 Detecting and validating candidate missing is-a relations and mappings
The CMIs and CMMs could be found by checking for each pair of concepts in thenetwork whether it is a CMI or CMM. However, for large taxonomies or taxonomynetworks, this is infeasible. Therefore, our detection algorithm is only applied on pairsof mapped concepts, i.e., concepts appearing on mappings. We showed in [14] that fortaxonomies using the mapped concepts will eventually lead to the repairing of all CMIsand CMMs. The CMIs and CMMs should then be validated by a domain expert.
Figure 3 shows a screenshot of our system RepOSE. The domain expert has selecteda taxonomy in the network and asked the system to generate CMIs. The CMIs are dis-played in groups where for each member of the group at least one of the concepts sub-sumes or is subsumed by a concept of another member in the group. Initially, CMIs areshown using arrows labeled by ’?’ (e.g., (acetabulum, joint)) which the domain expertcan toggle to ’W’ for wrong relations and ’M’ for missing relations. A recommendationcan be asked and in the case the system finds evidence in external knowledge the ’?’ isreplaced by ’W?’ or ’M?’ (e.g., ’W?’ for (upper jaw, jaw)). As an aid, for each selectedCMI the jusification, i.e., an explanation of why the CMI was derived by the system, isshown (e.g., (palatine bone, bone)) in the justifications panel. When the domain expertdecides to finalize the validation of a group of CMIs, RepOSE checks for contradic-tions in the current validation as well as with previous decisions and if contradictionsare found, the current validation will not be allowed and a message window is shownto the user. The final validation is always the domain expert’s responsibility. CMMs aretreated in a similar way.
3.2 Repairing wrong is-a relations and mappings
Wrong is-a relations and mappings are repaired by removing is-relations and/or map-pings from the taxonomies and the alignments. As seen before, a justification for awrong is-a relation or mapping can be seen as an explanation for why this is-a rela-tion or mapping is derivable from the network. For instance, for the wrong is-a relation(brain grey matter, white matter) in AMA (Figure 4), there is one justification that in-cludes the mapping (brain grey matter, Brain White Matter), the is-a relation in NCI-A
113

Fig. 3. An example of generating and validating candidate missing is-a relations.
(Brain White Matter, White Matter), and the mapping (White Matter, white matter). Ingeneral, however, there may be several justifications for a wrong is-a relation or map-ping. The wrong is-a relation or mapping can then be repaired by removing at least oneelement in every justification.
In Figure 4 the domain expert has chosen to repair several wrong is-a relations atthe same time, i.e., (brain grey matter, white matter), (cerebellum white matter, braingrey matter) and (cerebral white matter, brain grey matter). In this example we canrepair these wrong is-a relations by removing the mappings between brain grey matterand Brain White Matter. We note that, when removing these mappings, all these wrongis-relations will be repaired at the same time. The ’Pn’ labels in Figure 4 reflect a rec-ommendation of the system as to which is-a relations and mappings to remove. Uponthe selection of a repairing action, the recommendations are recalculated and the la-bels are updated. As long as there are labels, more repairing actions need to be chosen.Wrong mappings are treated in a similar way.
3.3 Repairing missing is-a relations and mappings
Missing is-a relations and mappings are repaired by adding is-relations and/or map-pings from the taxonomies and the alignments. In the case where our set of missing is-a
114
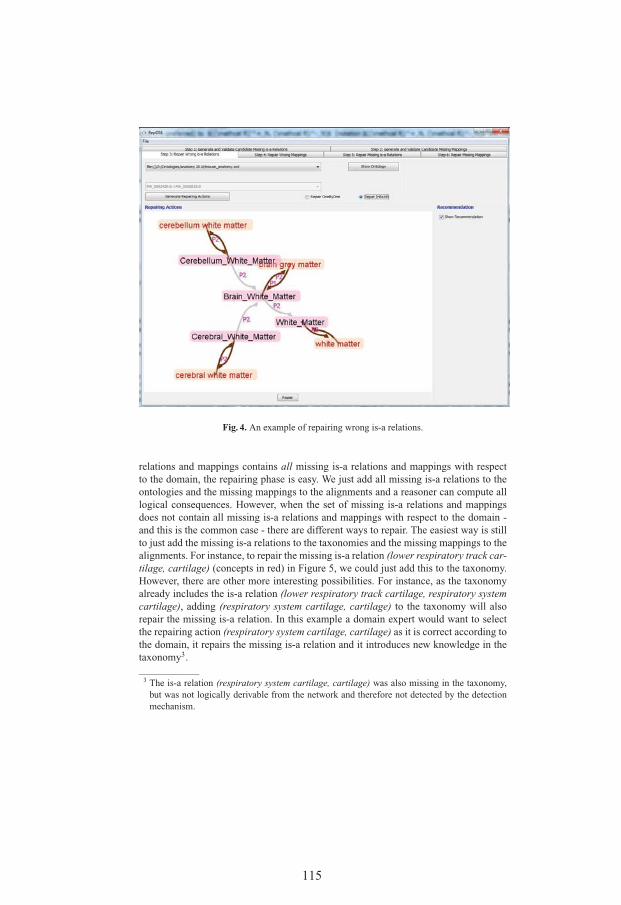
Fig. 4. An example of repairing wrong is-a relations.
relations and mappings contains all missing is-a relations and mappings with respectto the domain, the repairing phase is easy. We just add all missing is-a relations to theontologies and the missing mappings to the alignments and a reasoner can compute alllogical consequences. However, when the set of missing is-a relations and mappingsdoes not contain all missing is-a relations and mappings with respect to the domain -and this is the common case - there are different ways to repair. The easiest way is stillto just add the missing is-a relations to the taxonomies and the missing mappings to thealignments. For instance, to repair the missing is-a relation (lower respiratory track car-tilage, cartilage) (concepts in red) in Figure 5, we could just add this to the taxonomy.However, there are other more interesting possibilities. For instance, as the taxonomyalready includes the is-a relation (lower respiratory track cartilage, respiratory systemcartilage), adding (respiratory system cartilage, cartilage) to the taxonomy will alsorepair the missing is-a relation. In this example a domain expert would want to selectthe repairing action (respiratory system cartilage, cartilage) as it is correct according tothe domain, it repairs the missing is-a relation and it introduces new knowledge in thetaxonomy3.
3 The is-a relation (respiratory system cartilage, cartilage) was also missing in the taxonomy,but was not logically derivable from the network and therefore not detected by the detectionmechanism.
115
In RepOSE, for each missing is-a relation or mapping, a Source set and a Targetset are computed. It is guaranteed that when an is-a relation/mapping is added betweenany element in the Source set and any element in the Target set, the defect is repaired.Essentially, for a missing is-a relation the pairs in Source × Target are is-a relations,that when added to the taxonomy make the missing is-a relation logically derivable fromthe taxonomy. Similarly, for a missing mapping the pairs in Source × Target are is-arelations and/or mappings, that when added to the taxonomies and alignment make themissing mapping logically derivable from the taxonomies and alignment. The algorithmalso guarantees solutions adhering to a number of heuristics [16]. As is the case with allmodeling defects, the domain expert needs to validate the logical solutions. Therefore,in RepOSE the Source and Target sets are displayed in two panels (together with thejustification of the missing is-a relation or mapping) allowing the domain expert toconveniently repair defects by selecting elements in the panels (Figure 5). There isalso a recommendation algorithm that suggests repairing actions based on evidence inexternal knowledge.
As an example, for the missing is-a relation (lower respiratory track cartilage, car-tilage) in Figure 5 a Source set of 2 elements and a Target set of 21 elements are gen-erated and this results in 42 possible repairing actions. Each of the repairing actionswhen added to the taxonomy, would make the missing is-a relation derivable from thetaxonomy. As noted before, in this example a domain expert would select the repairingaction (respiratory system cartilage, cartilage).
3.4 Uses of RepOSE
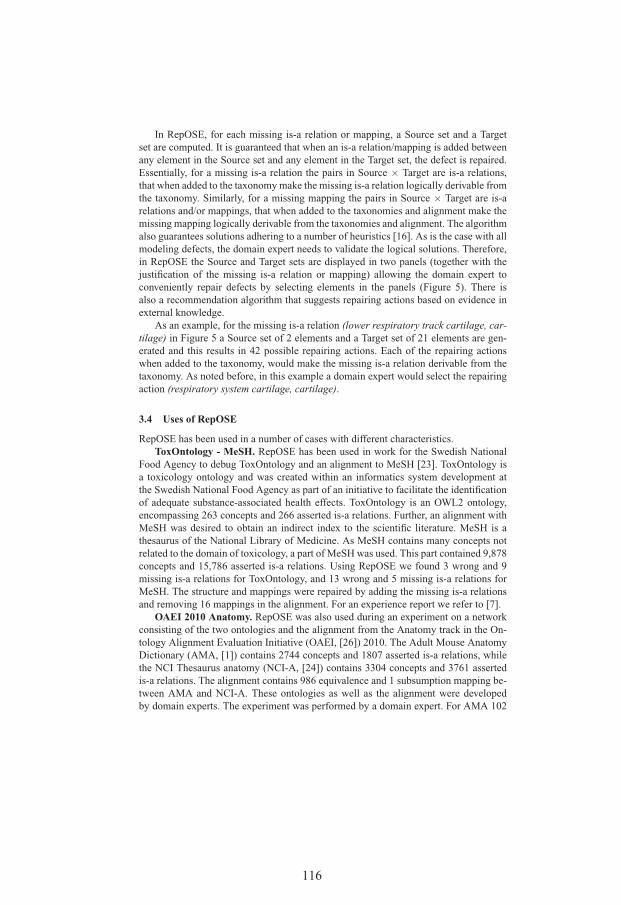
RepOSE has been used in a number of cases with different characteristics.ToxOntology - MeSH. RepOSE has been used in work for the Swedish National
Food Agency to debug ToxOntology and an alignment to MeSH [23]. ToxOntology isa toxicology ontology and was created within an informatics system development atthe Swedish National Food Agency as part of an initiative to facilitate the identificationof adequate substance-associated health effects. ToxOntology is an OWL2 ontology,encompassing 263 concepts and 266 asserted is-a relations. Further, an alignment withMeSH was desired to obtain an indirect index to the scientific literature. MeSH is athesaurus of the National Library of Medicine. As MeSH contains many concepts notrelated to the domain of toxicology, a part of MeSH was used. This part contained 9,878concepts and 15,786 asserted is-a relations. Using RepOSE we found 3 wrong and 9missing is-a relations for ToxOntology, and 13 wrong and 5 missing is-a relations forMeSH. The structure and mappings were repaired by adding the missing is-a relationsand removing 16 mappings in the alignment. For an experience report we refer to [7].
OAEI 2010 Anatomy. RepOSE was also used during an experiment on a networkconsisting of the two ontologies and the alignment from the Anatomy track in the On-tology Alignment Evaluation Initiative (OAEI, [26]) 2010. The Adult Mouse AnatomyDictionary (AMA, [1]) contains 2744 concepts and 1807 asserted is-a relations, whilethe NCI Thesaurus anatomy (NCI-A, [24]) contains 3304 concepts and 3761 assertedis-a relations. The alignment contains 986 equivalence and 1 subsumption mapping be-tween AMA and NCI-A. These ontologies as well as the alignment were developedby domain experts. The experiment was performed by a domain expert. For AMA 102
116
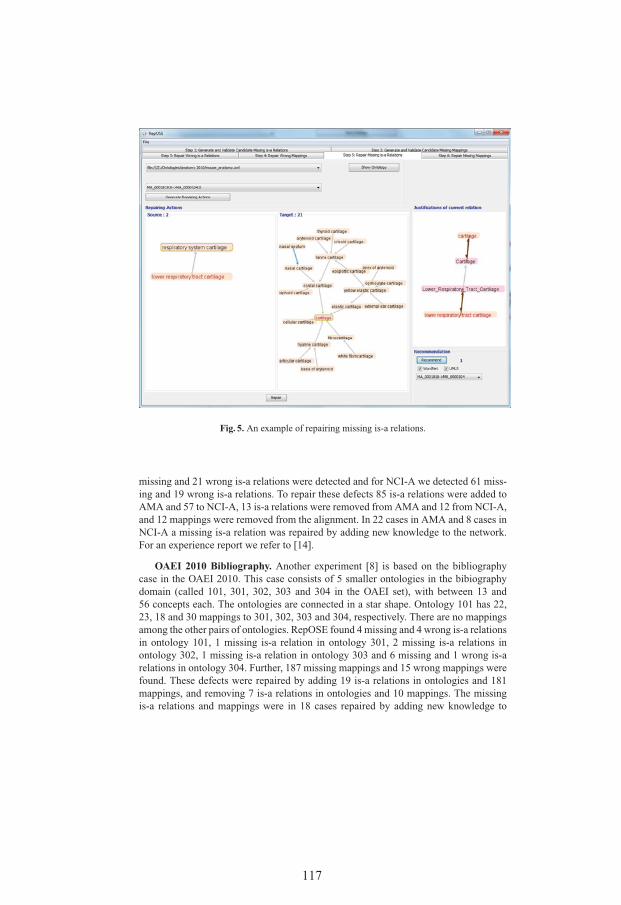
Fig. 5. An example of repairing missing is-a relations.
missing and 21 wrong is-a relations were detected and for NCI-A we detected 61 miss-ing and 19 wrong is-a relations. To repair these defects 85 is-a relations were added toAMA and 57 to NCI-A, 13 is-a relations were removed from AMA and 12 from NCI-A,and 12 mappings were removed from the alignment. In 22 cases in AMA and 8 cases inNCI-A a missing is-a relation was repaired by adding new knowledge to the network.For an experience report we refer to [14].
OAEI 2010 Bibliography. Another experiment [8] is based on the bibliographycase in the OAEI 2010. This case consists of 5 smaller ontologies in the bibiographydomain (called 101, 301, 302, 303 and 304 in the OAEI set), with between 13 and56 concepts each. The ontologies are connected in a star shape. Ontology 101 has 22,23, 18 and 30 mappings to 301, 302, 303 and 304, respectively. There are no mappingsamong the other pairs of ontologies. RepOSE found 4 missing and 4 wrong is-a relationsin ontology 101, 1 missing is-a relation in ontology 301, 2 missing is-a relations inontology 302, 1 missing is-a relation in ontology 303 and 6 missing and 1 wrong is-arelations in ontology 304. Further, 187 missing mappings and 15 wrong mappings werefound. These defects were repaired by adding 19 is-a relations in ontologies and 181mappings, and removing 7 is-a relations in ontologies and 10 mappings. The missingis-a relations and mappings were in 18 cases repaired by adding new knowledge to
117

the network. We note that using RepOSE alignments were generated for each pair ofontologies for which no alignment existed previously.
The characteristics of the networks in the three cases were quite different and alsothe repairing of is-a relations in the different cases happened to be quite different. Torepair wrong is-a relations, in the first case only mappings were removed. In the secondand third case, however, is-a relations and mappings were removed. To repair missingis-a relations, in the first case all missing is-a relations were repaired by adding themissing is-a relations themselves. In the second and third case, however, many missingis-a relations were repaired by adding new knowledge that was not derivable from theoriginal network. In the third experiment also missing and wrong mappings were gen-erated and repaired by adding and removing is-a relations and mappings. Further, in thethird experiment alignments were generated for each pair of ontologies for which noalignment existed previously.
Generally, detecting defects in ontologies without the support of a dedicated systemis cumbersome and unreliable. According to the domain experts [7, 14], in the casesmentioned in this chapter, RepOSE clearly provided a necessary support. Further, vi-sualization of the justifications of possible defects was very helpful to have at hand aswell as a graphical display of the possible defects within their contexts in the ontologies.Moreover, RepOSE stored information about all changes made and their consequencesas well as the remaining defects needing amendment. In general, RepOSE also facili-tates the computation and understanding of the consequences of repairing actions.
4 Debugging ALC acyclic terminologies
Recently, we have started work on debugging ontologies that use more expressiveknowledge representation languages. In our first work on this topic [13] we have fo-cused on the repairing of missing is-a relations in ALC acyclic terminologies. ALC is adescription logic (e.g., [2]). In the setting that we studied, concepts in the ontology canbe defined using constructors (concept conjunction, disjunction, negation, universal andexistential quantification) as well as concept and role (binary relation) names. Relationsare represented using roles. There are no instances. There is a finite set of axioms andall axioms are concept definitions (i.e., of the form C
.
= D where C is a concept name).There should be neither multiple definitions nor cyclic definitions.
In [13] we have shown that the problem of finding possible ways to repair the miss-ing is-a structure in an ontology in general can be formalized as a generalized versionof the TBox abduction problem as stated in [6].
Further, we proposed algorithms to generate different ways to repair the missing is-astructure in ALC acyclic terminologies. This case is more complex than the taxonomycase. In the basic algorithm for the ALC acyclic terminologies we generate repairingactions based on a tableau-based algorithm for satisfiability checking with unfolding ondemand (e.g., [2]). In an extended algorithm we integrated the Source and Target setsidea from the taxonomy case into the basic algorithm.
118

5 Conclusion
In this chapter we have introduced ontology debugging and described the contributionsof LiU/ADIT in this field. In future work we will further investigate the case of missingis-a relations for ontologies represented in more expressive kinds of knowledge repre-sentation languages. This will require a deeper study of the generalized TBox abductionproblem and other logic-based abduction problems for which currently no solutions ex-ist.
Another track that we will further investigate is the connection between ontologydebugging and ontology alignment. In this chapter we have already proposed a unifiedapproach for the debugging of is-a relations and mappings. In the future we will inte-grate RepOSE and our ontology alignment system SAMBO [18] into one system thatwill allow the debugging and aligning in an integrated way.
Acknowledgements
Most of the research was made possible by the financial support of the Swedish Re-search Council (Vetenskapsradet), the Swedish National Graduate School in ComputerScience (CUGS), and the Swedish e-Science Research Centre (SeRC).
We thank Qiang Liu, Jonas Laurila Bergman and Ulf Hammerling for previous co-operation on this subject.
References
1. AMA. Adult mouse anatomical dictionary. http://www.informatics.jax.org/searches/AMA form.shtml.
2. F Baader and U Sattler. An overview of tableau algorithms for description logics. StudiaLogica, 69:5–40, 2001.
3. M Bada and L Hunter. Identification of OBO nonalignments and its implication for OBOenrichment. Bioinformatics, 24(12):1448–1455, 2008.
4. C Conroy, R Brennan, D O’Sullivan, and D Lewis. User Evaluation Study of a TaggingApproach to Semantic Mapping. In 6th European Semantic Web Conference, LNCS 5554,pages 623–637, 2009.
5. O Corcho, C Roussey, L M Vilches, and I Perez. Pattern-based OWL ontology debuggingguidelines. In Workshop on Ontology Patterns, pages 68–82, 2009.
6. C Elsenbroich, O Kutz, and U Sattler. A case for abductive reasoning over ontologies. InOWL: Experiences and Directions, 2006.
7. V Ivanova, J Laurila Bergman, U Hammerling, and P Lambrix. Debugging taxonomiesand their alignments: the ToxOntology - MeSH use case. In 1st International Workshop onDebugging Ontologies and Ontology Mappings, 2012.
8. V Ivanova and P Lambrix. A system for debugging taxonomies and their alignments. InDemonstration at the 1st International Workshop on Debugging Ontologies and OntologyMappings, 2012.
9. Q Ji, P Haase, G Qi, P Hitzler, and S Stadtmuller. RaDON - repair and diagnosis in ontologynetworks. In 6th European Semantic Web Conference, LNCS 5554, pages 863–867, 2009.
119

10. E Jimenez-Ruiz, B Cuenca Grau, I Horrocks, and R Berlanga. Ontology integration usingmappings: Towards getting the right logical consequences. In 6th European Semantic WebConference, LNCS 5554, pages 173–187, 2009.
11. A Kalyanpur, B Parsia, E Sirin, and B Cuenca-Gray. Repairing Unsatisfiable Concepts inOWL Ontologies. In 3rd European Semantic Web Conference, LNCS 4011, pages 170–184,2006.
12. A Kalyanpur, B Parsia, E Sirin, and J Hendler. Debugging Unsatisfiable Classes in OWLOntologies. Journal of Web Semantics, 3(4):268–293, 2006.
13. P Lambrix, Z Dragisic, and V Ivanova. Get my pizza right: Repairing missing is-a relationsin ALC ontologies. In 2nd Joint International Semantic Technology Conference, 2012.
14. P Lambrix and V Ivanova. A unified approach for debugging is-a structure and mappings innetworked taxonomies. Research Report.
15. P Lambrix and Q Liu. Debugging is-a structure in networked taxonomies. In 4th Interna-tional Workshop on Semantic Web Applications and Tools for Life Sciences, pages 58–65,2011.
16. P Lambrix, Q Liu, and H Tan. Repairing the missing is-a structure of ontologies. In 4thAsian Semantic Web Conference, LNCS 5926, pages 76–90, 2009.
17. P Lambrix, G Qi, and M Horridge. Proceedings of the 1st International Workshop on De-bugging Ontologies and Ontology Mappings. Linkoping University Electronic Press, 2012.
18. P Lambrix and H Tan. SAMBO - a system for aligning and merging biomedical ontologies.Journal of Web Semantics, 4(3):196–206, 2006.
19. P Lambrix, H Tan, V Jakoniene, and L Stromback. Biological ontologies. In Baker andCheung, editors, Semantic Web: Revolutionizing Knowledge Discovery in the Life Sciences,pages 85–99. Springer, 2007.
20. P Lambrix, H Tan, and Q Liu. SAMBO and SAMBOdtf results for the Ontology AlignmentEvaluation Initiative 2008. In 3rd International Workshop on Ontology Matching, pages190–198, 2008.
21. Q Liu and P Lambrix. A system for debugging missing is-a structure in networked ontolo-gies. In 7th International Conference on Data Integration in the Life Sciences, LNBI 6254,pages 50–57, 2010.
22. C Meilicke, H Stuckenschmidt, and A Tamilin. Repairing Ontology Mappings. In 22thConference on Artificial Intelligence, pages 1408–1413, 2007.
23. MeSH. Medical subject headings. http://www.nlm.nih.gov/mesh/.24. NCI-A. National cancer institute - anatomy. http://www.cancer.gov/cancerinfo/terminology
resources/.25. R Neches, R Fikes, T Finin, T Gruber, and W Swartout. Enabling technology for knowledge
engineering. AI Magazine, 12(3):26–56, 1991.26. OAEI. Ontology alignment evaluation initiative. http://oaei.ontologymatching.org/.27. PubMed. http://www.ncbi.nlm.nih.gov/pubmed/.28. S Schlobach. Debugging and Semantic Clarification by Pinpointing. In 2nd European Se-
mantic Web Conference, LNCS 3532, pages 226–240, 2005.29. K Shchekotykhin, G Friedrich, Ph Fleiss, and P Rodler. Interactive ontology debugging:
Two query strategies for efficient fault localization. Journal of Web Semantics, 12-13:88–103, 2012.
30. R Stevens, C Goble, and S Bechhofer. Ontology-based knowledge representation for bioin-formatics. Briefings in Bioinformatics, 1(4):398–414, 2000.
31. P Wang and B Xu. Debugging ontology mappings: a static approach. Computing and Infor-matics, 27:21–36, 2008.
120

Contributions of LiU/ADIT to Chain Graphs
Jose M. Pena, Dag Sonntag
Department of Computer and Information Science
Linkoping University, 581 83 Linkoping, Sweden
Abstract. This chapter reviews chain graphs and their different interpretations.
It also reviews some of the LiU/ADIT contributions to the field. Specifically, it
reviews algorithms for learning chain graphs under the different interpretations.
1 Introduction
Assume that we have a system that consists of a finite number of components, each
of which can be in one of several states. Assume that we want to model the system
by modeling its components. A natural way to do this is to equate each component
with a random variable representing its state, and model the whole system as a prob-
ability distribution over those random variables. Such a model would allow modeling
the (in)dependencies between the states of the different components. Moreover, such
a model would allow reasoning about the state of some components after having ob-
served the state of some other components. Actually, the fact that the model models
independencies may be crucial to reason with the model efficiently.
A very popular way to represent the independencies in a probability distribution
are the so-called probabilistic graphical models. The basic idea is to interpret each edge
missing in a graph as an independence between the random variables represented by the
nodes of the graph. The fact that the independencies can be identified visually (i.e. with-
out numerical calculation) from the graph has two main advantages: It helps humans to
understand the system, and it helps humans to develop computer programs that exploit
the independencies to reason efficiently about the system. In this chapter, we will focus
on a class of probabilistic graphical models called chain graphs. We will review the dif-
ferent interpretations of chain graphs that are available in the literature. Finally, we will
review some of the contributions of LiU/ADIT to the field of chain graphs. Specifically,
we will review algorithms for learning chain graphs under the different interpretations.
The rest of the chapter is organized as follows. Section 2 reviews some concepts.
Section 3 reviews the different interpretations of chain graphs. Section 4 reviews the
LiU/ADIT contributions to the field. Finally, Section 5 closes with some discussion.
2 Preliminaries
In this section, we review some concepts from probabilistic graphical models that are
used later in this chapter. All the graphs and probability distributions in this paper are
defined over a finite set of random variables V .
121

If a graph G contains an edge between two nodes V1 and V2, we write that V1 → V2
is in G for a directed edge, V1 ←→ V2 is in G for a bidirected edge, and V1 − V2 is in Gfor an undirected edge. The parents of a node V2 of G is the set paG(X) = {V1|V1 →V2 is in G}. The children of V2 is the set chG(X) = {V1|V2 → V1 is in G}. The
neighbors of V2 is the set nbG(X) = {V1|V1 − V2 is in G}. The boundary of V2 is
the set bdG(V2) = paG(V2) ∪ nbG(V2). The adjacents of V2 is the set adG(V2) =paG(V2) ∪ nbG(V2) ∪ chG(V2).
A route from a node V1 to a node Vn in G is a sequence of (not necessarily distinct)
nodes V1, . . . , Vn such that Vi ∈ adG(Vi+1) for all 1 ≤ i < n. A path is a route where
the nodes are distinct. A route is called descending if Vi ∈ paG(Vi+1) ∪ spG(Vi+1) ∪nbG(Vi+1) for all 1 ≤ i < n. A route is called strictly descending if Vi ∈ paG(Vi+1) for
all 1 ≤ i < n. The strict ancestors of a node Vn of G is the set sanG(Vn) = {V1| there is
a strict descending route from V1 to Vn in G}. A cycle is called a semi-directed cycle if it
is descending and Vi → Vi+1 is in G for some 1 ≤ i < n. A Markov network is a graph
containing only undirected edges while a Bayesian network is a graph containing only
directed edges and no semi-directed cycles. A chain graph (CG) is a graph containing
(possibly) both directed and undirected edges, and no semi-directed cycle. Therefore,
CGs subsume Bayesian networks and Markov networks.
Let X , Y and Z denote three disjoint subsets V . We denote by X⊥pY |Z that Xis independent of Y given Z in a probability distribution p. We denote by X⊥GY |Zthat X is separated from Y given Z in a CG G. The concept of separation will be
defined latter on. We denote by X �⊥ pY |Z (respectively X �⊥GY |Z) that X⊥ pY |Z(respectively X⊥GY |Z) do not hold. The independence model induced by a probability
distribution p (respectively a CG G), denoted as I(p) (respectively I(G)), is the set of
statements X⊥ pY |Z (respectively X⊥GY |Z). We say that two CGs G and H are
Markov equivalent if I(G) = I(H). We say that a probability distribution p is faithful
to a CG G if I(G) = I(p).
3 Chain Graphs
In the literature, there are three main interpretations of CGs. That is, different re-
searchers assign different semantics to CGs. The first interpretation, denoted as LWF,
was introduced by Lauritzen and Wermuth (1989) and Frydenberg (1990) to combine
Bayesian networks and Markov networks. The second interpretation, denoted as AMP,
was introduced by Andersson et al. (2001) to overcome a deficiency of the LWF inter-
pretation: Some LWF CGs do not represent a direct mode of data generation. In other
words, they do not explain how the different components of the system ended in the
state they are in. A third interpretation, the multivariate regression (MVR) interpreta-
tion, was introduced by Cox and Wermuth (1996) to combine Bayesian networks and
covariance graphs, which are graphs containing only bidirected edges (e.g. V1 ←→ V2).
A fourth interpretation, although unexplored as of today, can be found in the work by
Drton (2009). In this chapter, we focus on the first three interpretations. It has been ar-
gued that some interpretation is better than some other. While this is true for some tasks,
it is not true when it comes to their ability to represent independencies, since no inter-
pretation subsumes another (Drton, 2009). It is also worth mentioning that the three of
122

A B
C D
E
F
A⊥GB|∅B�⊥GC|∅A�⊥GB|CA⊥GF |EB�⊥GE|D
A⊥GB|∅B⊥GC|∅A⊥GB|CA⊥GF |EB�⊥GE|D
Fig. 1. A CG G and some (non-)separations in it under the LWF interpretation (middle) and the
AMP interpretation (right).
them coincide if the CG at hand has only directed edges, i.e. it is a Bayesian network.
Bayesian networks are by large the most popular probabilistic graphical models. So,
one may wonder why we need to consider CGs at all. The answer is that using multiple
types of edges makes CGs more expressive than Bayesian networks. This allows CGs
to model probability distributions way more accurately than Bayesian networks (Pena,
2007). The larger the class of models under consideration the greater the probability of
finding an accurate model of the system. Using a poor model of the system may ob-
scure many independencies, which may result in inefficient reasoning. The downside of
using a large class of models is that it might be more difficult to find an accurate model.
Our worked has aimed at alleviating this problem by developing correct and efficient
learning algorithms.
3.1 LWF Interpretation
The LWF interpretation of CGs was introduced by Lauritzen and Wermuth (1989) and
Frydenberg (1990). A section of a route ρ in a LWF CG is a maximal subroute B1−. . .−Bn of ρ. Moreover, the section is called a collider section of ρ if A → B1− . . .−Bn ←C is a subroute of ρ. Given three disjoint subsets of nodes X , Y and Z of a LWF CG
G, X⊥GY |Z if there exists no route between a node in X and a node in Y such that
– no node in a non-collider section of the route is in Z, and– some node in every collider section of the route is in Z.
See Figure 1 for an example of an LWF CG and some of the (non-)separations in
it. It is worth mentioning that the independence models induced by LWF CGs are not
arbitrary because, for any LWF CG, there are probability distributions that are faithful
to it (Pena, 2009, 2011).
3.2 AMP Interpretation
The AMP interpretation of CGs was introduced by Andersson et al. (2001). A node B is
said to be a collider in a route in an AMP CG if the route has a subroute A → B ← C,
A → B − C or A − B ← C. Given three disjoint subsets of nodes X , Y and Z of an
AMP CG G, X⊥GY |Z if there exists no route between a node in X and a node in Ysuch that
123
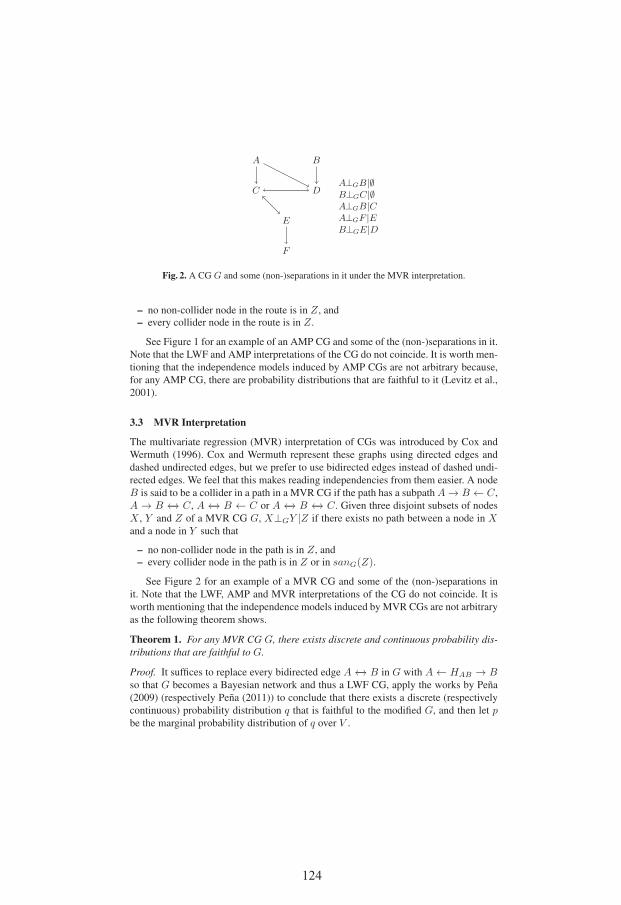
A B
C D
E
F
A⊥GB|∅B⊥GC|∅A⊥GB|CA⊥GF |EB⊥GE|D
Fig. 2. A CG G and some (non-)separations in it under the MVR interpretation.
– no non-collider node in the route is in Z, and– every collider node in the route is in Z.
See Figure 1 for an example of an AMP CG and some of the (non-)separations in it.
Note that the LWF and AMP interpretations of the CG do not coincide. It is worth men-
tioning that the independence models induced by AMP CGs are not arbitrary because,
for any AMP CG, there are probability distributions that are faithful to it (Levitz et al.,
2001).
3.3 MVR Interpretation
The multivariate regression (MVR) interpretation of CGs was introduced by Cox and
Wermuth (1996). Cox and Wermuth represent these graphs using directed edges and
dashed undirected edges, but we prefer to use bidirected edges instead of dashed undi-
rected edges. We feel that this makes reading independencies from them easier. A node
B is said to be a collider in a path in a MVR CG if the path has a subpath A → B ← C,
A → B ←→ C, A ←→ B ← C or A ←→ B ←→ C. Given three disjoint subsets of nodes
X , Y and Z of a MVR CG G, X⊥GY |Z if there exists no path between a node in Xand a node in Y such that
– no non-collider node in the path is in Z, and– every collider node in the path is in Z or in sanG(Z).
See Figure 2 for an example of a MVR CG and some of the (non-)separations in
it. Note that the LWF, AMP and MVR interpretations of the CG do not coincide. It is
worth mentioning that the independence models induced by MVR CGs are not arbitrary
as the following theorem shows.
Theorem 1. For any MVR CG G, there exists discrete and continuous probability dis-tributions that are faithful to G.
Proof. It suffices to replace every bidirected edge A ←→ B in G with A ← HAB → Bso that G becomes a Bayesian network and thus a LWF CG, apply the works by Pena
(2009) (respectively Pena (2011)) to conclude that there exists a discrete (respectively
continuous) probability distribution q that is faithful to the modified G, and then let pbe the marginal probability distribution of q over V .
124

Input: A probability distribution p that is faithful to an unknown AMP CG G.
Output: An AMP CG H that is Markov equivalent to G.
1 Let H denote the complete undirected graph
2 Set l = 03 Repeat while l ≤ |V | − 24 For each ordered pair of nodes A and B in H st A ∈ adH(B) and
|[adH(A) ∪ adH(adH(A))] \B| ≥ l5 If there is some S ⊆ [adH(A) ∪ adH(adH(A))] \B st |S| = l and A⊥pB|S then
6 Set SAB = SBA = S7 Remove the edge A−B from H8 Set l = l + 19 Apply the rules R1-R4 to H while possible
10 Replace every edge (�) in H with → (−)
Fig. 3. Algorithm for learning AMP CGs.
4 Learning Chain Graphs
In this section, we present algorithms for learning a CG from a probability distribution
under the different interpretations. A brute force approach would require to check for
every CG whether all its separations correspond to independencies in the probability
distribution. Since this is inefficient, the algorithms presented just check some strategic
125
separations for every CG. Note that, in practice, we do not have access to the probability
distribution but to a finite sample from it. Therefore, in practice, the only way to decide
whether an independency holds in the probability distribution is by studying the sample,
e.g. via a hypothesis test.
4.1 AMP Interpretation
We have recently presented an algorithm for learning AMP CGs under the faithfulness
assumption (Pena, 2012). To our knowledge, this is the first algorithm for learning AMP
CGs. Our algorithm can be seen in Figure 3. It consists of two phases: The first phase
(lines 1-8) aims at learning adjacencies, whereas the second phase (lines 9-10) aims
at directing some of the adjacencies learnt. Specifically, the first phase declares that
two nodes are adjacent if and only if they are not separated by any set of nodes. Note
that the algorithm does not test every possible separator (see line 5). Note also that the
separators tested are tested in increasing order of size (see lines 2, 5 and 8). The second
phase consists of two steps. In the first step, the ends of some of the edges learnt in
the first phase are blocked according to the rules R1-R4. A block is represented by a
perpendicular line, and it means that the edge cannot be directed in that direction. In the
second step, the edges with exactly one unblocked end get directed in the direction of
the unblocked end. The rules R1-R4 work as follows: If the conditions in the antecedent
of a rule are satisfied, then the modifications in the consequent of the rule are applied.
Note that the ends of some of the edges in the rules are labeled with a circle. The
circle represents an unspecified end, i.e. a block or nothing. The modifications in the
consequents of the rules consist in adding some blocks. Note that only the blocks that
appear in the consequents are added, i.e. the circled ends do not get modified. The
conditions in the antecedents of R1, R2 and R4 consist of an induced subgraph of Hand the fact that some of its nodes are or are not in some separators found in line 6. The
condition in the antecedent of R3 is slightly different as it only says that there is a cycle
in H whose edges have certain blocks, i.e. it says nothing about the subgraph induced
by the nodes in the cycle or whether these nodes belong to some separators or not. Note
that, when considering the application of R3, one does not need to consider intersecting
cycles, i.e. cycles containing repeated nodes other than the initial and final ones. Note
that the algorithm does not necessarily return G but a CG H that is Markov equivalent
to G.
4.2 MVR Interpretation
We have recently presented an algorithm for learning MVR CGs under the faithfulness
assumption (Sonntag and Pena, 2012). To our knowledge, this is the first algorithm
for learning MVR CGs. Our algorithm can be seen in Figure 4. It consists of three
separate phases. In phase one (lines 1-7) the adjacencies of the CG are recovered. In
the second phase (lines 8-9) some adjacencies are oriented according to the rules R0-
R3. In the third phase (lines 10-12) the rest of the edges are oriented according to the
algorithm in Theorem 4.13 by Koller and Friedman (2009). The rules R0-R3 work as
follows: If the conditions in the antecedent of a rule are satisfied, then the modifications
in the consequent of the rule are applied. Note that the ends of some of the edges in the
126

Input: A probability distribution p that is faithful to an unknown MVR CG G.
Output: A MVR CG H that is Markov equivalent to G.
1 Let H denote the complete undirected graph
2 For l = 0 to l = |VH | − 23 Repeat while possible
4 Select any ordered pair of nodes A and B in H st A ∈ adH(B) and |adj(A) \B| ≥ l5 If there exists S ⊆ (adH(A) \B) st |S| = l and A⊥pB|S then
6 Set SAB = SBA = S7 Remove the edge A−B from H8 Apply rule 0 while possible
9 Apply rules 1-3 while possible
10 Let Hu be the subgraph of H containing only the nodes and the undirected edges in H11 Order the nodes in Hu according to the algorithm in Theorem 4.13 by Koller and Friedman (2009)
12 Orient the undirected edges in H according to the node ordering obtained in line 11
Fig. 4. Algorithm for learning MVR CGs.
127

Input: A probability distribution p that satisfies the composition property.
Output: An inclusion optimal LWF CG G for p.
1 G =Empty graph
2 Repeat until all the LWF CGs that are Markov equivalent to G have been considered:
3 For every ordered pair of nodes X and Y :
4 If X → Y is in G but X⊥pY |bdG(Y ) \Xthen remove X → Y from G and go to line 2
5 If X − Y is in G but X⊥pY |bdG(Y ) \X and X⊥pY |bdG(X) \ Y then remove
X − Y from G and go to line 2
6 If X → Y is not in G but adding X → Y to G results in a CG and X �⊥pY |bdG(Y )then add X → Y to G and go to line 2
7 If X − Y is not in G but adding X − Y to G results in a CG and X �⊥pY |bdG(Y ) or
X �⊥pY |bdG(X) then add X − Y to G and go to line 2
8 Replace G with another LWF CG that is Markov equivalent to it
Fig. 5. Algorithm for learning LWF CGs.
rules are labeled with a circle. The circle represents an unspecified end, i.e. an arrow
or nothing. The modifications in the consequents of the rules consist in adding some
arrows. Note that only the arrows that appear in the consequents are added, i.e. the
circled ends do not get modified. Note that the algorithm does not necessarily return Gbut a CG H that is Markov equivalent to G.
4.3 LWF Interpretation
We have recently presented an algorithm for learning LWF CGs under the composition
property assumption (Pena et al., 2012). In other words, instead of assuming as we
did before that the probability distribution p at hand is faithful to some unknown LWF
CG, we now only assume that p satisfies the composition property: X⊥pY |Z ∧ X⊥pW |Z ⇒ X⊥pY ∪ W |Z where X , Y , Z and W denote four disjoint subsets of V .
However, if we do not assume that p is faithful to a LWF CG, then we have to define
which LWF CG our algorithm aims at learning. Specifically, our algorithm aims at
learning a LWF CG G that is inclusion optimal with respect to p. Formally, we say that
G is inclusion optimal with respect to p if I(G) ⊆ I(p) and there is no other LWF CG
H such that I(G) ⊂ I(H) ⊆ I(p). This aim is motivated by the fact that we do not
want G to represent separations that do not correspond to independencies in p, because
this might lead us to wrong conclusions when reasoning with G. Then, we want G to
represent only separations that correspond to independencies in p and as many of them
as possible.
As mentioned, the composition property assumption is weaker than the faithfulness
assumption. Algorithms for learning LWF CGs under the faithfulness assumption exist
(Ma et al., 2008; Studeny, 1997). To our knowledge, our algorithm is the first to relax
128

the faithfulness assumption. Our algorithm can be seen in Figure 5. The algorithm adds
and removes edges from G until some strategic separations in G correspond to indepen-
dencies in p. Note that the algorithm does not check whether every single separation in
G corresponds to an independence in p. Note also that the algorithm has to consider
every LWF CG that is Markov equivalent to G before halting.
5 Discussion
In this chapter, we have reviewed the three current interpretations of chain graphs, as
well as the learning algorithms we have developed for them. Our current work aims at
relaxing the faithfulness assumption for the AMP and MVR interpretations, as we did
with the LWF interpretation.
Acknowledgements
We thank Prof. Nahid Shahmehri for all the support she has given us to develop the
works described in this chapter. The works reported here are funded by the Center for
Industrial Information Technology (CENIIT) and a so-called career contract at Linkoping
University, and by the Swedish Research Council (ref. 2010-4808).
129

Bibliography
Andersson, S. A., Madigan, D. and Perlman, M. D. Alternative Markov Properties for
Chain Graphs. Scandinavian Journal of Statistics, 28:33-85, 2001.
Cox, D. R. and Wermuth, N. Multivariate Dependencies - Models, Analysis and Inter-pretation. Chapman & Hall, 1996.
Drton, M. Discrete Chain Graph Models. Bernoulli, 15:736-753, 2009.
Frydenberg, M. The Chain Graph Markov Property. Scandinavian Journal of Statistics,
17:333-353 1990.
Koller, D. and Friedman, N. Probabilistic Graphical Models. MIT Press, 2009.
Lauritzen, S. L. and Wermuth, N. Graphical Models for Association between Variables,
some of which are Qualitative and some Quantitative. Annual of Statistics, 17:31-57,
1989.
Levitz, M., Perlman M. D. and Madigan, D. Separation and Completeness Properties for
AMP Chain Graph Markov Models. The Annals of Statistics, 29:1751-1784, 2001.
Ma, Z., Xie, X. and Geng, Z. Structural Learning of Chain Graphs via Decomposition.
Journal of Machine Learning Research, 9:2847-2880, 2008.
Pena, J. M. Approximate Counting of Graphical Models Via MCMC. In Proceedings ofthe 11th International Conference on Artificial Intelligence and Statistics 352-359,
2007.
Pena, J. M. Faithfulness in Chain Graphs: The Discrete Case. International Journal ofApproximate Reasoning, 50:1306-1313, 2009.
Pena, J. M. Faithfulness in Chain Graphs: The Gaussian Case. In Proceedings ofthe 14th International Conference on Artificial Intelligence and Statistics, 588-599,
2011.
Pena, J. M. Learning AMP Chain Graphs under Faithfulness. In Proceedings of the 6thEuropean Workshop on Probabilistic Graphical Models, 251-258, 2012.
Pena, J. M., Sonntag, D. and Nielsen, J. D. An Inclusion Optimal Algorithm for Chain
Graph Structure Learning. Submitted, 2012. Draft available at arXiv:1109.5404v1
[stat.ML].
Sonntag, D. and Pena, J. M. Learning Multivariate Regression Chain Graphs under
Faithfulness. In Proceedings of the 6th European Workshop on Probabilistic Graph-ical Models, 299-306, 2012.
Studeny, M. A Recovery Algorithm for Chain Graphs. International Journal of Approx-imate Reasoning, 17:265-293, 1997.
130

Contributions of LiU/ADIT toSteiner Tree Computation over Large Graphs
Fang Wei-Kleiner
Department of Computer and Information Science
Linkoping University, 581 83 Linkoping, Sweden
Abstract. In this chapter, we present an exact algorithm for the Steiner tree prob-
lem. The algorithm is based on certain pre-computed index structures. The com-
plexity analysis shows that our algorithm offers a practical solution for the Steiner
tree problems on graphs of large size and bounded number of terminals.
1 Introduction
The Steiner tree problem is a fundamental and well-studied problem in network design.
In the Steiner tree problem we have an undirected graph G = (V,E) with costs on the
edges given and a set of terminals S ⊆ V . The goal is to find a minimum-cost tree
in G that connects/contains the terminals. The Steiner tree problem is a well-known
NP-Hard problem which is among Karp’s original 21 NP-complete problems [5].
Recently, the Steiner tree problem has received considerable attention in the database
community, due to its application in the keyword search query processing over graph-
structured data. These problems can be naturally defined as a Steiner tree problem,
where the keywords are considered as the terminals in the graph. Although efforts have
been made to solve the problem, algorithms yielding exact results can only be applied
in graphs of small size [2]. As a consequence, much research work has been devoted to
approximation algorithms, such as BANKS [1, 4], BLINKS [3], and STAR [6].
In this chapter, we present an exact algorithm STEIN I for solving the Steiner tree
problem in two steps. In the first step, certain index structure is built based on the so-
called tree decomposition methodology. In the second step, Steiner tree query process-
ing is conducted over the graph together with the index structure. Through the complex-
ity analysis we show that our algorithm offers a practical solution for the Steiner tree
problems on graphs of large size and bounded number of terminals, which is a typical
setting in most of the keyword search scenarios.
2 Preliminaries
An undirected weighted graph is defined as G = (V,E) plus the weight function w,
where V is the vertex set and E ⊆ V × V is the edge set. w : E → Q+ is the weight
function. Let G = (V,E) be a graph. G1 = (V1, E1) and G2 = (V2, E2) be subgraphs
of G. The union of G1 and G2, denoted as G1 ∪G2, is the graph G′ = (V ′, E′) where
V ′ = V1 ∪ V2 and E′ = E1 ∪ E2.
131

Definition 1 (Steiner tree). Let G = (V,E) be an undirected graph with the weightfunction w. S ⊆ V is a set of terminals. The Steiner tree with respect to S, denoted asSTS , is a tree spanning the terminals, where w(STS) :=
∑e∈STS
w(e) is minimal.
The difference between the Steiner tree problem and the minimum spanning tree
problem is that in the Steiner tree problem extra intermediate vertices and edges may be
added to the graph in order to reduce the length of the spanning tree. These new vertices
introduced are called as Steiner vertices. If the context is clear, we will sometimes use
the statement ”STS has the value of” by meaning that ”the weight of STS has the value
of”.
As a running example, consider the graphs illustrated in Figure 1. Graph (a) distin-
guishes from Graph (b) on the weight of the edge (v5, v6). Assume S = {v1, v2, v3, v4}is the set of terminals. Steiner tree STS for Graph (a) consists of the edges (v1, v5),(v2, v5), (v5, v6), (v3, v6) and (v4, v6), with the weight of 5. On the other hand, the
Steiner tree in Graph (b) does not contain the edge (v5, v6). One possible Steiner tree is
the path (v2, v5, v1, v7, v8, v3, v6, v4) with w(STS) as 7.
(a) Graph (b) Graph
Fig. 1. Example graphs with S = {v1, v2, v3, v4} as terminals. (a) Graph distinguishes from (b)
Graph at the edge weight of (v5, v6).
2.1 Algorithm STVS
In this section, we introduce the first Steiner tree algorithm STVS.
Definition 2 (Vertex Separator). Let G = (V,E) be a graph, v0, v ∈ V . C ⊆ V is a(v0, v)-vertex separator, denoted as (v0, v)-VS, if for every path P from v to v0, thereexists a vertex u such that u ∈ P and u ∈ C.
Theorem 1. Let G = (V,E) be a graph, v, v0 ∈ V , S ⊆ V and S = {v1, . . . , vn}.C ⊆ V is a (v, v0)-VS. Then
STS∪v0∪v = min STS′∪w∪v ∪ STS′′∪w∪v0(1)
where minimum is taken over all w ∈ C and all bipartitions S = S′ ∪ S′′.
132

Fig. 2. Illustration of Theorem 3
Proof. Consider the Steiner tree STS∪v0∪v . There must exist a path P from v to v0.
Given the fact that C ⊆ V is a (v, v0)-VS, we know that there exists one vertex w ∈ C,
such that w ∈ P as shown in Figure 2. No matter where w is located, we can split
STS∪v0∪v into two subtrees. One is the subtree rooted at w, which contains v. The
other subtree contains the rest of the terminals in S, together with v0 and w. Each of
the subtree is a Steiner tree regarding the terminals. It is trivial to show the minimum of
both trees, due to the fact that the entire tree is a Steiner tree. �
Algorithm 1 STVS(v, v0, S, C)
Input: Graph G = (V,E), v, v0 ∈ V , S = {v1, . . . , vn}, C ⊆ V is a (v, v0)-VS.
Output: STS∪v0∪v
1: for all vertex w ∈ C do2: for all S′, S′′ where S = S′ ∪ S′′ do3: STS∪v0∪v = min STS′∪w∪v ∪ STS′′∪w∪v0
4: end for5: end for6: return STS∪v0∪v
Algorithm 1 shows the pseudo code for computing the Steiner tree according to
Theorem 3. The complexity of the algorithm is |C| · 2|S|. One important observation
about STVS is that the number of terminals of the sub-Steiner trees is not necessarily
less than that of the final Steiner tree STS∪v0∪v . For instance, take the case of S′ = Sand S′′ = ∅, the number of terminals of STS′∪w∪v is equal to STS∪v0∪v (both are
|S|+2). Therefore, the dynamic programming paradigm is not applicable in this regard.
In order to make the STVS algorithm useful, it has to be guarantee that all the sub-
Steiner trees be pre-computed. In the following section, we will explain in detail how
this condition is fulfilled with the tree decomposition techniques.
133

2.2 Tree Decomposition and Treewidth
Definition 3 (Tree Decomposition). A tree decomposition of a graph G = (V,E),denoted as TG, is a pair ({Xi|i ∈ I}, T ), where I is a finite set of integers with theform {0, 1, . . . , p} and {Xi|i ∈ I} is a collection of subsets of V and T = (I, F ) is atree such that:
1.⋃
i∈I Xi = V .2. for every (u, v) ∈ E, there is i ∈ I , s.t. u, v ∈ Xi.3. for every v ∈ V , the set {i| v ∈ Xi} forms a connected subtree of T .
A tree decomposition consists of a set of tree nodes, where each node contains a set
of vertices in V . We call the sets Xi bags. It is required that every vertex in V should
occur in at least one bag (condition 1), and for every edge in E, both vertices of the edge
should occur together in at least one bag (condition 2). The third condition is usually
referred to as the connectedness condition, which requires that given a vertex v in the
graph, all the bags which contain v should be connected.
Note that from now on, the node in the graph G is referred to as vertex, and the
node in the tree decomposition is referred to as tree node or simply node. For each tree
node i, there is a bag Xi consisting of vertices. To simplify the representation, we will
sometimes use the term node and its corresponding bag interchangeably.
Fig. 3. Example graph and tree decomposition
Figure 3 illustrates a tree decomposition of the graph from the running example.
Since the two graphs in Figure 1 distinguish from each other only on the weight of one
edge, they have the identical tree decomposition (the weight in the graph is irrelevant
to the tree decomposition).
In most of the tree decomposition related literature, the so-called nice tree decom-position [7] is used. In short, a nice tree decomposition is a tree decomposition, with
the following additional conditions: (1) Every internal node t ∈ T has either 1 or 2
child nodes. (2) If a node t has one child node t0, then the bag Xt is obtained from Xt0
either by removing one element or by introducing a new element. (3) If a node t has
two child nodes then these child nodes have identical bags as t. Given a tree decompo-
sition TG, the size of the nice tree decomposition of TG is linear to it. Moreover, the
transformation can be done in linear time w.r.t. the size of TG. Figure 4 shows the nice
tree decomposition of the running example graph.
134
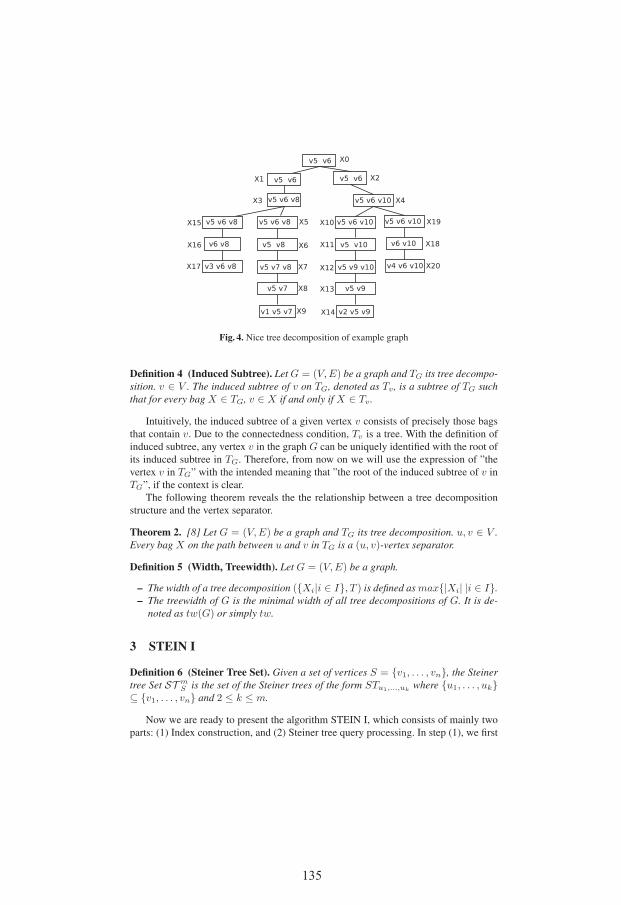
Fig. 4. Nice tree decomposition of example graph
Definition 4 (Induced Subtree). Let G = (V,E) be a graph and TG its tree decompo-sition. v ∈ V . The induced subtree of v on TG, denoted as Tv , is a subtree of TG suchthat for every bag X ∈ TG, v ∈ X if and only if X ∈ Tv .
Intuitively, the induced subtree of a given vertex v consists of precisely those bags
that contain v. Due to the connectedness condition, Tv is a tree. With the definition of
induced subtree, any vertex v in the graph G can be uniquely identified with the root of
its induced subtree in TG. Therefore, from now on we will use the expression of ”the
vertex v in TG” with the intended meaning that ”the root of the induced subtree of v in
TG”, if the context is clear.
The following theorem reveals the the relationship between a tree decomposition
structure and the vertex separator.
Theorem 2. [8] Let G = (V,E) be a graph and TG its tree decomposition. u, v ∈ V .Every bag X on the path between u and v in TG is a (u, v)-vertex separator.
Definition 5 (Width, Treewidth). Let G = (V,E) be a graph.
– The width of a tree decomposition ({Xi|i ∈ I}, T ) is defined as max{|Xi| |i ∈ I}.– The treewidth of G is the minimal width of all tree decompositions of G. It is de-
noted as tw(G) or simply tw.
3 STEIN I
Definition 6 (Steiner Tree Set). Given a set of vertices S = {v1, . . . , vn}, the Steinertree Set ST m
S is the set of the Steiner trees of the form STu1,...,ukwhere {u1, . . . , uk}
⊆ {v1, . . . , vn} and 2 ≤ k ≤ m.
Now we are ready to present the algorithm STEIN I, which consists of mainly two
parts: (1) Index construction, and (2) Steiner tree query processing. In step (1), we first
135

generate the tree decomposition TG for a given graph G. Then for each bag X on TG,
we compute ST lX , where l is the number of terminals of the Steiner tree computation.
In another word, for computing a Steiner tree with l terminals, we need to pre-compute
in each bag all the Steiner trees with 2, 3,.. . ., l terminals.
Theorem 3 (STEIN I). Let G = (V,E) and TG is the tree decomposition of G withtreewidth tw. S ⊆ V is the terminal set. For every bag X in TG, ST |S|
X is pre-computed.Then STS can be computed in time O(h · (2tw)|S|), where h is the height of TG.
Proof. Assume that TG is a nice tree decomposition. First, for each terminal vi we
identify the root of the induced subtree Xi in TG. Then we retrieve the lowest common
ancestor (LCA) of all Xi. We start from the Xis, conduct the bottom up traversal from
the children nodes to the parent node over TG, till LCA is reached.
Given a bag X in TG, we denote all the terminals located in the subtree rooted at Xas SX . In the following we prove the theorem by induction.
Claim: Given a bag X in TG, if for all its child bags Xi, ST |S|Xi∪SXi
are computed, then
ST |S|X∪SX
can be computed with the time O((2tw)|S|).Basis: Bag X is the root of the induced subtree of a terminal v, and there is no other
terminal below X . (That is, X is the one of the bags where we start with.) In this case,
X ∪SX = X and ST |S|X∪SX
= ST |S|X . This is exactly what was pre-computed in bag X .
Induction: In a nice tree decomposition, there are three traversal patterns from the child
nodes to the parent node:
– Vertex removal: parent node X has one child node Xc where Xc = X ∪ v.
– Vertex insertion: parent node X has one child node Xc where X = Xc ∪ v.
– Merge: parent node X has two child nodes Xc1 and Xc2 , where X= Xc1 = Xc2
Vertex removal. Assume the current parent bag X has the child bag Xc, such that
Xc = X ∪ v . We observe that SX = SXc. That is, the terminal set below X remains
the same as with Xc. This is because from Xc to X , no new vertex is introduced. There
are two cases:
– v is a terminal. Then we need to remember v in X . Therefore, we have ST |S|X∪SX
=
ST |S|Xc\v∪SX∪v = ST |S|
Xc∪SXc. That is, the Steiner tree set in X remains exactly the
same as Xc.
– v is not a terminal. In this case, we remove simply all the Steiner trees from
ST |S|Xc∪SXc
where v is occurred as a terminal. This operation costs constant time.
Vertex insertion. Assume the current parent bag X has the child bag Xc, such that
X = Xc ∪ v. First let us consider the inserted vertex v in X . Note that v does not occur
in Xc, so according to the connectedness condition, v does not occur in any bag below
Xc. Now consider any terminal vi below Xc. According to the definition, the root of
the induced subtree of vi is also below Xc. In the following we first prove that Xc is a
(v, vi)-vertex separator.
As stated above, v occurs in X and does not occur in Xc, so we can conclude that
the root of the induced subtree of v (rv) is an ancestor of X . Moreover, we know that
136
the root of the induced subtree of xi (rvi) is below Xc. As a result, Xc is in the path
between rv and rvi . Then according to Theorem 2, Xc is a (v, vi)-vertex separator.
Next we generate all the Steiner trees STY ∪v , where Y ⊆ Xc ∪ SXc. We execute
the generation of all the Steiner trees in an incremental manner, by inserting the vertices
in Xc ∪ SXc one by one to v, starting from the vertices in Xc, which is then followed
by SXc. We distinguish the following cases:
– Y ⊆ Xc. That is, all vertices in Y occurs in Xc. Obviously Y ⊆ X holds. Then the
Steiner tree STY ∪v is pre-computed for bag X and we can directly retrieve it.
– Y ∩ SXc�= ∅. According to the order of the Steiner trees generation above, we
assign the newly inserted terminal as vi. Let W = Y \ vi. It is known that ST |S|W∪v
is already generated. We call the function STVS as follows: STVS(vi, v,W,Xc).Since Xc is the (vi, v)-vertex separator as we shown above, the function will cor-
rectly compute the results, as long as all the sub-Steiner trees are available. Let
W = W ′ ∪ W ′′. The first sub-Steiner tree STW ′∪w∪vi(where w ∈ Xc) can be
retrieved from the Steiner tree set in Xc, because there is no v involved. The sec-
ond sub-Steiner tree has the form STW ′′∪w∪v (where w ∈ Xc). It can be retrieved
from ST |S|W∪v , because W ′′ ⊆ W and Xc ⊆ W . The later is true due to the fact
that the current step by inserting terminals, all the vertices in Xc have already been
inserted, according the order of Steiner tree generation we assign. This complete
the proof of the correctness.
As far as the complexity is concerned, at each step of vertex insertion, we need to
generate tw|S|−1 new Steiner trees. Each call of the function of STVS takes time
tw · 2|S| in worst case. Thus the total time cost is tw|S| · 2|S| = (2tw)|S|.
Merge: Merge operation occurs as bag X has two child nodes Xc1 and Xc2 , and both
children consist of the same set of vertices as X . Since each of the child nodes induces
a distinct subtree, the terminals below the child nodes are disjunctive.
Basically the step is to merge the Steiner tree sets of both children nodes. Assume
the Steiner tree set of both child nodes are ST |S|Xc1∪SXc1
and ST |S|Xc2∪SXc2
respectively,
we shall generate the Steiner tree set ST |S|X∪SXc1
∪SXc2
at the parent node.
The merge operation is analogously to the vertex insertion traversal we introduced
above. We start from one child node, say Xc1 . The task is to insert the terminals in SXc2
into ST |S|Xc1∪SXc1
one by one. The vertex separator between any terminal in SXc1and
SXc2is obviously the bag X . The time complexity for the traversal is (2tw)|S| as well.
To conclude, in the bottom up traversal, at each step the Steiner tree set can be
computed with the time complexity of (2tw)|S|. Since the number of steps is of O(h ·|S|), we have proven that the overall time complexity is O(h · (2tw)|S|). This complete
the proof. �
4 Conclusion
In this chapter we presented the algorithm STEIN I, solving the Steiner tree problem
over tree decomposed-based index structures. One requirement of our algorithm is that
137

the sub-Steiner trees in the bags have to be pre-computed. This is a time-consuming
task. However, the computation can be conducted offline.
The query time is exponential to the number of terminals. Thus the algorithm is
not suitable for problems with large terminal size. However, in the keyword search
applications, the number of keywords is normally small. If the number of terminals is
considered as a constant, the algorithm is polynomial to the treewidth of the graph G,
thus the algorithm can also be applied to the graphs whose treewidth is not bounded.
There is no obvious correlation between the time complexity and the graph size. In
theory, the height of the tree decomposition (h) is (log |V |) for balanced tree and (|V |)in worst case. However in practice this value is much smaller than the graph size.
References
1. Gaurav Bhalotia, Arvind Hulgeri, Charuta Nakhe, Soumen Chakrabarti, and S. Sudarshan.
Keyword searching and browsing in databases using BANKS. In ICDE, 2002.
2. Bolin Ding, Jeffrey Xu Yu, Shan Wang, Lu Qin, Xiao Zhang, and Xuemin Lin. Finding top-k
min-cost connected trees in databases. In ICDE, 2007.
3. Hao He, Haixun Wang, Jun Yang, and Philip S. Yu. Blinks: ranked keyword searches on
graphs. In SIGMOD. ACM, 2007.
4. Varun Kacholia, Shashank Pandit, Soumen Chakrabarti, S. Sudarshan, Rushi Desai, and
Hrishikesh Karambelkar. Bidirectional expansion for keyword search on graph databases.
In VLDB, 2005.
5. R. Karp. Reducibility among combinatorial problems. In R. Miller and J. Thatcher, editors,
Complexity of Computer Computations, pages 85–103. Plenum Press, 1972.
6. Gjergji Kasneci, Maya Ramanath, Mauro Sozio, Fabian M. Suchanek, and Gerhard Weikum.
STAR: Steiner-tree approximation in relationship graphs. In ICDE, 2009.
7. Ton Kloks. Treewidth, Computations and Approximations, volume 842 of Lecture Notes inComputer Science. Springer, 1994.
8. Fang Wei. TEDI: efficient shortest path query answering on graphs. In SIGMOD Conference.
ACM, 2010.
138

Broadening the Audience: Popularity Dynamics andScalable Content Delivery Techniques
Niklas Carlsson
Department of Computer and Information ScienceLinkoping University, 581 83 Linkoping, Sweden
Abstract. The Internet is playing an increasingly important role in today’s soci-ety and people are beginning to expect instantaneous access to information andcontent wherever they are. As content delivery is consuming a majority of theInternet bandwidth and its share of bandwidth is increasing by the hour, we needscalable and efficient techniques that can support these user demands and effi-ciently deliver the content to the users. When designing such techniques it is im-portant to note that not all content is the same or will reach the same popularity.Scalable techniques must handle an increasingly diverse catalogue of contents,both with regards to diversity of content (as service are becoming increasinglypersonalized, for example) and with regards to their individual popularity. Theimportance of understanding content popularity dynamics is further motivated bypopular contents widespread impact on opinions, thoughts, and cultures. This ar-ticle will briefly discuss some of our recent work on capturing content popularitydynamics and designing scalable content delivery techniques.
1 Introduction
When first asked to write an article for this book, I thought of potential articles that Iwould predict that I would like to read on my (future) 60th birthday and quickly realizedthat my choice likely would be different than what my dear colleague’s choice wouldbe. It is of course the same with content delivered over the Internet. Each user has theirindividual preferences, and as we are all unique, the range of videos that a set of usersselect to access will be highly diverse. However, interesting, some videos will emergefrom the masses as much more popular than other videos. In fact, it has been observedthat content popularity often follow a heavy-tailed distribution (e.g., [18, 24, 6, 23, 29,27]). With a heavy tailed distribution there will be some smaller number of contentsthat obtain most of the views, while the rest of the contents observe much fewer views.1
Now, before taking the journey through the content landscape and determine whatmakes some content more popular than others, we may also want to establish my own
1 The same holds true for many other things around us [16], including the number of citationsassociated with the articles that we publish. In the case of my former supervisor, the paperAdaptive load sharing in homogeneous distributed systems [21] has collected more citationsthan his other papers and will likely be the winner at his 60th birthday. For Professor Shah-mehri it looks to be a race down to the wire as she has three articles [15, 1, 3] within less than10 citations away from each other, according to Google scholar.
139

reading preferences and how it may differ from yours. As numerous top researchershave published their top-10 lists of influential articles they have found particularly in-sightful and recommend others to read (see for example a very nice series publishedin ACM Computer Communication Review a few years back), I instead briefly men-tion two inspiration sources that I can identify with (and which I would recommendsomebody that would celebrate their 60th birthday reading). First, on the list is PhDComics [14]. This book series (also delivered on the Internet) gives a unique and valu-able perspective into the life of graduate students. It is definitely a must read for anygraduate student, but I also think that it can work as a good tool for senior faculty toremember the perspective of the students. Second, as I always have enjoyed playing icehockey and am doing research within the area of performance analysis of networks anddistributed systems, I find the article The top ten similarities between playing hockeyand building a better Internet [2] both entertaining and insightful.
So, having established that our reading preferences/interests and movies choiceslikely are different(!), let us consider what makes one video more popular than anotherand how we best server a set of contents. For this purpose, we will first discuss someof our work on understanding content popularity dynamics (Section 2) and then discusssome of our works on scalable content delivery (Section 3).2
2 Popularity dynamics
Workload characterization and modeling are important tools when building an under-standing of system dynamics and identifying design improvements. In this work wehave measured, characterized, and modeled longitudinal workloads, including:
– Two simultaneously collected 36-week long traces of the weekly YouTube file pop-ularity of over one million videos [5].
– Two simultaneously collected 48-week long traces capturing the popularity dy-namics observed locally at a university campus and globally across seven hundredunique BitTorrent trackers and 11.2 million torrents (contents) [8].
Our prior work on file sharing popularity [29, 18] had shown that the file popularityacross shorter time intervals are more Zipf-like than file popularity distributions basedon longer time periods, including the life-time views displayed at various content shar-ing sites, such as YouTube. The above traces allow us to take a closer look at the popu-larity churn and how it evolves over time.
Using our longitudinal YouTube traces, we develop and evaluate a framework forstudying the popularity dynamics of user-generated videos [5]. We present a characteri-zation of the popularity dynamics, and propose a model that captures the key propertiesof these dynamics. While the relative popularities of the videos within our dataset arehighly non-stationary, we find that a simple model that maintains statistics about threesets of videos can be used to accurately capture the popularity dynamics of collectionsof recently-uploaded videos as they age, including key measures such as hot set churnstatistics, and the evolution of the viewing rate and total views distributions over time.
2 For an up-to-date list of publications on these (and other) topics, as well as links to our publicdataset, please see http://www.ida.liu.se/˜nikca/.
140
Using the BitTorrent traces, we compare the popularity dynamics as seen on a uni-versity campus compared to globally [8]. While the paper provides insights that mayimprove the efficiency of content sharing locally, and thus increase the scalability of theglobal systems, for the purpose of this article, one observation that may be particularlyinteresting is that we found that campus users are early adapters (in the sense that theytypically download files well before the time at which the global popularity of the filespeak) for all new content except for music files, for which the campus users are lateto download. As Professor Shahmehri has spent a considerable amount of time in theacademic environment, this may suggest that an up-to-date music collection may not bean appropriate birthday present? Determining if this is the case is left for future work!
Another noteworthy contribution towards better understanding video sharing pop-ularity involved the use of clones [4]. Well, not the controversial, genetically createdkind, but the kind that you may find on video sharing sites. This study set out to under-stand the content-agnostic factors that impact video popularity. While some popularitydifferences arise because of differences in video content, it is more difficult to accu-rately study content-agnostic factors. For example, videos uploaded by users with largesocial networks may tend to be more popular because they tend to have more interest-ing content, not because social network size has a substantial direct impact on popu-larity. Leveraging the use of video clones, we developed and applied a methodologythat allows us to accurately assess, both qualitatively and quantitatively, the impacts ofcontent-agnostic factors on video popularity. Interesting findings include the observa-tion that a strong linear rich-get-richer behavior is observed when controlling for videocontent. We also analyze a number of phenomena that may contribute to rich-get-richer,including the first-mover advantage and search bias towards popular videos.
3 Scalable content delivery
Today, content delivery applications consume a majority of the Internet bandwidth.With continued rapid growth in demand for such applications anticipated, the problemof cost-efficient and/or sustainable content delivery becomes increasingly important.For efficient delivery, protocols and architectures must scale well with the request loads(such that the marginal delivery costs reduce with increasing demands). Using scalabletechniques can allow a content distributor to handle higher demands more efficiently,and/or to offer its existing customers better service while reducing its resource require-ments and/or delivery costs.
A variety of techniques have been studied to improve the scalability and efficiencyof content delivery, including replication [20, 30], service aggregation [7, 25, 22, 13],and peer-to-peer [17] techniques. With replication, multiple servers (possibly geograph-ically distributed as in a CDN) share the load of processing client requests and may en-able delivery from a nearby server. With aggregation, multiple client requests are servedtogether in a manner that is more efficient than individual service. Finally, with peer-to-peer techniques, clients may contribute to the total service capacity of the system byproviding service to other clients.
While much work has considered various scalable solutions, there is a lack of litera-ture considering the problem of cost-efficient content delivery, in which the application
141

incurs both a network delivery cost (e.g., from cross ISP traffic or, more generally, op-eration/energy costs at Internet routers) and costs at the servers (e.g., due to cost ofownership, energy, or disk bandwidth). Using a batched service model for video-on-demand [11] and a digital fountain model [10] we determine optimal server selectionpolicies for such an architecture, and derive analytic expressions for their associateddelivery costs. Our framework also allows us to compare classes of server selectionpolicies and their optimal representatives. We conclude that server selection policiesusing dynamic system state information can potentially yield large improvements inperformance, while deferred rather than at-arrival server selection has the potential toyield further substantial performance improvements for some regions of the parameterspace [11]. We also argue that an architecture with distributed servers, each using dig-ital fountain delivery, may be an attractive candidate architecture when considering thetotal content delivery cost [10]. The importance of these contributions may be furtheraugmented by the potential of increasing energy costs and carbon taxes.
Another content delivery aspect that often is forgotten is how to best serve the entirecatalogue of contents available to a content provider. Often the focus is on how to bestserve the most popular contents. However, in practice there is a long tail of less popularcontents which have a high aggregate request rate (even though each content item onits own has a small request rate) [18, 29]. In recent works, we have presented solutionsthat address the complete catalogue of files.
Recently we presented and introduced the idea of torrent inflation (dynamic bundling)[12]. In contrast to static bundling (a pre-determined file collection grouped together bythe publisher) [28], with dynamic bundling, peers may be assigned complementary con-tent (files or parts of files) to download at the time they decide to download a particularfile. This additional flexibility allow dynamic bundling to adapt to current popularitiesand peers downloading the same popular file to help in the distribution of different lesspopular files. As we observed in Section 2, this is important as file popularities typi-cally are highly skewed and the download performance of small swarms is poor [19].In general, our dynamic bundling approach has been found to improve download timesand improve file availability for lukewarm (niche) contents. We have also presented aprototype implementation [31] and evaluated dynamic peer-based policies with the aidof stochastic games and a Markov Decision Process (MDP) [26].
Thus far, this section has discussed server-based and peer-assisted solutions to thescalability problem. However, recently cloud-based solutions have become a cost-effectivemeans of on-demand content delivery. To understand the tradeoffs between various sys-tem design choices, including server bandwidth, cloud and peer resources, we have an-alyzed a hybrid peer-assisted content delivery system that aims to provide guaranteedaverage download rate to its customers [9]. Our model and analysis provide valuableinsight to the most cost efficient way to deliver a catalogue of content with varying pop-ularity. Among other things, we show that bandwidth demand peaks for contents withmoderate popularity, and identify these contents as candidates for cloud-based service.Both bundling and peer-seeding can be used to reduce the need to push content to thecloud, with hybrid policies that combine bundling and peer seeding often reducing thedelivery costs by 20% relative to only using seeding.
142

4 Discussion and future directions
In this paper we have presented some of our recent works on characterizing and mod-eling the content popularity dynamics, as well as some of our work on scalable andefficient content delivery techniques. Ongoing efforts include the design and evaluationof hybrid solutions that take the environmental footprint into account.
In addition to the impact that popularity dynamics may have on system design, it isalso important to note that video dissemination through sites such as YouTube also havewidespread impacts on opinions, thoughts, and cultures. As not all videos will reach thesame popularity and have the same impact, there is therefore a widespread interest inwhat makes some videos go viral and reach millions of people while other seeminglysimilar videos only are viewed by few. While our clone paper gives some insights [4],understanding the relationships between other external and social factors, which impactthe video popularity, therefore present interesting future research avenues.
Acknowledgements
Most of this research discussed in this article was done in collaboration with colleagues,including (in alphabetic order): Sebastien Ardon, Martin Arlitt, Youmna Borghol, GyorgyDan, Derek Eager, Nissan Lev-tov, Zongpeng Li, Aniket Mahanti, Anirban Mahanti,Siddharth Mitra, Carey Williamson, and Song Zhang. This work was supported by theNatural Sciences and Engineering Research Council (NSERC) of Canada, and CENIITat Linkoping University.
References
1. J. Aberg and N. Shahmehri. The role of human Web assistants in e-commerce: An analysisand a usability study. Internet Research, 10(2):114–125, 2000.
2. M. Arlitt. The top ten similarities between playing hockey and building a better internet.ACM SIGCOMM Computer Communications Review, 42(2):99–102, Mar. 2012.
3. P. A. Bonatti, C. Duma, N. E. Fuchs, W. Nejdl, D. Olmedilla, J. Peer, and N. Shahmehri.Semantic web policies - a discussion of requirements and research issues. In Proc. ESWC,2006.
4. Y. Borghol, S. Ardon, N. Carlsson, D. Eager, and A. Mahanti. The untold story of the clones:Content-agnostic factors that impact youtube video popularity. In Proc. ACM SIGKDD,Beijing, China, Aug. 2012.
5. Y. Borghol, S. Mitra, S. Ardon, N. Carlsson, D. Eager, and A. Mahanti. Characterizing andmodeling popularity of user-generated videos. In Proc. IFIP PERFORMANCE, Amsterdam,Netherlands, Oct. 2011.
6. L. Breslau, P. Cao, L. Fan, G. Phillips, and S. Shenker. Web caching and Zipf-like distribu-tions: Evidence and implications. In Proc. IEEE INFOCOM, Mar 1999.
7. J. Byers, M. Luby, M. Mitzenmacher, and A. Rege. A digital fountain approach to reliabledistribution of bulk data. In Proc. ACM SIGCOMM, Vancouver, Canada, Sept. 1998.
8. N. Carlsson, G. Dan, M. Arlitt, and A. Mahanti. A longitudinal characterization of local andglobal bittorrent workload dynamics. In Proc. PAM, Vienna, Austria, Mar. 2012.
9. N. Carlsson, G. Dan, D. Eager, and A. Mahanti. Tradeoffs in cloud and peer-assisted contentdelivery systems. In Proc. IEEE P2P, Tarragona, Spain, Sept. 2012.
143

10. N. Carlsson and D. Eager. Content delivery using replicated digital fountains. In Proc.IEEE/ACM MASCOTS, Miami Beach, FL, Aug. 2010.
11. N. Carlsson and D. L. Eager. Server selection in large-scale video-on-demand systems. ACMTransactions on Multimedia Computing, Communications, and Applications (TOMCCAP),6(1):1:1–1:26, Feb. 2010.
12. N. Carlsson, D. L. Eager, and A. Mahanti. Using torrent inflation to efficiently serve thelong tail in peer-assisted content delivery systems. In Proc. IFIP/TC6 Networking, Chennai,India, May 2010.
13. N. Carlsson, D. L. Eager, and M. K. Vernon. Multicast protocols for scalable on-demanddownload. Performance Evaluation, 63(8/9), Oct. 2006.
14. J. Cham. Piled Higher and Deeper (books 1-4). Piled Higher and Deeper Pub, 2012.15. L. Chisalita and N. Shahmehri. A peer-to-peer approach to vehicular communication for the
support of traffic safety applications. In Proc. IEEE International Conference on IntelligentTransportation Systems, Sept. 2002.
16. A. Clauset, C. Shalizi, and M. Newman. Power-law distributions in empirical data. SIAMReview, 51(4):661–703, Nov. 2009.
17. B. Cohen. Incentives build robustness in bittorrent. In Proc. Workshop on Economics ofPeer-to-Peer Systems, Berkeley, CA, June 2003.
18. G. Dan and N. Carlsson. Power-law revisited: A large scale measurement study of p2pcontent popularity. In Proc. IPTPS, San Jose, CA, Apr. 2010.
19. G. Dan and N. Carlsson. Centralized and distributed protocols for tracker-based dynamicswarm management. IEEE/ACM Transactions on Networking (ToN), to appear.
20. J. Dilley, B. Maggs, J. Parikh, H. Prokop, R. Sitaraman, and B. Weihl. Globally distributedcontent delivery. IEEE Internet Computing, 6(5), Sept/Oct. 2002.
21. D. L. Eager, E. D. Lazowska, and J. Zahorjan. Adaptive load sharing in homogeneous dis-tributed systems. IEEE Transactions on Software Engineering, 12(5):662–675, 1986.
22. D. L. Eager, M. K. Vernon, and J. Zahorjan. Minimizing bandwidth requirements for on-demand data delivery. IEEE Transactions on Knowledge and Data Engineering, 13(5):742–757, Sept/Oct. 2001.
23. P. Gill, M. Arlitt, Z. Li, and A. Mahanti. Youtube traffic characterization: A view from theedge. In Proc. IMC, Oct. 2007.
24. K. Gummadi, R. Dunn, S. Saroiu, S. Gribble, H. Levy, and J. Zahorjan. Measurement,modeling and analysis of a peer-to-peer file-sharing workload. In Proc. ACM SOSP, Oct.2003.
25. A. Hu. Video-on-demand broadcasting protocols: A comprehensive study. In Proc. IEEEINFOCOM, Apr. 2001.
26. N. Lev-tov, N. Carlsson, Z. Li, C. Williamson, and S. Zhang. Dynamic file-selection policiesfor bundling in bittorrent-like systems. In Proc. IEEE IWQoS, June Beijing, China.
27. A. Mahanti, N. Carlsson, A. Mahanti, M. Arlitt, , and C. Williamson. A tale of the tails:Power-laws in internet measurements. IEEE Network, to appear.
28. D. Menasche, A. Rocha, B. Li, D. Towsley, and A. Venkataramani. Content availability andbundling in swarming systems. In Proc. ACM CoNEXT, Dec. 2009.
29. S. Mitra, M. Agrawal, A. Yadav, N. Carlsson, D. Eager, and A. Mahanti. Characterizingweb-based video sharing workloads. ACM Transactions on the Web (TWEB), 5(2):8:1–8:27,May 2011.
30. S. Triukose, Z. Wen, and M. Rabinovich. Measuring a commercial content delivery network.In Proc. WWW, Mar/Apr. 2011.
31. S. Zhang, N. Carlsson, D. Eager, Z. Li, and A. Mahanti. Dynamic file bundling for large-scale content distribution. In Proc. IEEE LCN, Clearwater, FL, Oct. 2012.
144

Contributions of LiU/ADIT to Informational Privacy
Leonardo A. Martucci
Department of Computer and Information Science
Linkoping University, 581 83 Linkoping, Sweden
Abstract. In this article we provide an overview of the contributions of LiU/ADIT
to the field of informational privacy. We refer to some recent publications of our
group in the area related to Cloud Computing and the Smart Grid. Furthermore,
we revisit our results in the field of privacy in participatory sensing, which is a
new paradigm that is grounded on the ubiquitous presence of sensors in personal
devices, such as smart phones.
1 Introduction
In this article we revisit a selection of recent contributions of LiU/ADIT to the field
of informational privacy. We cover our research in the fields of privacy in Cloud Com-
puting, Smart Grids and participatory sensing, which are three recent and important
application areas with a potential huge impact on privacy rights. Our contributions are
related to the evaluation of privacy requirements, in the case of Cloud Computing, and
new privacy-enhancing technologies (PETs) and their analysis, in the case of participa-
tory sensing and the Smart Grid.
This article is organized as follows: we first review the principle of privacy and in-
formational privacy in Section 2. Section 3 addresses our analysis of anonymous com-
munication networks and its performance evaluation in the Smart Grid [5]. The proposal
of a trust and privacy-enhancing mechanism for participatory sensing [7] is revisited in
Section 4. Section 5 lists the privacy requirements for Cloud Computing that we have
identified in [23]. Parts of this article have already appeared or been published in [4, 5,
7, 16–19, 21–23, 32].
2 Defining Privacy
The concept of privacy is not universal and easily defined, since its understanding is a
cultural construct, and, hence, subjective. In the end of the 19th century, two Ameri-
can lawyers defined privacy as the “right to be let alone” [31]. In 1967, Alan Westin,
from Columbia University, wrote the most accepted definition of privacy: “the claim
of individuals, groups and institutions to determine for themselves, when, how and to
what extent information about them is communicated to others” [33]. The Universal
Declaration of Human Rights states in its Article 12 that “no one shall be subjected to
arbitrary interference with his privacy” [30]. Nevertheless, the understanding of privacy
changes significantly between different societies [15]. Although it seems impossible to
provide a precise and universal understanding of privacy, it is feasible to identify the
145

three underlying aspects that construct the concept of privacy independently of the cul-
tural background. These aspects of privacy are [12]: informational privacy, territorial
(or spatial) privacy and privacy of the person.
Informational privacy is related to the person’s right to determine when, how and
to what extent information about him or her is communicated to others [33]. Territorial
privacy refers to the ability of controlling the information that enters and leaves the per-
sonal sphere, i.e., the close physical area surrounding an individual. Finally, privacy of
the person describes the people’s right to be protected against physical undue interfer-
ence [12]. In this article, we restrict the work to informational privacy aspects, and thus
whenever the term privacy is used, it actually means informational privacy.
The principle of necessity of data collection and processing, which is one of the
most essential privacy requirements, determines that the collection and processing of
personal data should only be allowed if it is necessary for the tasks falling within the
responsibility of the data processing agency. Hence, personal information should not
be collected or used for identification purposes when not absolutely necessary. The best
strategy to enforce such a requirement is the avoidance or minimization of personal data
[12, 16]. Therefore, privacy is best protected with anonymity.
Anonymity means that a subject is not identifiable within a set of subjects, i.e., the
anonymity set. The anonymity set include all subjects that can be connected to a given
action. Anonymity can also be defined in terms of unlinkability. Unlinkability means
that two or more items of interest, such as senders, recipients, and messages, cannot be
related from the perspective of an attacker. Hence, sender anonymity means that it is
not possible to associate a given message to a given sender. Recipient anonymity, on
the other hand, means that it is not possible to associate a given message to a given
recipient. Relationship anonymity means that sender and recipient are unlinkable [27].
3 Privacy in the Smart Grid
Smart Grids are the evolution of the existing power grids. Visible aspects of Smart
Grids are the electronic meters, called smart meters that monitor the users’ electricity
consumption and the harvested data to the electricity provider. Electricity providers are
empowered with a fine-granular control over their distribution network and, thus, can
better manage and balance the load in their networks. Real-time measurements of power
consumption also allow the introduction of flexible pricing policies, i.e., the kilowatt
hour retail price may fluctuate according to the demand, being more expensive during
peak hours. Two-way communication between smart meters and providers allows the
real-time retail price to be communicated to users, which can decide whether or not
to turn on power-demanding devices. Smart meters can be connected to the home area
network, in such a way that home appliances can be remote controlled. For example,
in case of brownouts, Smart Grids could assign priorities for appliances and shut non-
critical devices down [5].
Deploying Smart Grids incur many privacy-related challenges. Information col-
lected from smart meters can be used to profile customers by inferring their habits.
For instance, collected data can indicate when a customer is at home, when she eats
and if she has guests or not. User profiling can of course be performed by other means
146

IdC IdG SP & O
Begin session
Billing data
End session
Fig. 1. The sequence of messages exchanged by privacy-enhancing protocols based on network
anonymity. Control data is sent using the pseudonym IdG, which is associated to a group of
customers, and billing data with the customer’s real identity IdC [5]. SP & O refers to Service
Providers and Operations, which are the two domains from the NIST reference model [24] that
are relevant to our analysis.
(such as electronic cookies on the Internet), but Smart Grids have the potential to of-
fer a powerful new channel for collection of personal information that was previously
inaccessible [5].
We have analyzed and evaluated a general privacy-enhancing mechanism based on
an anonymous communication protocol for protecting users’ privacy in the Smart Grid.
The goal of these protocols is to dissociate item of interests, i.e., messages, from cus-
tomers. In our research, we first identified how can an anonymous communication pro-
tocol be used to protect users’ privacy in the Smart Grid. Naturally, accounting and
billing services in the Smart Grid require customers to be identifiable. However, there
is no such requirement for the real-time measurements. Hence, it is possible to discern
two different information flows with distinct characteristics: one for the real-time con-
trol data that is used to manage the power grid and another for billing and accounting
information, which has no real-time requirements. The former information flow is for-
warded by an anonymity network, which dissociate customers from consumption data.
The latter is sent directly from customers to providers (as bills are computed by the
smart meters).
Two distinct information flows are created using two unlikable identifiers: a cus-
tomer identity IdC, which is linked to a unique customer and it is used for billing, and
a pseudonym IdG, which is linked to group of customers. The real-time information
flow is associated only to the pseudonym, which is linked to a group of users. The pri-
vacy properties of protocols using anonymity networks were evaluated using analytic
methods. In [5], we showed that the two information flows are unlikable and evaluated
the security and efficiency of privacy-enhancing mechanisms based on an anonymity
network by comparing it with a mechanism based on a general case of homomorphic
encryption.
147

A B C D
Fig. 2. The relationship between the Customers’ set (A), the IdC set (B), the IdG set (C), and the
set of all secure sessions (D). There exists a bijective function between the sets A and B. There
exists a surjective function from set B to C, and another surjective function from set D to C.
Privacy-enhancing protocols based on anonymity networks can offer privacy to
customers and access to real-time control data to the service providers and operation
(SP & O) controllers, which can charge customers according to a given pricing scheme
policy. A customer’s privacy is protected because the control data information cannot
be linked back to her, i.e., no adversary can establish a relationship between the IdCand the IdG sets. Figure 2 illustrates the relationship between the sets of Customers
(A), IdC (B), IdG (C) and secure sessions (D).
To show that the SP & O cannot link a customer (element of set A) to a secure
session (element of set D), suppose by contradiction that there exists a function f from
set C to set D and two distinguish secure sessions di �= dj s.t. di, dj ∈ D are associated
to a same IdG. Choosing any element c ∈ C then f(c) = di and f(c) = dj , therefore
di = dj . The same rationale could be applied in the relationship from set C to B. Thus,
there exists no function between sets A and D.
Finally, to evaluate the computational performance of a general anonymous com-
munication mechanism against a generalized case of homomorphic encryption based
on the Discrete Logarithm Problem, we analyzed the number of operations needed for
each case, in terms of exponentiations and multiplications.
For the anonymous communication mechanism we considered the use of a Diffie-
Hellman (DH) key agreement [8]. A smart meter needs to perform one DH key agree-
ment in order to send ciphered messages with a secret key, and another DH key agree-
ment to receive ciphered messages with a different secret key. To improve security, the
keys need to be renewed from time to time. Anonymous authentication means that the
SP & O knows that the meter is valid, but cannot identify which meter it is. Any key
agreement algorithm that does not disclose the customer’s IdC can be used. Such a
key agreement requires 4 exponentiations for customers and 4 exponentiations for the
SP & O for establishing a secure session [5].
For the generalized case of homomorphic encryption, we used
Meter︷ ︸︸ ︷(gx1ur
1)
Meter︷ ︸︸ ︷(gx2ur
2) · · ·Meter︷ ︸︸ ︷(gxiur
i ) (1)
where x1, . . . , xi represent the measurements, and u1, . . . , ui, g and r are pseudo-
random values from Benaloh’s and Paillier’s methods [13, 25]. Equation (1) shows that
148
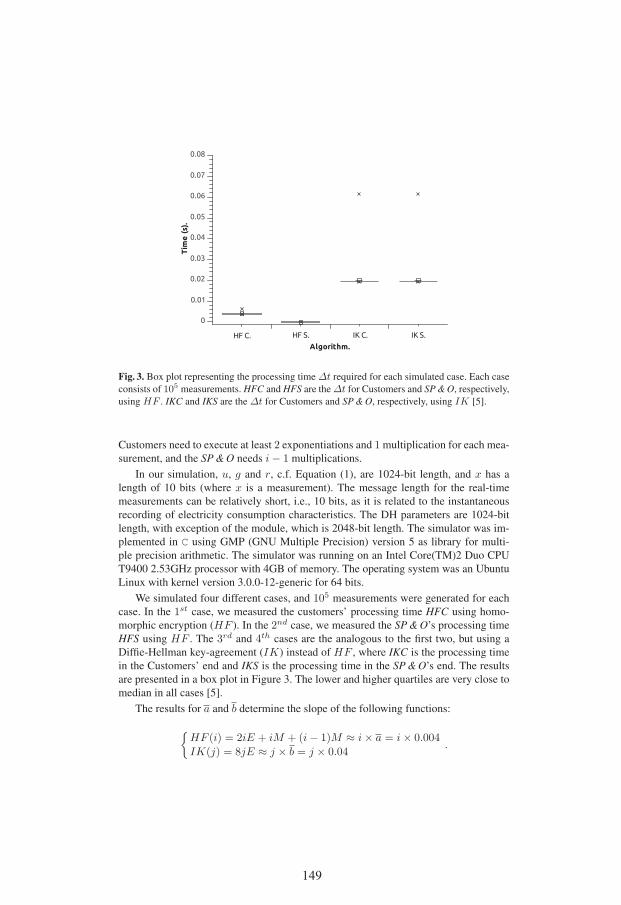
Fig. 3. Box plot representing the processing time Δt required for each simulated case. Each case
consists of 105 measurements. HFC and HFS are the Δt for Customers and SP & O, respectively,
using HF . IKC and IKS are the Δt for Customers and SP & O, respectively, using IK [5].
Customers need to execute at least 2 exponentiations and 1 multiplication for each mea-
surement, and the SP & O needs i− 1 multiplications.
In our simulation, u, g and r, c.f. Equation (1), are 1024-bit length, and x has a
length of 10 bits (where x is a measurement). The message length for the real-time
measurements can be relatively short, i.e., 10 bits, as it is related to the instantaneous
recording of electricity consumption characteristics. The DH parameters are 1024-bit
length, with exception of the module, which is 2048-bit length. The simulator was im-
plemented in C using GMP (GNU Multiple Precision) version 5 as library for multi-
ple precision arithmetic. The simulator was running on an Intel Core(TM)2 Duo CPU
T9400 2.53GHz processor with 4GB of memory. The operating system was an Ubuntu
Linux with kernel version 3.0.0-12-generic for 64 bits.
We simulated four different cases, and 105 measurements were generated for each
case. In the 1st case, we measured the customers’ processing time HFC using homo-
morphic encryption (HF ). In the 2nd case, we measured the SP & O’s processing time
HFS using HF . The 3rd and 4th cases are the analogous to the first two, but using a
Diffie-Hellman key-agreement (IK) instead of HF , where IKC is the processing time
in the Customers’ end and IKS is the processing time in the SP & O’s end. The results
are presented in a box plot in Figure 3. The lower and higher quartiles are very close to
median in all cases [5].
The results for a and b determine the slope of the following functions:
{HF (i) = 2iE + iM + (i− 1)M ≈ i× a = i× 0.004
IK(j) = 8jE ≈ j × b = j × 0.04.
149
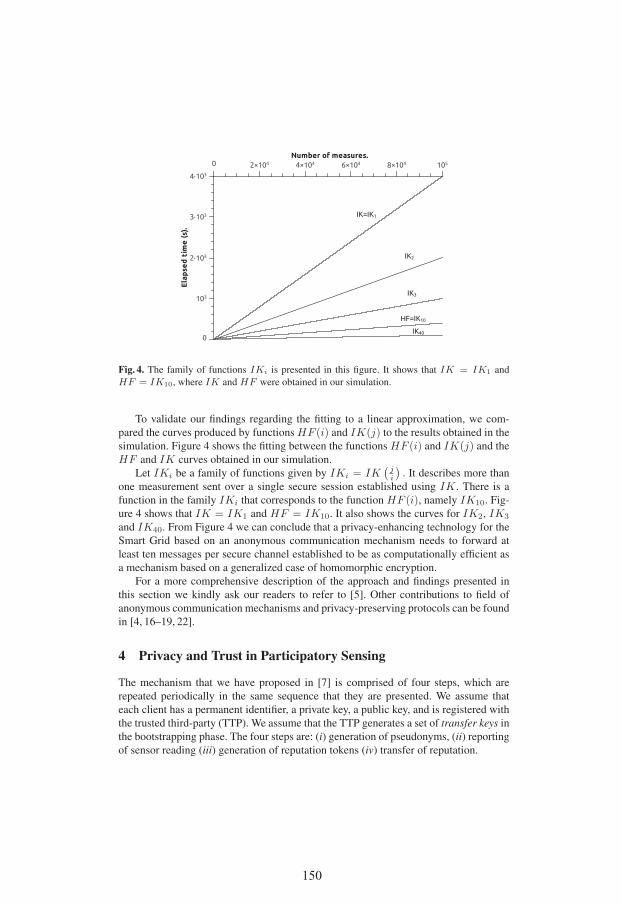
Fig. 4. The family of functions IKi is presented in this figure. It shows that IK = IK1 and
HF = IK10, where IK and HF were obtained in our simulation.
To validate our findings regarding the fitting to a linear approximation, we com-
pared the curves produced by functions HF (i) and IK(j) to the results obtained in the
simulation. Figure 4 shows the fitting between the functions HF (i) and IK(j) and the
HF and IK curves obtained in our simulation.
Let IKi be a family of functions given by IKi = IK(ji
). It describes more than
one measurement sent over a single secure session established using IK. There is a
function in the family IKi that corresponds to the function HF (i), namely IK10. Fig-
ure 4 shows that IK = IK1 and HF = IK10. It also shows the curves for IK2, IK3
and IK40. From Figure 4 we can conclude that a privacy-enhancing technology for the
Smart Grid based on an anonymous communication mechanism needs to forward at
least ten messages per secure channel established to be as computationally efficient as
a mechanism based on a generalized case of homomorphic encryption.
For a more comprehensive description of the approach and findings presented in
this section we kindly ask our readers to refer to [5]. Other contributions to field of
anonymous communication mechanisms and privacy-preserving protocols can be found
in [4, 16–19, 22].
4 Privacy and Trust in Participatory Sensing
The mechanism that we have proposed in [7] is comprised of four steps, which are
repeated periodically in the same sequence that they are presented. We assume that
each client has a permanent identifier, a private key, a public key, and is registered with
the trusted third-party (TTP). We assume that the TTP generates a set of transfer keys in
the bootstrapping phase. The four steps are: (i) generation of pseudonyms, (ii) reporting
of sensor reading (iii) generation of reputation tokens (iv) transfer of reputation.
150
4.1 A Trust and Privacy-Enhancing Mechanism for Participatory Sensing
In our proposal, clients repeatedly collect sensor readings and report them to an appli-
cation server using pseudonyms, which have a pre-determined validity period T . Each
client reports its sensor readings using its current pseudonym Pcurrent generated in
association with a trusted third-party (TTP) and based on blind RSA signatures (see
Section 4.2). Blind signatures ensure the authenticity of signed messages without re-
vealing their content to the signing entity and prevent the signing entity from linking
the message content with the identity of its creator [7].
By employing blind signatures, the TTP can guarantee that each client has a unique
pseudonym for each time period T . This not only prevents Sybil attacks [9] but also
makes it impossible to link the pseudonym to the real identity and thus protects the
anonymity of the client. The application server runs a reputation algorithm, which eval-
uates the sensor readings after each reporting and attributes a reputation score Rscore
to Pcurrent. The reputation score is then transferred by the application server to the
TTP, which maintains reputation accounts for each pseudonym. Before the end of T ,
the clients generate their next pseudonym Pnext and transfers Rscore from Pcurrent to
Pnext to conserve the acquired reputation score after the expiration of Pcurrent.
The reputation transfer is realized using a reputation token RT generated by the
clients in collaboration with the TTP to prevent reputation corruption. The transfer pro-
cess also makes use of blind signatures to prevent the TTP from linking Pcurrent to
Pnext. The application server eventually makes use of the reputation scores to identify
inaccurate contributions. Depending on the selected reputation model, the application
server can discard the contributions with low reputation scores or reduce the weighting
for such contributions in the computation of summaries [7].
For a more comprehensive description of the approach and findings presented in this
section we kindly ask our readers to refer to [7]. Other contributions to field of privacy
and trust can be found in [20, 21, 28, 32].
4.2 Blind Signatures and RSA Blind Signatures
In this section, we revisit blind signatures and RSA blind signatures, which are the
underlying cryptographic mechanisms used in our solution. A cryptographic system that
can be used to create blind signatures was first proposed by Chaum [6]. The underlying
idea is to use a public-key cryptographic system with signers and providers. It works as
follows. The signer has a secret signing function s′ and its public inverse s, such that
s(s′(m)) = m for a message m. The provider has two secret cryptographic functions cand c′, where c′ is the inverse of c. Hence, the provider can send a ciphertext c(m) to the
signer, which returns s′(c(m)) to the provider. The provider can then obtain the message
s′(m) signed by the supplier using the function c′, such that c′(s′(c(m))) = s′(m).Anyone can then verify the signature on message m by checking that s(s′(m)) = m.
Hence, the supplier signed the message m without knowing m, i.e., a blind signature.
The RSA [29] signature scheme can be used for implementing a blind signature
scheme [14]. We first briefly recall how the RSA signature scheme works. In RSA the
provider signs its own messages, i.e., the provider and the signer are the same entity. A
signature s of message m is s = me mod n, where (e, n) is the signature key, n = p · q
151

and p and q are two arbitrarily chosen large prime numbers. The parameter e, (e < n), is
a relative prime to the totient of n, φ(n) = (p− 1)(q− 1). For checking the correctness
of an RSA signature, the verifier needs a verification key (d, n), where d is the inverse
of emodφ(n), i.e., e·dmodφ(n) ≡ 1. The verification of signature is done by checking
if sd is equivalent to mmod n.
In a blind RSA signature scheme, the provider and the signer are different entities.
The signer is third party that doesn’t know the content of the message to be signed.
The blind RSA signature scheme incorporates a blinding factor r to the RSA signature
scheme and works as follows. The provider of the message m, which is to be blind
signed, selects a random blinding factor r mod n and generates a blinded message
m′ = m · re mod n. The blinding factor r is a secret only know to the provider and
(e, n) is publicly known. The blinded message m′ is sent to the signer, who returns the
signature s′ = (m′)dmodn to the provider. The signature s′ on message m′ is obtained
using the signature key (d, n), which is a secret only known to the signer. The provider
can then calculate the signature s = md mod n on message m as
s′ = (m′)d mod n = (m · re)d mod n = md · re·d mod n = md · r mod n.
The provider then divides s′ by r to obtain the signature s, i.e., s = s′/r. Anyone
can verify the signature s on message m by checking if se is equivalent to mmod n.
5 Privacy Requirements in Cloud Computing
The privacy requirements related to cloud computing are defined by the applicable leg-
islations and regulations. In Europe, they include a series of European Commission
directives [1–3]. Those directives regulate the processing of personal data, protection of
privacy and data retention in the EU. In addition, a comprehensive reform of the data
protection rules was recently proposed in [10, 11]. The reform includes a single set rules
on data protection to be enforced throughout the EU, including users’ right to access
their own data, to transfer personal data from one service to another and the “right to
be forgotten”. The new directive and regulation will result, if approved, in a new set of
privacy requirements that the cloud computing providers will need to comply with [23].
From Section 2, we recall that privacy is best protected if no personal information
is collected. This principle is valid for personal information that is stored, processed or
transferred to or from a cloud computing platform. Hence, we argue that the implemen-
tation of PETs for the anonymization or pseudonymization of data must be considered.
It is, nevertheless, expected that a significant share of data being transmitted, pro-
cessed or stored on the cloud computing platform will have personal information asso-
ciated to it. Therefore, other PETs, such as those based on obfuscation [26] or on the
concept of privacy by design [10, 34], in which privacy is integrated into all phases of
the design and implementation of the cloud computing platform, are required to embed
privacy protections into the system. The implementation of cloud marketplaces must
also take privacy aspects into consideration, as the EU legislation obliges the data con-
troller to have knowledge about which entity processes which personal information and
the purpose of such processing. Hence, a service provider that sells services based on
152

cloud computing platforms must necessarily have knowledge about all cloud computing
providers that process personal information of its customers.
For a more comprehensive description of the approach and findings presented in
this section we kindly ask our readers to refer to [23].
6 Summary
In this article we revisited the most recent contributions of of LiU/ADIT to the field of
informational privacy. We reviewed some recent publications of our group in the areas
related to the Smart Grid, Cloud Computing and participatory sensing.
Acknowledgements
Most of the research was made possible by the financial support of the Swedish National
Graduate School in Computer Science (CUGS). We thank our many colleagues and
co-authors for current and previous cooperation in this subject, in particular Delphine
Christin, Fabio Borges, Sheikh M. Habib, Albin Zuccato, Christian Roßkopf, Matthias
Hollick, Salil S. Kanhere, Thomas Johansson, Ben Smeets and Max Muhlhauser.
References
1. Directive 95/46/EC of the European Parliament and of the Council of 24 October 1995 on
the protection of individuals with regard to the processing of personal data and on the free
movement of such data. Official Journal L No.281, 23 Nov 1995. See http://www.cdt.org/privacy/eudirective/EU_Directive_.html.
2. Directive 2002/58/EC of the European Parliament and of the Council concerning
the processing of personal data and the protection of privacy in the electronic
communications sector, brussels. Official Journal L No.201, 31 Jul 2002. See
http://www.etsi.org/public-interest/Documents/Directives/Standardization/Data_Privacy_Directive.pdf.
3. Directive 2006/24/EC of the European Parliament and of the Council of 15 March 2006 on
the retention of data generated or processed in connection with the provision of publicly
available electronic communications services or of public communications networks and
amending directive 2002/58/EC. Official Journal L No.105, 13 Apr 2006.
4. Christer Andersson, Markulf Kohlweiss, Leonardo A. Martucci, and Andryi Panchenko. A
Self-Certified and Sybil-Free Framework for Secure Digital Identity Domain Buildup. In
Information Security Theory and Practices: Smart Devices, Convergence and Next Genera-tion Networks, Proceedings of the 2nd IFIP WG 11.2 International Workshop (WISTP 2008),Lecture Notes in Computer Science, LNCS 5019, pages 64–77. Springer, 13–16 May 2008.
5. Fabio Borges, Leonardo A. Martucci, and Max Muhlhauser. Analysis of privacy-enhancing
protocols based on anonymity networks. In Proceedings of the 3rd IEEE International Con-ference on Smart Grid Communications (SmartGridComm 2012). IEEE, 5–8 Nov 2012.
6. D. Chaum. Blind Signatures for Untraceable Payments. In Advances in Cryptology: Pro-ceedings of Crypto 82, pages 199–203, 1983.
153
7. Delphine Christin, Christian Rosskopf, Matthias Hollick, Leonardo A. Martucci, and Salil S.
Kanhere. Incognisense: An anonymity-preserving reputation framework for participatory
sensing applications. In Silvia Giordano, Marc Langheinrich, and Albrecht Schmidt, edi-
tors, Proceedings of the 2012 IEEE International Conference on Pervasive Computing andCommunications (Percom 2012), pages 135–143. IEEE, 19–23 Mar 2012.
8. Whitfield Diffie and Martin E. Hellman. New Directions in Cryptography. IEEE Transac-tions on Information Theory, IT–22(6):644–654, Nov 1976.
9. John R. Douceur. The Sybil Attack. In P. Druschel, F. Kaashoek, and A. Rowstron, editors,
Peer-to-Peer Systems: Proceedings of the 1st International Peer-to-Peer Systems Workshop(IPTPS), volume 2429, pages 251–260. Springer-Verlag, 7–8 Mar 2002.
10. Proposal for a directive of the European Parliament and of the Council on the protection of
individuals with regard to the processing of personal data. COD 2012/0010, 25 Jan 2012.11. Proposal for a regulation of the European Parliament and of the Council on the protection of
individuals with regard to the processing of personal data and on the free movement of such
data (general data protection regulation). COD 2012/0011, 25 Jan 2012.12. Simone Fischer-Hubner. IT-Security and Privacy – Design and Use of Privacy-Enhancing
Security Mechanisms, volume 1958 of Lecture Notes in Computer Science. Springer-Verlag
Berlin/Heidelberg, 2001.13. Laurent Fousse, Pascal Lafourcade, and Mohamed Alnuaimi. Benaloh’s dense probabilistic
encryption revisited. In Progress in Cryptology – AFRICACRYPT 2011, volume 6737 of
Lecture Notes in Computer Science, pages 348–362. Springer, 2011.14. Rosario Gennaro. Digital Cash. In Shafi Goldwasser and Mihir Bellare, editors, Lecture
Notes on Cryptography, chapter 12.5, pages 233–237. 2008.15. Rolf Lunheim and Guttorm Sindre. Privacy and Computing: a Cultural Perspective. In
Richard Sizer, Louise Yngstrom, Henrik Kaspersen, and Simone Fischer-Hubner, editors,
Proceedings of the IFIP TC9/WG9.6 Working Conference on Security and Control of Infor-mation Technology in Society, pages 25–40. North-Holland, 12–17 Aug 1993.
16. Leonardo A. Martucci. Identity and Anonymity in Ad Hoc Networks. PhD thesis, Karlstad
University, Jun 2009.17. Leonardo A. Martucci, Christer Andersson, and Simone Fischer-Hubner. Chameleon and
the Identity-Anonymity Paradox: Anonymity in Mobile Ad Hoc Networks. In Proceedingsof the 1st International Workshop on Security (IWSEC 2006), pages 123–134. Information
Processing Society of Japan (IPSJ), 23–24 Oct 2006.18. Leonardo A. Martucci, Tereza Cristina M. B. Carvalho, and Wilson V. Ruggiero. A
Lightweight Distributed Group Authentication Mechanism. In Steven M. Furnell and Paul S.
Downland, editors, Proceedings of the 4th International Network Conference (INC 2004),pages 393–400, Plymouth, Devon, UK, 6–9 Jul 2004.
19. Leonardo A. Martucci, Markulf Kohlweiss, Christer Andersson, and Andryi Panchenko.
Self-Certified Sybil-Free Pseudonyms. In Proceedings of the 1st ACM Conference on Wire-less Network Security (WiSec’08), pages 154–159. ACM Press, Mar 31 – Apr 2 2008.
20. Leonardo A. Martucci, Sebastian Ries, and Max Muhlhauser. Identifiers, Privacy and Trust in
the Internet of Services. In Short Paper Proceedings of the 4th IFIP WG 11.11 InternationalConference on Trust Management (IFIPTM 2010), 14–18 Jun 2010.
21. Leonardo A. Martucci, Sebastian Ries, and Max Muhlhauser. Sybil-Free Pseudonyms, Pri-
vacy and Trust: Identity Management in the Internet of Services. Journal of InformationProcessing, 19:317–331, 2011.
22. Leonardo A. Martucci, Christiane M. Schweitzer, Yeda R. Venturini, Tereza C. M. B. Car-
valho, and Wilson V. Ruggiero. A Trust-Based Security Architecture for Small and Medium-
Sized Mobile Ad Hoc Networks. In Ian F. Akyildiz, Erdal Cayirci, Eylem Ekici, and Gia-
como Morabito, editors, Proceedings of the 3rd Annual Mediterranean Ad Hoc NetworkingWorkshop (Med-Hoc-Net 2004), pages 278–290, 27–30 Jun 2004.
154
23. Leonardo A. Martucci, Albin Zuccato, Ben Smeets, Sheikh M. Habib, Thomas Johansson,
and Nahid Shahmehri. Privacy, security and trust in cloud computing: The perspective of
the telecommunication industry. In Proceedings of the 9th International Conference onUbiquitous Intelligence & Computing and the 9th International Conference on Autonomic& Trusted Computing (UIC/ATC 2012), pages 627–632. IEEE, 4–7 Sep 2012.
24. Office of the National Coordinator for Smart Grid Interoperability – National Institute of
Standards and Technology (NIST), Gaithersburg, MD, USA. NIST Framework and Roadmapfor Smart Grid Interoperability Standards. Release 1.0, Jan 2010.
25. Pascal Paillier. Public-key cryptosystems based on composite degree residuosity classes. In
Advances in Cryptology - EUROCRYPT 1999, volume 1592 of Lecture Notes in ComputerScience, pages 223–238. Springer, 1999.
26. Siani Pearson, Yun Shen, and Miranda Mowbray. A privacy manager for cloud computing.
In Proc. of the 1st Int. Conf. on Cloud Computing Technology and Science (CloudCom),pages 90–106. Springer-Verlag, 2009.
27. Andreas Pfitzmann and Marit Hansen. Anonymity, Unlinkability, Undetectability, Unobserv-
ability, Pseudonymity, and Identity Management – A Consolidated Proposal for Terminology
v0.31, 15 Feb 2008. See http://dud.inf.tu-dresden.de/literatur/.
28. Sebastian Ries, Marc Fischlin, Leonardo A. Martucci, and Max Muhlhauser. Learning whom
to trust in a privacy-friendly way. In Proceedings of the 10th International Conference onTrust, Security and Privacy in Computing and Communications (TrustCom 2011), pages
214–225. IEEE Computer Society, 16–18 Nov 2011.
29. R. L. Rivest, A. Shamir, and L. Adleman. A method for obtaining digital signatures and
public-key cryptosystems. Commun. ACM, 21(2):120–126, 1978.
30. United Nations. Universal Declaration of Human Rights, Resolution 217 A (III). United
States Government Print. Off., Washington, DC, USA, 1949.
31. Samuel Warren and Louis Brandeis. The Right to Privacy. Harvard Law Review, 4(5), 15
Dec 1890.
32. Stefan G. Weber, Leonardo A. Martucci, Sebastian Ries, and Max Muhlhauser. Towards
trustworthy identity and access management for the future internet. In Proceedings of the 4th
International Workshop on Trustworthy Internet of People, Things & Services (TrustworthyIoPTS 2010), Tokyo, Japan, 29 Nov – 1 Dec 2010.
33. Alan F. Westin. Privacy and Freedom. Atheneum, New York, NY, USA, 1967.
34. Ke Zeng and Ann Cavoukian. Modelling cloud computing architecture without compromis-
ing privacy: A privacy by design approach, May 2010.
155

156
From Databases and Web Information Systems toHydrology and Environmental Information Services
Lena Stromback
SMHI, Norroping, [email protected]
Abstract. This article gives a brief overview of the work in the hydrologicalgroup of SMHI. In particular the emphasis is on our work on large scale mod-elling of hydrological conditions and the data management involved in this prob-lem. Here we explain the steps in the process and give examples of involved datasources. In particular we discuss uncertainty of input data and how we try to un-derstand and minimize the impact of these in the model setup. We also give twoexamples of projects, where the aim was to present result from the models for de-cision makers. Finally we conclude the article by giving some pointers to relevanttopics for computer science research.
Keywords: Hydrology, HYPE, environmental modeling, climate services
1 Introduction
Hydrology is the study of the movement, distribution, and quality of water on, includingthe hydrologic cycle, water resources and environmental watershed sustainability. Themain task for the SMHI hydrology research group is to model the river runoff from rain-fall to the river outlet, i.e. the point where the water enters the seas. The aim of the workis to provide better forecasting and warning services for the power industry, improveddecision support for land management, environmental monitoring and action programsthat help improve water quality. Results will be used partly by SMHI and the produc-tion departments as well as directly by external users or in a purely scientific context.Several of the projects are carried out in co-operation with other research groups on anational as well as an international level.
The SMHI hydrological research group works to develop hydrological forecastingand scenario tools. Most of the work in the research team is related to our simulationmodel HYPE. This model can be set up for a local area, but in many cases we use it forlarge scale applications. We currently are using running models for Sweden (S-Hype,Arheimer et al. 2011) and Europe (E-Hype, Donnelly et al. 2011) and there is ongoingwork to set up models for the Arctic area, India and parts of Africa.
These models can be used for many different purposes. One aim is better hydrolog-ical forecasts and warnings. Here the model can make predictions for areas where wehave measured information about the rivers runoff, but it is also capable of predictionsof unmeasured regions through interpolations and similarity in landscape and land useconditions.
157
In this paper we will give an overview of the HYPE model from a data manage-ment perspective and explain why computer science becomes more and more importantin the process of creating and managing a large scale hydrological model. I will startwith giving a brief overview of the HYPE model and the process of creating a largescale model. We will then discuss issues of managing and ensure quality of the largeamounts of data used in the modeling process. After this I will give a short overviewof two projects I have worked with where web technology has been important for pre-senting the results. The paper will be ended by discussing some important issues wherecomputer related research questions would be of importance.
2 HYPE and data management for large scale models
As explained above, most of the work in the group uses the hydrological simulationmodel HYPE (Hydrological Predictions for the Environment) for modeling the hydro-logical processes in an area. The HYPE model simulates water flow and substances ontheir way from precipitation through soil, river and lakes to the river outlet (Arheimeret al., 2008; Lindstrm et al., 2010). The HYPE model is developed for being easy to setup for large scale applications and to make use of existing data about geography wheresuch are available. The process of setting up the model for a new geographic area istherefore highly dependent on using and adjusting external data sources. Based on thegeneral description of the geography and this data the model can then simulate riverrunoff and other variables important for hydrological applications.
The geographic area to be modeled consists of one or several catchment areaseach catchment is divided into subbasins which is the basic unit for describing thehydrological processes. These basins are then linked to describe how the water flowsin the area. The first task when setting up a HYPE model for a new area is to de-fine these catchment areas, i.e. define the geography of each area together with howthe water flows to and from this area to other surrounding areas. For Sweden, thisinformation is relatively easy to find, as the information is available in the SVAR(http://www.smhi.se/publikationer/svar-svenskt-vattenarkiv-1.17833) database. For otherparts of the world the information is usually not available in a consistent way over sev-eral countries for a continent which is necessary for applications where we model a largecontinent. For this purpose the group has developed its own tool WHIST (World Hydro-logical Information Setup Tool). This tool uses radar data on the topography availablein the HydroSHEDS (hydrosheds.cr.usgs.gov/) database as input. With this tool the hy-drologist can create the geographical setup for the model for any location in the world.The Swedish model (S-Hype) and the European model (E-Hype) currently consist ofaround 40000 subbasins each.
Once the general subbasin structure is setup for the area to be modeled propertiesof each of the subbasins must be described. This includes how the land is used i.ewhether it is covered by e.g. forest, lake, or open land. For agricultural land we describewhich crops are most common and how these are fertilized. Elevation is used to describetemperature variations within a subbasin to influence the snow conditions. To be ableto model water quality it is also important to describe emissions, from different sourcesand their content of phosphorus and nitrogen. To describe nutrient transformation the
158

soil is modeled as several layers different for each land use. As an example agriculturalland classes commonly use three soil layers.
It is a tedious work to find, evaluate and reformat all information needed to setupthe description of each subbasin. For the Swedish setup we can make benefit of havingconsistent descriptions for the country. Here we can, for instance, use soil descriptionfrom SGU (www.sgu.se) and land use data from the SMED (www.smed.se) consortium.For larger regions consisting of several countries it is often harder to find data that isconsistent over the whole region. In practice we often make use of European or globaldatabases.
The final step in setting up the model is to find forcing data for running the model.In most cases the data needed is information on precipitation and temperature. Also inthis case there is a need for consistent data for the modeled region. Typically we use thePTHBV (Johansson 2002) database for Sweden or ERA-INTERIM (Dee et al. 2011)for Europe.
The final model is evaluated against observations for a high number of gaugingstations. For fine tuning the model performance a number of parameters are available.The model parameters can be associated with land use (e.g. evapotranspiration) soiltype (e.g. water content in soil) or be common for a catchment. This way to couple theparameters to geographic information makes it easier to calibrate the model for largeregions because the model behaviored from areas where we have a lot of informationare transferred to other areas with similar geographic properties.
3 Quality and uncertainties in modeling
The quality of the final result from a hydrological simulation is dependent on all thesteps in the setup chain. As all these datasets represent observations or estimationsof real conditions, all steps in the process involves understanding and minimizing theeffects of these uncertainties. In particular, we have to consider the following:
– The datasets that are used for setting up the models involves a large amount ofuncertainty. Especially for large scale model setups over continents it is hard toget datasets that is consistent and correct for the whole continent. This is naturalsince the data involves observations and sometimes estimations for areas where noobserved data exists. To minimize the impact of these errors, we use established andwell-known sources for data where such exists. In addition, the process of settingup the model involves many steps of evaluating a dataset, such as comparing pan-European with local observations for an area.
– The model descriptions in the model consist of mathematical equations describingthe water flow and the different processes involved. These processes are, of course,an approximation of the reality and therefore involve uncertainty. There is a con-tinuous process of developing these processes, all the time improving and refiningthe quality of the simulations.
– Another important issue is programmatic computations and software quality. Thisinvolves verifying that the software makes correct computations, but also to evalu-ate the impact of computational differences such as precision in calculations.
159

– As explained above when running the model we use observations and prognosesof precipitation, temperature. Moreover observations of runoff are very importantfor evaluating the model. These data have the same data potential flaws as the inputdata used when setting up the model. Therefore, similar methods as above are usedfor quality ensuring also these types of data.
– The calibration steps aim at fine tuning the model the end of the setup. Duringthis step the model are evaluated against observations. Even though the final modelaims at representing an optimal model setup, it represents tradeoffs between geo-graphical areas and different properties of the model.
There are a number of methods used for quality ensuring the data. One importanttool is statistical methods, to try to understand properties of datasets and comparingthem to understand what is most reliable and how data can be adjusted to suit the needsof our model. Another very important tool is different kinds of graphs that can be in-spected by the modeling experts to understand the quality of the data. One example isplotting simulated and observed values of river runoff or plotting properties on a mapto inspect the geographic conditions. For the expert modeler inspecting these graphsgives important insights on data reliability and model quality as well as input to howthe model can be adjusted to improve the final quality of the simulation.
4 Making data available to decision makers
The resulting data from the hydrological simulations has a high complexity and exten-sion in time and space. An important problem is therefore how to make them availableto the general public. In this section I will briefly present two projects where the maingoal has been to present hydrological results for decision makers by web based tools.The SUDPLAN project is a European FP7 project, where the main focus has been onclimate change. The other project, PBD, focuses on environmental modeling and fo-cuses on decision support for the Swedish water authorities.
4.1 SUDPLAN
The SUDPLAN (Sustainable Urban Development Planner for Climate Change Adap-tation) project is a project within the EU FP7 framework. It addresses the impact ofclimate change on important infrastructure in the society. In this project the target isto provide support for providing a better decision support tool that makes it possiblefor decision makers responsible for large investments in infrastructure to take climatechange into account.
The project aims at developing a web-based planning, prediction and training tool.The services will allow the assessment of some of the most important environmentalfactors - storm water flooding, river flooding and air pollution. City planners can as-sess, for present as well as for different climate scenario conditions, the consequencesof possible future solutions for urbanization, infrastructure and transport systems. Thetool offer visualization of precipitation and temperature scenarios based on output fromRegional Climate Models, together with Pan-European model output of air quality and
160

Fig. 1. The SUDPLAN tool.
hydrological conditions. SUDPLAN uses the Pan-European scenarios as a basis for afurther downscaling to a particular city. The system is built on available standards andhas an open architecture, which means that new applications can be added in the future.
The main interface in the tool is the Scenario Management System. In this systemthe user can explore pre computed scenarios for climate change over Europe. For hy-drology we provide 30 year means of future change for a number of different variables,such as agricultural and hydrological drought, flooding and whether extreme events willoccur more or less often in the future. The system also provides the raw output from theclimate simulations with HYPE for further statistical processing.
Figure 1 shows the main pane of the SUDPLAN Scenario Management System,with a map giving an overview of future extreme flood events for Europe. (Blue meanshigher risk and red means lower risk). The right pane shows a list of maps where theuser can further explore details of the data and select other maps, while the left panegives opportunities for local downscaling of results.
For these computations we use the E-Hype model. This model is calibrated for agood performance in the larger river basins at the cost of performance on the localscale. In the tool the use can recalibrate the model for his local catchment and thenapply available climate scenarios for a more accurate description on the local scale.
4.2 Transparency in decision making (PBD)
The S-Hype model delivers data on water quality. This data is used for regularly reportson water quality status to the European Commission. In addition, the Swedish water
161

Fig. 2. The Vattenwebb web site.
authorities use the data to determine the origin of nitrogen and phosphorus in the seas,i.e. to track the sources for the emissions and based on this they can suggest regulationsfor improving the water quality. This information is used as basis for decisions on wastelevels from industries, treatment plants and sewage systems. For this aim SMHI makesdata available on our website (vattenwebb.smhi.se). This website gives high granularitydata on historical water flow and water quality on a historical basis for all the subbasinsin Sweden.
According to the above discussion, there is always an uncertainty associated withevery result delivered from S-Hype. The simulated result is highly dependent on theinput data and choices made in the simulation model. Therefore it is important that thedecision maker gets background fact about the source of information from the model.Within this project we have worked on making the input to the model available, i.e. totogether with the result also show the background information, i.e. land use, emissions,soil types and other information that is included in the setup of the model. Results fromthe project are available on the web site. A sample screen shot from the web pages isshown in Figure 2. This figure shows the map page, where input and modeled data forany singe subbasin in Sweden can be selected and downloaded.
The web site provides the input data from the model, presented as a collection for allvariables downloadable for each subbasin and, in addition, as data for the full countryfor each variable of interest. While publishing these data, the user had questions onhow these data were computed, i.e. where it originated from. Therefore we added thisinformation as web pages connected to the data, with links to the original sites for thedata. This project is an example on how additional information can give much bettertransparency in the decision making process.
162
5 Conclusion
This article has given a brief overview of the process of setting up a large scale hydro-logical simulation model, with a particular emphasis on the data management involvedin the process. We will conclude the article by pointing out where computer sciencein general and in particular recent research topics within computer science is valuablecould support the process. One obvious area is efficient data management, as the pro-cess involves large sets of data that need to be processed and compared. We need effi-cient ways of dealing with these datasets. In the initial model setup many of the stepsare today manual. This process could potentially be speed up by better descriptions andstandardizations of the involved data sources. Moreover, the process of creating a modelfrom research to operational model is today very quick. This puts high demands on thesoftware development process, as well as tools and software quality. Finally, a very im-portant question is how to present the final result for the end user where we could makeuse of different kinds of web tools and visualization techniques.
Acknowledgements
The work described in this paper has been performed by all members of the hydrologyresearch team at SMHI as well as our partners in the SUDPLAN project. In particularI would like to mention Berit Arheimer, Goran Lindstrom and Chantal Donnelly in theFoUh team. The work has been funded by many different projects from several fund-ing agencies including the Swedish Research Council (Vetenskapsradet), The SwedishEnvironmental Protection Agency, The Swedish Research Council Formas and the Eu-ropean Commission.
References
Arheimer, B., Dahne, J., Lindstrom, G. Marklund, L. and Stromqvist, J. 2011. Multi-variable evaluation of an integrated model system covering Sweden (S-HYPE). IAHSPubl. 345:145-150.
Arheimer, B., Lindstrom, G., Pers, C., Rosberg, J. and Stromqvist, J. 2008. Develop-ment and test of a new Swedish water quality model for small-scale and large-scaleapplications. XXV Nordic Hydrological Conference, Reykjavik, August 11-13, 2008.NHP Report No. 50, pp. 483-492.
Dee, D.P., Uppala, S.M., Simmons, A.J., Berrisford, P., Poli, P., et al. The ERA-Interimreanalysis: configuration and performance of the data assimilation system. QuarterlyJournal of the Royal Meteorological Society Volume 137, Issue 656, pages 553-597,April 2011 Part A.
Donnelly, C., Dahne., J., Rosberg, J., Stromqvist, J., Yang, W. and Arheimer, B. 2010.High-resolution, large-scale hydrological modelling tools for Europe. IAHS Publ. 340:553-561.
163

Johansson B. (2002) Estimation of areal precipitation for hydrological modelling inSweden. Earth Science Centre, Department of Physical Geography, Goteborg Univer-sity. Doctoral Thesis A76.
Lindstrom, G., Pers, C.P., Rosberg, R., Stromqvist, J., and Arheimer, B. 2010. Develop-ment and test of the HYPE (Hydrological Predictions for the Environment) model - Awater quality model for different spatial scales. Hydrology Research 41.3-4:295-319.
164
Semantic Role Labeling for Biological Event
He Tan
School of Engineering
Jonkoping University, 551 11 Jonkoping, Sweden
Abstract. In this chapter, we present that ontologies, as a formal representation
of domain knowledge, can instruct us and ease all the tasks in building domain
corpus annotated with semantic roles. We have built such a corpus for biological
transport events using Gene Ontology. Then we report on a word-chunking ap-
proach for identifying semantic roles of biomedical predicates describing trans-
port events. The results show that the system performance varies between dif-
ferent roles and the performance was not improved for all roles by introducing
domain specific features.
1 Introduction
Semantic Role Labeling (SRL) is a process that, for each predicate in a sentence, indi-
cates what semantic relations hold among the predicate and its associated sentence con-
stituents. The associated constituents in a clause are identified and their semantic role
labels are assigned, as in: [TransporterCBG] delivers [Entitycortisol] [Destinationto tar-
get cells]. SRL plays a key role in many text mining applications such as Information
Extraction, Question Answering and Document Summarization.
Recently, large corpora have been manually annotated with semantic roles in Frame-
Net [7] and PropBank [13]. PropBank annotates the semantic roles for all verbs in the
Wall Street Journal (WSJ) news corpus. The FrameNet project collects and analyzes the
attestations of target words (both verbs and nouns) from the British National Corpus.
With the advent of resources, SRL has become a well-defined task with a substantial
body of work and comparative evaluation. As with other technologies in natural lan-
guage processing (NLP), researchers have experienced the difficulties of adapting SRL
systems to a new domain, different than the domain used to develop and train the sys-
tem. In [22] authors demonstrated the necessity of using a biomedical proposition bank
for training SRL systems in the biomedical domain.
Biomedical text considerably differs from the PropBank and FrameNet data, both
in the style of the written text and the predicates involved. Predicates in the data are
typically verbs, biomedical text often prefers nominalizations, gerunds and relational
nouns [3, 9]. Predicates like endocytosis and translocate, though common in biomedi-
cal text, are absent from both the FrameNet and PropBank data [23, 2, 17]. Predicates
like block, generate and transform, have been used in biomedical documents with dif-
ferent semantic senses and require different number of semantic roles compared to
FrameNet [17] and PropBank data [23].
There have been a number of efforts to bring SRL to the biomedical domains. The
projects, PASBio [23], BioProp [22] and BioFrameNet [4], have made efforts on build-
ing both PropBank-like and FrameNet-like corpora for processing biomedical text. Up
165
until recently, these corpora are relatively small. At most 32 predicates are included.
More importantly, these methods have been rather informal. Corpus construction is
time-consuming and expensive. The PropBank project provides argument structures for
all the verbs in the Penn Treebank [10]. The FrameNet project collects and analyzes the
British National Corpus attestations of target words with semantic overlapping. These
methods are not applicable to the case of biomedicine domain, since no large corpus of
biomedical texts exists.
The difficulties of building such corpus include, how to discover and define se-
mantic frames together with associated semantic roles within the domain and their
interrelations, how to collect and group domain-specific predicates to each semantic
frame, and how to collect example sentences from publication databases, such as the
PubMed/MEDLINE database containing over 20 million articles? In this chapter, we
argue that ontologies, as a formal representation of domain knowledge, can instruct
us and ease all the tasks building corpus annotated with semantic roles. Furthermore,
ontological domain knowledge leads to well-defined semantics exposed on the corpus,
which will be valuable in text mining applications. We also demonstrate our corpus for
biological transport events built using Gene Ontology (GO). We collected 955 PubMed
abstract sentences, which cover 93 different predicates describing transport events. The
predicates are annotated for 10 semantic roles. Then we report on a word-chunking
approach for identifying semantic roles of biomedical predicates describing transport
events. We trained a first-order Conditional Random Field (CRF) for chunking appli-
cations with the traditional role labeling features and the traditional features together
with domain-specific noun phrases and their semantic categorization. The results show
that the system performance varies between different roles and the performance was not
improved for all roles by introducing domain specific features.
2 Methods
In this section we present our methods to building the corpus and the machine learning
model to automatic SRL.
2.1 Corpus Construction
Frames Semantics [6] begins with the assumption that in order to understand the mean-
ings of the words in a language, we must first have knowledge of the background and
motivation for their existence in the language and for their use in discourse. The knowl-
edge is provided by the conceptual structures, or semantic frames. In FrameNet, a se-
mantic frame describes an event, a situation or a object, together with the participants
(called frame elements (FE)) involved in it. The semantic type (ST) indicates the basic
typing of fillers of FE. A word (called lexical unit (LU)) evokes the frame, when its
sense is based on the frame.
Ontology is a formal representation of knowledge of a domain of interest. They
reflect the structure of the domain knowledge and constrain the potential interpretations
of terms. Ontological concepts, relations, rules and their associated textual definitions
can be used as the frame-semantic descriptions imposed on a corpus.
166

A large number of ontologies have been developed in the biomedical domain. Many
of them contain concepts that comprehensively describe a certain domain of interest.
For example, the biological process ontology of the GO [21] containing 20,368 con-
cepts, provides the knowledge of biological processes that are recognized series of
events or molecular functions.
Fig. 1. A concise view of 9 GO terms describing Protein Transport. We use the modified finite
state automaton (FSA) representation given in [12]. Any path that begins at a start state, repre-
sented by double solid borders, and ends in an end state, represented by a single solid border,
corresponds to a term. The nodes with a dashed border are neither start states nor end states.
In many cases ontological terms can be seen as phrases that exhibit underlying com-
positional structures [11, 12]. Fig. 1 presents the compositional structures of 9 direct
subclasses describing various types of protein transport. They indicate that translo-
cation, import, recycling, secretion and transport are the possible predi-
cates, evoking the protein transport event. The more complex expressions, e.g. translo-cation of peptides or proteins into other organism involved in symbiotic interaction (GO:0051808), express participants involved in the event, i.e. the entity (peptides or pro-
teins), destination (into other organism) and condition (involved in symbio-
tic interaction) of the event.
So far, using these classes and relations between them, we have partly defined the
semantic frame Protein Transport, decided the participants involved in the event, and
listed the domain-specific words evoking the frame. We also can identify the inheri-tance relation between this frame and another frame Transport which is defined based
on the superclass GO:0006810 transport. The complete frame description, including a
complete list of frame elements, evoking words, the basic typing of fillers of frame el-
ements, and relations to other frames in the corpus, can be given after studying all the
related classes and their relations. Lastly, collecting example sentences will be based
on knowledge based search engines for biomedical text, like GoPubMed [5]. As such,
domain knowledge provided by ontologies, such as GO biological process ontology and
molecular function ontology, and pathway ontologies, will instruct us in building large
frame corpora for the domain.
Here, we outline the aspects of ontology driven frame-semantic descriptions:
167
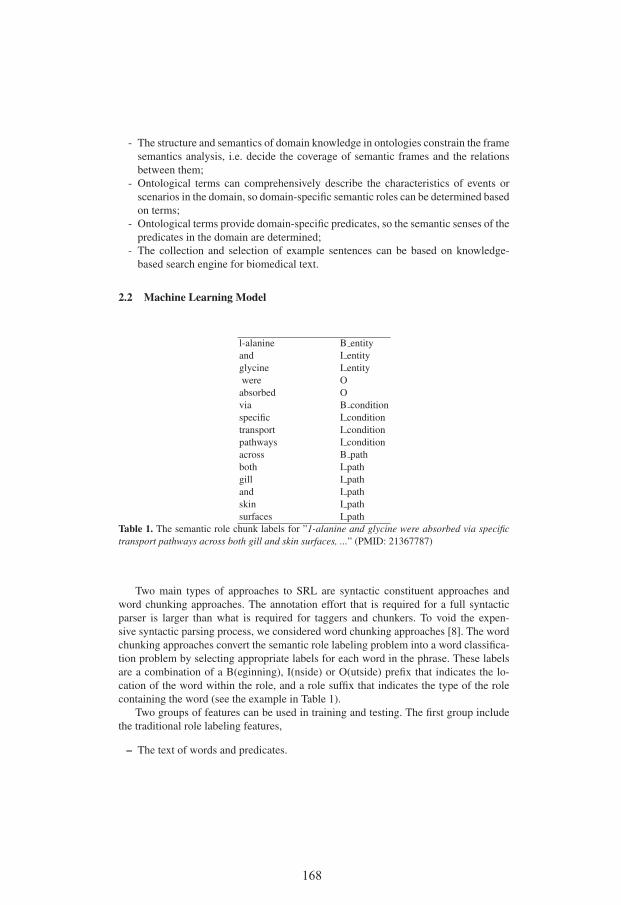
- The structure and semantics of domain knowledge in ontologies constrain the frame
semantics analysis, i.e. decide the coverage of semantic frames and the relations
between them;
- Ontological terms can comprehensively describe the characteristics of events or
scenarios in the domain, so domain-specific semantic roles can be determined based
on terms;
- Ontological terms provide domain-specific predicates, so the semantic senses of the
predicates in the domain are determined;
- The collection and selection of example sentences can be based on knowledge-
based search engine for biomedical text.
2.2 Machine Learning Model
l-alanine B entity
and I entity
glycine I entity
were O
absorbed O
via B condition
specific I condition
transport I condition
pathways I condition
across B path
both I path
gill I path
and I path
skin I path
surfaces I path
Table 1. The semantic role chunk labels for ”1-alanine and glycine were absorbed via specifictransport pathways across both gill and skin surfaces, ...” (PMID: 21367787)
Two main types of approaches to SRL are syntactic constituent approaches and
word chunking approaches. The annotation effort that is required for a full syntactic
parser is larger than what is required for taggers and chunkers. To void the expen-
sive syntactic parsing process, we considered word chunking approaches [8]. The word
chunking approaches convert the semantic role labeling problem into a word classifica-
tion problem by selecting appropriate labels for each word in the phrase. These labels
are a combination of a B(eginning), I(nside) or O(utside) prefix that indicates the lo-
cation of the word within the role, and a role suffix that indicates the type of the role
containing the word (see the example in Table 1).
Two groups of features can be used in training and testing. The first group include
the traditional role labeling features,
– The text of words and predicates.
168

– The stem of predicates.– The voice of predicates– The part-of-speech (POS) of words and predicates (manually identified based on
the output from the GENIA tagger).– The BIO tag for the phrases that includes the word (e.g. B-NP, I-NP, O etc.) (man-
ually identified based on the output from the GENIA tagger).– The location of words relative to the predicate. It has three values as ”before”,
”after” and ”-” for the predicate.
The output from the MetaMap tools (2011) [1] processing executed on corpus sen-
tences are extracted into another group of features (see the example in Table 2). The
features provided from the MetaMap output include the noun phrases identified in the
sentences, the head of the noun phrase, and the Unified Medical Language System
(UMLS) Semantic Types (STs) to the noun phrase.
3 The Corpus
We have built a corpus that currently covers transport events [20], using the ontology-
based method. The definition and description of the frames in the corpus strictly fol-
lows the domain knowledge provided by the piece of GO describing the events. The
core structure of the frame is the same as that of FrameNet. We follow the FrameNet’s
guidelines described in [14].
The Transport frame follows the definition of GO:0006810 transport. The frame has
a sub-frame Protein Transport, which characterizes transport events of proteins [19].
Its description follows the definition of GO:0015031 protein transport. The structural
dimension of the two sub-ontologies is given in Table 3. In addition to the GO terms,
synonyms are also gathered by querying the UMLS Metathesaurus [15]. A total of 2235
class names and synonyms are collected for the study. By studying all the names and
synonyms (we call them ”term” in the paper), we defined all possible FEs. Table 4 gives
the number of the GO terms that present the FEs.
Table 6 gives the head of the ontology terms (noun phrases). The head itself are
noun predicates. If the verb derived from a head, can be used to describe the event that
is expressed by the head, it is also included as a predicate. GO terms, such as relatedand broader synonyms, may not be considered for collecting predicates. For example,
fat body metabolism, a broad synonym of GO:0015032 storage protein import into fatbody, is not considered.
The example sentences are retrieved from the PubMed/MEDLINE database by us-
ing the GoPubMed [5], a knowledge-based search engine for biomedical text. The sen-
tences to be annotated, are always the most relevant and from the latest publications.
For LUs derived from one head, we acquired sentences by using the GO terms with
the head. The query starts from using the most general GO terms. In the case that the
number of query results is huge, more specific terms are used instead. Minimally, 10
sentences are gathered for each LU, if applicable. In cases when only specific GO terms
are available and the number of query results is too small, we generalize the query term.
Totally, we collected a set of 955 sentences from PubMed abstracts. Table 5 gives the
number of sentences containing the different FEs.
169

token phrase tag UMLS STs
l (* mod aapp,bacs
- * mod aapp,bacs
alanine * head aapp,bacs
and (* conj
glycine (* head aapp,bacs,phsu
were (* aux
absorbed (* verb
via (* prep
specific * mod qlco
transport * mod celf
pathways * head moft
across (* prep
both (* conj
gill (* head bpoc
and (* conj
skin (* head blor
surfaces * head blor
Table 2. Example features extracted from the MetaMap output.
#node avg. depth max. depth avg. breadth max. breadth #leaf
transport 1061 7.7 16 1.9 38 323
protein transport 177 7.3 12 2.5 38 101
Table 3. The structural dimension of the sub-ontologies. GO is a directed acyclic graph. The leaf
nodes are the nodes having no ingoing is-a arc in a graph. Depth relates to the length of is-a paths
in a graph. Breadth relates to the number of sibling nodes having the same distance from (one of)
root node in a graph.
TE TO TDS TC TL TP TT TDR TA TPL
Protein Transport 99.5% 8.6% 37.4% 16.4% 7.1% 4.6% 1.0% 0.3% 0.2% 0%
(581 terms) (578) (50) (159) (95) (41) (27) (6) (2) (1) (0)
Transport 92.6% 12.2% 19.3% 9.9% 5.7% 7.3% 1.9% 1.5% 1.8% 0.36%
(2235 terms) (2070) (272) (432) (221) (127) (164) (43) (34) (40) (8)
Table 4. The percentage of the GO terms that indicate the FEs (the number of GO
terms). FEs are Transport Entity (TE), Transport Origin (TO), Transport Destination (TDS),
Transport Condition (TC) are core FEs. Others are Transport Location (TL), Transport Path
(TP), Transport Transporter (TT),Transport Direction (TDR), Transport Attribute (TA), Trans-
port Place (TPL). The first 4 FEs are considered as core FEs.
Total TE TO TDS TC TL TP TT TDR TA TPL
955 786 200 320 501 112 92 46 4 69 31
Table 5. The number of sentences contain the FEs.
170
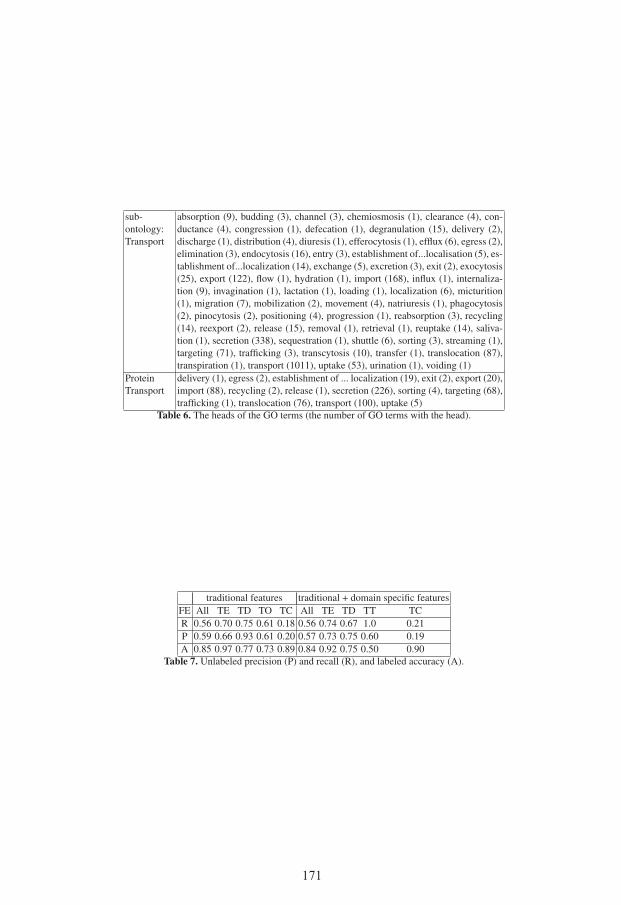
sub-
ontology:
Transport
absorption (9), budding (3), channel (3), chemiosmosis (1), clearance (4), con-
ductance (4), congression (1), defecation (1), degranulation (15), delivery (2),
discharge (1), distribution (4), diuresis (1), efferocytosis (1), efflux (6), egress (2),
elimination (3), endocytosis (16), entry (3), establishment of...localisation (5), es-
tablishment of...localization (14), exchange (5), excretion (3), exit (2), exocytosis
(25), export (122), flow (1), hydration (1), import (168), influx (1), internaliza-
tion (9), invagination (1), lactation (1), loading (1), localization (6), micturition
(1), migration (7), mobilization (2), movement (4), natriuresis (1), phagocytosis
(2), pinocytosis (2), positioning (4), progression (1), reabsorption (3), recycling
(14), reexport (2), release (15), removal (1), retrieval (1), reuptake (14), saliva-
tion (1), secretion (338), sequestration (1), shuttle (6), sorting (3), streaming (1),
targeting (71), trafficking (3), transcytosis (10), transfer (1), translocation (87),
transpiration (1), transport (1011), uptake (53), urination (1), voiding (1)
Protein
Transport
delivery (1), egress (2), establishment of ... localization (19), exit (2), export (20),
import (88), recycling (2), release (1), secretion (226), sorting (4), targeting (68),
trafficking (1), translocation (76), transport (100), uptake (5)
Table 6. The heads of the GO terms (the number of GO terms with the head).
traditional features traditional + domain specific features
FE All TE TD TO TC All TE TD TT TC
R 0.56 0.70 0.75 0.61 0.18 0.56 0.74 0.67 1.0 0.21
P 0.59 0.66 0.93 0.61 0.20 0.57 0.73 0.75 0.60 0.19
A 0.85 0.97 0.77 0.73 0.89 0.84 0.92 0.75 0.50 0.90
Table 7. Unlabeled precision (P) and recall (R), and labeled accuracy (A).
171

4 Semantic Role Labeling for Transport
In [18] we experiment with the chunking model for semantic role labeling using our
transport event corpus. We used the implementation of first-order chain conditional ran-
dom fields (CRF) to chunking applications from LingPipe (http://alias-i.com/lingpipe).
CRF for sequence labeling offer advantages over both generative models like HMMs
and classifiers applied at each sequence position [16]. For the purposes of our experi-
ments, 101 sentences were selected at random from the corpus and reserved as the test
set. The remaining 854 sentences were used to train machine learning models.
The SRL task can be viewed as a two step process in which boundaries are first
identified and then FEs are labeled. Therefore, we evaluated the system in unlabeled
precision and recall, and labeled accuracy. Unlabeled precision and recall are those
ignore the FE labels and only check that the boundaries of the FEs are correct. Precision
is the number of FEs whose boundaries the system identifies correctly divided by the
number of FEs the system proposes. Recall is the number of FEs whose boundaries
the system identifies correctly divided by the number of FEs that appear in manually
annotated data. Labeled accuracy gives, for the FEs whose boundaries were correctly
identified, the percent that were assigned the proper roles.
Table 7 presents unlabeled precision, recall and labeled accuracy values when the
model were trained using the traditional role labeling features, and the traditional fea-
tures together with domain specific features. The results show that the system has per-
formed better in identifying the type of the FEs, than for word chunking. The perfor-
mance varies greatly between different FEs. When the system was trained with the
traditional role labeling features, it performed best on the TE, TD and TO. When the
system was trained with the traditional features together with domain specific features,
it performed best on the TE, TO and TT. In both cases the system performed worst on
the TC. It also shows that the performance is not always improved for all FEs by intro-
ducing domain specific features. As a whole the system had similar performance when
it was trained with and without domain specific features.
5 Conclusion
In this chapter, we argue that ontologies, as a formal representation of domain knowl-
edge, can instruct us and ease all the tasks in building domain corpus annotated with
semantic roles. Furthermore, ontological domain knowledge leads to well-defined se-
mantics exposed on the corpus, which will be valuable in text mining applications. We
demonstrate our corpus for biological transport events built using GO. Then we report
on a word-chunking approach for identifying semantic roles of biomedical predicates
describing transport events. The results show that the model performance varies be-
tween different roles and the performance was not improved for all roles by introducing
domain specific features.
In future work, we aim to extend the corpus to cover other biological events. We
intend to develop an environment supporting corpus construction using ontological do-
main knowledge. We also intend to explore features based on full syntactic parses in
machine learning models.
172
Acknowledgements
Part of the research was made possible by the Centre for Industrial Information Tech-
nology (CENIIT). We thank Nirupama Benis, Rajaram Kaliyaperumal and Srikanth
Chowdari for previous cooperation on this subject.
References
1. Alan R. Aronson and Franois-Michel Lang. An overview of metamap: historical perspective
and recent advances. JAMIA, 17(3):229–236, 2010.
2. Steven Bethard, Zhiyong Lu, James H Martin, and Lawrence Hunter. Semantic role labeling
for protein transport predicates. BMC Bioinformatics, 9:277, 2008.
3. K. Bretonnel Cohen, Martha Palmer, and Lawrence Hunter. Nominalization and alternations
in biomedical language. PLoS ONE, 3(9), 2008.
4. Andrew Dolbey, Michael Ellsworth, and Jan Scheffczyk. Bioframenet: A domain-specific
framenet extension with links to biomedical ontologies. In Proceedings of KR-MED, pages
87–94, 2006.
5. Adress Doms and Michael Schroeder. Gopubmed: exploring pubmed with the gene ontology.
Nucleic Acids Research, 33:W783–786, 2005.
6. Charles J. Fillmore. Frames and the semantics of understanding. Quaderni di Semantica,
6(2):222–254, 1985.
7. Charles J. Fillmore, Charles Wooters, and Collin F. Baker. Building a large lexical databank
which provides deep semantics. In Proceedings of the PACLIC, 2001.
8. Kadri Hacioglu, Sameer Pradhan, Wayne Ward, James H. Martin, and Daniel Jurafsky. Se-
mantic role labeling by tagging syntactic chunks. In Proceedings of CoNLL 2004 SharedTask, pages 110–113, 2004.
9. Halil Kilicoglu, Marcelo Fiszman, Graciela Rosemblat, Sean Marimpietri, and Thomas C.
Rindflesch. Arguments of nominals in semantic interpretation of biomedical text. In Pro-ceedings of the 2010 Workshop on BioNLP, 2010.
10. Mitchell Marcus, Grace Kim, Mary Ann Marcinkiewicz, Robert MacIntyre, Ann Bies, Mark
Ferguson, Karen Katz, and Britta Schasberger. The penn treebank: annotating predicate
argument structure. In Proceedings of the Workshop on Human Language Technology, pages
110–115, 1994.
11. Alexa T. McCray, Allen C. Browne, and Olivier Bodenreider. The lexical properties of the
gene ontology. In Proceedings of AMIA Symposium, pages 504–508, 2002.
12. Philip V. Ogren, K. Bretonnel Cohen, and Lawrence Hunter. Implications of compositional-
ity in the gene ontology for its curation and usage. In Proceedings of PSB, pages 174–185,
2005.
13. Martha Palmer, Daniel Gildea, and Paul Kingsbury. The proposition bank: an annotated
corpus of semantic roles. Computational Linguistics, 31:71–105, 2005.
14. Josef Ruppenhofer, Michael Ellsworth, Miriam R. L. Petruck, Christopher R. Johnson, and
Jan Scheffczyk. FrameNet II: Extended theory and practice. Technical report, ICSI, 2005.
15. Peri L. Schuyler, William T. Hole, Mark S. Tuttle, and David D. Sherertz. The umls metathe-
saurus: representing different views of biomedical concepts. Bulletin of the Medical LibraryAssociation, 81(2):217–222, 1992.
16. Fei Sha and Fernando Pereira. Shallow parsing with conditional random fields. In Proceed-ings of NAACL HLT 2003, pages 134–141, 2003.
17. He Tan. A study on the relation between linguistics-oriented and domain-specific semantics.
In Proceedings of the 3rd International Workshop on SWAT4LS, 2010.
173
18. He Tan and Srikanth Chowdari. Semantic role labeling for biological transport. In AAAI2012 Fall Symposium on Information Retrieval and Knowledge Discovery in BiomedicalText, 2012. short paper.
19. He Tan, Rajaram Kaliyaperumal, and Nirupama Benis. Building frame-based corpus on the
basis of ontological domain knowledge. In Proceedings of the 2011 Workshop on BioNLP,
pages 74–82, 2011.
20. He Tan, Rajaram Kaliyaperumal, and Nirupama Benis. Ontology-driven construction of
corpus with frame semantics annotations. In CICLing 2012, Part I, LNCS 7181, pages 54–
65, 2012.
21. The Gene Ontology Consortium. Gene ontology: tool for the unification of biology. NatureGenetics, 25:25–29, 2000.
22. Richard Tzong-Han Tsai, Wen-Chi Chou, Ying-Shan Su, Yu-Chun Lin, Cheng-Lung Sung,
Hong-Jie Dai, Irene Tzu-Hsuan Yeh, Wei Ku, Ting-Yi Sung, and Wen-Lian Hsu. Biosmile:
adapting semantic role labeling for biomedical verbs: an exponential model coupled with
automatically generated template features. In Proceedings of the 2005 Workshop on BioNLP,
2006.
23. Tuangthong Wattarujeekrit, Parantu K Shah, and Nigel Collier. Pasbio: predicate-argument
structures for event extraction in molecular biology. BMC Bioinformatics, 5:155, 2004.
174
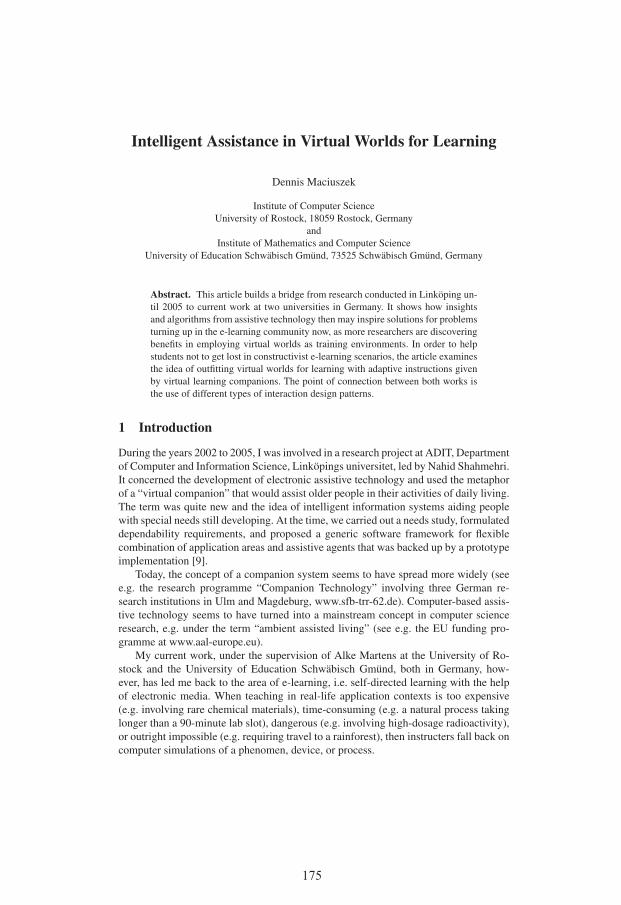
Intelligent Assistance in Virtual Worlds for Learning
Dennis Maciuszek
Institute of Computer Science
University of Rostock, 18059 Rostock, Germany
and
Institute of Mathematics and Computer Science
University of Education Schwabisch Gmund, 73525 Schwabisch Gmund, Germany
Abstract. This article builds a bridge from research conducted in Linkoping un-
til 2005 to current work at two universities in Germany. It shows how insights
and algorithms from assistive technology then may inspire solutions for problems
turning up in the e-learning community now, as more researchers are discovering
benefits in employing virtual worlds as training environments. In order to help
students not to get lost in constructivist e-learning scenarios, the article examines
the idea of outfitting virtual worlds for learning with adaptive instructions given
by virtual learning companions. The point of connection between both works is
the use of different types of interaction design patterns.
1 Introduction
During the years 2002 to 2005, I was involved in a research project at ADIT, Department
of Computer and Information Science, Linkopings universitet, led by Nahid Shahmehri.
It concerned the development of electronic assistive technology and used the metaphor
of a “virtual companion” that would assist older people in their activities of daily living.
The term was quite new and the idea of intelligent information systems aiding people
with special needs still developing. At the time, we carried out a needs study, formulated
dependability requirements, and proposed a generic software framework for flexible
combination of application areas and assistive agents that was backed up by a prototype
implementation [9].
Today, the concept of a companion system seems to have spread more widely (see
e.g. the research programme “Companion Technology” involving three German re-
search institutions in Ulm and Magdeburg, www.sfb-trr-62.de). Computer-based assis-
tive technology seems to have turned into a mainstream concept in computer science
research, e.g. under the term “ambient assisted living” (see e.g. the EU funding pro-
gramme at www.aal-europe.eu).
My current work, under the supervision of Alke Martens at the University of Ro-
stock and the University of Education Schwabisch Gmund, both in Germany, how-
ever, has led me back to the area of e-learning, i.e. self-directed learning with the help
of electronic media. When teaching in real-life application contexts is too expensive
(e.g. involving rare chemical materials), time-consuming (e.g. a natural process taking
longer than a 90-minute lab slot), dangerous (e.g. involving high-dosage radioactivity),
or outright impossible (e.g. requiring travel to a rainforest), then instructers fall back on
computer simulations of a phenomen, device, or process.
175
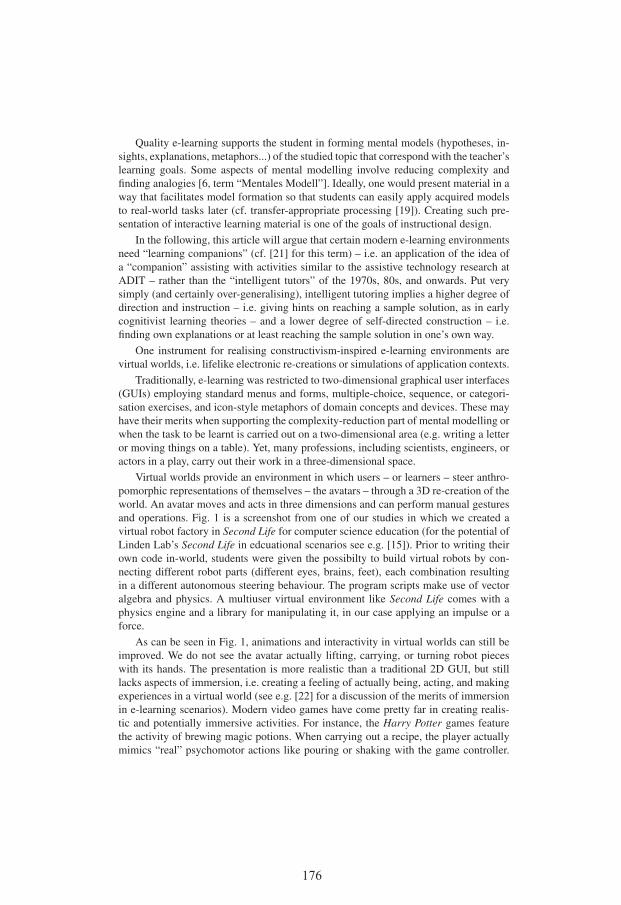
Quality e-learning supports the student in forming mental models (hypotheses, in-
sights, explanations, metaphors...) of the studied topic that correspond with the teacher’s
learning goals. Some aspects of mental modelling involve reducing complexity and
finding analogies [6, term “Mentales Modell”]. Ideally, one would present material in a
way that facilitates model formation so that students can easily apply acquired models
to real-world tasks later (cf. transfer-appropriate processing [19]). Creating such pre-
sentation of interactive learning material is one of the goals of instructional design.
In the following, this article will argue that certain modern e-learning environments
need “learning companions” (cf. [21] for this term) – i.e. an application of the idea of
a “companion” assisting with activities similar to the assistive technology research at
ADIT – rather than the “intelligent tutors” of the 1970s, 80s, and onwards. Put very
simply (and certainly over-generalising), intelligent tutoring implies a higher degree of
direction and instruction – i.e. giving hints on reaching a sample solution, as in early
cognitivist learning theories – and a lower degree of self-directed construction – i.e.
finding own explanations or at least reaching the sample solution in one’s own way.
One instrument for realising constructivism-inspired e-learning environments are
virtual worlds, i.e. lifelike electronic re-creations or simulations of application contexts.
Traditionally, e-learning was restricted to two-dimensional graphical user interfaces
(GUIs) employing standard menus and forms, multiple-choice, sequence, or categori-
sation exercises, and icon-style metaphors of domain concepts and devices. These may
have their merits when supporting the complexity-reduction part of mental modelling or
when the task to be learnt is carried out on a two-dimensional area (e.g. writing a letter
or moving things on a table). Yet, many professions, including scientists, engineers, or
actors in a play, carry out their work in a three-dimensional space.
Virtual worlds provide an environment in which users – or learners – steer anthro-
pomorphic representations of themselves – the avatars – through a 3D re-creation of the
world. An avatar moves and acts in three dimensions and can perform manual gestures
and operations. Fig. 1 is a screenshot from one of our studies in which we created a
virtual robot factory in Second Life for computer science education (for the potential of
Linden Lab’s Second Life in edcuational scenarios see e.g. [15]). Prior to writing their
own code in-world, students were given the possibilty to build virtual robots by con-
necting different robot parts (different eyes, brains, feet), each combination resulting
in a different autonomous steering behaviour. The program scripts make use of vector
algebra and physics. A multiuser virtual environment like Second Life comes with a
physics engine and a library for manipulating it, in our case applying an impulse or a
force.
As can be seen in Fig. 1, animations and interactivity in virtual worlds can still be
improved. We do not see the avatar actually lifting, carrying, or turning robot pieces
with its hands. The presentation is more realistic than a traditional 2D GUI, but still
lacks aspects of immersion, i.e. creating a feeling of actually being, acting, and making
experiences in a virtual world (see e.g. [22] for a discussion of the merits of immersion
in e-learning scenarios). Modern video games have come pretty far in creating realis-
tic and potentially immersive activities. For instance, the Harry Potter games feature
the activity of brewing magic potions. When carrying out a recipe, the player actually
mimics “real” psychomotor actions like pouring or shaking with the game controller.
176

Fig. 1. Virtual robot factory.
The Desperate Housewives game includes activities like cooking or gardening in which
cognitive scripts must be followed.
An obvious hypothesis is that virtual world activities with such a degree of authen-
ticity support the mental modelling aspect of forming analogies better than a 2D GUI
would. Consequently, they would foster transfer of acquired knowledge to real-world
situations in a better way. In fact, I gained first indications supporting the claim that by
using 3D and increased movement, transfer should be better, through a small-scale ex-
periment with university students in Rostock. Group 1 was given static instructions for
building a Lego model and a 2D drag-and-drop interface for practicing the steps. Group
2 was given instructions which they could navigate in three dimensions and an interac-
tive CAD (computer-aided design) tool for moving and placing Lego bricks (both via
the Lego Digital Designer software). After the training phase, each group had to build
the Lego construction in real-life. Group 2 was considerably faster (1:50 against 4:15
min) and produced fewer mistakes (1 against 5). Trying the task once more with a single
person who received the 3D training resulted in a performance similar to Group 2 (2:07
min, no mistakes; details on this experiment were presented in [10]).
To sum up, virtual worlds have a great potential of improving the quality of e-
learning. In my work in Rostock and Schwabisch Gmund, I examine how to design
effective virtual worlds for learning. Section 2 introduces the design pattern approach
applied, but concludes that virtual worlds alone will not result in the best learning out-
come. Even if there is no teacher present, there must be some kind of assistance. Section
3 points out that the patterns of assistive interaction identified during the Virtual Com-
panion project in Linkoping provide one type of suitable intelligent assistance. Section
4 raises the question of how this may be implemented in the current project.
2 Design of Virtual Worlds for Learning
When attending e-learning conferences, I often have the impression that people present
many interesting, but rather isolated projects. There seems to be too little underlying
177
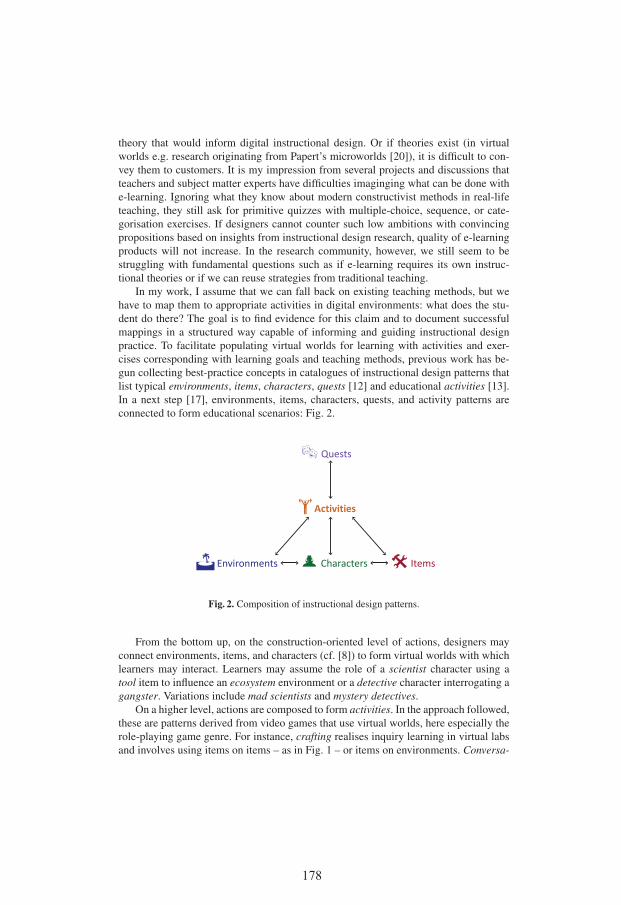
theory that would inform digital instructional design. Or if theories exist (in virtual
worlds e.g. research originating from Papert’s microworlds [20]), it is difficult to con-
vey them to customers. It is my impression from several projects and discussions that
teachers and subject matter experts have difficulties imaginging what can be done with
e-learning. Ignoring what they know about modern constructivist methods in real-life
teaching, they still ask for primitive quizzes with multiple-choice, sequence, or cate-
gorisation exercises. If designers cannot counter such low ambitions with convincing
propositions based on insights from instructional design research, quality of e-learning
products will not increase. In the research community, however, we still seem to be
struggling with fundamental questions such as if e-learning requires its own instruc-
tional theories or if we can reuse strategies from traditional teaching.
In my work, I assume that we can fall back on existing teaching methods, but we
have to map them to appropriate activities in digital environments: what does the stu-
dent do there? The goal is to find evidence for this claim and to document successful
mappings in a structured way capable of informing and guiding instructional design
practice. To facilitate populating virtual worlds for learning with activities and exer-
cises corresponding with learning goals and teaching methods, previous work has be-
gun collecting best-practice concepts in catalogues of instructional design patterns that
list typical environments, items, characters, quests [12] and educational activities [13].
In a next step [17], environments, items, characters, quests, and activity patterns are
connected to form educational scenarios: Fig. 2.
Quests
Activities
Environments Characters Items
Fig. 2. Composition of instructional design patterns.
From the bottom up, on the construction-oriented level of actions, designers may
connect environments, items, and characters (cf. [8]) to form virtual worlds with which
learners may interact. Learners may assume the role of a scientist character using a
tool item to influence an ecosystem environment or a detective character interrogating a
gangster. Variations include mad scientists and mystery detectives.
On a higher level, actions are composed to form activities. In the approach followed,
these are patterns derived from video games that use virtual worlds, here especially the
role-playing game genre. For instance, crafting realises inquiry learning in virtual labs
and involves using items on items – as in Fig. 1 – or items on environments. Conversa-
178

tions – when supplemented with in-game journals as in the Global Conflicts educational
games – may realise interpretative writing within a virtual theatre in literature class.
Conversations involve dialogues between the player character and non-player charac-
ters.
On the highest, instruction-oriented level, a quest pattern, e.g. a whodunit story,
connects activities. One of the interactive scenarios currently under development is
connected to a learning module within the EU-funded project South Baltic WebLab(www.southbalticweblab.eu, within the EU’s South Baltic Programme), which is di-
rected in raising an interest in marine scienes as a career option among students aged
15 to 18. The player takes the role of a scientist investigating over-fertilisation of the sea
by using the crafting activity within an ecosystem environment. The interactive story
frame will include a detective’s whodunit quest: who caused the ecological disaster?
It will be based on the conversation activity pattern (conversations with suspects and
witnesses).
Additional patterns include typical puzzles [3], which help connect quests with ac-
tivities, recipes – typical action sequences obtained during requirements analysis with
experts or by cognitive task analysis (see Section 3), and a distinction between micro-and macro-level quests.
Three studies currently examine the design of virtual worlds for aspects of artificial
intelligence, marine sciences, and interpretation of classic literature. Evaluations with
students will give indications on whether proposed mappings of teaching methods to
virtual world activities have succeeded in providing realistic environments suited for
raising an interest in real-life programming, scientific field work, and theatre plays.
Yet, e-learning intends to achieve more than creating inspiring environments. Stu-
dents are supposed to learn concepts and methods related to the domain of study. Our
marine science project aims at conveying how scientists plan, conduct, and evaluate
experiments. Mapping the inquiry learning method (also known as discovery learning)
to the crafting activity, we have students perform their own experiments in the virtual
world. While they are given certain structuring tasks, they have to decide themselves
e.g. at which points in time to sample water from which depths, and what analysis to
run on the sample.
This is difficult. In a literature review of discovery learning, de Jong and van Joolin-
gen [5] cite a range of empirical studies that have identified difficulties students have
with hypothesis generation, design of experiments, interpretation of data, and regula-
tion of discovery learning. The authors also discuss a number of counter-measures, yet
with fewer empirical evidence than for the problems.
Testing a first prototype of the Flash-based marine science experiment backs up
the reports that experimentation in open-ended, simulated worlds is difficult. The stu-
dents (10 participants) were able to complete single tasks. Some were easier, in others
comparison of measurements was difficult. Yet, nobody put together their results in a
sketched model, which was the final goal of the lesson. As it seems, students were left
alone with this constructivist exercise where they would have needed more instructional
guidance. If no human teacher is present, an intelligent tutor or learning companion may
help. The following section will discuss one approach towards this (for further strategies
under examination see [18]).
179

3 Assisting Learning Activities in Virtual Worlds
Traditional Intelligent Tutoring Systems (ITSs) that have been under development since
the 1970s have employed a cognitivist view of learning. Some select traditional e-
learning exercises that suit the individual learner’s knowledge and help him or her
reach a sample solution by providing intelligent feedback on entered answers. Even
game-based ITSs today tend to stick to traditional exercises such as quizzes [14, pages
665–666]. More advanced classic ITSs assist in mental reasoning processes, even in
rather open-ended activities such as programming (e.g. [2]).
When designing virtual tutors to aid in the difficult task of experimenting in a
constructivism-inspired interactive simulation, developers can learn from the afore-
mentioned researchers’ use of cognitive models. Today, inquiry learning tutors are being
developed [23, Section 8.2]. However, inquiry learning tutors for 3D virtual worlds with
authentic activities and vast amounts of freedom are still scarce.
The idea in this proposition is to treat virtual worlds as approximations of real life,
i.e. virtual realities as approximations of reality. The designer of a virtual world may not
have foreseen and modelled all possible solutions of a work task. That is, the tutor must
be able recognise types of situations and come up with situated advice, similar to a real-
life human coach. Such coaches include teachers at school or university – or assistants
helping people carry out everyday activities. The e-learning developer may therefore
find inspiration in ambient assisted living research. The Virtual Companion project at
Linkopings universitet developed intelligent agents – virtual caregivers – intended to
assist older people in different application areas, e.g. instrumental activities of daily
living (IADLs). In the prototype implementation, IADLs were understood as collections
of tasks. Tasks were processes modelled as Petri nets.
Through qualitative empirical studies, the project had identified 18 patterns of as-
sistive interaction, so-called functions, each of which could be applied to different ap-
plication areas. The patterns were: monitor, locator, mediator, operator, guide, recom-mender, informer, trainer, supplier of activities, communicator, reminder, rememberer,
listener, speaking/writing aid, hearing/reading aid, reinforcer, participator in activi-ties, and supplier of objects [11]. A typical instance of an IADL application area was
food preparation. A typical task to be supported, e.g. by a trainer (in advance) or a guide
(live, while it happens), was the preparation of a recipe: Fig. 3.
If a constructivism-inspired e-learning setting features a simulated, lifelike virtual
world in which the student can perform detailed actions via an avatar, it should then be
possible to use cognitive modelling like in assistive technology for real-life activities
(e.g. [4]) in the virtual case as well. The idea is to apply a cognitive-engineering ap-
proach to game activity [24] and virtual world design. A cognitive task analysis decom-
poses activities – at this point the crafting pattern – into formal models. Discrete-time
models define sequences of learner actions that might lead toward or away from gaining
insights in the simulated environment.
Implicitly, one can find similar task models in virtual game worlds. Computer role-
playing games including crafting allow the player to find recipes, e.g. for brewing magic
potions. For instance, one recipe in the commercial game Drakensang (Radon Labs /
dtp 2008) reads like this: “The Oneberry Juice recipe teaches the user to make a popular
healing potion. To do this, you must press the juice out of the blue berries of the four-
180

Fig. 3. Virtual companion recipe (modelled with Petri Net Kernel).
leafed Oneberry and boil this up at an alchemist’s workbench. The juice relieves pain
and bleeding and can, in the correct dosage, result in complete healing. Ingredients: 10
Oneberry, 2 Spring water.” We can decompose the description from Drakensang in the
same way as the food recipe (which was taken from a pudding bag in the supermarket):
Fig. 4.
Petri net places (= states; circles) indicate certain situations. Transitions (squares)
indicate actions that progress the sequence from one situation to the next. Moreover,
in the example pouring water and pressing berries may happen concurrently. A place
may be complemented with a textual description of the situation. A transition may be
complemented with a textual description and an explanation – e.g. a non-player char-
acter demonstrating the action – and required competence or skill (in the example, the
action ‘mix’ requires the competence items ‘pour’ and ‘mix’). The process starts with
the token in ‘recipe’. When the user performs an anticipated action, the corresponding
transition fires, and passes on the token.
181
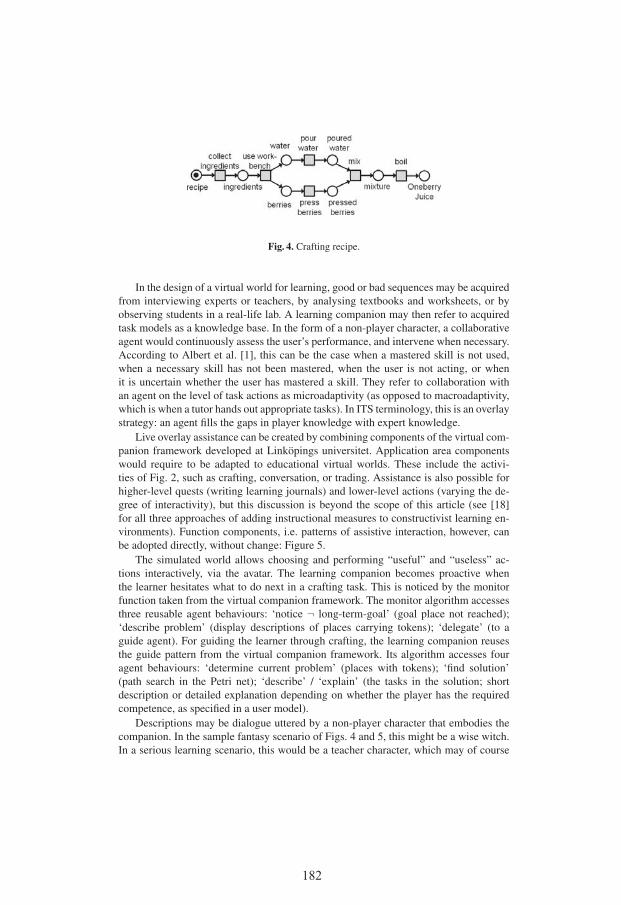
Fig. 4. Crafting recipe.
In the design of a virtual world for learning, good or bad sequences may be acquired
from interviewing experts or teachers, by analysing textbooks and worksheets, or by
observing students in a real-life lab. A learning companion may then refer to acquired
task models as a knowledge base. In the form of a non-player character, a collaborative
agent would continuously assess the user’s performance, and intervene when necessary.
According to Albert et al. [1], this can be the case when a mastered skill is not used,
when a necessary skill has not been mastered, when the user is not acting, or when
it is uncertain whether the user has mastered a skill. They refer to collaboration with
an agent on the level of task actions as microadaptivity (as opposed to macroadaptivity,
which is when a tutor hands out appropriate tasks). In ITS terminology, this is an overlay
strategy: an agent fills the gaps in player knowledge with expert knowledge.
Live overlay assistance can be created by combining components of the virtual com-
panion framework developed at Linkopings universitet. Application area components
would require to be adapted to educational virtual worlds. These include the activi-
ties of Fig. 2, such as crafting, conversation, or trading. Assistance is also possible for
higher-level quests (writing learning journals) and lower-level actions (varying the de-
gree of interactivity), but this discussion is beyond the scope of this article (see [18]
for all three approaches of adding instructional measures to constructivist learning en-
vironments). Function components, i.e. patterns of assistive interaction, however, can
be adopted directly, without change: Figure 5.
The simulated world allows choosing and performing “useful” and “useless” ac-
tions interactively, via the avatar. The learning companion becomes proactive when
the learner hesitates what to do next in a crafting task. This is noticed by the monitor
function taken from the virtual companion framework. The monitor algorithm accesses
three reusable agent behaviours: ‘notice ¬ long-term-goal’ (goal place not reached);
‘describe problem’ (display descriptions of places carrying tokens); ‘delegate’ (to a
guide agent). For guiding the learner through crafting, the learning companion reuses
the guide pattern from the virtual companion framework. Its algorithm accesses four
agent behaviours: ‘determine current problem’ (places with tokens); ‘find solution’
(path search in the Petri net); ‘describe’ / ‘explain’ (the tasks in the solution; short
description or detailed explanation depending on whether the player has the required
competence, as specified in a user model).
Descriptions may be dialogue uttered by a non-player character that embodies the
companion. In the sample fantasy scenario of Figs. 4 and 5, this might be a wise witch.
In a serious learning scenario, this would be a teacher character, which may of course
182

collect ingredients (gather)
recipe
use workbench (begin, decide)
pour water (measure, pour)
press berries (measure, press)
mix (pour, mix)
boil (cook)
ingredients
berries water
poured water
pressed berries
mixture
Oneberry Juice
Fig. 5. Learning companion using virtual companion components (recipe from Fig. 4).
also be a fantasy-style person, if it fits the world design or game story. Already in the
Virtual Companion project, two students had developed a 3D animated character as a
visualisation of a cooking companion. The cartoon chef was able to demonstrate manual
operations and was interactive to a certain degree [7].
4 Future Work
The screenshots in Figure 5 are still half implemented, half mock-up. Transferring code
from one Java framework to another (the Java-based Intelligent Tutoring framework de-
veloped at the University of Rostock [16]) turned out to be rather cumbersome, although
the concepts have aged well and the code is well documented. Maybe, implementing
user interfaces directly in Java is just not up-to-date anymore. We have previously con-
183
nected our Java framework to Second Life and to Adobe Flash, both of which should
be better-suited for an efficient implementation of virtual worlds. Should we make the
effort of integrating the old Java code, or should we re-implement the algorithms? Java
is still promising, when it comes to simulating task models, as libraries for different
formalisms are readily available.
Anyhow, future work will evaluate the combined monitor-guide functionality in the
context of an e-learning scenario. It will be interesting to see whether the old compan-
ion strategies can improve the marine science prototype and help the young scientists
structure their virtual experiments more easily.
References
1. Dietrich Albert, Cord Hockemeyer, and Michael D. Kickmeier-Rust. Microadaptivity within
complex learning situations – a personalized approach based on competence structures and
problem spaces. In Proceedings of the 15th International Conference on Computers in Edu-cation (ICCE 2007), Hiroshima, November 2007.
2. John R. Anderson and Brian J. Reiser. The Lisp Tutor. Byte, 10:159–175, 1985.
3. Bob Bates. Game Design. Thomson Course Technology, Boston, MA, second edition, 2004.
4. Belkacem Chikhaoui and Helene Pigot. Evaluation of a contextual assistant interface using
cognitive models. In Proceedings of the 5th International Conference on Human ComputerInteraction (ICHCI 2008), pages 36–43, Venice, October 2008.
5. Ton de Jong and Wouter R. van Joolingen. Scientific discovery learning with computer
simulations of conceptual domains. Review of Educational Research, 68(2):179–201, 1998.
6. Hartmut Hacker and Kurt-Hermann Stapf, editors. Dorsch Psychologisches Worterbuch.
Hans Huber, Bern, 1998.
7. Jean-Marie Housseau and Jean-Christophe Mesmin. Virtual Kitchen Companion – Creating
an Interactive 3D Character. Master’s thesis, Linkopings universitet, Sweden, 2002.
8. Jeff Howard. Quests: Design, Theory, and History in Games and Narratives. A K Peters,
Wellesley, MA, 2008.
9. Dennis Maciuszek. Towards Dependable Virtual Companions for Later Life. Licentiate’s
thesis, Linkopings universitet, Sweden, 2005.
10. Dennis Maciuszek. Transfer durch Transport? Virtuelle Welten als Mittler zwischen men-
talen Modellen und motorischen Handlungen. In Interdisziplinare Tagung “Beweggrunde –zur Interdependenz physischer und psychischer Bewegung”, Rostock, November 2011. Un-
published talk.
11. Dennis Maciuszek, Johan Aberg, and Nahid Shahmehri. What help do older people need?
Constructing a functional design space of electronic assistive technology applications. In
Proceedings of ASSETS 2005 - The Seventh International ACM SIGACCESS Conference onComputers and Accessibility, pages 4–11, Baltimore, MD, October 2005. ACM.
12. Dennis Maciuszek, Sebastian Ladhoff, and Alke Martens. Content design patterns for Game-
based Learning. International Journal of Game-based Learning, 1(3):65–82, 2011.
13. Dennis Maciuszek and Alke Martens. Computer role-playing games as an educational game
genre: Activities and reflection. In Dimitris Gouscos and Michalis Meimaris, editors, Pro-ceedings of the 5th International Conference on Games-Based Learning (ECGBL 2011),pages 368–377, Reading, October 2011. Academic Publishing.
14. Dennis Maciuszek and Alke Martens. A reference architecture for game-based intelligent tu-
toring. In Patrick Felicia, editor, Handbook of Research on Improving Learning and Motiva-tion through Educational Games: Multidisciplinary Approaches, chapter 31, pages 658–682.
IGI Global, Hershey, PA, 2011.
184
15. Dennis Maciuszek, Alke Martens, Ulrike Lucke, Raphael Zender, and Thomas Keil. Second
Life as a virtual lab environment. In Andreas Hebbel-Seeger, Torsten Reiners, and Dennis
Schaffer, editors, Synthetic Worlds: Emerging Technologies in Education and Economics.
Springer, Berlin/Heidelberg, 2013. To appear.
16. Dennis Maciuszek, Geraldine Ruddeck, and Alke Martens. Component-based development
of educational games: The case of the user interface. In Bente Meyer, editor, Proceedingsof the 4th European Conference on Games-Based Learning (ECGBL 2010), pages 208–217,
Reading, October 2010. Academic Publishing.
17. Dennis Maciuszek, Martina Weicht, and Alke Martens. Composing game-based learning
scenarios by connecting instructional design patterns. In Patrick Felicia, editor, Game-BasedLearning: Opportunities and Challenges. Cambridge Scholars Publishing, Newcastle, 2013.
To appear.
18. Alke Martens and Dennis Maciuszek. Balancing instruction and construction in virtual world
learning. In Klaus Bredl and Wolfgang Bosche, editors, Serious Games and Virtual Worldsin Education, Professional Development, and Healthcare. IGI Global, Hershey, PA, 2013.
To appear.
19. C. Donald Morris, John D. Bransford, and Jeffrey J. Franks. Levels of processing versus
transfer appropriate processing. Journal of Verbal Learning and Verbal Behavior, 16(5):519–
533, 1977.
20. Seymour Papert. Mindstorms. Children, Computer and Powerful Ideas. Basic Books, New
York, NY, 1980.
21. Eva L. Ragnemalm. Student Modelling based on Collaborative Dialogue with a LearningCompanion. Dissertation, Linkopings universitet, Sweden, 1999.
22. Alexander Tausch, Dennis Maciuszek, and Alke Martens. Immersive Didactics in Game-
based Learning: The Geo-Speed case study. In Sybille Hambach, Alke Martens, and Bodo
Urban, editors, eLearning Baltics 2011. Proceedings of the 4th International eLBa ScienceConference, pages 123–132, Stuttgart, May 2011. Fraunhofer.
23. Beverly Park Woolf. Building Intelligent Interactive Tutors: Student-Centered Strategies forRevolutionizing E-Learning. Morgan Kaufmann, Burlington, MA, 2009.
24. Pieter Wouters, Herre van Oostendorp, and Erik D. van der Spek. Game design: The mapping
of cognitive task analysis and game discourse analysis in creating effective and entertaining
serious games. In Mark Neerincx and Willem-Paul Brinkman, editors, Proceedings of the28th Annual European Conference on Cognitive Ergonomics (ECCE 2010), pages 287–293,
New York, NY, September 2010. ACM.
185

186

IISLAB, Nahid and Me
Lin Han
Technology Risk Management & Information SecurityTD Bank Financial Group
Toronto, OntarioCanada, M5K 1A2
IISLAB1 and Nahid mean a lot in my knowledge, my career, and most importantlymy life.
The 1990’s witnessed fast technological advances in the information technology,wide-spread recognition of using computers in information processing and commu-nication, and the rapid growth of the Internet. Having been working in a US baseddatabase company (Sybase) for several years, I felt I had to recharge myself with newtechnologies.
It was in the summer of 1998 when I first met Nahid. I was interviewed for a PhDstudent position in IISLAB, Linkping University. ”She is smart and insightful.” I toldmyself.
My career was completely changed because of Nahid. My original intent was to divedeeper in the database area. However, Nahid opened a new door for me to the Internetera - Internet Security.
This was a totally new area to me. Every topic was very attractive access con-trol, cryptography, telecommunication, computer networks, software development, etc.During the learning process, sometimes I was joyful, sometimes I was surprised, andsometimes I was confused. But all the time I felt being challenged. Thanks to IISLABand Nahid, I learned so much that I have been benefiting from since then.
I spent the most beautiful three years of my life in IISLAB, not only because I havegained lots of knowledge, but also because I have learned how to build relationshipsand how to network with people.
In IISLAB, I met Cecile, a wonderful French girl. We chatted together, we laughedtogether, we shared our little secrets, and we enjoyed each others beautiful accents. Ourfriendship lasts forever.
Patrick is an amazing gentleman. He has a peaceful mind. No matter how upsetI was, I could easily calm down in front of him. Patrick was my special informationresource. He taught me Swedish culture, European religions, western traditions ... Icould not believe how knowledgeable he is!
Nahid, my supervisor and mentor, was always incredibly resourceful. One day whenwe were having a casual conversation, Nahid asked me whether I knew why she alwayshad a better chance to get budget approved. Why? I asked. Because I put myself in theaudience’s shoes to think about what I wrote. I did not completely understand this until10 years later when I worked as a senior information security consultant and technologyrisk manager in the second largest bank in Canada.
1 The ADIT division was created from two research laboratories of which IISLAB was one.
187

In October 2001, I received my Licentiate of Engineering degree and decided to goto industry to practise what I had learned. I came to Canada. I moved in a bad timefrom the job market perspective. 2001 was a very tough year for IT people due to theeconomic downturn. With huge availability of resources in the job market, employersimposed rigorous rules on the candidates. North American working experiences becamea top priority, which made me uncompetitive as I just stepped out of university. How-ever, my solid background in the information security area and working experiences inIISLAB successfully convinced the interviewers that I was the best candidate for thesecurity analyst position in a bank. In December 2001, I accepted the offer and joinedBank of Montreal Financial Group as a Senior Security Analyst, starting my industrycareer in the information security.
In the following four and a half years, I was so fortunate that I had chances to workin the every security operations areas in the Bank enterprise vulnerability manage-ment, incident handling, intrusion detection, and virus and spyware remediation. Mysecurity knowledge continued to grow. I received SANS Security Essentials Certifica-tion (GSEC) in October 2002, and became a GIAC Certified Incident Handling Analyst(GCIH) in July 2003, Certified Information Systems Security Professional (CISSP) inJanuary 2004, GIAC Certified Intrusion Analyst (GCIA) in January 2005, InformationSystems Security Architecture Professional (ISSAP) in February 2005, and CertifiedInformation System Auditor (CISA) in September 2005. All the time, I see these as theoutgrowth of my study and working experiences in IISLAB.
In mid 2006, I decided to switch my career from security operations to securitymanagement. I became a Compliance officer, developed and managed the informationSecurity Management System (ISMS) within the Information Security Operations De-partment in Bank of Montreal. The ISMS was ISO 27001 certified in January 2007.Bank of Montreal is the first bank in Canada that received ISO 27001 certification.In May 2007, I became Certified Information Security Manager (CISM). I passed theCISM exam with flying colours I was the highest scorer in ISACA Toronto Chapter.
I joined Ontario e-Health, a provincial government agency in October 2007, as a Se-nior Operations Specialist. I was Certified in the Governance of Enterprise IT (CGEIT)in April 2009, and Certified in Risk and Information Systems Control (CRISC) inNovember 2012.
I returned to finance institute in June 2011. Now I am a senior information secu-rity consultant and technology risk manager in TD Bank Financial Group, providingtechnology risk management and information security consulting and advisory servicesto the projects in Online Channel of the bank. When negotiating with the business orvendor to get security requirements bought in, I finally understood what Nahid meantby thinking in the audience’s shoes. Because of the piece of advice I received 10 yearsago, I did have a good chance to succeed.
Looking back at the path I took to become what I am today, I feel I am really luckyto meet Nahid and have the opportunity to study and do research in IISLAB.
On this special occasion, I would like to express my sincere gratitude to Nahid, mysupervisor, my mentor and my career model.
188